kenya consumer protection survey
TRANSCRIPT

Kenya Consumer Protection in Digital Finance SurveyMarch 2021
Innovations for Poverty Action Competition Authority of Kenya
Associated survey dataset available here: https://doi.org/10.7910/DVN/F8ZRPF
William Blackmon (Innovations for Poverty Action)Rafe Mazer (Innovations for Poverty Action)Shana Warren (Innovations for Poverty Action)

Four-year program to support policymakers, financial service providers, and civil society to develop and test consumer protection solutions in four emerging markets: Bangladesh, Kenya, Nigeria, and Uganda.
This report presents results from a survey of digital finance users in Kenya.
IPA Consumer Protection Research Initiative
2

IPA has collaborated with the Competition Authority of Kenya to conduct a survey on key themes in consumer protection, including:
• Fraud and loss of money
• Complaints handling and redress
• Pricing transparency and consumer choice
• Borrowing behavior
Survey responses identify which issues may be of greater or less concern, to inform future policy actions.
Reports from similar surveys conducted in Nigeria and Uganda allow for comparison across countries.
Understanding the challenges Kenyan consumers face with digital finance
33

05: Methodology
06–12: Respondent Profile
13–19: Access and Usage
20–33: Challenges
34–38: Financial Stress
39–48: Competition and Choice
49–52: Transparency and Knowledge
53–57: Redress Process
58: Policy Takeaways
Contents
4
Ph
oto
by: Tu
ge
la R
idle
y

Random-digit dial (RDD) phone survey of digital financial service users
Sampling frame:
• All possible mobile numbers following the Kenyan mobile phone number allocation system that were active within Kenya when the RDD samples was generated on September 10, 2020.
• Survey limited to adult mobile money, mobile banking and/or mobile loan consumers through filters at the start of the survey. No further filtering occurred during the survey. Respondents were made aware of the survey’s purpose during the consent process.
Sample size: 793
Conducted: September 14 – October 18, 2020
Methodology
5
Ph
oto
by: W
ill Bo
ase

• Respondent sample more male, younger, wealthier, and better educated than Kenya's overall adult population.
• Some of this is due to filtering for digital financial service users, and some is due to the constraints of random digit dialing.
• Individuals who do not have phones or reside within coverage areas are more likely to be older and more poor, but they are also less likely to use digital financial services.
Respondent profile
6

Province Survey Census
Rift Valley 23% 25%
Nairobi 19% 11%
Eastern 14% 15%
Central 14% 13%
Nyanza 11% 12%
Western 9% 10%
Coast 9% 9%
North Eastern 1% 4%
TOTAL 100% 100%
Because surveys were conducted by phone, respondents’ urban/rural status was estimated based on the population density of the constituency in which respondents reported residing. A cutoff of 600 individuals/km2 was selected so that the urban population approximately matched the World Bank urban population estimate for 2009, the latest year where constituency-level population statistics are available. Because of changes in constituencies between 2009 and today, we were able to generate an urban indicator for 71% of respondents. Approximately 36% of respondents were categorized as residing in urban areas using this method (compared with 23% of the population according to the World Bank 2009 estimate).
GeographyRespondent profile
7
FORMER PROVINCES COUNTIESURBAN/RURAL ESTIMATION

Gender, age, and educationRespondent profile
8
Afrobarometer is non-partisan, pan-African research institution conducting public attitude surveys on democracy, governance, the economy and society in 30+ countries repeated on a regular cycle.
Sources: Afrobarometer: https://www.afrobarometer.org/data/kenya-round-8-data-2019; Census: https://www.knbs.or.ke/?p=5621
Male
59%
Female
41%
Gender (n=793)
0%
10%
20%
30%
40%
50%
60%
18-24 25-44 45-64 65+
Age (n=793)
Consumer Survey 2019 Census
0%
10%
20%
30%
40%
50%
60%
Primary Secondary Tertiary
Education (n=792)
Consumer Survey 2019 Afrobarometer

Economic backgroundRespondent profile
9
0% 5% 10% 15% 20% 25%
Less than 2,000
2,001–4,000
4,001–8,000
8,001–14,000
14,001–20,000
20,001–30,000
30,001–40,000
40,001–50,000
50,001–60,000
60,001–80,000
More than 80,000
No response
Monthly income (KES) (n=758)
No
72%
Yes
28%
Household member with formal employment
(n=791)

The Poverty Probability Index (PPI) is a poverty measurement tool provided by Innovations for Poverty Action. The PPI uses machine learning techniques to estimate households’ poverty likelihood based on 10 questions. Households are assigned a poverty likelihood between 0-100%. Kenya’s PPI is built from the 2015/2016 Kenya Integrated Household Budget Survey.
Poverty probabilityRespondent profile
10
https://www.povertyindex.org/about-ppi
0%
2%
4%
6%
8%
10%
12%
14%
16%
18%
20%
0 20 40 60
Poverty Likelihood (%)
Poverty Probability Index (PPI) (n=764)

0%
2%
4%
6%
8%
10%
12%
14%
16%
18%
20%
0 20 40 60
Poverty Likelihood (%)
Poverty Probability Index (PPI) (n=764)PPI scores are used to split the sample into three equally sized groups representing relatively low, middle, and high poverty probabilities. Later sections disaggregate results using these groups.
Poverty probabilityRespondent profile
11
Lower poverty: 0–7% poverty likelihood
Middle poverty: 7–18% poverty likelihood
Higher poverty: 18–100% poverty likelihood
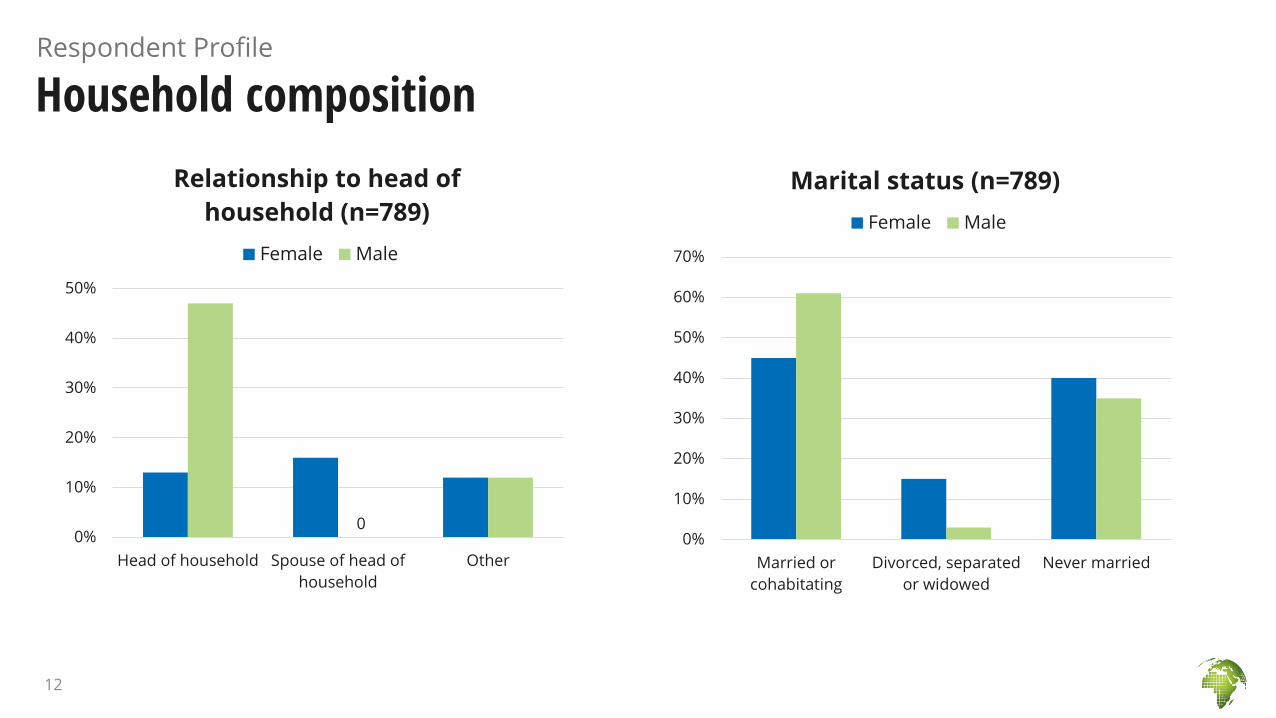
Household compositionRespondent Profile
12
0%
10%
20%
30%
40%
50%
Head of household Spouse of head of
household
Other
Relationship to head of
household (n=789)
Female Male
0%
10%
20%
30%
40%
50%
60%
70%
Married or
cohabitating
Divorced, separated
or widowed
Never married
Marital status (n=789)
Female Male
0

• Kenya is a global leader in DFS usage with 79% of adults using mobile money in 2019, and a sharp increase in digital credit usage in recent years. (Source: Kenya FinAccess Survey, 2019)
• Survey respondents’ reported usage patterns demonstrate that access has been concentrated almost exclusively on the M-Pesa platform in mobile money, and that this impacts their choice of digital credit providers.
• Most use of digital loans is concentrated in hands of a small set of lenders, despite an estimated 100+ digital lenders active in Kenya prior to the COVID-19 pandemic.
13
Access and usage of digital financial services

Phone ownershipAccess and Usage
14 Note: Data exclude respondents who have not used DFS
Own
phone, do
not share
88%
Share with
spouse
12%
0%
20%
40%
60%
80%
100%
Phone sharing (n=793)
Smart
phone
81%
Basic/feature
phone
19%
Phone type (n=792)

Digital financial service usage, by service typeAccess and Usage
15 Notes: n=793; Data exclude respondents who have not used DFS in the last 90 days.
99%
92%
27%
19%
1%
2%
27%
16%
6%
46%
65%
Mobile money
DFS agent
Mobile loan
Mobile banking
In the last 90 days More than 90 days ago Never
99%of respondents have ever
used mobile money
54%of respondents have
ever used mobile loans
35%of respondents have ever
used mobile banking
94%of respondents have ever
used a DFS agent

Mobile money providers used by respondentsAccess and Usage
16
0%
25%
50%
75%
100%
M-Pesa Airtel Money Equitel Telkom T-Kash
Ever used
Used in the last 90 days
0
n=789
Nearly all survey respondents using mobile money do so via M-Pesa. While users have accessed competitors very few have done so recently.
M-Pesa faces little competition in practice.

0% 10% 20% 30% 40% 50% 60% 70%
All others
Branch
Tala
KCB M-Pesa
Fuliza
M-Shwari
Percent of respondents who have ever used digital
credit
Mobile loan providersAccess and Usage
17
Top 3 loan products
all linked with M-Pesa
Providers ever used
0% 10% 20% 30% 40% 50%
All others
KCB M-Pesa
M-Shwari
Fuliza
Percent of active digital credit users
Provider used most often in the last 90 days

Mobile loan usesAccess and Usage
18
0% 10% 20% 30% 40% 50%
Household expenses
Business expenses
Emergencies
Personal expense
Agriculture
Pay other loans
School fees
Saving money
Other
57%Percentage of
respondents who use mobile loans for household or
personal expenses
23%use mobile loans for business or
agriculture expenses
17%use mobile loans for emergenciesN=216

Mobile banking providersAccess and Usage
0% 4% 8% 12% 16% 20%
Equity Bank
KCB Bank
Coop Bank
All others
Ever used (n=280)
Used most often in last 90 days (n=140)
Percent of all respondents
19
The survey asked consumers about a set of common DFS challenges, to understand how many consumers may experience these issues across two periods:
• Any challenges experienced since January 2020
• The most significant challenge ever experienced—to not miss any issues which may have caused substantial difficulty or harm in the past.
Men, wealthier, and more educated consumers report higher rates of incidences—is this due to deeper usage, more awareness of challenges, greater willingness to report issues, or other reasons?
Challenges experienced using DFS
20

Key takeawaysChallenges experienced using DFS
21
Digital loans raise several concerns:
• Majority of borrowers report reducing consumption to service debt
• 77% have not paid a loan back on time at some point
• Limited evidence of comparing costs of different loan providers
Phishing scams were the most common challenge faced—but most consumers do not report having fallen victim to these attempts.
Poor customer care and unexpected charges are areas where providers could improve consumer experience through simple adjustments to transparency and redress.
Many consumers send money to the wrong person—despite innovations by providers to help reduce this error like Safaricom’s “Hakikisha” solution.

Which challenges are most common for consumersChallenges experienced using DFS
22
Percent of respondents, reporting consumer protection challenges:
56%
35%
23%
17%
17%
15%
11%
5%
3%
3%
2%
Phishing by phone or SMS
Incorrectly sent money
Denied access to a new loan*
Poor quality of customer care
Could not reach customer care
Difficulty using shortcode menu or app
Unexpected or unclear charges
Money was missing or taken without your permission
Agent charged you extra to complete a transaction
Someone took out a loan in your name*
Agent did not keep your information safe or private
28% of respondents report at least one customer care issue
Opportunities to improve user interface and comprehension through consumer testing
* For these challenges, percent of mobile loan users reported
Notes: n=769–793 except for “Denied access to a new loan (n=430) and “Someone took out a loan in your name” (n=426); January – October 2020

Challenges by service typeChallenges experienced using DFS
23
Respondents are most likely to experience challenges with mobile money, apart from difficulty using shortcodemenus or apps, which is the most common issue for mobile banking and mobile loan users.
January – October 2020
0% 5% 10% 15% 20% 25% 30% 35%
Agent did not keep your information safe or private
Agent charged you extra to complete a transaction
Money was missing or taken without your permission
Poor quality of customer care
Unexpected or unclear charges
Could not reach customer care
Incorrectly sent money
Difficulty using shortcode menu or app
Agent did not keep your information safe or private
Money was missing or taken without your permission
Incorrectly sent money
Agent charged you extra to complete a transaction
Poor quality of customer care
Could not reach customer care
Unexpected or unclear charges
Difficulty using shortcode menu or app
Agent did not keep your information safe or private
Agent charged you extra to complete a transaction
Money was missing or taken without your permission
Unexpected or unclear charges
Difficulty using shortcode menu or app
Could not reach customer care
Poor quality of customer care
Incorrectly sent moneyMobile money (n=789)
Mobile banking (n=280)
Mobile loans (n=430)
Percent of mobile money, mobile loan, and mobile banking users reporting each challenge

Challenges by consumer segmentChallenges experienced using DFS
24
Male, better educated, better off, and more urban respondents report more challenges at a statistically significant level.
While these segments may be more likely to experience challenges, differences could also be partially driven by higher DFS usage*, higher awareness of these issues occurring, or greater willingness to report these issues to surveyors. Unpacking the causes for these differences could be an area for further future research.
*Survey restricted to DFS users, but there may be differences in DFS usage intensity (e.g., transactions per month) by consumer segment
0% 20% 40% 60% 80% 100%
FemaleMale
18-2425-44
45+
PrimarySecondary
Tertiary
HigherMiddleLower
UrbanRural
Percent of each respondent type
reporting any challenge
90% confidence intervals
Gendern=793
Agen=793
Educationn=792
Poverty Probabilityn=764
Geographyn=561
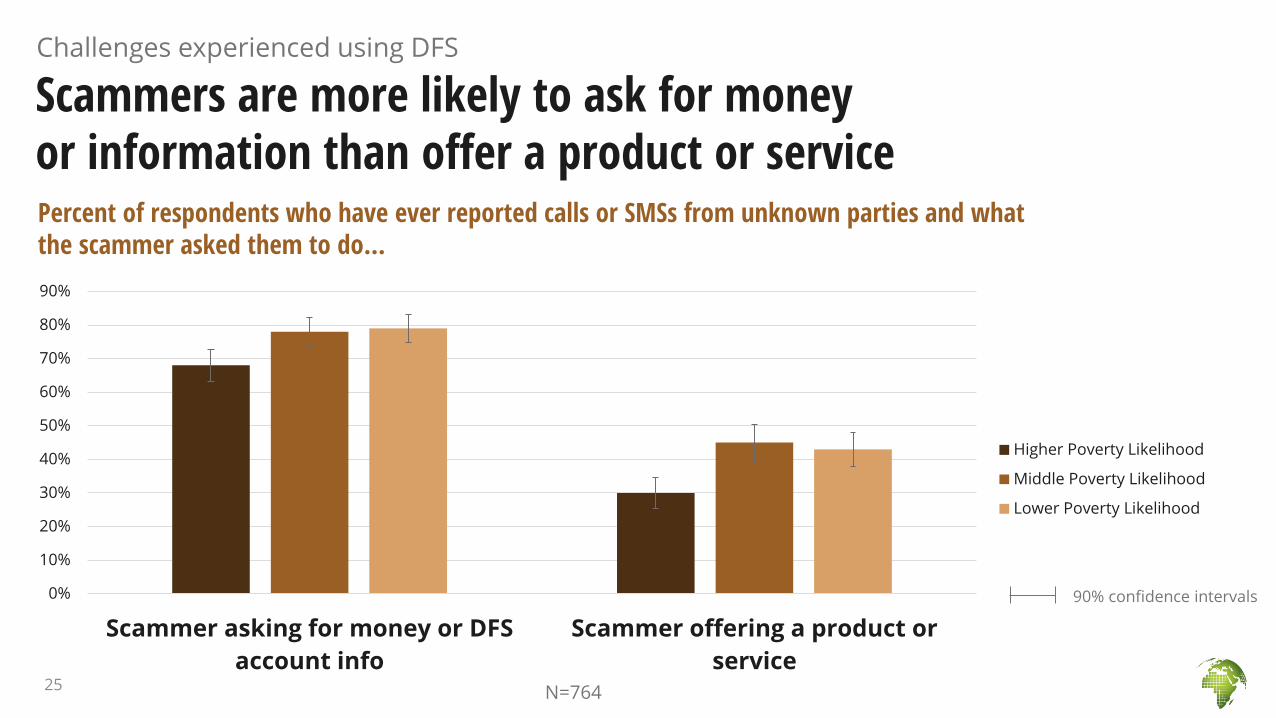
Scammers are more likely to ask for money or information than offer a product or service
Challenges experienced using DFS
25
Percent of respondents who have ever reported calls or SMSs from unknown parties and what the scammer asked them to do…
0%
10%
20%
30%
40%
50%
60%
70%
80%
90%
Scammer asking for money or DFS
account info
Scammer offering a product or
service
Higher Poverty Likelihood
Middle Poverty Likelihood
Lower Poverty Likelihood
N=764
90% confidence intervals

What do scammers seek when they contact DFS users?Challenges experienced using DFS
0% 10% 20% 30% 40% 50% 60% 70% 80%
Send money
Password/PIN
Personal information
Account details
Payment reversal
Help relative/friend in need
Other
n=59126

Scam attempts: How consumers identify scamsChallenges experienced using DFS
27
Calls from regular numbers and warnings from peers are key to consumers avoiding scams.
These indicators of a scam could be shared with the broader population—remember, our respondents are the ones who realized this was a scam, others may not know what to look for.
0% 10% 20% 30%
Regular number
From others' experiences
Requested personal info
No recent transactions
Personal awareness
Incorrectly identified me
Never used service
Did not know caller/sender
Other
How the scam was identified when
it involved a request for money or
account information (n=420)
0% 10% 20% 30%
From others' experiences
Never used service
Regular number
Personal awareness
Requested personal info
No recent transactions
Incorrectly identified me
Did not know caller/sender
Other
How the scam was identified when
it involved offering a product or
service (n =259)
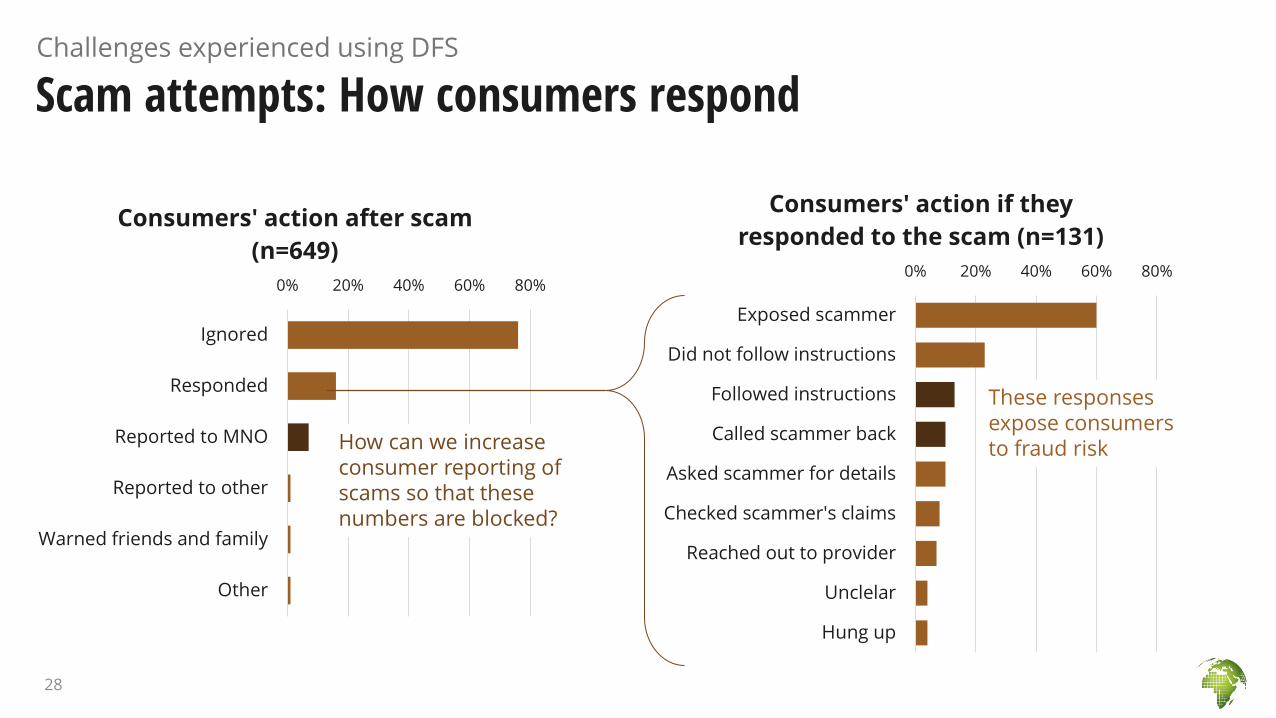
0% 20% 40% 60% 80%
Ignored
Responded
Reported to MNO
Reported to other
Warned friends and family
Other
Consumers' action after scam
(n=649)
Scam attempts: How consumers respondChallenges experienced using DFS
28
How can we increase consumer reporting of scams so that these numbers are blocked?
0% 20% 40% 60% 80%
Exposed scammer
Did not follow instructions
Followed instructions
Called scammer back
Asked scammer for details
Checked scammer's claims
Reached out to provider
Unclelar
Hung up
Consumers' action if they
responded to the scam (n=131)
These responses expose consumers to fraud risk

Scams are quite common during the pandemicChallenges experienced using DFS
Yes
57%
No
43%
Percentage of respondents who
experienced attempted scams
or fraud since COVID-19 began
(n=792)0% 10% 20% 30% 40% 50% 60% 70% 80%
SMS
Phone
Social media
Mode of scams received (n=449)
29

Mobile loan users exhibit concerning signs of stressChallenges experienced using DFS
0% 10% 20% 30% 40% 50% 60%
Reduce non-food expenditure
Reduce food expenditure
Nonpayment of another debt
Second loan to pay for first loan
Nonpayment of school fees
Sold personal/household assets
Other
Percentage of mobile loan users who
reported making sacrifices to repay
mobile loan (n=430)
Yes,
experienced
77%
Never
experienced
23%
Mobile loan users who reported ever
experiencing the inability to repay a
mobile loan on time (n=430)
30
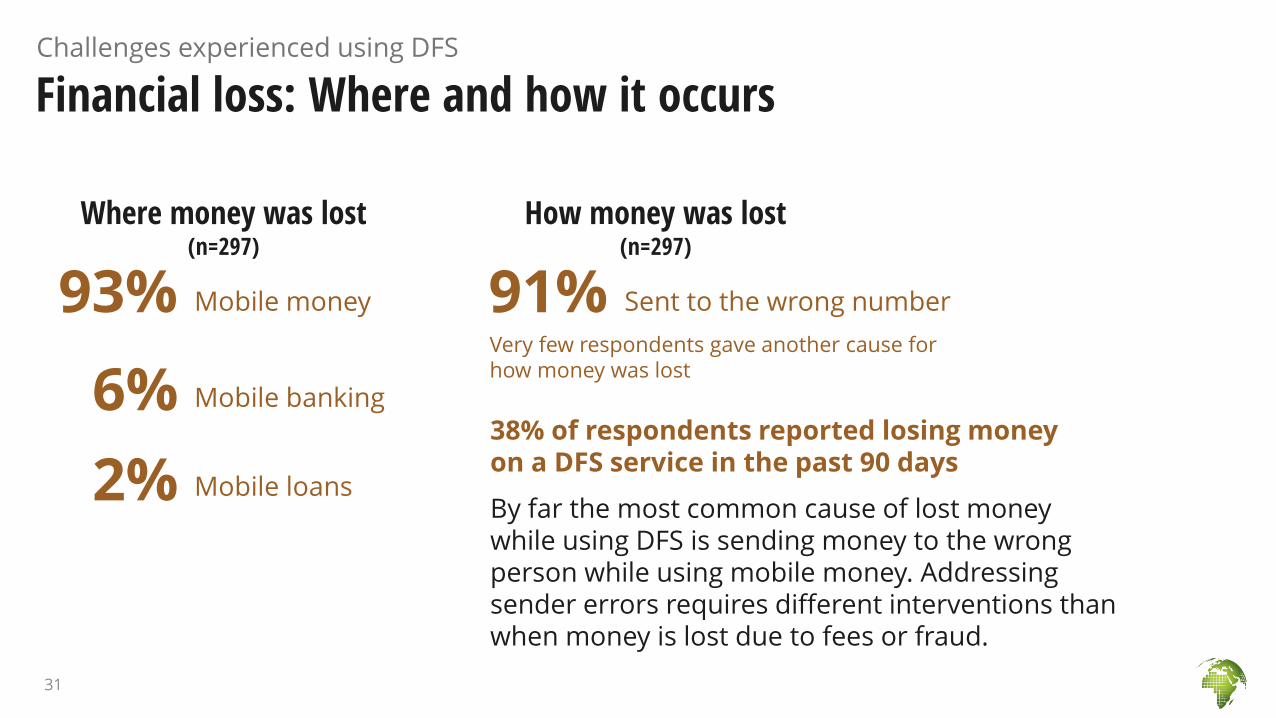
Financial loss: Where and how it occursChallenges experienced using DFS
31
Where money was lost (n=297)
38% of respondents reported losing money on a DFS service in the past 90 days
By far the most common cause of lost money while using DFS is sending money to the wrong person while using mobile money. Addressing sender errors requires different interventions than when money is lost due to fees or fraud.
93% Mobile money
Mobile banking
Mobile loans
6%
2%
How money was lost (n=297)
91% Sent to the wrong number
Very few respondents gave another cause for how money was lost

0%
5%
10%
15%
20%
0 1,000 2,000 3,000 4,000 5,000 6,000 7,000 8,000 9,000 10,000
Amount of money lost in last incident (KES) (n=290)
Financial loss: What it costs consumersChallenges experienced using DFS
32
Financial losses are significant, more than a typical daily wage, though a majority (64%) of consumers who lost money reached a resolution they were satisfied with. Consumers do seem to be learning lessons, but a sizable minority continue to struggle.
68%
20%
11%
Frequency with which money
was ever lost via phone
(n=293)
Once Twice Three or more
Median: 1,000 Mean: 3,331
+

Consumers often blame themselves for the largest challenges they experienced in DFS
Challenges experienced using DFS
33
Largest challenge ever experienced (n=425)
*Note: Largest challenge question did not include phishing as an option.
When probed about any challenges ever faced, only 54% cited any incidence, and most cited similar issues to 2020.* 40% Incorrectly
sent money
22% Denied access to a new loan
Person or entity consumer blamed for challenges experienced (n=407)
61 percent of respondents took some action to try to resolve their largest challenge.
49% Myself
19% Mobile money provider
11% Mobile money agent11% Missing
money

• This survey took place several months into the COVID-19 pandemic.
• To understand the context of COVID-19 we asked a series of questions on financial well-being and financial stress.
• There is clear evidence of household financial stress and risks like loan default
Financial stress
34

16%
41%39%
4%
Not difficult Somewhat
difficult
Very difficult Impossible
Respondents rate difficulty of
coming up with emergency money
(n=756)
KES 10,000 (~1/20th GNI) in 30 days
Few Kenyans have access to formal safety nets—and so rely on social networks and work
Financial stress during COVID-19Financial Stress
0% 10% 20% 30% 40%
Family, relataives, or friends
Money from working
Selling assets
Borrowing from a bank or employer
Savings
Some ofther source
Source of emergency funding (n=743)
35

Many Kenyans don’t feel prepared for an emergencyFinancial Stress
15%
5%
27%
15%
21%
19%
37%
61%
Enough money for living expenses (n=791)
Sufficient emergency funds (n=793)
Strongly agree Somewhat agree Somewhat disagree Strongly disagree
36

Pandemic had a profound impact on incomeFinancial Stress
10%
26%
64%
Less income
Same income
More income
0% 10% 20% 30% 40% 50% 60% 70%
Deplete savings
Borrow regardless of ability to repay
Sell assets including livestock
Skip required loan payment
Other
Actions taken to pay for food, healthcare, or other
expenses during the pandemic (n=791)
7 percent relocated due to the pandemic
Change in income since start of pandemic (n=788)
37

35% 12% 36% 16% 1%
Loan repayment since start of pandemic (n=792) Anticipate not being able to make debt payments on time due to pandemic? (n=514)
Loan repayment has suffered during the pandemicFinancial Stress
No loans
Plan to pay later
Do not plan to repay
No difficulty repaying loans
Plan to pay part only
Yes
75%
No
25%
38

DFS market is heavily concentrated with small set of providers in Kenya
• Over 95% of mobile money consumers have used M-Pesa in the past 90 days, less than 5% have ever used any other provider
• NCBA’s Fuliza and M-Shwari are the most utilized mobile loan products, and top 5 loan products account for large majority of all consumer borrowing activity
Consumer choice and decision-making
39
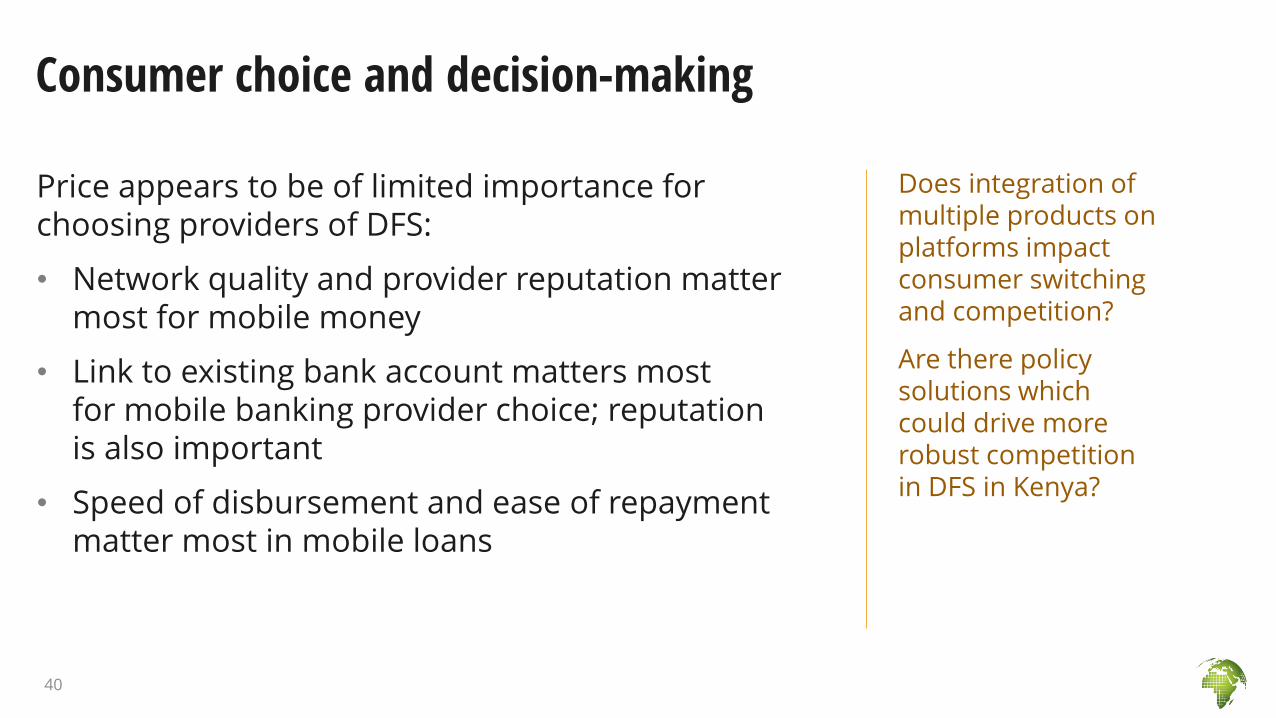
Price appears to be of limited importance for choosing providers of DFS:
• Network quality and provider reputation mattermost for mobile money
• Link to existing bank account matters most for mobile banking provider choice; reputation is also important
• Speed of disbursement and ease of repaymentmatter most in mobile loans
Consumer choice and decision-making
Does integration of multiple products on platforms impact consumer switching and competition?
Are there policy solutions which could drive more robust competition in DFS in Kenya?
40
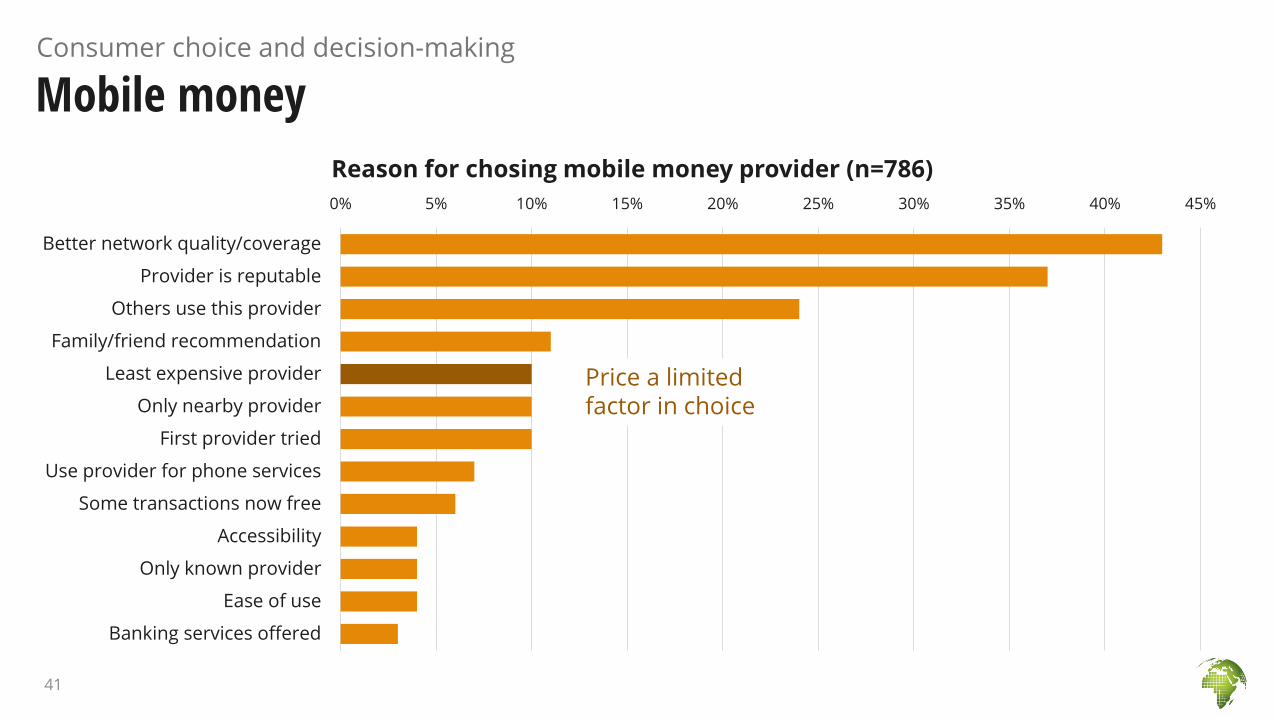
Mobile moneyConsumer choice and decision-making
41
0% 5% 10% 15% 20% 25% 30% 35% 40% 45%
Better network quality/coverage
Provider is reputable
Others use this provider
Family/friend recommendation
Least expensive provider
Only nearby provider
First provider tried
Use provider for phone services
Some transactions now free
Accessibility
Only known provider
Ease of use
Banking services offered
Reason for chosing mobile money provider (n=786)
Price a limited factor in choice

Mobile moneyConsumer choice and decision-making
42
0% 25% 50% 75% 100%
Receive money
Send money to friends or family
Buy airtime
Pay bills/purchase items
Save or keep money
Make payments for business
Receive payments for business
Gambling
Receive salary
Uses for mobile money account (n=789)

Mobile moneyConsumer choice and decision-making
43
Change in mobile money vs cash since pandemic started
(n=782)
0%
5%
10%
15%
20%
25%
30%
35%
Today Yesterday Last 7 days Last 14 days Last 30 days Last 60 days Last 90 days More than 90
days ago
Date of last mobile money transaction (n=780)
51%More mobile
money use now
23%No change
25%More cash use now

Mobile bankingConsumer choice and decision-making
44
Mobile banking security (n=146)
0% 10% 20% 30% 40% 50%
Linked to my bank account/salary payment
This provider is reputable/trustworthy
Interface is easy to use
Least expensive provider my agent offers
I tried this provider first
Person am sending to or receiving from, uses provider
Accessibility
Some transactions are now free
Only provider my closest agent offers
This is the only provider I know
Friends or family use this provider
Reasons for using mobile banking provider (n=146)
86%Very secure
39%Somewhat
secure
15%Not very secure

Mobile loansConsumer choice and decision-making
45
0% 10% 20% 30% 40% 50%
Speed of loan disbursement
East of repayment terms
Only provider I am allowed to borrow from
Price
Provider is reputable/trustworthy
Quality of services/customer services
I tried this provider first
Only provider I have account with
Already using provider for other services
Accessibility
High loan limit
This is the only provider I know
Friend/family member uses services
Network coverages
Banking services
Only provider my closest agent offers
Reasons for using mobile loan provider instead of traditional loan (n=217)
Price a limited factor in choice.
Only 27% of
mobile loan users report knowing fees
charged by other mobile loan providers

Mobile loansConsumer choice and decision-making
46
0% 10% 20% 30% 40% 50% 60% 70%
Ease of access
Speed of loan decision
Less paperwork or identification requirements
Confidentiality
No collateral needed
Lower interest rate/fees
No bank account needed
Reasons for using mobile loans instead of traditional loan (n=217)

AgentsConsumer choice and decision-making
47
0% 10% 20% 30% 40%
Agent is respected or trustworthy
I chose the one close by
Agent has float
She/he is a friend
Only one close agent
Friend or family recommended agent
Only agent with my provider
How agents are chosen (n=764)
82%
64%
24%
11% 11%7%
Cash out Deposit Send
money
Pay bill Receive
money
Buy
airtime
How agents are used (n=773)

AgentsConsumer choice and decision-making
48
27%
4%
35%
16%
8%
21%
33%
23%
31%
25%
65%
13%
Keep your information safe (n=772)
Not cheat or deceive you (n=769)
Act in your best interests (n=767)
Respondents’ perception of agents
Completely Mostly Somewhat Not at all
Consumers show a healthy amount of caution regarding their information compared to other perception questions on agents
2 percent of DFS users have shared a PIN number or other account details with an agent (n=773)
Respondents who experienced agents withdrawing cash for
them without respondent being physically present
(n=773)
Yes
experienced
9%
No haven't
experienced
91%

• Unexpected or unclear charges ranked low amongst DFS challenges experienced
• Consumer knowledge of costs of two of the most popular services: M-Pesa and M-Shwari, showed signs of price awareness
• Most consumers identify costs through post-transaction receipt—not pre-transaction disclosure. This may be an area for improvements in pricing transparency.
Price awareness and transparency
49

Self-reported versus posted feesConsumers perform well in price recall
Transparency and Knowledge
Mobile Money (M-Pesa) Mobile Loans (M-Shwari)
Marker size represents number of observations. Points lying on the orange lines represent correct responses. Only M-Pesa transfers and withdrawals and M-Shwari loans included. Other transaction types and providers either had few observations or variable pricing. Transfers assumed to be in-network, withdrawals assumed to be from agents (not ATMs), and loans assumed to be paid back on time, but not early (no early repayment discounts or rollover fees).
Note: Excludes 7% of respondents who reported not knowing withdrawal fee
Note: Excludes 14% of respondents who reported not knowing transfer fee
Note: Excludes 9% of respondents who reported not knowing M-Shwari fee
-50
0
50
100
150
200
250
300
0 50 100 150 200
Re
po
rte
d f
ee
Posted fee
Withdrawal fees (n=61)
-500
0
500
1000
1500
2000
2500
-500 0 500 1000 1500 2000
Re
po
rte
d f
ee
Posted fee
Loans (n=174)
-50
0
50
100
150
200
250
300
-50 0 50 100 150 200
Re
po
rte
d f
ee
Posted fee
Transfer fees (n=225)
50

Young, better educated respondents know mobile money fees best
Transparency and Knowledge
51
Percent of respondents
reporting correct mobile
loan fees (+/-5%)(n=174)
0% 10% 20% 30% 40% 50% 60% 70% 80%
FemaleMale
18-2425-44
45+
PrimarySecondary
Tertiary
LowerMiddleHigher
UrbanRural
Percent reporting correct mobile money transaction fee by
transaction type and respondent characteristics
90% confidence intervals
Note: Actual rate likely higher, as this analysis
ignores the possibility of early repayment discounts
or rollover fees. Small samples prevent
segmentation analysis.
40%Gender (n=321)
Age (n=321)
Education(n=321)
Poverty Probability(n=310)
Geography (n=230)

How do consumers learn about fees they are charged?Transparency and Knowledge
52
The portion of mobile loan users who know of other loan providers’ fees beyond those of the provider from which they
borrow(n=216)
Receipt
after
transation
72%
Notice on
phone
before
transaction
25%
Sign at
branch or
agent
3%
Mobile money fees (n=589)
Receipt
after
transation
69%
Notice on
phone
before
transaction
31%
Mobile loan fees (n=162)
27%

• Those who had experienced key DFS challenges were asked about any actions taken to address these challenges
• Majority of consumers attempted to resolve their issue —although 39% took no action
• Providers’ customer care hotlines are by far the most common channel used for redress by consumers
• 48% of consumers who tried to resolve their issue were successful
• Most consumers who did not resolve the issue did not change usage as a result
Complaints handling and redress
53

How consumers use/don’t use formal redress channels
54
0 50 100 150 200
Incorrectly sent money
Denied loan
Missing money
Poor customer care
Couldn't reach customer care
Loan ID theft
Number of consumers experiencing
each challenge
0 50 100 150 200
Incorrectly sent money
Denied loan
Missing money
Poor customer care
Couldn't reach customer care
Loan ID theft
Type of action in response to challenge, by
number of consumers
Contacted provider Contacted agent Contacted recipient
Other response Took no action

When consumers took action, most issues were resolved
55
Phone (Voice, SMS,
USSD)
77%
In person
18%
Other channel
5%
Type of channel used by those
who took action (n=256)
0 25 50 75 100 125 150 175 200 225
Phone (Voice, SMS, USSD)
In person
Other channel
Consumers reporting whether or not the issue
was resolved, by channel
Resolved problem Failed to resolve problem Other outcome
However, this varied significantly by channel used to present the challenge

1/3 of consumers whose problems were not resolved changed their usage of that service
56
88%
5%
6%
2%
67%
10%
17%
6%
Did not affect usage
Stopped using service
Reduced usage
Changed providers
Consumers’ behavior change as a result of problem resolution
Resolved problem (n=124)
Failed to resolve problem (n=83)

When financial loss occurs, consumers are likely to use redress channels
57
reported having to spend additional money as part of the resolution
process
reported taking some action to try to resolve
the issue
88% 25%Of respondents who experienced a problem involving a financial loss (n=297)
81%Contacted provider via phone or SMS
of those who tried to resolve
their issue were successful
77%86%reported resolution took a day or less

Redress and complaints handling
• More educated and better off segments are more likely to report experiencing challenges. Further research is needed on why this discrepancy exists and if targeted outreach is needed to particular DFS user populations.
Scams and fraud
• Attempted scams are common—although consumers are aware and cautious. The strategies consumers use for avoiding scams could form the basis of consumer education campaigns for other consumers who may not be as aware or vigilant to protect themselves.
Transparency and consumer choice
• Consumers are generally price aware of the mobile money and digital credit products they use. However, pre-transaction disclosures could be made more salient.
• Price is not a leading factor in choice of providers, and borrowers generally do not know the prices of lenders they do not use. Interventions may be needed to improve consumer awareness of the range of choices in DFS to encourage comparison shopping and switching.
Policy takeaways from consumer survey
58

Digital credit
• Consumers may be borrowing from one lender to repay another, or taking on additional debt when already in a situation of debt stress.
• New monitoring tools could be developed to monitor the market for warning signs of overindebtedness in the digital credit market through indicators such as multiple borrowing, late and non-payment, and outcomes from borrowing. This could include a combination of consumer survey data like the questions asked here and administrative data from digital credit providers.
• Reducing information asymmetries through greater information sharing across digital credit providers could help improve consumer switching and reduce multiple borrowing and related non-payment of debts.
Policy takeaways from consumer survey
59

Thank you
poverty-action.org