kentucky power company 2011 analysis of …aep.com... · kentucky power company 2011 analysis of...
TRANSCRIPT
KENTUCKY POWER COMPANY
2011 Analysis of System Losses
April 2013
Prepared by:
Management Applications Consulting, Inc. 1103 Rocky Drive – Suite 201
Reading, PA 19609 Phone: (610) 670-9199 / Fax: (610) 670-9190
Case No. 2016-00281 Commission Staff's First Set of Data Requests
Order Dated September 12, 2016 Item No. 4
Attachment 1 Page 1 of 33

MANAGEMENT APPLICATIONS CONSULTING, INC.
1103 Rocky Drive • Suite 201 • Reading, PA 19609-1157 • 610/670-9199 • fax 610/670-9190 •www.manapp.com
April 17, 2013 Mr. David M. Roush Director Regulatory Pricing & Analysis American Electric Power 1 Riverside Plaza Columbus, OH 43215 Mr. Mark P. Gilbert Director Economic Forecasting American Electric Power 212 East 6th Street Tulsa, OK 74119 RE: 2011 LOSS ANALYSIS Dear Messrs. Roush and Gilbert: Transmitted herewith are the results of the 2011 Analysis of System Losses for the Kentucky Power Company’s (KPCO) power system. Our analysis develops cumulative expansion factors (loss factors) for both demand (peak/kW) and energy (average/kWh) losses by discrete voltage levels applicable to metered sales data. Our analysis considers only technical losses in arriving at our final recommendations. On behalf of MAC, we appreciate the opportunity to assist you in performing the loss analysis contained herein. The level of detailed load research and sales data by voltage level, coupled with a summary of power flow data and power system model, forms the foundation for determining reasonable and representative power losses on the KPCO system. Our review of these data and calculated loss results support the proposed loss factors as presented herein for your use in various cost of service, rate studies, and demand analyses. Should you require any additional information, please let us know at your earliest convenience. Sincerely,
Paul M. Normand Principal Enclosure PMN/rjp
Case No. 2016-00281 Commission Staff's First Set of Data Requests
Order Dated September 12, 2016 Item No. 4
Attachment 1 Page 2 of 33
Kentucky Power Company 2011 Analysis of System Losses
TABLE OF CONTENTS 1.0 EXECUTIVE SUMMARY ............................................................................................... 1 2.0 INTRODUCTION .............................................................................................................. 6
2.1 Conduct of Study ............................................................................................................ 6 2.2 Electric Power Losses ..................................................................................................... 7 2.3 Description of Model ...................................................................................................... 7
3.0 METHODOLOGY ............................................................................................................. 9 3.1 Background ..................................................................................................................... 9 3.2 Calculations and Analysis ............................................................................................. 11
3.2.1 Bulk, Transmission and Subtransmission Lines ....................................................... 11 3.2.2 Transformers ............................................................................................................. 12 3.2.3 Distribution System .................................................................................................. 13
4.0 DISCUSSION OF RESULTS........................................................................................... 14 Appendix A – Results of Kentucky Power Company Total Company 2011 Loss Analysis Appendix B – Discussion of Hoebel Coefficient
Case No. 2016-00281 Commission Staff's First Set of Data Requests
Order Dated September 12, 2016 Item No. 4
Attachment 1 Page 3 of 33
Kentucky Power Company 2011 Analysis of System Losses
1
1.0 EXECUTIVE SUMMARY This report presents Kentucky Power Company’s (KPCO) 2011 Analysis of System Losses for the power systems as performed by Management Applications Consulting, Inc. (MAC). The study developed separate demand (kW) and energy (kWh) loss factors for each voltage level of service in the power system for KPCO. The cumulative loss factor results by voltage level, as presented herein, can be used to adjust metered kW and kWh sales data for losses in performing cost of service studies, determining voltage discounts, and other analyses which may require a loss adjustment. The procedures used in the overall loss study were similar to prior studies and emphasized the use of “in house” resources where possible. To this end, extensive use was made of the Company's peak hour power flow data and transformer plant investments in the model. In addition, measured and estimated load data provided a means of calculating reasonable estimates of losses by using a “top-down” and “bottom-up” procedure. In the “top-down” approach, losses from the high voltage system, through and including distribution substations, were calculated along with power flow data, conductor and transformer loss estimates, and metered sales. At this point in the analysis, system loads and losses at the input into the distribution substation system are known with reasonable accuracy. However, it is the remaining loads and losses on the distribution substations, primary system, secondary circuits, and services which are generally difficult to estimate. Estimated and actual Company load data provided the starting point for performing a “bottom-up” approach for calculating the remaining distribution losses. Basically, this “bottom-up” approach develops line loadings by first determining loads and losses at each level beginning at a customer’s meter service entrance and then going through secondary lines, line transformers, primary lines and finally distribution substation. These distribution system loads and associated losses are then compared to the initial calculated input into Distribution Substation loadings for reasonableness prior to finalizing the loss factors. An overview of the loss study is shown on Figure 1. Table 1, below, provides the final results from Appendix A for the 2011 calendar year. Exhibits 8 and 9 of Appendix A present a more detailed analysis of the final calculated summary results of losses by segments and delivery voltage of the power system. The following Table 1 cumulative loss expansion factors are applicable only to metered sales at the point of receipt for adjustment to the power system’s input level.
Case No. 2016-00281 Commission Staff's First Set of Data Requests
Order Dated September 12, 2016 Item No. 4
Attachment 1 Page 4 of 33

Kentucky Power Company 2011 Analysis of System Losses
2
TABLE 1 Loss Factors at Sales Level, Calendar Year 2011
Voltage Level
of ServiceTotal
KPCO Distribution
Only Demand (kW)
Transmission1 1.04223 – Subtransmission 1.06139 1.01838 Primary Lines 1.07358 1.03008 Secondary 1.10354 1.05883 Energy (kWh) Transmission1 1.03482 – Subtransmission 1.04720 1.01197 Primary Lines 1.05535 1.01985 Secondary 1.08761 1.05102 Losses – Net System Input2 Losses – Net System Output3
6.31%MWh 8.20%MW 6.73%MWh 8.93%MW
Composite Loss Factors at Metered Sales Level MW MWH
Retail 1.08990 1.06774 Wholesale 1.04797 1.03845
The loss factors presented in the Delivery Only column of Table 1 are the Total KPCO loss factors divided by the transmission loss factor in order to remove these losses from each service level loss factor. For example, the secondary distribution demand loss factor of 1.05883 includes the recovery of all remaining non-transmission losses from the subtransmission, distribution substation, primary lines, line transformers, secondary conductors and services. The net system input shown in Table 1 represents the MWh losses of 6.31% for the total KPCO load using calculated losses divided by the associated input energy to the system. The 6.73% represents the same losses using system output instead of input as a reference. The net system output reference shown in Table 1 represents MWh losses of 6.73% and MW losses of 8.93%. These results use the appropriate total losses for each but are divided by system output or sales. These calculations are all based on the data and results shown on Exhibits 1, 7 and 9 of the study.
1 Reflects results for 765 kV, 345 kV 161 kV, and 138 kV. 2 Net system input equals firm sales plus losses, Company use less non-requirement sales and related losses. See Appendix A, Exhibit 1, for their calculations. 3 Net system output uses losses divided by output or sales data as a reference.
Case No. 2016-00281 Commission Staff's First Set of Data Requests
Order Dated September 12, 2016 Item No. 4
Attachment 1 Page 5 of 33

Kentucky Power Company 2011 Analysis of System Losses
3
Due to the very nature of losses being primarily a function of equipment loadings, the loss factor derivations for any voltage level must consider both the load at that level plus the loads from lower voltages and their associated losses. As a result, cumulative losses on losses equates to additional load at higher levels along with future changes (+ or ) in loads throughout the power system. It is therefore important to recognize that losses are multiplicative in nature (future) and not additive (test year only) for all future years to ensure total recovery based on prospective fixed loss factors for each service voltage. The derivation of the cumulative loss factors shown in Table 1 have been detailed for all electrical facilities in Exhibit 9, page 1 for demand and page 2 for energy. Beginning on line 1 of page 1 (demand) under the secondary column, metered sales are adjusted for service losses on lines 3 and 4. This new total load (with losses) becomes the load amount for the next higher facilities of secondary conductors and their loss calculations. This process is repeated for all the installed facilities until the secondary sales are at the input level (line 45). The final loss factor for all delivery voltages using this same process is shown on line 46 and Table 1 for demand. This procedure is repeated in Exhibit 9, page 2, for the energy loss factors. The loss factor calculation is simply the input required (line 45) divided by the metered sales (line 43). An overview of the loss study is shown on Figure 1 on the next page. Figure 2 simply illustrates the major components that must be considered in a loss analysis.
Case No. 2016-00281 Commission Staff's First Set of Data Requests
Order Dated September 12, 2016 Item No. 4
Attachment 1 Page 6 of 33

Kentucky Power Company 2011 Analysis of System Losses
4
Case No. 2016-00281 Commission Staff's First Set of Data Requests
Order Dated September 12, 2016 Item No. 4
Attachment 1 Page 7 of 33
Figure 1
MANAGEMENT APPLICATIONS CONSULTING, INC.
SYSTEM DATA
Generation Purchases Interchange by
Voltage Level kW kVA kWh
ELECTRIC LOSS MODEL OVERVIEW
LOAD FLOW DATA
Peak Hour kW kVA
Purchases Transformers Conductors
TRANSFORMER MODEL
Number Installed Size, Volage Level, Cu, Fe Losses. Characteristics Auto. GSU, Power
CONDUCTOR MODEL
Voltage Level Wire Size Len~h Segments
DISJRIBUT!ON PRIMARY DNA
Capacitors Regulators Feeder
Configurations Loss per kVA
-
MAIN LOSS MODEL
PRIMARY MODEL
Wire Size. Length Loadings
kW Power Factor
Urban, Rural
SECONDARY MODEL
Line Transformers Conductors Ser;ices Meters
• Calculates fixed and variable losses by voltage level ler peak and average.
• Pr<Mdes a deta1led peak and average loss calculation by discrete level of service.
• Uses a weighted multipath approach for final derivation of loss factors by voltage level.
• Recognizes energy sales for up to 16 delivery levels Including at the substation only.
LOAD DATA
Load Research Voltage Level Use CP, MOD, NCP Calendar kWh Sales Number of Customers
By Voltage Level Annual Average & Peak Month
Copyright 1992 Man•gcmenl API>ticoJJ<>lS Con\1JIIing. lnc. ln Rcad111g, PA 610-670-9199, In Austin, TX Sl2-33 l -ll13

Kentucky Power Company 2011 Analysis of System Losses
5
Figure 2 Generic Energy Loss Components
Load
Dat
a
Metered and/or Estimated Load
Data
Unbilled
Company Use
Loss
es Transmission
System Wide Energy Losses Variable (Load) Fixed (No Load) Distribution
Delivery
Case No. 2016-00281 Commission Staff's First Set of Data Requests
Order Dated September 12, 2016 Item No. 4
Attachment 1 Page 8 of 33

Kentucky Power Company 2011 Analysis of System Losses
6
2.0 INTRODUCTION This report of the 2011 Analysis of System Losses for the Kentucky Power Company provides a summary of results, conceptual background or methodology, description of the analyses, and input information related to the study. 2.1 Conduct of Study
Typically, between five to ten percent of the total kWh requirements of an electric utility is lost or unaccounted for in the delivery of power to customers. Investments must be made in facilities which support the total load which includes losses or unaccounted for load. Revenue requirements associated with load losses are an important concern to utilities and regulators in that customers must equitably share in all of these cost responsibilities. Loss expansion factors are the mechanism by which customers' metered demand and energy data are mathematically adjusted to the generation or input level (point of reference) when performing cost and revenue calculations. An acceptable accounting of losses can be determined for any given time period using available engineering, system, and customer data along with empirical relationships. This loss analysis for the delivery of demand and energy utilizes such an approach. A microcomputer loss model4 is utilized as the vehicle to organize the available data, develop the relationships, calculate the losses, and provide an efficient and timely avenue for future updates and sensitivity analyses. Our procedures and calculations are similar with prior loss studies, and they rely on numerous databases that include customer statistics and power system investments. Company personnel performed most of the data gathering and data processing efforts and checked for reasonableness. MAC provided assistance as necessary to construct databases, transfer files, perform calculations, and check the reasonableness of results. A review of the preliminary results provided for additions to the database and modifications to certain initial assumptions based on available data. Efforts in determining the data required to perform the loss analysis centered on information which was available from existing studies or reports within the Company. From an overall perspective, our efforts concentrated on five major areas: 1. System information concerning peak demand and annual energy requirements by
voltage level, 2. High voltage power system power flow data and associated loss calculations, 3. Distribution system primary and secondary loss calculations, 4. Derivation of fixed and variable losses by voltage level, and 5. Development of final cumulative expansion factors at each voltage for peak demand
(kW) and annual energy (kWh) requirements at the point of delivery (meter).
4Copyright by Management Applications Consulting, Inc.
Case No. 2016-00281 Commission Staff's First Set of Data Requests
Order Dated September 12, 2016 Item No. 4
Attachment 1 Page 9 of 33

Kentucky Power Company 2011 Analysis of System Losses
7
2.2 Electric Power Losses Losses in power systems consist of primarily technical losses with a much smaller level of non-technical losses.
Technical Losses Electrical losses result from the transmission of energy over various electrical equipment. The largest component of these losses is power dissipation as a result of varying loading conditions and are oftentimes called load losses which are proportional to the square of the current (I2R). These losses can be as high as 75% of all technical losses. The remaining losses are called no-load and represent essentially fixed (constant) energy losses throughout the year. These no-load losses represent energy required by a power system to energize various electrical equipment regardless of their loading levels. The major portion of no-load losses consists of core or magnetizing energy related to installed transformers throughout the power system. Non-Technical Losses These are unaccounted for energy losses that are related to energy theft, metering, non-payment by customers, and accounting errors. Losses related to these areas are generally very small and can be extremely difficult and subjective to quantify. Our efforts generally do not develop any meaningful level as appropriate because we assume that improving technology and utility practices have minimized these amounts.
2.3 Description of Model The loss model is a customized applications model, constructed using the Excel software program. Documentation consists primarily of the model equations at each cell location. A significant advantage of such a model is that the actual formulas and their corresponding computed values at each cell of the model are immediately available to the analyst. A brief description of the three (3) major categories of effort for the preparation of each loss model is as follows:
• Main sheet which contains calculations for all primary and secondary losses,
summaries of all conductor and transformer calculations from other sheets discussed below, output reports and supporting results.
Case No. 2016-00281 Commission Staff's First Set of Data Requests
Order Dated September 12, 2016 Item No. 4
Attachment 1 Page 10 of 33

Kentucky Power Company 2011 Analysis of System Losses
8
• Transformer sheet which contains data input and loss calculations for each distribution substation and high voltage transformer. Separate iron and copper losses are calculated for each transformer by identified type.
• Conductor sheet containing summary data by major voltage level as to circuit
miles, loading assumptions, and kW and kWh loss calculations. Separate loss calculations for each line segment were made using the Company’s power flow data by line segment and summarized by voltage level in this model.
Appendix A presents a detailed loss study result which derives the loss factors for the Company’s system-wide power system. Appendix A, Exhibits 8 and 9, presents the final detailed summary results of the demand and energy losses for each major portion of the total KPCO power system.
Case No. 2016-00281 Commission Staff's First Set of Data Requests
Order Dated September 12, 2016 Item No. 4
Attachment 1 Page 11 of 33

Kentucky Power Company 2011 Analysis of System Losses
9
3.0 METHODOLOGY 3.1 Background
The objective of a Loss Study is to provide a reasonable set of energy (average) and demand (peak) loss expansion factors which account for system losses associated with the transmission and delivery of power to each voltage level over a designated period of time. The focus of this study is to identify the difference between total energy inputs and the associated sales with the difference being equitably allocated to all delivery levels. Several key elements are important in establishing the methodology for calculating and reporting the Company's losses. These elements are:
• Selection of voltage level of services, • Recognition of losses associated with conductors, transformations, and
other electrical equipment/components within voltage levels, • Identification of customers and loads at various voltage levels of service, • Review of generation or net power supply input at each level for the test
period studied, and • Analysis of kW and kWh sales by voltage levels within the test period.
The three major areas of data gathering and calculations in the loss analysis were as follows:
1. System Information (monthly and annual)
• MWH generation and MWH sales.
• Coincident peak estimates and net power supply input from all sources
and voltage levels.
• Customer load data estimates from available load research information, adjusted MWH sales, and number of customers in the customer groupings and voltage levels identified in the model.
• System default values, such as power factor, loading factors, and load
factors by voltage level.
Case No. 2016-00281 Commission Staff's First Set of Data Requests
Order Dated September 12, 2016 Item No. 4
Attachment 1 Page 12 of 33
Kentucky Power Company 2011 Analysis of System Losses
10
2. High Voltage System
• Conductor information was summarized from a database by the Company
which reflects the transmission system by voltage level. Extensive use was made of the Company’s power flow data with the losses calculated and incorporated into the final loss calculations.
• Transformer information was developed in a database to model
transformation at each voltage level. Substation power, step-up, and auto transformers were individually identified along with any operating data related to loads and losses.
• Power flow data of peak condition was the primary source of equipment
loadings and derivation of load losses in the high voltage loss calculations.
3. Distribution System Distribution Substations – Data was developed for modeling each
substation as to its size and loading. Loss calculations were performed from this data to determine load and no load losses separately for each transformer.
• Primary lines – Line loading and loss characteristics for several
representative primary circuits were obtained from the Company. These loss results developed kW loss per MW of load and a composite average was calculated to derive the primary loss estimate.
• Line transformers – Losses in line transformers were based on each
customer service group's size, as well as the number of customers per transformer. Accounting and load data provided the foundation with which to model the transformer loadings and to calculate load and no load losses.
• Secondary network – Typical secondary networks were estimated for
conductor sizes, lengths, loadings, and customer penetration for residential and small general service customers.
• Services – Typical services were estimated for each secondary service
class of customers identified in the study with respect to type, length, and loading.
Case No. 2016-00281 Commission Staff's First Set of Data Requests
Order Dated September 12, 2016 Item No. 4
Attachment 1 Page 13 of 33

Kentucky Power Company 2011 Analysis of System Losses
11
The loss analysis was thus performed by constructing the model in segments and subsequently calculating the composite until the constraints of peak demand and energy were met:
• Information as to the physical characteristics and loading of each
transformer and conductor segment was modeled.
• Conductors, transformers, and distribution were grouped by voltage level, and unadjusted losses were calculated.
• The loss factors calculated at each voltage level were determined by
"compounding" the per-unit losses. Equivalent sales at the supply point were obtained by dividing sales at a specific level by the compounded loss factor to determine losses by voltage level.
• The resulting demand and energy loss expansion factors were then used to
adjust all sales to the generation or input level in order to estimate the difference.
• Reconciliation of kW and kWh sales by voltage level using the reported
system kW and kWh was accomplished by adjusting the initial loss factor estimates until the mismatch or difference was eliminated.
3.2 Calculations and Analysis
This section provides a discussion of the input data, assumptions, and calculations performed in the loss analysis. Specific appendices have been included in order to provide documentation of the input data utilized in the model.
3.2.1 Bulk, Transmission and Subtransmission Lines
The transmission and subtransmission line losses were calculated based on a
modeling of unique voltage levels identified by the Company's power flow data and configuration for the entire integrated KPCO Power System. Specific information as to length of line, type of conductor, voltage level, peak load, maximum load, etc., were provided based on Company records and utilized as data input in the loss model.
Actual MW and MVA line loadings were based on KPCO’s peak loading
conditions. Calculations of line losses were performed for each line segment separately and combined by voltage levels for reporting purposes as shown in the Discussion of Results (Section 4.0) of this report. The loss calculations consisted of determining a circuit current value based on MVA line loadings and evaluating the I2R results for each line segment.
Case No. 2016-00281 Commission Staff's First Set of Data Requests
Order Dated September 12, 2016 Item No. 4
Attachment 1 Page 14 of 33
Kentucky Power Company 2011 Analysis of System Losses
12
After system coincident peak hour losses were identified for each voltage level, a separate calculation was then made to develop annual average energy losses based on a loss factor approach. Load factors were determined for each voltage level based on system and customer load information. An estimate of the Hoebel coefficient (see Appendix B) was then used to calculate energy losses for the entire period being analyzed. The results are presented in Section 4.0 of this report.
3.2.2 Transformers The transformer loss analysis required several steps in order to properly consider
the characteristics associated with various transformer types; such as, step-up, auto transformers, distribution substations, and line transformers. In addition, further efforts were required to identify both iron and copper losses within each of these transformer types in order to obtain reasonable peak (kW) and average energy (kWh) losses. While iron losses were considered essentially constant for each hour, recognition had to be made for the varying degree of copper losses due to hourly equipment loadings.
Standardized test data tables were used to represent no load (fixed) and full load
losses for different types and sizes of transformers. This test data was incorporated into the loss model to develop relationships representing copper and iron losses for the transformer loss calculation. These results were then totaled by various groups, as identified and discussed in Section 4.0.
The remaining miscellaneous losses considered in the loss study consisted of
several areas which do not lend themselves to any reasonable level of modeling for estimating their respective losses and were therefore lumped together into a single loss factor of 0.10%. The typical range of values for these losses is from 0.10% to 0.25%, and we have assumed the lower value to be conservative at this time. The losses associated with this loss factor include bus bars, unmetered station use, and grounding transformers.
Case No. 2016-00281 Commission Staff's First Set of Data Requests
Order Dated September 12, 2016 Item No. 4
Attachment 1 Page 15 of 33

Kentucky Power Company 2011 Analysis of System Losses
13
3.2.3 Distribution System The load data at the substation and customer level, coupled with primary and
secondary network information, was sufficient to model the distribution system in adequate detail to calculate losses.
Primary Lines Primary line loadings take into consideration the available distribution load along
with the actual customer loads including losses. Primary line loss estimates were prepared by the Company for use in this loss study. These estimates considered loads per substation, voltage levels, loadings, total circuit miles, wire size, and single- to three-phase investment estimates. All of these factors were considered in calculating the actual demand (kW) and energy (kWh) for the primary system.
Line Transformers
Losses in line transformers were determined based on typical transformer sizes
for each secondary customer service group and an estimated or calculated number of customers per transformer. Accounting records and estimates of load data provided the necessary database with which to model the loadings. These calculations also made it possible to determine separate copper and iron losses for distribution line transformers, based on a table of representative losses for various transformer sizes.
Secondary Line Circuits A calculation of secondary line circuit losses was performed for loads served
through these secondary line investments. Estimates of typical conductor sizes, lengths, loadings and customer class penetrations were made to obtain total circuit miles and losses for the secondary network. Customer loads which do not have secondary line requirements were also identified so that a reasonable estimate of losses and circuit miles of these investments could be made.
Service Drops and Meters Service drops were estimated for each secondary customer reflecting conductor
size, length and loadings to obtain demand losses. A separate calculation was also performed using customer maximum demands to obtain kWh losses. Meter loss estimates were also made for each customer and incorporated into the calculations of kW and kWh losses included in the Summary Results.
Case No. 2016-00281 Commission Staff's First Set of Data Requests
Order Dated September 12, 2016 Item No. 4
Attachment 1 Page 16 of 33

Kentucky Power Company 2011 Analysis of System Losses
14
4.0 DISCUSSION OF RESULTS A brief description of each Exhibit provided in Appendix A follows: Exhibit 1 - Summary of Company Data This exhibit reflects system information used to determine percent losses and a detailed summary of kW and kWh losses by voltage level. The loss factors developed in Exhibit 7 are also summarized by voltage level. Exhibit 2 - Summary of Conductor Information A summary of MW and MWH load and no load losses for conductors by voltage levels is presented. The sum of all calculated losses by voltage level is based on input data information provided in Appendix A. Percent losses are based on equipment loadings. Exhibit 3 - Summary of Transformer Information This exhibit summarizes transformer losses by various types and voltage levels throughout the system. Load losses reflect the copper portion of transformer losses while iron losses reflect the no load or constant losses. MWH losses are estimated using a calculated loss factor for copper and the test year hours times no load losses. Exhibit 4 - Summary of Losses Diagram (2 Pages) This loss diagram represents the inputs and output of power at system peak conditions. Page 1 details information from all points of the power system and what is provided to the distribution system for primary loads. This portion of the summary can be viewed as a "top down" summary into the distribution system. Page 2 represents a summary of the development of primary line loads and distribution substa-tions based on a "bottom up" approach. Basically, loadings are developed from the customer meter through the Company’s physical investments based on load research and other metered information by voltage level to arrive at MW and MVA requirements during peak load conditions by voltage levels. Exhibit 5 - Summary of Sales and Calculated Losses Summary of Calculated Losses represents a tabular summary of MW and MWH load and no load losses by discrete areas of delivery within each voltage level. Losses have been identified and are derived based on summaries obtained from Exhibits 2 and 3 and losses associated with meters, capacitors and regulators.
Case No. 2016-00281 Commission Staff's First Set of Data Requests
Order Dated September 12, 2016 Item No. 4
Attachment 1 Page 17 of 33

Kentucky Power Company 2011 Analysis of System Losses
15
Exhibit 6 - Development of Loss Factors, Unadjusted This exhibit calculates demand and energy losses and loss factors by specific voltage levels based on sales level requirements. The actual results reflect loads by level and summary totals of losses at that level, or up to that level, based on the results as shown in Exhibit 5. Finally, the es-timated values at generation are developed and compared to actual generation to obtain any difference or mismatch. Exhibit 7 - Development of Loss Factors, Adjusted The adjusted loss factors are the results of adjusting Exhibit 6 for any difference. All differences between estimated and actual are prorated to each level based on the ratio of each level's total load plus losses to the system total. These new loss factors reflect an adjustment in losses due only to the kW and kWh mismatch. Exhibit 8 – Adjusted Losses and Loss Factors by Facility These calculations present an expanded summary detail of Exhibit 7 for each segment of the power system with respect to the flow of power and associated losses from the receipt of energy at the meter to the generation for the KPCO power system. Exhibit 9 – Summary of Losses by Delivery Voltage These calculations present a reformatted summary of losses presented in Exhibits 7 and 8 by power system delivery segment as calculated by voltage level of service based on reported metered sales.
Case No. 2016-00281 Commission Staff's First Set of Data Requests
Order Dated September 12, 2016 Item No. 4
Attachment 1 Page 18 of 33

Kentucky Power Company 2011 Analysis of System Losses
Appendix A
Results of 2011 KPCO Integrated Power System Loss Analysis
Case No. 2016-00281 Commission Staff's First Set of Data Requests
Order Dated September 12, 2016 Item No. 4
Attachment 1 Page 19 of 33
KENTUCKY POWER 2011 LOSS ANALYSIS
KENTUCKY POWEREXHIBIT 1
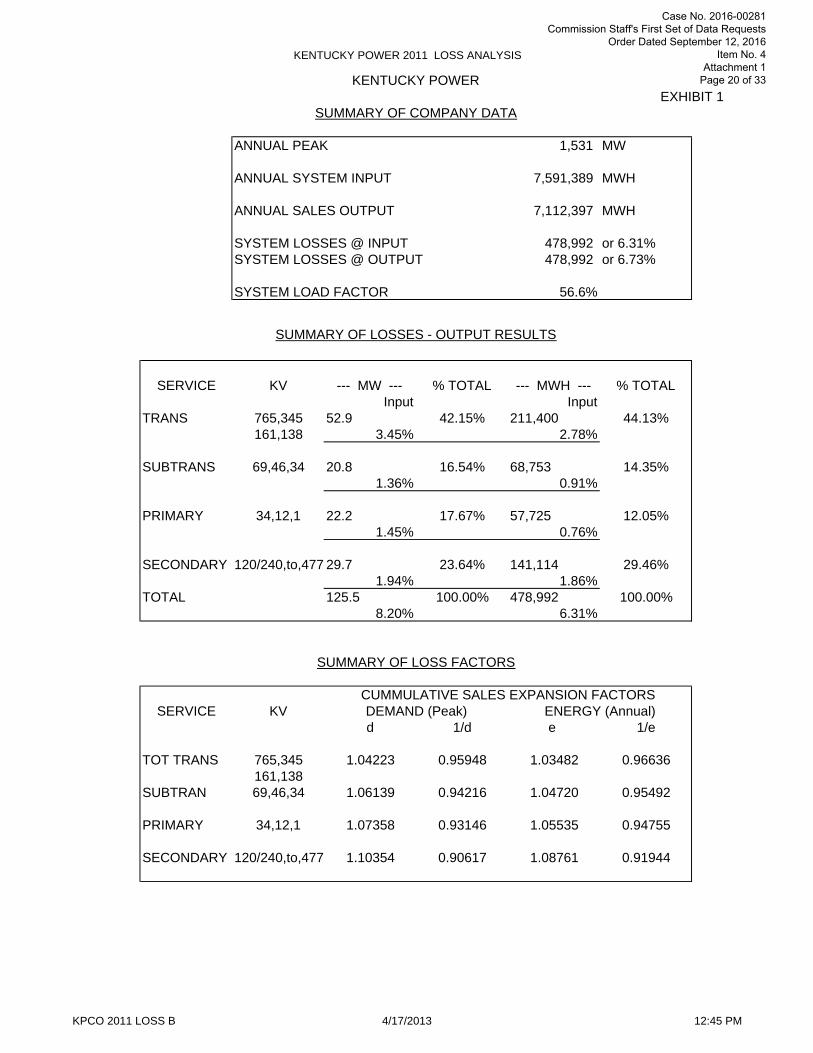
SUMMARY OF COMPANY DATA
ANNUAL PEAK 1,531 MW
ANNUAL SYSTEM INPUT 7,591,389 MWH
ANNUAL SALES OUTPUT 7,112,397 MWH
SYSTEM LOSSES @ INPUT 478,992 or 6.31%SYSTEM LOSSES @ OUTPUT 478,992 or 6.73%
SYSTEM LOAD FACTOR 56.6%
SUMMARY OF LOSSES - OUTPUT RESULTS
SERVICE KV --- MW --- % TOTAL --- MWH --- % TOTALInput Input
TRANS 765,345 52.9 42.15% 211,400 44.13%161,138 3.45% 2.78%
SUBTRANS 69,46,34 20.8 16.54% 68,753 14.35%1.36% 0.91%
PRIMARY 34,12,1 22.2 17.67% 57,725 12.05%1.45% 0.76%
SECONDARY 120/240,to,477 29.7 23.64% 141,114 29.46%1.94% 1.86%
TOTAL 125.5 100.00% 478,992 100.00%8.20% 6.31%
SUMMARY OF LOSS FACTORS
CUMMULATIVE SALES EXPANSION FACTORSSERVICE KV DEMAND (Peak) ENERGY (Annual)
d 1/d e 1/e
TOT TRANS 765,345 1.04223 0.95948 1.03482 0.96636161,138
SUBTRAN 69,46,34 1.06139 0.94216 1.04720 0.95492
PRIMARY 34,12,1 1.07358 0.93146 1.05535 0.94755
SECONDARY 120/240,to,477 1.10354 0.90617 1.08761 0.91944
KPCO 2011 LOSS B 4/17/2013 12:45 PM
Case No. 2016-00281 Commission Staff's First Set of Data Requests
Order Dated September 12, 2016 Item No. 4
Attachment 1 Page 20 of 33

KENTUCKY POWER 2011 LOSS ANALYSIS
SUMMARY OF CONDUCTOR INFORMATION EXHIBIT 2
DESCRIPTION CIRCUIT LOADING ----- MW LOSSES ----- ---- MWH LOSSES ----MILES % RATING LOAD NO LOAD TOTAL LOAD NO LOAD TOTAL
--- BULK ----------- 765 KV OR GREATER --------------------- -------------------- -------------------- -------------------- -------------------- -------------------- ------------------
TIE LINES 0.0 0.00% 0.000 0.000 0.000 0 0 0BULK TRANS 257.5 0.00% 11.777 2.844 14.621 71,988 24,912 96,900
SUBTOT 257.5 11.777 2.844 14.621 71,988 24,912 96,900
--- TRANS --------- 138 KV TO 765.00 KV -------------------- -------------------- -------------------- -------------------- -------------------- ------------------
TIE LINES 0 0.00% 0.000 0.000 0.000 0 0 0
TRANS1 161 KV 56.5 0.00% 4.361 0.040 4.402 14,202 352 14,553TRANS2 138 KV 338.0 0.00% 27.416 0.166 27.582 80,948 1,458 82,406
SUBTOT 394.6 31.777 0.207 31.984 95,150 1,810 96,960
--- SUBTRANS ------ 35 KV TO 138 KV -------------------- -------------------- -------------------- -------------------- -------------------- ------------------
TIE LINES 0 0.00% 0.000 0.000 0.000 0 0 0SUBTRANS1 69 KV 425.0 0.00% 13.669 0.000 13.669 40,500 0 40,500SUBTRANS2 46 KV 167.3 0.00% 3.794 0.000 3.794 11,243 0 11,243SUBTRANS3 35 KV 3.2 0.00% 0.010 0.006 0.016 30 54 83
SUBTOT 595.4 17.473 0.006 17.479 51,772 54 51,826
PRIMARY LINES 8,180 13.136 0.000 13.136 25,107 0 25,107
SECONDARY LINES 2,367 4.736 0.000 4.736 9,354 0 9,354
SERVICES 3,147 5.622 0.364 5.985 11,969 3,184 15,153
TOTAL 14,941 84.521 3.420 87.941 265,340 29,960 295,300
KPCO 2011 LOSS B 4/17/2013 12:46 PM
Case No. 2016-00281 Commission Staff's First Set of Data Requests
Order Dated September 12, 2016 Item No. 4
Attachment 1 Page 21 of 33

KENTUCKY POWER 2011 LOSS ANALYSIS
SUMMARY OF TRANSFORMER INFORMATION EXHIBIT 3
DESCRIPTION KV CAPACITY NUMBER AVERAGE LOADING MVA --------- MW LOSSES -------- ------- MWH LOSSES ------VOLTAGE MVA TRANSFMR SIZE % LOAD LOAD NO LOAD TOTAL LOAD NO LOAD TOTAL
BULK STEP-UP 765 1,500.0 3 500.0 3.39% 51 0.010 0.662 0.672 30 5,795 5,824BULK - BULK 0.0 0 0.0 0.00% 0 0 0.000 0.000 0 0 0BULK - TRANS1 161 0.0 0 0.0 0.00% 0 0.000 0.000 0.000 0 0 0BULK - TRANS2 138 0.0 0 0.0 0.00% 0 0.000 0.000 0.000 0 0 0 TRANS1 STEP-UP 161 950.0 1 950.0 85.71% 814 1.599 0.448 2.047 4,433 3,672 8,105TRANS1 - TRANS2 138 735.0 4 183.8 77.68% 571 0.589 0.606 1.195 1,745 5,313 7,058TRANS1-SUBTRANS1 69 54.0 1 54.0 116.02% 63 0.131 0.056 0.187 716 487 1,204TRANS1-SUBTRANS2 46 0.0 0 0.0 0.00% 0 0.000 0.000 0.000 0 0 0TRANS1-SUBTRANS3 35 0.0 0 0.0 0.00% 0 0.000 0.000 0.000 0 0 0
TRANS2 STEP-UP 138 354.0 3 118.0 87.60% 310 1.057 0.328 1.385 3,004 2,743 5,747TRANS2-SUBTRANS1 69 849.0 15 56.6 95.50% 811 1.262 0.888 2.150 8,326 7,781 16,107TRANS2-SUBTRANS2 46 75.0 2 37.5 97.14% 73 0.286 0.081 0.367 815 708 1,524TRANS2-SUBTRANS3 35 57.0 2 28.5 24.35% 14 0.021 0.062 0.083 42 544 586
SUBTRAN1 STEP-UP 69 0.0 0 0.0 0.00% 0 0.000 0.000 0.000 0 0 0SUBTRAN2 STEP-UP 46 0.0 0 0.0 0.00% 0 0.000 0.000 0.000 0 0 0SUBTRAN3 STEP-UP 35 0.0 0 0.0 0.00% 0 0.000 0.000 0.000 0 0 0
SUBTRAN1-SUBTRAN2 46 24.0 2 12.0 82.91% 20 0.073 0.031 0.104 221 275 496SUBTRAN1-SUBTRAN3 35 0.0 0 0.0 0.00% 0 0.000 0.000 0.000 0 0 0SUBTRAN2-SUBTRAN3 35 0.0 0 0.0 0.00% 0 0.000 0.000 0.000 0 0 0
DISTRIBUTION SUBSTATIONS
TRANS1 - 161 33 24.0 2 12.0 88.25% 21 0.084 0.031 0.116 175 275 451TRANS1 - 161 12 0.0 0 0.0 0.00% 0 0.000 0.000 0.000 0 0 0TRANS1 - 161 1 0.0 0 0.0 0.00% 0 0.000 0.000 0.000 0 0 0
TRANS2 - 138 33 285.0 12 23.8 66.92% 191 0.534 0.332 0.865 1,113 2,906 4,019TRANS2 - 138 12 67.0 4 16.8 80.87% 54 0.179 0.083 0.261 373 724 1,097TRANS2 - 138 1 0.0 0 0.0 0.00% 0 0.000 0.000 0.000 0 0 0
SUBTRAN1- 69 33 209.0 12 17.4 82.33% 172 0.558 0.257 0.816 1,165 2,252 3,417SUBTRAN1- 69 12 620.5 54 11.5 76.80% 477 1.786 0.825 2.611 3,725 7,230 10,955SUBTRAN1- 69 1 15.0 2 7.5 10.79% 2 0.001 0.024 0.025 2 209 211
SUBTRAN2- 46 33 87.0 4 21.8 80.83% 70 0.207 0.102 0.309 432 893 1,325SUBTRAN2- 46 12 139.3 13 10.7 63.91% 89 0.335 0.191 0.526 699 1,676 2,375SUBTRAN2- 46 1 1.0 1 1.0 23.98% 0 0.000 0.002 0.002 1 18 18
SUBTRAN3- 35 33 0.0 0 0.0 0.00% 0 0.000 0.000 0.000 0 0 0SUBTRAN3- 35 12 5.0 1 5.0 116.20% 6 0.042 0.009 0.051 88 77 165SUBTRAN3- 35 1 0.0 0 0.0 0.00% 0 0.000 0.000 0.000 0 0 0
PRIMARY - PRIMARY 21.3 4 5.3 54.60% 12 0.042 0.037 0.079 88 321 408
LINE TRANSFRMR 3,179.4 98,137 32.4 33.22% 1,056 4.227 10.149 14.376 6,931 88,902 95,833
=========== =========== =========== =========== =========== =========== =========== =========== ========== ===========TOTAL 9,251 98,279 13.024 15.204 28.228 34,123 132,801 166,925
KPCO 2011 LOSS B 4/17/2013 12:46 PM
Case No. 2016-00281 Commission Staff's First Set of Data Requests
Order Dated September 12, 2016 Item No. 4
Attachment 1 Page 22 of 33

KENTUCKY POWER 2011 LOSS ANALYSIS
SUMMARY OF LOSSES DIAGRAM - DEMAND MODEL - SYSTEM PEAK 1530.76 MW EXHIBIT 4 PAGE 1 of 2
BULK TIE LINES BULK LINES BULK STEP UP BULK-BULKLOAD 0.00% MW LOADING 0.00% LOADING 3.39% LOADING 0.00%LOAD LOSS 0.000 MW LOAD LOSS 11.777 MW NO LOAD 0.662 MW NO LOAD 0 MWNOLD LOSS 0.000 MW NOLD LOSS 2.844 MW LOAD 0.010 MW LOAD 0 MW
AVG SIZE 500 MVA AVG SIZE 0 MVANUMBER 3 NUMBER 0
TRANS TIE LINES BULK-TRANS1 STEP DOWN TRAN1-TRAN2 STEP DOWN BULK-TRANS2 STEP DOWNLOAD 0.00% MW LOADING 0.00% LOADING 77.68% LOADING 0.00%LOAD LOSS 0.000 MW NO LOAD 0.000 MW NO LOAD 0.606 MW NO LOAD 0.000 MWNOLD LOSS 0.000 MW LOAD 0.000 MW LOAD 0.589 MW LOAD 0.000 MW
AVG SIZE 0 MVA AVG SIZE 183.75 MVA AVG SIZE 0 MVANUMBER 0 NUMBER 4 NUMBER 0
TRANS 1&2 STEP UPS TRANS1 161.0 KV TRANS2 138.0 KV TRANS CUSTLDNG TR1SU 85.71% LOADING 0.00% LOADING 0.00% SUBS 0.000 MWNOLOAD1&2 0.776 MW LOAD LOSS 4.361 MW LOAD LOSS 27.416 MW 0.000 MVALOAD 1&2 2.656 MW NOLD LOSS 0.040 MW NOLD LOSS 0.166 MW LINES MWAVSIZ TR1SU 950.0 MVA MVANUMBER 1
SUBTRANS TIE LINES TRANS1&2-SUBTRANS1 SUBTR1&2-SUBTRANS2&3 TRANS1&2- SUBTRANS2 TRANS1&2-SUBTRANS3LOAD 0.00% MW LDNG TR2-ST 95.50% LOADING 0.00% LDNG TR2-ST 97.14% LDNG TR2-ST2 24.35%LOAD LOSS 0.000 MW NO LOAD 0.944 MW NO LOAD 0.031 MW NO LOAD 0.081 MW NO LOAD 0.06NOLD LOSS 0.000 MW LOAD 1.393 MW LOAD 0.073 MW LOAD 0.286 MW LOAD 0.02
AVSIZ TR2 56.6 MVA AVG SIZE 0 MVA AVSIZ TR2-ST 37.50 MVA AVSIZ TR2-ST2 28.50NUMBER 16 NUMBER 2 NUMBER 2 NUMBER 2
SUBTRANS1,2,&3 STEP UPS SUBTRANS1 69 KV SUBTRANS2 46 KV SUBTRANS2 35 KV SUBTRANS CUSTLDNG ST1SU 0.00% LOADING 0.00% LOADING 0.00% LOADING 0.00% SUBS - MW 0.000NO LOAD 0.000 MW LOAD LOSS 13.669 MW LOAD LOSS 3.794 MW LOAD LOSS 0.010 MW MVA 0.000LOAD 0.000 MW NOLD LOSS 0.000 MW NOLD LOSS 0.000 MW NOLD LOSS 0.006 MW LINES- MW AVSIZ ST2 0.0 MVA MVANUMBER 0
TO DISTRIBUTION SYSTEM
TOTAL 1081.7 MVA 1060.1 MW
TRANS1 21.2 MVA TRANS2 244.9 MVA SUBTRANS1 650.3 MVA SUBTRANS2 159.5 MVA SUBTRANS3 5.8 MVA1.96% 22.64% 60.11% 14.75% 0.54%
161 KV 138 KV 69 KV 46 KV 35 KV
KPCO 2011 LOSS B 4/17/2013 12:46 PM
Case No. 2016-00281 Commission Staff's First Set of Data Requests
Order Dated September 12, 2016 Item No. 4
Attachment 1 Page 23 of 33

KENTUCKY POWER 2011 LOSS ANALYSIS
FROM HIGH VOLTAGE SYSTEM EXHIBIT 4 PAGE 2 of 2
TOTAL 1,082 MVA 1,060 MW
TRANS1 21.2 MVA TRANS2 244.9 MVA SUBTRANS1 650.3 MVA SUBTRANS2 159.5 MVA SUBTRANS3 5.8 MVA1.96% 22.64% 60.11% 14.75% 0.54%
161 KV 138 KV 69 KV 46 KV 35 KV
DISTRIBUTION SYSTEM LOAD| | | | | | | | | | | | | | |
PRIM1 PRIM2 PRIM3 PRIM1 PRIM2 PRIM3 PRIM1 PRIM2 PRIM3 PRIM1 PRIM2 PRIM3 PRIM1 PRIM2 PRIM3VOLTAGE 33 12 1 33 12 1 33 12 1 33 12 1 33 12 1LOAD MVA 21 0 0 191 54 0 172 477 2 70 89 0 0 6 0% SYS TOT 1.96% 0.00% 0.00% 17.63% 5.01% 0.00% 15.91% 44.06% 0.15% 6.50% 8.23% 0.02% 0.00% 0.54% 0.00%NOLD LOSS 0.031 0.000 0.000 0.332 0.083 0.000 0.257 0.825 0.024 0.102 0.191 0.002 0.000 0.009 0.000LOAD LOSS 0.084 0.000 0.000 0.534 0.179 0.000 0.558 1.786 0.001 0.207 0.335 0.000 0.000 0.042 0.000AVG SIZE 12.0 0.0 0.0 23.8 16.8 0.0 17.4 11.5 7.5 21.8 10.7 1.0 0.0 5.0 0.0NUMBER 2 0 0 12 4 0 12 54 2 4 13 1 0 1 0DIVERSITY 1.000 0.000 0.000 1.000 1.000 0.000 1.000 1.000 1.000 1.000 1.000 1.000 0.000 1.000 0.000RATIO | | | | | | | | | | | | | | |
PRIMARY LINES PRIM/PRIM TRANSF PRIM CUST LOADSLOADING 1054.312 MW LOADING 11.603 MW NO LINES 0.000 MW@ SYS PF 1075.828 MVA NOLD LOSS 0.037 MW CUST SUB 0.000 MVALOAD LOSS 13.136 MW LOAD LOSS 0.042 MW NO LINES 0.000 MWNOLD LOSS 0.000 MW AVG SIZE 5.31 CO. SUB 0.000 MVATOT LOSS 13.136 MW NUMBER 4 PRIM WITH 74.700 MW
LINES 81.196 MVA
LINE TRANSFORMERSLOADING 966.397 MW MVA 1070.622NOLD LOSS 10.149 MWLOAD LOSS 4.227 MWAVG SIZE 32.4 KVANUMBER 98137
SECONDARY LINES NO SECONDARY LINESLOAD 383.057 MW LOAD LOSS 4.736 MW LOAD 568.964 MWNOLD LOSS 0.000 MW TOT LOSS 4.736 MW
SERVICESLOAD 947.285 MWLOAD LOSS 5.622 MWNOLD LOSS 0.364 MWTOT LOSS 5.985 MW
CUSTOMER SECONDARY LOAD
941.300 MW
KPCO 2011 LOSS B 4/17/2013 12:46 PM
Case No. 2016-00281 Commission Staff's First Set of Data Requests
Order Dated September 12, 2016 Item No. 4
Attachment 1 Page 24 of 33
KENTUCKY POWER 2011 LOSS ANALYSIS
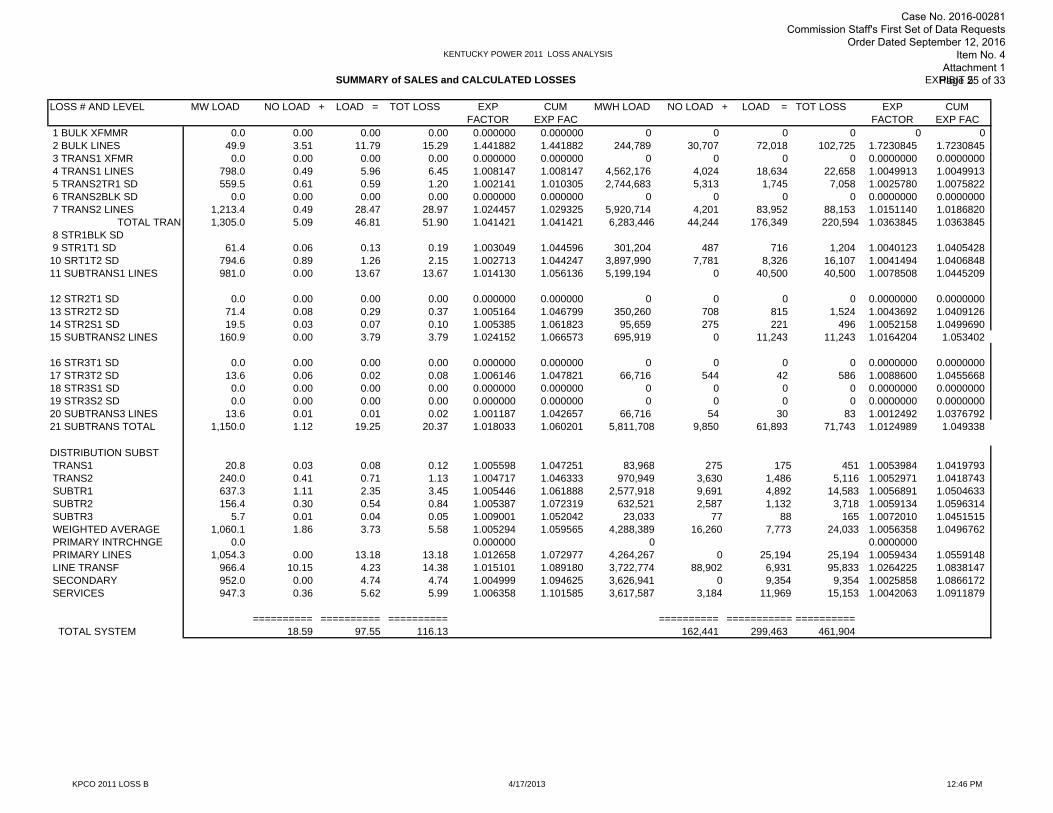
SUMMARY of SALES and CALCULATED LOSSES EXHIBIT 5
LOSS # AND LEVEL MW LOAD NO LOAD + LOAD = TOT LOSS EXP CUM MWH LOAD NO LOAD + LOAD = TOT LOSS EXP CUMFACTOR EXP FAC FACTOR EXP FAC
1 BULK XFMMR 0.0 0.00 0.00 0.00 0.000000 0.000000 0 0 0 0 0 0 2 BULK LINES 49.9 3.51 11.79 15.29 1.441882 1.441882 244,789 30,707 72,018 102,725 1.7230845 1.7230845 3 TRANS1 XFMR 0.0 0.00 0.00 0.00 0.000000 0.000000 0 0 0 0 0.0000000 0.0000000 4 TRANS1 LINES 798.0 0.49 5.96 6.45 1.008147 1.008147 4,562,176 4,024 18,634 22,658 1.0049913 1.0049913 5 TRANS2TR1 SD 559.5 0.61 0.59 1.20 1.002141 1.010305 2,744,683 5,313 1,745 7,058 1.0025780 1.0075822 6 TRANS2BLK SD 0.0 0.00 0.00 0.00 0.000000 0.000000 0 0 0 0 0.0000000 0.0000000 7 TRANS2 LINES 1,213.4 0.49 28.47 28.97 1.024457 1.029325 5,920,714 4,201 83,952 88,153 1.0151140 1.0186820
TOTAL TRAN 1,305.0 5.09 46.81 51.90 1.041421 1.041421 6,283,446 44,244 176,349 220,594 1.0363845 1.0363845 8 STR1BLK SD 9 STR1T1 SD 61.4 0.06 0.13 0.19 1.003049 1.044596 301,204 487 716 1,204 1.0040123 1.040542810 SRT1T2 SD 794.6 0.89 1.26 2.15 1.002713 1.044247 3,897,990 7,781 8,326 16,107 1.0041494 1.040684811 SUBTRANS1 LINES 981.0 0.00 13.67 13.67 1.014130 1.056136 5,199,194 0 40,500 40,500 1.0078508 1.0445209
12 STR2T1 SD 0.0 0.00 0.00 0.00 0.000000 0.000000 0 0 0 0 0.0000000 0.000000013 STR2T2 SD 71.4 0.08 0.29 0.37 1.005164 1.046799 350,260 708 815 1,524 1.0043692 1.040912614 STR2S1 SD 19.5 0.03 0.07 0.10 1.005385 1.061823 95,659 275 221 496 1.0052158 1.049969015 SUBTRANS2 LINES 160.9 0.00 3.79 3.79 1.024152 1.066573 695,919 0 11,243 11,243 1.0164204 1.053402
16 STR3T1 SD 0.0 0.00 0.00 0.00 0.000000 0.000000 0 0 0 0 0.0000000 0.000000017 STR3T2 SD 13.6 0.06 0.02 0.08 1.006146 1.047821 66,716 544 42 586 1.0088600 1.045566818 STR3S1 SD 0.0 0.00 0.00 0.00 0.000000 0.000000 0 0 0 0 0.0000000 0.000000019 STR3S2 SD 0.0 0.00 0.00 0.00 0.000000 0.000000 0 0 0 0 0.0000000 0.000000020 SUBTRANS3 LINES 13.6 0.01 0.01 0.02 1.001187 1.042657 66,716 54 30 83 1.0012492 1.037679221 SUBTRANS TOTAL 1,150.0 1.12 19.25 20.37 1.018033 1.060201 5,811,708 9,850 61,893 71,743 1.0124989 1.049338
DISTRIBUTION SUBST TRANS1 20.8 0.03 0.08 0.12 1.005598 1.047251 83,968 275 175 451 1.0053984 1.0419793 TRANS2 240.0 0.41 0.71 1.13 1.004717 1.046333 970,949 3,630 1,486 5,116 1.0052971 1.0418743 SUBTR1 637.3 1.11 2.35 3.45 1.005446 1.061888 2,577,918 9,691 4,892 14,583 1.0056891 1.0504633 SUBTR2 156.4 0.30 0.54 0.84 1.005387 1.072319 632,521 2,587 1,132 3,718 1.0059134 1.0596314 SUBTR3 5.7 0.01 0.04 0.05 1.009001 1.052042 23,033 77 88 165 1.0072010 1.0451515 WEIGHTED AVERAGE 1,060.1 1.86 3.73 5.58 1.005294 1.059565 4,288,389 16,260 7,773 24,033 1.0056358 1.0496762 PRIMARY INTRCHNGE 0.0 0.000000 0 0.0000000 PRIMARY LINES 1,054.3 0.00 13.18 13.18 1.012658 1.072977 4,264,267 0 25,194 25,194 1.0059434 1.0559148 LINE TRANSF 966.4 10.15 4.23 14.38 1.015101 1.089180 3,722,774 88,902 6,931 95,833 1.0264225 1.0838147 SECONDARY 952.0 0.00 4.74 4.74 1.004999 1.094625 3,626,941 0 9,354 9,354 1.0025858 1.0866172 SERVICES 947.3 0.36 5.62 5.99 1.006358 1.101585 3,617,587 3,184 11,969 15,153 1.0042063 1.0911879
========== ========== ========== ========== =========== ========== TOTAL SYSTEM 18.59 97.55 116.13 162,441 299,463 461,904
KPCO 2011 LOSS B 4/17/2013 12:46 PM
Case No. 2016-00281 Commission Staff's First Set of Data Requests
Order Dated September 12, 2016 Item No. 4
Attachment 1 Page 25 of 33

KENTUCKY POWER 2011 LOSS ANALYSIS
DEVELOPMENT of LOSS FACTORS EXHIBIT 6UNADJUSTED
DEMAND
LOSS FACTOR CUSTOMER CALC LOSS SALES MW CUM PEAK EXPANSION LEVEL SALES MW TO LEVEL @ GEN FACTORS
a b c d 1/d
BULK LINES 0.0 0.0 0.0 0.00000 0.00000 TRANS SUBS 0.0 0.0 0.0 0.00000 0.00000 TRANS LINES 73.0 3.0 76.0 1.04142 0.96023TOTAL TRANS 0.0 0.0 0.0 0.00000 0.00000SUBTRANS 316.3 19.0 335.3 1.06020 0.94322 PRIM SUBS 0.0 0.0 0.0 0.00000 0.00000 PRIM LINES 74.7 5.5 80.2 1.07298 0.93199 SECONDARY 941.3 95.6 1,036.9 1.10158 0.90778
TOTALS 1,405.3 123.1 1,528.4
DEVELOPMENT of LOSS FACTORSUNADJUSTED
ENERGY
LOSS FACTOR CUSTOMER CALC LOSS SALES MWH CUM ANNUAL EXPANSION LEVEL SALES MWH TO LEVEL @ GEN FACTORS
a b c d 1/d
BULK LINES 0 0 0 0.00000 0.00000 TRANS SUBS 0 0 0 0.00000 0.00000 TRANS LINES 526,918 19,172 546,090 1.03638 0.96489TOTAL TRANS 0 0 0 0.00000 0.00000SUBTRANS 2,466,746 121,705 2,588,451 1.04934 0.95298 PRIM SUBS 0 0 0 0.00000 0.00000 PRIM LINES 516,299 28,869 545,168 1.05591 0.94705 SECONDARY 3,602,434 328,498 3,930,932 1.09119 0.91643
TOTALS 7,112,397 498,243 7,610,640
ESTIMATED VALUES AT GENERATION LOSS FACTOR AT VOLTAGE LEVEL MW MWH BULK LINES 0.00 0 TRANS SUBS 0.00 0 TRANS LINES 76.02 546,090 SUBTRANS SUBS 0.00 0 SUBTRANS LINES 335.34 2,588,451 PRIM SUBS 0.00 0 PRIM LINES 80.15 545,168 SECONDARY 1,036.92 3,930,932
SUBTOTAL 1,528.44 7,610,640
ACTUAL ENERGY 1,530.76 7,591,389
MISSMATCH (2.32) 19,251
% MISSMATCH -0.15% 0.25%
KPCO 2011 LOSS B 4/17/2013 12:46 PM
Case No. 2016-00281 Commission Staff's First Set of Data Requests
Order Dated September 12, 2016 Item No. 4
Attachment 1 Page 26 of 33

KENTUCKY POWER 2011 LOSS ANALYSIS
DEVELOPMENT of LOSS FACTORS EXHIBIT 7ADJUSTEDDEMAND
LOSS FACTOR CUSTOMER SALES CALC LOSS SALES MW CUM PEAK EXPANSION LEVEL SALES MW ADJUST TO LEVEL @ GEN FACTORS
a b c d e f=1/e
BULK LINES 0.0 0.0 0.0 0.0 0.00000 0.00000 TRANS SUBS 0.0 0.0 0.0 0.0 0.00000 0.00000 TRANS LINES 73.0 0.0 3.1 76.1 1.04223 0.95948TOTAL TRANS 0.0 0.0 0.0 0.0 0.00000 0.00000SUBTRANS 316.3 0.0 19.4 335.7 1.06139 0.94216 PRIM SUBS 0.0 0.0 0.0 0.0 0.00000 0.00000 PRIM LINES 74.7 0.0 5.5 80.2 1.07358 0.93146 SECONDARY 941.3 0.0 97.5 1,038.8 1.10354 0.90617
125.5 TOTALS 1,405.3 0.0 125.5 1,530.8
DEVELOPMENT of LOSS FACTORSADJUSTEDENERGY
LOSS FACTOR CUSTOMER SALES CALC LOSS SALES MWH CUM ANNUAL EXPANSION LEVEL SALES MWH ADJUST TO LEVEL @ GEN FACTORS
a b c d e f=1/e
BULK LINES 0 0 0 0 0.00000 0.00000 TRANS SUBS 0 0 0 0 0.00000 0.00000 TRANS LINES 526,918 0 18,345 545,263 1.03482 0.96636TOTAL TRANS 0 0 0 0 0.00000 0.00000SUBTRANS 2,466,746 0 116,440 2,583,186 1.04720 0.95492 PRIM SUBS 0 0 0 0 0.00000 0.00000 PRIM LINES 516,299 0 28,579 544,878 1.05535 0.94755 SECONDARY 3,602,434 0 315,620 3,918,054 1.08761 0.91944
478,983 TOTALS 7,112,397 0 478,992 7,591,380
ESTIMATED VALUES AT GENERATION LOSS FACTOR AT VOLTAGE LEVEL MW MWH BULK LINES 0.00 0 TRANS SUBS 0.00 0 TRANS LINES 76.08 545,263 SUBTRANS SUBS 0.00 0 SUBTRANS LINES 335.72 2,583,186 PRIM SUBS 0.00 0 PRIM LINES 80.20 544,878 SECONDARY 1,038.77 3,918,054
1,530.76 7,591,380
ACTUAL ENERGY 1,530.76 7,591,389
MISSMATCH 0.00 (9)
% MISSMATCH 0.00% 0.00%
KPCO 2011 LOSS B 4/17/2013 12:47 PM
Case No. 2016-00281 Commission Staff's First Set of Data Requests
Order Dated September 12, 2016 Item No. 4
Attachment 1 Page 27 of 33

KENTUCKY POWER 2011 LOSS ANALYSIS
Adjusted Losses and Loss Factors by Facility EXHIBIT 8
MW Unadjusted MWH UnadjustedService Drop Losses 5.99 6.94 15,153 18,400Secondary Losses 4.74 5.49 9,354 11,359Line Transformer Losses 14.38 16.67 95,833 116,370Primary Line Losses 13.18 15.28 25,194 30,594Distribution Substation Losses 5.58 6.47 24,033 29,183Subtransmission Losses 20.37 20.37 71,743 71,743Transmission System Losses 51.90 51.90 220,594 220,594Total 116.13 123.14 461,904 498,243
MW MWH Note adjusting Service Drop Losses -0.13 632 632Secondary Losses -0.10 390 390Line Transformer Losses -0.31 3,994 3,994Primary Line Losses -0.29 1,050 1,050Distribution Substation Losses -0.12 1,002 1,002Subtransmission Losses -0.38 2,990 2,990Transmission System Losses -0.98 9,194 9,194Total -2.32 19,251 19,251
19,251
MW % of Total MWH % of TotalService Drop Losses 7.07 5.6% 17,769 3.7%Secondary Losses 5.60 4.5% 10,969 2.3%Line Transformer Losses 16.99 13.5% 112,376 23.5%Primary Line Losses 15.57 12.4% 29,544 6.2%Distribution Substation Losses 6.60 5.3% 28,182 5.9%Subtransmission Losses 20.75 16.5% 68,753 14.4%Transmission System Losses 52.88 42.2% 211,400 44.1%Total 125.46 100.0% 478,992 100.0%
Retail Sales from Service Drops 941.30 3,602,434Adjusted Service Drop Losses 7.07 17,769Input to Service Drops 948.37 3,620,203Service Drop Loss Factor 1.00751 1.00493
Output from Secondary 948.37 3,620,203Adjusted Secondary Losses 5.60 10,969Input to Secondary 953.97 3,631,172Secondary Conductor Loss Factor 1.00590 1.00303
Output from Line Transformers 953.97 3,631,172Adjusted Line Transformer Losses 16.99 112,376Input to Line Transformers 970.95 3,743,548Line Transformer Loss Factor 1.01781 1.03095
Secondary Composite 1.03150 1.03917Retail Sales from Primary 74.70 516,299Req. Whls Sales from Primary 0.00 0Input to Line Transformers 970.95 3,743,548Output from Primary Lines 1045.65 4,259,847Adjusted Primary Line Losses 15.57 29,544Input to Primary Lines 1061.23 4,289,391Primary Line Loss Factor 1.01489 1.00694
Out TO PR from Distribution Substations 1061.23 4,289,391Req. Whls Sales from Substations 0.00 0Retail Sales from Substations 0.00 0TotalOutput from Distribution Substations 1061.23 4,289,391Adjusted Distribution Substation Losses 6.60 28,182Input to Distribution Substations 1067.82 4,317,572Distribution Substation Loss Factor 1.00622 1.00657
Retail Sales at from SubTransmission 310.10 2,438,725Req. Whls Sales from SubTransmission 6.20 28,021Input to Distribution Substations 799.30 3,233,472Output from SubTransmission 1129.25 5,742,955Adjusted SubTransmission System Losses 20.75 68,753Input to SubTransmission 1150.00 5,811,708SubTransmission Loss Factor 1.01838 1.01197OUT DISTR SUBS 260.77 1,054,917Retail Sales at from Transmission 58.50 459,332Req. Whls Sales from Transmission 14.50 67,586Input Subtransmission 918.35 4,490,212Output from Transmission 1252.12 6,072,046Adjusted Transmission System Losses 52.88 211,400Input to Transmission 1305.00 6,283,446Transmission Loss Factor 1.04223 1.03482
Mismatch Allocation by Segment
Adjusted Losses by Segment
Unadjusted Losses by Segment
Loss Factors by Segment MW MWH
KPCO 2011 LOSS B 4/17/2013 12:47 PM
Case No. 2016-00281 Commission Staff's First Set of Data Requests
Order Dated September 12, 2016 Item No. 4
Attachment 1 Page 28 of 33

DEMAND MW SUMMARY OF LOSSES AND LOSS FACTORS BY DELIVERY VOLTAGE EXHIBIT 9PAGE 1 of 2
SERVICE SALES LOSSES SECONDARY PRIMARY SUBSTATION SUBTRANS TRANSMISSIONLEVEL MW
1 SERVICES2 SALES 941.30 941.33 LOSSES 7.1 7.14 INPUT 948.45 EXPANSION FACTOR 1.00751
6 SECONDARY7 SALES8 LOSSES 5.6 5.69 INPUT 954.010 EXPANSION FACTOR 1.00590
11 LINE TRANSFORMER12 SALES13 LOSSES 17.0 17.014 INPUT 971.015 EXPANSION FACTOR 1.01781
16 PRIMARY17 SECONDARY 971.018 SALES 74.70 74.719 LOSSES 15.6 14.5 1.120 INPUT21 EXPANSION FACTOR 1.01489
22 SUBSTATION23 PRIMARY 985.4 75.824 SALES 0.025 LOSSES 6.6 6.1 0.526 INPUT 991.5 76.327 EXPANSION FACTOR 1.00622
28 SUB-TRANSMISSION29 DISTRIBUTION SUBS 724.3 75.030 SALES 316.30 316.331 LOSSES 20.8 13.3 1.4 5.832 INPUT 737.6 76.4 322.133 EXPANSION FACTOR 1.01838
34 TRANSMISSION35 SUBTRANSMISSION 523.7 54.2 322.136 DISTRIBUTION SUBS 259.5 1.337 SALES 73.00 73.038 LOSSES 52.9 33.1 2.3 13.6 3.139 INPUT 817.6 57.9 335.7 76.140 EXPANSION FACTOR 1.04223
41 TOTALS LOSSES CALCULATED 125.5 96.6 5.3 19.4 3.1SCALED 125.5 97.5 5.5 19.4 3.1
42 % OF TOTAL 100% 77.69% 4.38% 15.48% 2.46%
43 SALES 1,405.3 941.3 74.7 316.3 73.044 % OF TOTAL 100.00% 66.98% 5.32% 22.51% 5.19%
45 INPUT 1,530.8 1,038.8 80.2 335.7 76.1
46 CUMMULATIVE EXPANSION LOSS FACTORS 1.10354 1.07358 NA 1.06139 1.04223(from meter to system input)
Case No. 2016-00281 Commission Staff's First Set of Data Requests
Order Dated September 12, 2016 Item No. 4
Attachment 1 Page 29 of 33

ENERGY MWH SUMMARY OF LOSSES AND LOSS FACTORS BY DELIVERY VOLTAGE EXHIBIT 9PAGE 2 of 2
SERVICE SALES LOSSES SECONDARY PRIMARY SUBSTATION SUBTRANS TRANSMISSIONLEVEL
1 SERVICES2 SALES 3,602,434 3,602,4343 LOSSES 17,769 17,7694 INPUT 3,620,2035 EXPANSION FACTOR 1.00493
6 SECONDARY7 SALES8 LOSSES 10,969 10,9699 INPUT 3,631,17210 EXPANSION FACTOR 1.00303
11 LINE TRANSFORMER12 SALES13 LOSSES 112,376 112,37614 INPUT 3,743,54815 EXPANSION FACTOR 1.03095
16 PRIMARY17 SECONDARY 3,743,54818 SALES 516,299.000 516,29919 LOSSES 29,544 25,963 3,58120 INPUT21 EXPANSION FACTOR 1.00694
22 SUBSTATION23 PRIMARY 3,769,511 519,88024 SALES 025 LOSSES 28,182 24,766 3,41626 INPUT 3,794,277 523,29527 EXPANSION FACTOR 1.00657
28 SUB-TRANSMISSION29 DISTRIBUTION SUBS 3,173,472 60,00030 SALES 2,466,746 2,466,74631 LOSSES 68,753 37,992 718 29,53132 INPUT 3,211,464 60,718 2,496,27733 EXPANSION FACTOR 1.01197
34 TRANSMISSION35 SUBTRANSMISSION 1,926,879 60,718 2,496,27736 DISTRIBUTION SUBS 591,621 463,29537 SALES 526,918 526,91838 LOSSES 211,400 87,682 16,130 86,908 18,34539 INPUT 2,606,182 479,425 2,583,186 545,26340 EXPANSION FACTOR 1.03482
41 TOTALS LOSSES Calculated 478,992 317,517 23,844 116,440 18,345Scaled 478,983 315,620 28,579 116,440 18,345
42 % OF TOTAL 100% 66.29% 4.98% 3.83%
43 SALES 7,112,397 3,602,434 516,299 2,466,746 526,91844 % OF TOTAL 100.00% 50.65% 7.26% 34.68% 7.41%
45 INPUT 7,591,380 3,918,054 544,878 2,583,186 545,263
46 CUMMULATIVE EXPANSION LOSS FACTORS 1.08761 1.05535 NA 1.04720 1.03482(from meter to system input)
Case No. 2016-00281 Commission Staff's First Set of Data Requests
Order Dated September 12, 2016 Item No. 4
Attachment 1 Page 30 of 33
Kentucky Power Company 2011 Analysis of System Losses
Appendix B
Discussion of Hoebel Coefficient
Case No. 2016-00281 Commission Staff's First Set of Data Requests
Order Dated September 12, 2016 Item No. 4
Attachment 1 Page 31 of 33

1
COMMENTS ON THE HOEBEL COEFFICIENT The Hoebel coefficient represents an established industry standard relationship between peak losses and average losses and is used in a loss study to estimate energy losses from peak demand losses. H. F. Hoebel described this relationship in his article, "Cost of Electric Distribution Losses," Electric Light and Power, March 15, 1959. A copy of this article is attached. Within any loss evaluation study, peak demand losses can readily be calculated given equipment resistance and approximate loading. Energy losses, however, are much more difficult to determine given their time-varying nature. This difficulty can be reduced by the use of an equation which relates peak load losses (demand) to average losses (energy). Once the relationship between peak and average losses is known, average losses can be estimated from the known peak load losses. Within the electric utility industry, the relationship between peak and average losses is known as the loss factor. For definitional purposes, loss factor is the ratio of the average power loss to the peak load power loss, during a specified period of time. This relationship is expressed mathematically as follows:
where: FLS = Loss Factor
ALS = Average Losses PLS = Peak Losses
The loss factor provides an estimate of the degree to which the load loss is maintained throughout the period in which the loss is being considered. In other words, loss factor is the ratio of the actual kWh losses incurred to the kWh losses which would have occurred if full load had continued throughout the period under study. Examining the loss factor expression in light of a similar expression for load factor indicates a high degree of similarity. The mathematical expression for load factor is as follows:
where: FLD = Load Factor
ALD = Average Load PLD = Peak Load
This load factor result provides an estimate of the degree to which the load loss is maintained throughout the period in which the load is being considered. Because of the similarities in definition, the loss factor is sometimes called the "load factor of losses." While the definitions are similar, a strict equating of the two factors cannot be made. There does exist, however, a relationship between these two factors which is dependent upon the shape of the load duration curve. Since resistive losses vary as the square of the load, it can be shown mathematically that the loss factor can vary between the extreme limits of load factor and load factor squared. The relationship between load factor and loss factor has become an industry standard and is as follows:
(1) FLS ALS PLS
(2) FLD ALD PLD
Case No. 2016-00281 Commission Staff's First Set of Data Requests
Order Dated September 12, 2016 Item No. 4
Attachment 1 Page 32 of 33

2
where: FLS = Loss Factor
FLD = Load Factor H = Hoebel Coeff
As noted in the attached article, the suggested value for H (the Hoebel coefficient) is 0.7. The exact value of H will vary as a function of the shape of the utility's load duration curve. In recent years, values of H have been computed directly for a number of utilities based on EEI load data. It appears on this basis, the suggested value of 0.7 should be considered a lower bound and that values approaching unity may be considered a reasonable upper bound. Based on experience, values of H have ranged from approximately 0.85 to 0.95. The standard default value of 0.9 is generally used. Inserting the Hoebel coefficient estimate gives the following loss factor relationship using Equation (3): Once the Hoebel constant has been estimated and the load factor and peak losses associated with a piece of equipment have been estimated, one can calculate the average, or energy losses as follows:
where: ALS = Average Losses
PLS = Peak Losses H = Hoebel Coefficient
FLD = Load Factor Loss studies use this equation to calculate energy losses at each major voltage level in the analysis.
(3) FLS H*FLD2 + (1-H)*FLD
(4) FLS 0.90*FLD2 + 0.10*FLD
(5) ALS PLS * [H*FLD2 + (1-H)*FLD]
Case No. 2016-00281 Commission Staff's First Set of Data Requests
Order Dated September 12, 2016 Item No. 4
Attachment 1 Page 33 of 33