kentucky infrastructure authority. kentucky...2012-2016, the utility’s service area population was...
TRANSCRIPT

Kentucky Infrastructure Authority Projects for
March 2019 Capital Projects Meeting
• Fund A Loan
Loan # Borrower Loan Amount County A19-026 City of La Center $ 1.050,049 Ballard A19-045 City of Burkesville $ 251,000 Cumberland A19-047 City of Bardstown $ 5,400,000 Nelson
1
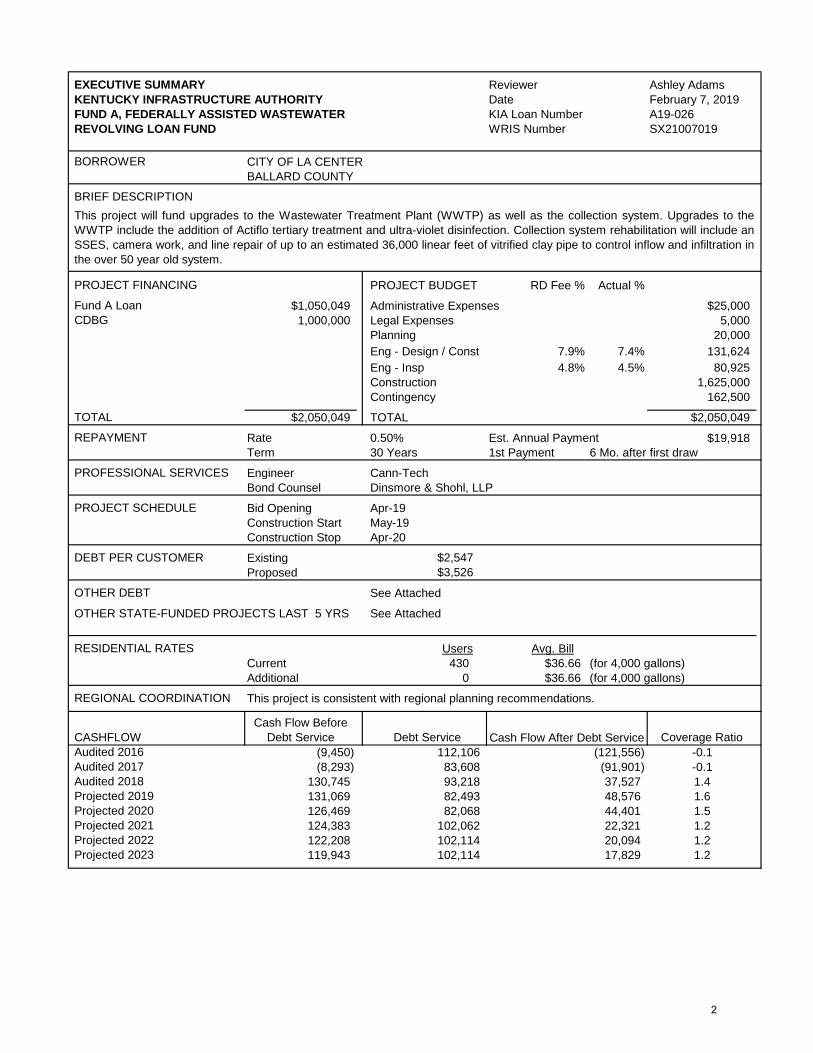
EXECUTIVE SUMMARY Reviewer Ashley AdamsKENTUCKY INFRASTRUCTURE AUTHORITY Date February 7, 2019FUND A, FEDERALLY ASSISTED WASTEWATER KIA Loan Number A19-026REVOLVING LOAN FUND WRIS Number SX21007019
BORROWER CITY OF LA CENTERBALLARD COUNTY
BRIEF DESCRIPTION
PROJECT FINANCING PROJECT BUDGET RD Fee % Actual %Fund A Loan $1,050,049 Administrative Expenses $25,000CDBG 1,000,000 Legal Expenses 5,000
Planning 20,000 Eng - Design / Const 7.9% 7.4% 131,624 Eng - Insp 4.8% 4.5% 80,925 Construction 1,625,000 Contingency 162,500
TOTAL $2,050,049 TOTAL $2,050,049REPAYMENT Rate 0.50% Est. Annual Payment $19,918
Term 30 Years 1st Payment 6 Mo. after first drawPROFESSIONAL SERVICES Engineer Cann-Tech
Bond Counsel Dinsmore & Shohl, LLPPROJECT SCHEDULE Bid Opening Apr-19
Construction Start May-19Construction Stop Apr-20
DEBT PER CUSTOMER Existing $2,547 Proposed $3,526
OTHER DEBT See Attached
OTHER STATE-FUNDED PROJECTS LAST 5 YRS See Attached
RESIDENTIAL RATES Users Avg. BillCurrent 430 $36.66 (for 4,000 gallons)Additional 0 $36.66 (for 4,000 gallons)
REGIONAL COORDINATION
CASHFLOWCash Flow Before
Debt Service Debt Service Coverage RatioAudited 2016 (9,450) 112,106 -0.1Audited 2017 (8,293) 83,608 -0.1Audited 2018 130,745 93,218 1.4Projected 2019 131,069 82,493 1.6Projected 2020 126,469 82,068 1.5Projected 2021 124,383 102,062 1.2Projected 2022 122,208 102,114 1.2Projected 2023 119,943 102,114 1.2
(121,556)
This project is consistent with regional planning recommendations.
20,09417,829
(91,901)37,52748,57644,40122,321
This project will fund upgrades to the Wastewater Treatment Plant (WWTP) as well as the collection system. Upgrades to theWWTP include the addition of Actiflo tertiary treatment and ultra-violet disinfection. Collection system rehabilitation will include anSSES, camera work, and line repair of up to an estimated 36,000 linear feet of vitrified clay pipe to control inflow and infiltration inthe over 50 year old system.
Cash Flow After Debt Service
2

Reviewer: Ashley Adams Date: February 7, 2019
Loan Number: A19-026
KENTUCKY INFRASTRUCTURE AUTHORITY WASTEWATER REVOLVING LOAN FUND (FUND A)
CITY OF LA CENTER, BALLARD COUNTY PROJECT REVIEW
SX21007019
I. PROJECT DESCRIPTION
The City of La Center is requesting a Fund A loan in the amount of $1,050,049 for theWastewater Treatment Plant Upgrade and I/I Reduction project. This project willconsist of upgrading the Wastewater Treatment Plant and the collection system. TheCity is under an agreed order (DOW 130159). The City plans to upgrade the WWTPby adding Actiflo tertiary treatment and ultra-violet disinfection to ensure effluent fallswithin their permitted limits. The City discharges into an Impaired Stream, HumphreyCreek, and must meet stringent discharge limits. Other work at the treatment plant willbe done to ensure the proper operation of all components including a sludge pumpstation, slide gates, and necessary yard piping.
The city’s gravity system was constructed in excess of 50 years ago and is mostlyVitrified Clay pipe. The pipes have deteriorated significantly over time and arecontributing excessive inflow/infiltration into the system. The city has been doing repairwork based on the 2000 SSES report with its own funds. In order to continue thenecessary repairs a new SSES study and report is required, as well as, the estimated36,000 linear feet of line that will need repair. The majority of the line repairs will utilizetrenchless technology methods (I.E. Cured-in-place pipe, pipe bursting, etc.). Thisapproach will reduce disturbance to the community during construction, reduce thestrain on the WWTP, adding to its longevity and resulting in substantial improvementsto the customers’ service. The City will also complete camera work to determine themost egregious portions for Inflow and Infiltration of their system. Once those portionsare identified, the city will rehab the system lines.
The City of La Center provides sewer service to 364 residential and 66 commercialcustomers and water service to 372 residential and 73 commercial customers inBallard County.
3

II. PROJECT BUDGETTotal
Administrative Expenses $ 25,000 Legal Expenses 5,000 Planning 20,000 Engineering Fees - Design 92,137 Engineering Fees - Construction 39,487 Engineering Fees - Inspection 80,925 Construction 1,625,000 Contingency 162,500
Total $ 2,050,049
III. PROJECT FUNDINGAmount %
Fund A Loan $ 1,050,049 51% CDBG 1,000,000 49%
Total $ 2,050,049 100%
IV. KIA DEBT SERVICE
Construction Loan $ 1,050,049 Less: Principal Forgiveness 525,025 Amortized Loan Amount $ 525,024 Interest Rate 0.50% Loan Term (Years) 30 Estimated Annual Debt Service $ 18,868 Administrative Fee (0.20%) 1,050 Total Estimated Annual Debt Service $ 19,918
V. PROJECT SCHEDULE
Bid Opening April 2019 Construction Start May 2019 Construction Stop April 2020
4

VI. CUSTOMER COMPOSITION AND RATE STRUCTURE A) Customers
Current Residential 364 Commercial 66 Total 430
B) Rates
Sewer Proposed* Current Prior Date of Last Rate Increase 04/01/19 03/14/17 01/11/11
First 3,000 Gallons $32.98 $16.25 $16.25 Next 2,000 Gallons (per 1,000 gallons) 4.22 2.50 2.50 All over 5,000 Gallons (per 1,000 gallons) 3.55 1.83 1.83 Capital Improvement Fee 8.00
Construction/Maintenance Flat Fee 5.11 5.11 Construction/Maintenance (per 1,000 gallons) 1.20 1.20
Cost for 4,000 gallons $37.20 $36.66 $28.66 Increase % 1.5% 27.9%
Affordability Index (Rate/MHI) 1.3% 1.3%
Water Proposed* Current Prior Date of Last Rate Increase 04/01/19 03/14/17 01/11/11
First 3,000 Gallons $32.98 $16.25 $16.25 Next 2,000 Gallons (per 1,000) 4.22 2.50 2.50 All over 5,000 Gallons (per 1,000) 3.55 1.83 1.83 Capital Improvement Fee 8.00
Construction/Maintenance Flat Fee 2.00 2.00 Construction/Maintenance (per 1,000 gallons) 1.72 1.72
Cost for 4,000 gallons $37.20 $35.63 $27.63 Increase % 4.4% 29.0%
Affordability Index (Rate/MHI) 1.3% 1.3%
The City will be implementing a CPI clause in their ordinance in addition to consolidating their rates. The first reading is expected to be February 12, 2019 and second reading expected March 12, 2019.
5
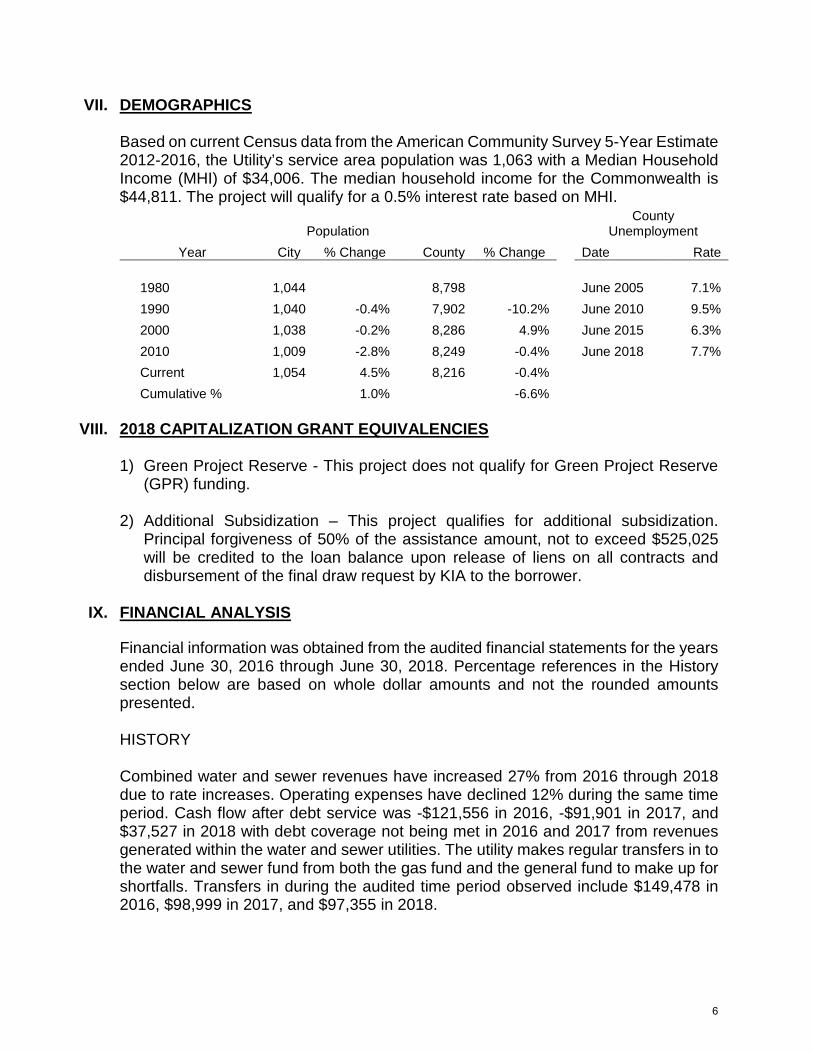
VII. DEMOGRAPHICS
Based on current Census data from the American Community Survey 5-Year Estimate2012-2016, the Utility’s service area population was 1,063 with a Median HouseholdIncome (MHI) of $34,006. The median household income for the Commonwealth is$44,811. The project will qualify for a 0.5% interest rate based on MHI.
Population County
Unemployment Year City % Change County % Change Date Rate
1980 1,044 8,798 June 2005 7.1% 1990 1,040 -0.4% 7,902 -10.2% June 2010 9.5% 2000 1,038 -0.2% 8,286 4.9% June 2015 6.3% 2010 1,009 -2.8% 8,249 -0.4% June 2018 7.7% Current 1,054 4.5% 8,216 -0.4%Cumulative % 1.0% -6.6%
VIII. 2018 CAPITALIZATION GRANT EQUIVALENCIES
1) Green Project Reserve - This project does not qualify for Green Project Reserve(GPR) funding.
2) Additional Subsidization – This project qualifies for additional subsidization.Principal forgiveness of 50% of the assistance amount, not to exceed $525,025will be credited to the loan balance upon release of liens on all contracts anddisbursement of the final draw request by KIA to the borrower.
IX. FINANCIAL ANALYSIS
Financial information was obtained from the audited financial statements for the yearsended June 30, 2016 through June 30, 2018. Percentage references in the Historysection below are based on whole dollar amounts and not the rounded amountspresented.
HISTORY
Combined water and sewer revenues have increased 27% from 2016 through 2018due to rate increases. Operating expenses have declined 12% during the same timeperiod. Cash flow after debt service was -$121,556 in 2016, -$91,901 in 2017, and$37,527 in 2018 with debt coverage not being met in 2016 and 2017 from revenuesgenerated within the water and sewer utilities. The utility makes regular transfers in tothe water and sewer fund from both the gas fund and the general fund to make up forshortfalls. Transfers in during the audited time period observed include $149,478 in2016, $98,999 in 2017, and $97,355 in 2018.
6
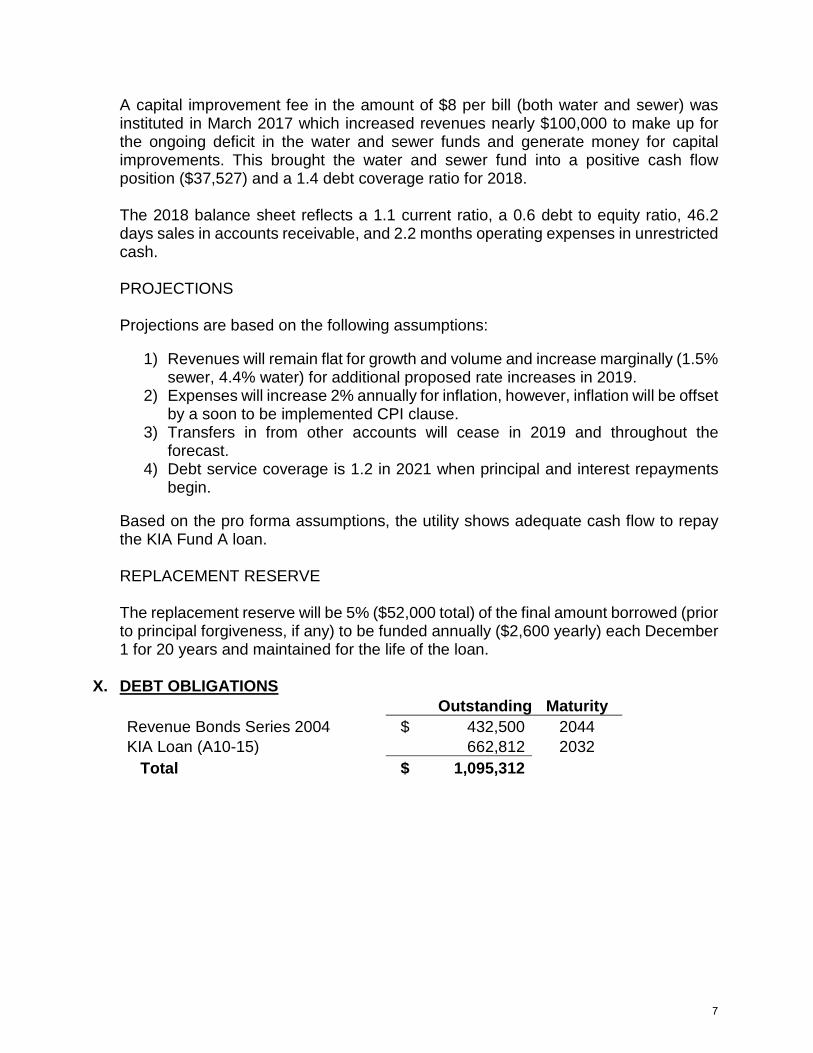
A capital improvement fee in the amount of $8 per bill (both water and sewer) was instituted in March 2017 which increased revenues nearly $100,000 to make up for the ongoing deficit in the water and sewer funds and generate money for capital improvements. This brought the water and sewer fund into a positive cash flow position ($37,527) and a 1.4 debt coverage ratio for 2018. The 2018 balance sheet reflects a 1.1 current ratio, a 0.6 debt to equity ratio, 46.2 days sales in accounts receivable, and 2.2 months operating expenses in unrestricted cash. PROJECTIONS Projections are based on the following assumptions:
1) Revenues will remain flat for growth and volume and increase marginally (1.5% sewer, 4.4% water) for additional proposed rate increases in 2019.
2) Expenses will increase 2% annually for inflation, however, inflation will be offset by a soon to be implemented CPI clause.
3) Transfers in from other accounts will cease in 2019 and throughout the forecast.
4) Debt service coverage is 1.2 in 2021 when principal and interest repayments begin.
Based on the pro forma assumptions, the utility shows adequate cash flow to repay the KIA Fund A loan. REPLACEMENT RESERVE The replacement reserve will be 5% ($52,000 total) of the final amount borrowed (prior to principal forgiveness, if any) to be funded annually ($2,600 yearly) each December 1 for 20 years and maintained for the life of the loan.
X. DEBT OBLIGATIONS Outstanding Maturity Revenue Bonds Series 2004 $ 432,500 2044 KIA Loan (A10-15) 662,812 2032 Total $ 1,095,312
7

XI. CONTACTS Legal Applicant
Entity Name City of La Center Authorized Official Nicky Hutcherson (Mayor) County Ballard Email [email protected] Phone 270-665-9140 Address PO Box 420 La Center, KY, 42056
Applicant Contact
Name Jody Brown Organization City of La Center Email [email protected] Phone 270-665-5162 Address PO Box 420 La Center, KY, 42056
Project Administrator
Name Bjarne Hansen Organization Purchase ADD Email [email protected] Phone 270-274-7171 Address PO Box 588 Mayfield, KY 42066
Consulting Engineer
PE Name Matthew Baker Firm Name Cann-Tech Email [email protected] Phone 502-859-0907 Address 1100 Glensboro Rd, Suite 9 Lawrenceburg, KY 40342
8

XII. RECOMMENDATIONS
KIA staff recommends approval of the loan with the standard conditions and the following special condition:
1. The City of La Center shall implement a CPI clause in their proposed rate ordinance, consolidate all miscellaneous fees into their normal rates by ordinance, and raise rates, at a minimum, as indicated in Section VI, B of this analysis. The ordinance will be reviewed and approved by KIA staff prior to execution.
9

CITY OF LA CENTERFINANCIAL SUMMARY (JUNE YEAR END)
Audited Audited Audited Projected Projected Projected Projected Projected2016 2017 2018 2019 2020 2021 2022 2023
Balance Sheet
AssetsCurrent Assets 76,650 69,688 121,538 131,915 141,395 146,460 151,078 167,673
Other Assets 2,859,247 2,785,124 2,765,446 3,738,306 4,656,576 4,532,156 4,405,956 4,263,680
Total 2,935,897 2,854,812 2,886,984 3,870,222 4,797,971 4,678,616 4,557,034 4,431,353
Liabilities & EquityCurrent Liabilities 116,536 125,212 106,985 110,043 112,311 114,595 116,495 60,494
Long Term Liabilities 1,194,951 1,144,382 1,091,827 1,302,780 1,510,775 1,454,874 1,397,973 1,348,902
Total Liabilities 1,311,487 1,269,594 1,198,812 1,412,823 1,623,086 1,569,469 1,514,468 1,409,396
Net Assets 1,624,410 1,585,218 1,688,172 2,457,399 3,174,885 3,109,147 3,042,566 3,021,957
Cash FlowRevenues 357,722 361,892 454,810 463,856 468,470 473,130 477,836 482,589
Operating Expenses 367,187 370,201 324,196 332,918 342,132 348,878 355,759 362,777
Other Income 15 16 131 131 131 131 131 131
Cash Flow Before Debt Service (9,450) (8,293) 130,745 131,069 126,469 124,383 122,208 119,943
Debt ServiceExisting Debt Service 112,106 83,608 93,218 82,493 82,068 82,144 82,196 82,196
Proposed KIA Loan 0 0 0 0 0 19,918 19,918 19,918
Total Debt Service 112,106 83,608 93,218 82,493 82,068 102,062 102,114 102,114
Cash Flow After Debt Service (121,556) (91,901) 37,527 48,576 44,401 22,321 20,094 17,829
RatiosCurrent Ratio 0.7 0.6 1.1 1.2 1.3 1.3 1.3 2.8
Debt to Equity 0.8 0.8 0.7 0.6 0.5 0.5 0.5 0.5
Days Sales in Accounts Receivable 61.0 47.5 46.2 46.2 46.2 46.2 46.2 46.2
Months Operating Expenses in Unrestricted Cash 0.5 0.6 2.2 2.5 2.8 2.9 3.0 3.5
Debt Coverage Ratio (0.1) (0.1) 1.4 1.6 1.5 1.2 1.2 1.2
10

EXECUTIVE SUMMARY Reviewer Meili SunKENTUCKY INFRASTRUCTURE AUTHORITY Date February 7, 2019FUND A, FEDERALLY ASSISTED WASTEWATER KIA Loan Number A19-045REVOLVING LOAN FUND WRIS Number SX21057002
BORROWER CITY OF BURKESVILLECUMBERLAND COUNTY
BRIEF DESCRIPTION
PROJECT FINANCING PROJECT BUDGET RD Fee % Actual %Fund A Loan Plan & Design $251,000 Planning 66,500
Eng - Design / Const 184,500 TOTAL $251,000 TOTAL $251,000REPAYMENT Rate 3.00% Est. Annual Payment $54,936
Term 5 Years 1st Payment 6 Mo. after first drawPROFESSIONAL SERVICES Engineer GRW Engineers, Inc
Bond Counsel Dinsmore & Shohl, LLPPROJECT SCHEDULE P&D Start Jul-18
P&D Completion Jun-19Bid Opening Mar-20
DEBT PER CUSTOMER Existing $4,781 Proposed $4,623
OTHER DEBT See Attached
RESIDENTIAL RATES Users Avg. BillCurrent 605 $31.41 (for 4,000 gallons)Additional 0 $31.41 (for 4,000 gallons)
REGIONAL COORDINATION
CASHFLOWCash Flow Before
Debt Service Debt Service Coverage RatioAudited 2016 233,234 209,353 1.1Audited 2017 222,159 233,209 1.0Audited 2018 383,109 249,609 1.5Projected 2019 371,411 243,115 1.5Projected 2020 359,449 279,951 1.3Projected 2021 347,218 282,538 1.2Projected 2022 334,712 281,890 1.2Projected 2023 321,926 282,234 1.1
23,881
This project is consistent with regional planning recommendations.
52,82239,692
(11,050)133,500128,29679,49864,680
This is the Planning and Design portion of the WWTP Improvements project. It will allow the City to evaluate the plant's currentcondition, create a Preliminary Engineering Report, identify needed improvements, evaluate options for future treatment limits,and make recommendations for improvements.
Cash Flow After Debt Service
11

Reviewer: Meili Sun Date: February 7, 2019
Loan Number: A19-045 P&D
KENTUCKY INFRASTRUCTURE AUTHORITY WASTEWATER REVOLVING LOAN FUND (FUND A) CITY OF BURKESVILLE, CUMBERLAND COUNTY
PROJECT REVIEW SX21057002
I. PROJECT DESCRIPTION
This the Planning and Design portion of the Waste Water Treatment Plant Improvements project. It will allow the City to evaluate the plant’s current condition, create a Preliminary Engineering Report, identify needed improvements, evaluate options for future treatment limits, and make recommendations for improvements. The project will improve the plant’s headworks facilities, which includes replacing the grit removal system and influent sampler, refurbishing the influent piping, HVAC, electrical and architectural components. It will replace the oxidation ditch equipment (motors, gear boxes, line shafts, bearings, etc.), the final clarifier equipment, and the chlorine gas disinfection system with a peracetic acid system. The scope of work also covers improvements to the chlorine contact basin, installation of new RAS/WAS pumping and new sludge processing equipment, upgrades to the existing electrical and instrumentation equipment, and replacement of an existing pump station that serves one major industrial customer. The system currently serves approximately 600 customers within the city limits and the Cumberland County and supplies wholesale water to the Cumberland County Water District which is regulated by the PSC.
II. PROJECT BUDGET
Total Planning $ 66,500 Engineering Fees – Design 184,500 Total $ 251,000
III. PROJECT FUNDING
Amount % KIA Fund A Loan $ 251,000 100%
12
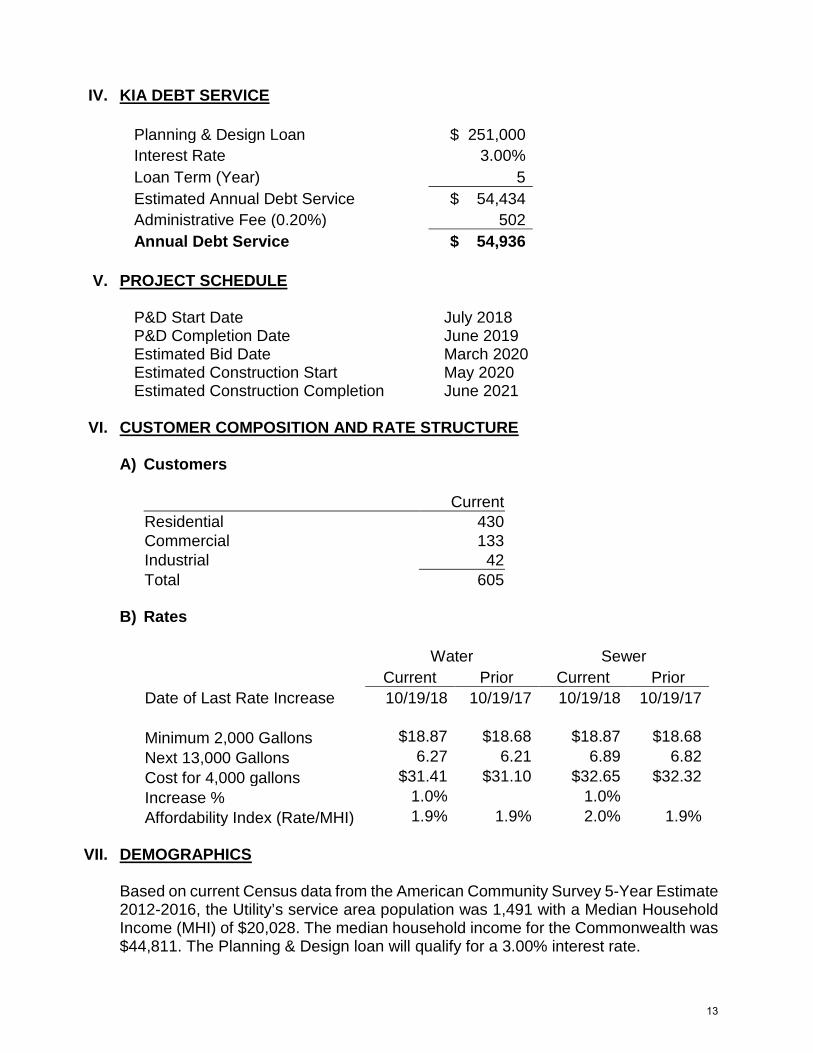
IV. KIA DEBT SERVICE
Planning & Design Loan $ 251,000 Interest Rate 3.00% Loan Term (Year) 5 Estimated Annual Debt Service $ 54,434 Administrative Fee (0.20%) 502 Annual Debt Service $ 54,936
V. PROJECT SCHEDULE
P&D Start Date July 2018 P&D Completion Date June 2019 Estimated Bid Date March 2020 Estimated Construction Start May 2020 Estimated Construction Completion June 2021
VI. CUSTOMER COMPOSITION AND RATE STRUCTURE
A) Customers
Current Residential 430 Commercial 133 Industrial 42 Total 605
B) Rates
Water Sewer Current Prior Current Prior
Date of Last Rate Increase 10/19/18 10/19/17 10/19/18 10/19/17
Minimum 2,000 Gallons $18.87 $18.68 $18.87 $18.68 Next 13,000 Gallons 6.27 6.21 6.89 6.82 Cost for 4,000 gallons $31.41 $31.10 $32.65 $32.32 Increase % 1.0%
1.0%
Affordability Index (Rate/MHI) 1.9% 1.9% 2.0% 1.9%
VII. DEMOGRAPHICS Based on current Census data from the American Community Survey 5-Year Estimate 2012-2016, the Utility’s service area population was 1,491 with a Median Household Income (MHI) of $20,028. The median household income for the Commonwealth was $44,811. The Planning & Design loan will qualify for a 3.00% interest rate.
13

Population County
Unemployment Year City % Change County % Change Date Rate
1980 2,051 7,289 June 2005 6.6% 1990 1,815 -11.5% 6,784 -6.9% June 2010 10.5% 2000 1,756 -3.3% 7,147 5.4% June 2015 5.3% 2010 1,521 -13.4% 6,856 -4.1% June 2018 4.5% Current 1,586 4.3% 6,780 -1.1% Cumulative % -22.7% -7.0%
VIII. 2018 CAPITALIZATION GRANT EQUIVALENCIES
1) Green Project Reserve - This project does not qualify for Green Project Reserve
(GPR) funding.
2) Additional Subsidization – This project does not qualify for additional subsidization.
IX. FINANCIAL ANALYSIS Financial information was obtained from the audited financial statements for the years ended June 30, 2016 through 2018. The non-cash impacts of GASB 68 - Accounting and Financial Reporting for Pensions and GASB 75 - Other Postemployment Benefit have been removed from operating expenses. Percentage references in the History section below are based on whole dollar amounts and not the rounded amounts presented. HISTORY Combined water and sewer revenues went up 16.3% from $0.96 million in 2016 to $1.11 million in 2018 due to change in terms of service agreement with the Cumberland County Water District while operating expenses increased less than 1.0% from $0.72 million to $0.73 million during the same period. The debt coverage ratio was 1.1, 1.0, and 1.5 for 2016, 2017, and 2018 respectively. The balance sheet reflects a current ratio of 2.6, debt to equity ratio of 0.6, 39.7 days sales in accounts receivable, and 7.0 months of operating expenses in unrestricted cash. PROJECTIONS Projections are based on the following assumptions:
1) Sewer revenues will increase 1% annually based on the automatic adjustment clause adopted in the 2011 rate ordinance.
14

2) Water revenues will stay flat as wholesale rate is not expected to increase although retail rate will go up 1% each year. Wholesale water accounts for approximately 60% of the total water revenues.
3) Should the City decide to pursue a construction loan from KIA after the planning and design work is completed, additional $100,000 revenues will be required to support a total loan amount of $3.8 million.
4) Expenses will increase 2% each year for inflation. 5) Debt service coverage is 1.2 in 2021 when full year principal and interest
repayments begin. Based on the pro forma assumptions, the utility shows adequate cash flow to repay the KIA Fund A loan. REPLACEMENT RESERVE Replacement reserve is not required for a planning and design loan.
X. DEBT OBLIGATIONS
Outstanding Maturity 1980 Bonds $ 15,000 2019 1990 Bonds 176,000 2028 1992 Bonds 640,000 2032 1998 Bonds 134,600 2036 KIA Loan F209-13 343,754 2031 KIA Loan A11-18 587,358 2035 KIA Loan B13-004 417,815 2035 KIA Loan F15-017 577,881 2037 Total $ 2,892,408
XI. CONTACTS
Legal Applicant Name City of Burkesville Address 214 Upper River St, PO Box 250 Burkesville, KY 42717 County Cumberland Authorized Official Billy Guffey, Mayor Phone (270) 459-2314 Email [email protected]
15

Project Contact - Applicant Name Brenda Spears Organization City of Burkesville Address 214 Upper River St, PO Box 250 Burkesville, KY 42717 Phone (270) 459-2314 Email [email protected]
Project Administrator
Name Laura Gilkerson Organization GRW Engineers, Inc Address 801 Corporate Dr
Lexington, KY 40503 Phone (859) 229-2667 Email [email protected]
Consulting Engineer
Name Michael Lynn Jacobs Firm GRW Engineers, Inc Address 801 Corporate Dr Lexington, KY 40503 Phone (859) 229-3999 Email [email protected]
XII. RECOMMENDATIONS
KIA staff recommends approval of the loan with the standard conditions.
16

CITY OF BURKESVILLEFINANCIAL SUMMARY (JUNE YEAR END)
Audited Audited Audited Projected Projected Projected Projected Projected2016 2017 2018 2019 2020 2021 2022 2023
Balance Sheet
AssetsCurrent Assets 505,500 448,931 549,793 575,802 592,002 605,238 616,102 624,340
Other Assets 10,344,079 10,168,277 9,950,387 9,448,191 9,400,740 9,084,159 8,758,093 8,421,522
Total 10,849,579 10,617,208 10,500,180 10,023,993 9,992,741 9,689,397 9,374,195 9,045,862
Liabilities & EquityCurrent Liabilities 191,366 194,792 211,539 200,199 232,165 263,140 267,756 272,382
Long Term Liabilities 3,445,534 3,452,096 3,567,884 3,335,271 3,387,340 3,157,734 2,923,812 2,685,564
Total Liabilities 3,636,900 3,646,888 3,779,423 3,535,470 3,619,505 3,420,874 3,191,568 2,957,946
Net Assets 7,212,679 6,970,320 6,720,757 6,488,523 6,373,236 6,268,523 6,182,627 6,087,917
Cash FlowRevenues 955,744 956,132 1,111,815 1,114,770 1,117,754 1,120,768 1,123,812 1,126,887
Operating Expenses 725,473 737,087 732,639 747,292 762,238 777,483 793,033 808,894
Other Income 2,963 3,114 3,933 3,933 3,933 3,933 3,933 3,933
Cash Flow Before Debt Service 233,234 222,159 383,109 371,411 359,449 347,218 334,712 321,926
Debt ServiceExisting Debt Service 209,353 233,209 249,609 243,115 252,483 227,602 226,954 227,298
Proposed KIA Loan 0 0 0 0 27,468 54,936 54,936 54,936
Total Debt Service 209,353 233,209 249,609 243,115 279,951 282,538 281,890 282,234
Cash Flow After Debt Service 23,881 (11,050) 133,500 128,296 79,498 64,680 52,822 39,692
RatiosCurrent Ratio 2.6 2.3 2.6 2.9 2.5 2.3 2.3 2.3
Debt to Equity 0.5 0.5 0.6 0.5 0.6 0.5 0.5 0.5
Days Sales in Accounts Receivable 41.3 40.8 39.7 39.7 39.7 39.7 39.7 39.7
Months Operating Expenses in Unrestricted Cash 6.6 5.6 7.0 7.3 7.4 7.5 7.5 7.4
Debt Coverage Ratio 1.1 1.0 1.5 1.5 1.3 1.2 1.2 1.1
17

EXECUTIVE SUMMARY Reviewer Jeff Abshire KENTUCKY INFRASTRUCTURE AUTHORITY Date February 7, 2019FUND A, FEDERALLY ASSISTED WASTEWATER KIA Loan Number A19-047REVOLVING LOAN FUND WRIS NumberBORROWER CITY OF BARDSTOWN
NELSON COUNTY
BRIEF DESCRIPTION
PROJECT FINANCING PROJECT BUDGET RD Fee % Actual %
Fund A Loan $5,400,000 Administrative Expenses $10,000EDA Grant 1,600,000 Legal Expenses 10,000
Land, Easements 25,000 Planning 10,000 Eng - Design / Const 6.6% 6.1% 383,610 Eng - Insp 3.3% 3.4% 214,210 Eng - Other 25,000 Construction 5,747,200 Contingency 574,980
TOTAL $7,000,000 TOTAL $7,000,000
REPAYMENT Rate 2.00% Est. Annual Payment $339,720Term 20 Years 1st Payment 6 Mo. after first draw
PROFESSIONAL SERVICES Engineer HDR Engineering, Inc.Bond Counsel Dinsmore & Shohl, LLP
PROJECT SCHEDULE Bid Opening Nov-19Construction Start May-19Construction Stop Sep-20
DEBT PER CUSTOMER Existing $1,376 Proposed $1,477
OTHER DEBT See Attached
RESIDENTIAL RATES Users Avg. BillCurrent 7,464 $25.93 (for 4,000 gallons)
REGIONAL COORDINATION
CASHFLOWCash Flow Before
Debt Service Debt Service Coverage RatioAudited 2016 7,126,017 1,739,721 4.1Audited 2017 5,974,080 1,735,035 3.4Audited 2018 8,035,097 1,785,327 4.5Projected 2019 7,757,591 1,793,259 4.3Projected 2020 7,503,304 1,866,477 4.0Projected 2021 7,246,787 2,033,423 3.6Projected 2022 6,971,640 943,443 7.4Projected 2023 6,704,760 943,442 7.1
SX21179029
5,386,296
This project is consistent with regional planning recommendations.
6,028,1975,761,318
4,239,0456,249,7705,964,3325,636,8275,213,364
This project will replace the existing 0.75 million gallon per day (MGD) Pottershop pump station with a 3.5 MGD station and will upgrade approximately 17,000 linear feet of sewer lines with 12 to 36 inch lines. Mechanical screening facilities will also be constructed at the headworks of the treatment plant to remove trash and debris prior to waste treatment. Capacity will be increased in a growth area as well as mitigiation of sanitary sewer overflows and hydraulic overloading during wet weather events as a result of the project.
Cash Flow After Debt Service
18

Reviewer: Jeff Abshire Date: February 7, 2019
Loan Number: A19-047
KENTUCKY INFRASTRUCTURE AUTHORITY WASTEWATER REVOLVING LOAN FUND (FUND "A")
CITY OF BARDSTOWN, NELSON COUNTY PROJECT REVIEW
SX21179029
I. PROJECT DESCRIPTION
The City of Bardstown provides wastewater service to approximately 7,500 customers and also treats waste for the City of Bloomfield’s 455 customers. The City is requesting $5,400,000 for the Rowan Creek Sewer Upgrade project. The project will replace the existing 0.75 million gallon per day (MGD) Pottershop pump station with a 3.5 MGD station and will upgrade approximately 17,000 linear feet of sewer lines with 12 to 36 inch lines. Mechanical screening facilities will also be constructed at the headworks of the treatment plant to remove trash and debris prior to waste treatment. The pump station is a recurring sanitary sewer overflow (SSO) location due to hydraulic overloading during wet weather while the Rowan Creek trunk sewer has high levels of inflow and infiltration (I/I) and has numerous defects. Existing and proposed development within the Rowan Creek sewershed will exceed the capacity of the existing trunk sewer and pump station, thus justifying the replacement and upgrades. Replacement of the influent sewer at the Town Creek WWTP is needed to eliminate a hydraulic constriction that causes the headworks to back up during high influent flows while the screening facilities are needed to remove trash and debris from the influent to prevent plugging problems with floating aerators and the biological reactor.
II. PROJECT BUDGET
Total
Administrative Expenses $ 10,000 Legal Expenses 10,000 Land, Easements 25,000 Planning 10,000 Engineering Fees - Design / Const 383,610 Engineering Fees - Inspection 214,210 Engineering Fees - Other 25,000 Construction 5,747,200 Contingency 574,980 Total $ 7,000,000
19
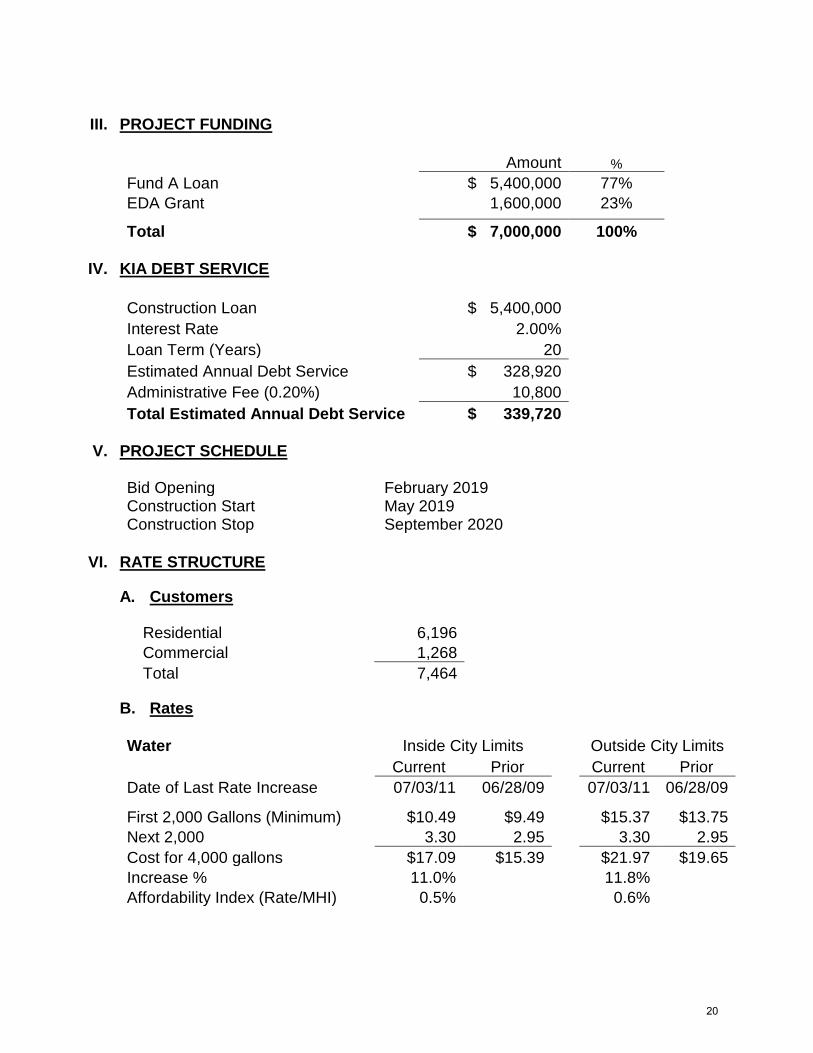
III. PROJECT FUNDING
Amount %
Fund A Loan $ 5,400,000 77% EDA Grant 1,600,000 23% Total $ 7,000,000 100%
IV. KIA DEBT SERVICE
Construction Loan $ 5,400,000 Interest Rate 2.00% Loan Term (Years) 20 Estimated Annual Debt Service $ 328,920 Administrative Fee (0.20%) 10,800 Total Estimated Annual Debt Service $ 339,720
V. PROJECT SCHEDULE
Bid Opening February 2019 Construction Start May 2019 Construction Stop September 2020
VI. RATE STRUCTURE
A. Customers
Residential 6,196 Commercial 1,268 Total 7,464
B. Rates Water Inside City Limits
Outside City Limits
Current Prior
Current Prior Date of Last Rate Increase 07/03/11 06/28/09
07/03/11 06/28/09
First 2,000 Gallons (Minimum) $10.49 $9.49
$15.37 $13.75
Next 2,000 3.30 2.95
3.30 2.95 Cost for 4,000 gallons $17.09 $15.39
$21.97 $19.65
Increase % 11.0%
11.8% Affordability Index (Rate/MHI) 0.5%
0.6%
20

Sewer Inside City Limits
Outside City Limits
Current Prior
Current Prior Date of Last Rate Increase 09/01/11 07/15/09
09/01/11 07/15/09
First 2,000 Gallons (Minimum) $17.25 $15.00
$18.84 $15.60 Next 2,000 4.34 3.77
5.66 4.92
Cost for 4,000 gallons $25.93 $22.54
$30.16 $25.44 Increase % 15.0%
18.6%
Affordability Index (Rate/MHI) 0.7%
0.8%
VII. DEMOGRAPHICS Based on current Census data from the American Community Survey 5-Year Estimate 2012-2016, the City’s service area population was 17,207 with a Median Household Income (MHI) of $43,372. The median household income for the Commonwealth is $44,811. The project will qualify for a 2.00% interest rate.
Population
County Unemployment
Year City % Change County % Change
Date Rate
1980 6,155
27,584
June 2004 5.1% 1990 6,801 10.5%
29,710 7.7%
June 2009 12.5%
2000 10,374 52.5%
37,477 26.1%
June 2015 6.7% 2010 11,700 12.8%
43,437 15.9%
June 2018 4.5%
Current 13,026 11.3%
44,875 3.3% Cumulative %
111.6%
62.7%
VIII. CAPITALIZATION GRANT EQUIVALENCIES
1) Green Project Reserve - This project will not be reported for Green Project Reserve
(GPR) funding.
2) Additional Subsidization – This project does not qualify for additional subsidization.
IX. FINANCIAL ANALYSIS
Financial information was obtained from the City’s audited financial statements for the years ended June 30, 2016 through 2018 for the Combined Utilities Operating Fund which includes electric distribution, water treatment and distribution, wastewater treatment, garbage pickup, cable TV, and Internet services. While revenues and expenses are separated in the audit based on the above segments, the balance sheet and debt information is only presented on a consolidated basis. The non cash impacts of GASB 68, Accounting and Financial Reporting for Pensions, and GASB 75,
21

Accounting and Financial Reporting for Postemployment Benefits Other Than Pensions, have been removed from consolidated operating expenses. Percentage references in the History section below are based on whole dollar amounts as outlined in the audited financial statements. HISTORY Revenues increased 10.5% from $36.2 million to $40.0 million from 2015 to 2018 due primarily to growth, while operating expenses increased 10.8% from $29.1 million to $32.0 million. Consolidated cash flow before debt service averaged $7.1 million during the three years. Sewer cash flow averaged $2.1 million, or 29% of consolidated cash flow before debt service. The debt coverage ratio was 4.1, 3.4, and 4.6 for 2016 through 2018, respectively. The balance sheet reflects a current ratio of 2.6, day’s sales in account receivable of 28.7, and the number of months of operating expenses in unrestricted cash is 4.7. PROJECTIONS
Projections are based on the following assumptions:
1) Revenues will be flat for volume. 2) Expenses will increase 2% annually for inflation. 3) Debt service coverage is 3.6 in 2021 when principal and interest repayments
begin. Based on the proforma assumptions, the City shows adequate cash flow to repay the requested loan. REPLACEMENT RESERVE The replacement reserve will be 5% ($270,000 total) of the final amount borrowed to be funded annually ($13,500 yearly) each December 1 for 20 years and maintained for the life of the loan.
X. DEBT OBLIGATIONS
Outstanding Maturity
General Obligation Bond, Series 2010 $ 3,610,000 2021 KIA (A10-14) 1,374,107 2033 KIA (B17-008) 1,194,885 2037 KIA (B17-012, i/a/o $1,129,000) 0 TBD KIA (C09-01) 1,514,575 2034 KIA (C09-02) 2,773,563 2033 Total $10,467,130
22

XI. CONTACTS
Legal Applicant
Entity Name City of Bardstown Authorized Official Mayor Richard Heaton County Nelson Email [email protected] Phone 502-348-5947 Address 220 N Fifth Street Bardstown, KY 40004
Applicant Contact Name Jessica Filiatreau Organization City of Bardstown Email [email protected] Phone 502-348-5947 Address 220 N Fifth Street Bardstown, KY 40004
Project Administrator Name Bob Sturdivant Organization HDR Engineering, Inc. Email [email protected] Phone (859) 629-4826 Address 2517 Sir Barton Way Lexington, KY 40509
Consulting Engineer PE Name Rich Smith Firm Name HDR Engineering, Inc. Email [email protected] Phone (859) 629-4844 Address 2517 Sir Barton Way Lexington, KY 40509
XII. RECOMMENDATIONS
KIA staff recommends approval of the loan with the standard conditions.
23

CITY OF BARDSTOWN FINANCIAL SUMMARY (JUNE YEAR END)
Audited Audited Audited Projected Projected Projected Projected Projected2016 2017 2018 2019 2020 2021 2022 2023
Balance Sheet
Assets
Current Assets 14,944,647 14,588,035 16,907,475 17,503,763 18,067,590 18,588,954 19,192,151 19,767,469
Other Assets 71,588,535 72,630,750 75,366,181 71,322,252 76,149,568 75,190,884 73,758,200 72,219,516
Total 86,533,182 87,218,785 92,273,656 88,826,015 94,217,158 93,779,838 92,950,351 91,986,985
Liabilities & Equity
Current Liabilities 4,694,994 4,899,502 6,561,926 6,784,244 6,890,967 5,724,196 5,798,965 5,867,695
Long Term Liabilities 16,141,497 15,407,788 20,344,086 19,005,730 21,983,168 21,114,931 20,675,734 20,225,282
Total Liabilities 20,836,491 20,307,290 26,906,012 25,789,974 28,874,135 26,839,127 26,474,699 26,092,977
Net Assets 65,696,691 66,911,495 65,367,644 63,036,041 65,343,023 66,940,711 66,475,652 65,894,008
Cash FlowRevenues 36,198,440 36,863,711 40,009,058 40,009,058 40,009,058 40,009,058 40,009,058 40,009,058
Operating Expenses 29,091,482 30,936,964 32,117,356 32,394,862 32,649,149 32,905,666 33,180,813 33,447,693
Other Income 19,059 47,333 143,395 143,395 143,395 143,395 143,395 143,395
Cash Flow Before Debt Service 7,126,017 5,974,080 8,035,097 7,757,591 7,503,304 7,246,787 6,971,640 6,704,760
Debt Service
Existing Debt Service 1,739,721 1,735,035 1,785,327 1,793,259 1,866,477 1,863,563 603,723 603,722
Proposed KIA Loan 0 0 0 0 0 169,860 339,720 339,720
Total Debt Service 1,739,721 1,735,035 1,785,327 1,793,259 1,866,477 2,033,423 943,443 943,442
Cash Flow After Debt Service 5,386,296 4,239,045 6,249,770 5,964,332 5,636,827 5,213,364 6,028,197 5,761,318
RatiosCurrent Ratio 3.2 3.0 2.6 2.6 2.6 3.2 3.3 3.4
Debt to Equity 0.3 0.3 0.4 0.4 0.4 0.4 0.4 0.4
Days Sales in Accounts Receivable 23.0 23.0 28.7 28.7 28.7 28.7 28.7 28.7
Months Operating Expenses in Unrestricted Cash 4.4 4.1 4.4 4.6 4.8 5.0 5.2 5.3
Debt Coverage Ratio 4.1 3.4 4.5 4.3 4.0 3.6 7.4 7.1
24