kentucky...• kentucky had 449 new cases per 100,000 population, compared to a national average of...
TRANSCRIPT

COVID-19
The purpose of this report is to develop a shared understanding of the current status of the pandemic at the national, regional, state and
local levels. We recognize that data at the state level may differ from that available at the federal level. Our objective is to use consistent
data sources and methods that allow for comparisons to be made across localities. We appreciate your continued support in identifying data
discrepancies and improving data completeness and sharing across systems. We look forward to your feedback.
STATE REPORT12.20.2020
Issue 27
SUMMARY• Kentucky is in the red zone for cases, indicating 101 or more new cases per 100,000 population, with the 22nd highest rate in the country.
Kentucky is in the red zone for test positivity, indicating a rate at or above 10.1%, with the 21st highest rate in the country.• Kentucky has seen a decrease in new cases and a decrease in test positivity.• The following three counties had the highest number of new cases over the last 3 weeks: 1. Jefferson County, 2. Fayette County, and 3.
Kenton County. These counties represent 27.1% of new cases in Kentucky.• 94% of all counties in Kentucky have moderate or high levels of community transmission (yellow, orange, or red zones), with 69% having
high levels of community transmission (red zone).• During the week of Dec 7 - Dec 13, 41% of nursing homes had at least one new resident COVID-19 case, 62% had at least one new staff
COVID-19 case, and 26% had at least one new resident COVID-19 death.• Kentucky had 449 new cases per 100,000 population, compared to a national average of 462 per 100,000.• The federal government has supported surge testing in Louisville, KY and Lexington, KY.• Between Dec 12 - Dec 18, on average, 422 patients with confirmed COVID-19 and 112 patients with suspected COVID-19 were reported as
newly admitted each day to hospitals in Kentucky. This is a minimal change in total new COVID-19 hospital admissions.• Hospitals are reporting critical staffing shortages, but the state is managing.
RECOMMENDATIONS
Treatment Alerts:• Patients prior to hospitalization: Preliminary data suggest that early diagnosis and immediate treatment with
monoclonal antibodies (mAb) may substantially lower the risk of hospitalization and death. Monoclonal antibody infusion must be immediately made available to those at risk for severe disease; outpatient infusion capacity should be developed in all communities.
• Patients who require hospitalization: Remdesivir is best early in admission and the benefit is most evident in those who require supplemental oxygen (but not delivered through high-flow device or mechanical ventilation). Anticoagulation and immune suppressive treatments (like steroids) should be given in accordance with protocols in hospitalized patients.
Pandemic Alerts:• There are continued improvements in the Northern Plains, Upper Midwest, Heartland, and Rocky Mountain states, but this
is being directly offset by significant deterioration along both coasts, across the Sunbelt, and into Tennessee, Ohio, and Indiana. The surge is now in states home to more than 80% of the American population. This surge must be met with aggressive public mitigation inclusive of safe public options, like outdoor dining, and clear personal behavior change messages to ensure as many Americans as possible can survive to be immunized and protected from severe disease and fatalities over the ensuing weeks.
• The fall, now winter, surge is currently plateauing at 10x the daily cases of the spring surge and 3.5x the daily cases of the summer surge; the number of COVID-19 inpatients is 3x the number of spring inpatients and 2.2x the summer surge. Weekly fatalities are greater than the spring surge, 2.5x the summer surge, and still growing. Preventing a post-Christmas/Kwanzaa surge is critical through clear and continuous messaging: "To preserve our hospital system for you, we need you to wear masks, physically distance, wash hands, and avoid crowds and social gatherings beyond your immediate family."
• Through the leadership of the Governor, public health officials, and Kentuckians adapting safe behaviors, virus levels continue to decrease.
• Keep all mitigation efforts in place through the New Year. Over 60% of nursing homes have at least one positive staff member, indicating virus levels are still high but decreasing. Ensure weekly testing continues until all residents and staff are fully vaccinated.
• Continue with strong holiday messaging; we need to stay vigilant during the season as vaccines are rolling out. Ensure indoor masking around vulnerable family members during any gatherings due to the significant amount of virus circulating and the high rate of asymptomatic and undiagnosed infections among family and community members.
• To stay ahead of the potential next surge and prevent hospitalizations and mortality, scale up the use of BinaxNOW tests to identify and isolate asymptomatic cases to reduce silent transmission. Make testing attractive for under 40-year-olds, who are primarily asymptomatic and unknowingly passing on the virus.
• When K-12 schools return, establish public health protocols to conduct active testing in schools for teachers and students in districts with high positivity and cases. In accordance with CDC guidelines, masks must be worn by students and teachers in K-12 schools.
• Ensure all universities returning after winter break move to mandatory weekly testing of all on and off campus students; begin planning now.
• Specific, detailed guidance on community mitigation measures can be found on the CDC website.
KENTUCKY

COVID-19
SNFs WITH ≥1 NEW RESIDENT COVID-19 CASE
41% N/A*† 30% 31%
SNFs WITH ≥1 NEW STAFF COVID-19 CASE
62% N/A*† 53% 52%
SNFs WITH ≥1 NEW RESIDENT COVID-19 DEATH
26% N/A*† 13% 16%
STATESTATE, % CHANGE
FROM PREVIOUS WEEK FEMA/HHS REGION UNITED STATES
NEW COVID-19 CASES (RATE PER 100,000)
20,066(449)
-13%305,001
(456)1,516,016
(462)
VIRAL (RT-PCR) LAB TEST POSITIVITY RATE
12.6% -2.2%* 12.8% 11.5%
TOTAL VIRAL (RT-PCR) LAB TESTS (TESTS PER 100,000)
133,367**(2,985**)
-10%**1,712,750**
(2,560**)10,670,512**
(3,251**)
COVID-19 DEATHS (RATE PER 100,000)
177(4.0)
+37%2,755(4.1)
18,000(5.5)
* Indicates absolute change in percentage points.** Due to delayed reporting, this figure may underestimate total diagnostic tests and week-on-week changes in diagnostic tests.† Skilled nursing facility data entry is experiencing a data submission lag. Therefore, the most current week's data should not be compared to previous data. 94% of facilities reported during the most current week.DATA SOURCES – Additional data details available under METHODS
Note: Some dates may have incomplete data due to delays in reporting. Data may be backfilled over time, resulting in week-to-week changes.Cases and Deaths: State values are calculated by aggregating county-level data from a CDC managed aggregate county dataset that is compiled from state and local health departments; therefore, the values may not match those reported directly by the state. Data is through 12/18/2020; previous week is 12/5 - 12/11.Testing: CELR (COVID-19 Electronic Lab Reporting) state health department-reported data through 12/16/2020. Previous week is 12/3 - 12/9.SNFs: Skilled nursing facilities. National Healthcare Safety Network. Data are reported separately for cases among residents and staff. Data is through 12/13/2020, previous week is 11/30-12/6.Admissions: Unified hospitalization dataset in HHS Protect. These data exclude psychiatric, rehabilitation, and religious non-medical hospitals. Hospitals explicitly identified by states/regions as those from which we should not expect reports were excluded from the totals. Totals include confirmed and suspected COVID-19 admissions.Shortages: Unified hospital dataset in HHS Protect. These data exclude psychiatric, rehabilitation, and religious non-medical hospitals. Includes hospitals reporting a staffing shortage currently or projected within one week. Low supply is defined as a hospital reporting 0 or 1-3 days’ supply, not able to obtain, or not able to maintain a 3-day supply of N95s, face masks, gloves, gowns, or eye protection. Values presented show the latest reports from hospitals in the week ending 12/18/2020.
STATE REPORT | 12.20.2020
KENTUCKY
Issue 27
TOTAL NEW COVID-19 HOSPITAL ADMISSIONS (RATE PER 100 BEDS)
3,736(30)
-1%(-2%)
31,032(20)
155,605(21)
NUMBER OF HOSPITALS WITH SUPPLY SHORTAGES (PERCENT)
3(3%)
+1%(+50%*)
141(15%)
1,019(20%)
NUMBER OF HOSPITALS WITH STAFF SHORTAGES (PERCENT)
1(1%)
-4%(-80%*)
209(23%)
1,321(26%)

NE
W C
AS
ES
TE
ST
ING
COVID-19
STATE REPORT | 12.20.2020
KENTUCKY
DATA SOURCES – Additional data details available under METHODS
Note: Some dates may have incomplete data due to delays in reporting. Data may be backfilled over time, resulting in week-to-week changes.Cases: State values are calculated by aggregating county-level data from a CDC managed aggregate county dataset that is compiled from state and local health departments; therefore, the values may not match those reported directly by the state. Data is through 12/18/2020.Testing: CELR (COVID-19 Electronic Lab Reporting) state health department-reported data through 12/16/2020.
TO
P C
OU
NT
IES
Top counties based on greatest number of new cases in last three weeks (11/28 - 12/18)
Issue 27

COVID-19H
OS
PIT
AL
AD
MIS
SIO
NS
HO
SP
ITA
L P
PE
SU
PP
LIE
S
STATE REPORT | 12.20.2020
KENTUCKY
DATA SOURCES – Additional data details available under METHODS
Hospitalizations: Unified hospitalization dataset in HHS Protect. These data exclude psychiatric, rehabilitation, and religious non-medical hospitals. Hospitals explicitly identified by states/regions as those from which we should not expect reports were excluded from the percent reporting figure.PPE: Unified hospitalization dataset in HHS Protect. These data exclude psychiatric, rehabilitation, and religious non-medical hospitals. Values presented show the latest reports from hospitals in the week ending 12/16/2020.
98 hospitals are expected to report in Kentucky
Issue 27

COVID-19
* Localities with fewer than 10 cases last week have been excluded from these alerts.
STATE REPORT | 12.20.2020
KENTUCKY
Note: Lists of red, orange, and yellow localities are sorted by the number of new cases in the last 3 weeks, from highest to lowest. Some dates may have incomplete data due to delays in reporting. Data may be backfilled over time, resulting in week-to-week changes.DATA SOURCES – Additional data details available under METHODSCases and Deaths: State values are calculated by aggregating county-level data from a CDC managed aggregate county dataset that is compiled from state and local health departments; therefore, the values may not match those reported directly by the state. Data is through 12/18/2020.Testing: CELR (COVID-19 Electronic Lab Reporting) state health department-reported data through 12/16/2020.
COVID-19 COUNTY AND METRO ALERTS*Top 12 shown in table (full lists below)
METRO AREA (CBSA) COUNTIES
LOCALITIES IN RED
ZONE19▼ (-2)
Louisville/Jefferson CountyLexington-FayetteCincinnatiBowling GreenLondonHuntington-AshlandElizabethtown-Fort KnoxOwensboroRichmond-BereaPaducahDanvilleClarksville
83▼ (-11)
FayetteKentonBooneWarrenDaviessMadisonHardinMcCrackenBoydBullittOldhamLaurel
LOCALITIES IN ORANGE
ZONE4
▲ (+2)
CampbellsvilleMadisonvilleBardstownMurray
16▲ (+1)
JeffersonCampbellWhitleyChristianHopkinsScottNelsonWoodfordCallowayFlemingLawrenceLeslie
LOCALITIES IN YELLOW
ZONE2
■ (+0)
SomersetGlasgow
14▲ (+7)
PulaskiFranklinBarrenRussellRowanCaseyLaruePendletonHarrisonMetcalfeBreathittLyon
Change from previous week’s alerts: ▲ Increase ■ Stable ▼ Decrease
All Red CBSAs: Louisville/Jefferson County, Lexington-Fayette, Cincinnati, Bowling Green, London, Huntington-Ashland, Elizabethtown-Fort Knox, Owensboro, Richmond-Berea, Paducah, Danville, Clarksville, Frankfort, Evansville, Mount Sterling, Mayfield, Maysville, Middlesborough, Central CityAll Red Counties: Fayette, Kenton, Boone, Warren, Daviess, Madison, Hardin, McCracken, Boyd, Bullitt, Oldham, Laurel, Boyle, Jessamine, Pike, Taylor, Greenup, Henderson, Lincoln, Graves, Shelby, Perry, Wayne, Mercer, Marion, Harlan, McCreary, Grant, Floyd, Hart, Simpson, Ohio, Mason, Carter, Clark, Marshall, Bell, Montgomery, Knox, Clay, Muhlenberg, Logan, Meade, Letcher, Anderson, Clinton, Johnson, Washington, Spencer, Garrard, Caldwell, Allen, Rockcastle, Bourbon, Henry, Magoffin, Martin, Gallatin, Bath, Trimble, Trigg, Carroll, Union, Butler, Elliott, Todd, Owen, Livingston, Powell, Estill, Cumberland, Edmonson, Breckinridge, Jackson, McLean, Webster, Knott, Lee, Bracken, Hancock, Crittenden, Ballard, RobertsonAll Orange Counties: Jefferson, Campbell, Whitley, Christian, Hopkins, Scott, Nelson, Woodford, Calloway, Fleming, Lawrence, Leslie, Morgan, Wolfe, Carlisle, HickmanAll Yellow Counties: Pulaski, Franklin, Barren, Russell, Rowan, Casey, Larue, Pendleton, Harrison, Metcalfe, Breathitt, Lyon, Nicholas, Fulton
Issue 27

TO
TA
L D
AIL
Y C
AS
ES
COVID-19
DATA SOURCES – Additional data details available under METHODS
Cases: State values are calculated by aggregating county-level data from a CDC managed aggregate county dataset that is compiled from state and local health departments; therefore, the values may not match those reported directly by the state. Data is through 12/18/2020. Last 3 weeks is 11/28 - 12/18.
Top 12 counties based on number of new cases in the last 3 weeks
Issue 27

COVID-19
NEW CASES PER 100,000 VIRAL (RT-PCR) LABORATORY TEST POSITIVITY
NEW CASES PER 100,000 ONE MONTH BEFORE
VIRAL (RT-PCR) LABORATORY TEST POSITIVITY ONE MONTH BEFORE
CASE RATES AND VIRAL LAB TEST POSITIVITY
DATA SOURCES – Additional data details available under METHODSNote: Some dates may have incomplete data due to delays in reporting. Data may be backfilled over time, resulting in week-to-week changes.Cases: State values are calculated by aggregating county-level data from a CDC managed aggregate county dataset that is compiled from state and local health departments; therefore, the values may not match those reported directly by the state. Data is through 12/18/2020. The week one month before is 11/14 - 11/20.Testing: CELR (COVID-19 Electronic Lab Reporting) state health department-reported data through 12/16/2020. The week one month before is 11/12 -11/18.
STATE REPORT | 12.20.2020
KENTUCKY
Issue 27

COVID-19
TOTAL NEW COVID-19 ADMISSIONS PER 100 INPATIENT BEDS
NEW DEATHS PER 100,000
TOTAL NEW COVID-19 ADMISSIONS PER 100 INPATIENT BEDS ONE MONTH BEFORE
NEW DEATHS PER 100,000 ONE MONTH BEFORE
HOSPITAL ADMISSIONS AND DEATH RATES
DATA SOURCES – Additional data details available under METHODSNote: Some dates may have incomplete data due to delays in reporting. Data may be backfilled over time, resulting in week-to-week changes.Deaths: State values are calculated by aggregating county-level data from a CDC managed aggregate county dataset that is compiled from state and local health departments; therefore, the values may not match those reported directly by the state. Data is through 12/18/2020. The week one month before is 11/14 - 11/20.Hospitalizations: Unified hospitalization dataset in HHS Protect. These data exclude psychiatric, rehabilitation, and religious non-medical hospitals. Hospitals explicitly identified by states/regions as those from which we should not expect reports were excluded from the percent reporting figure. Totals include confirmed and suspected COVID-19 admissions.
STATE REPORT | 12.20.2020
KENTUCKY
Issue 27

COVID-19
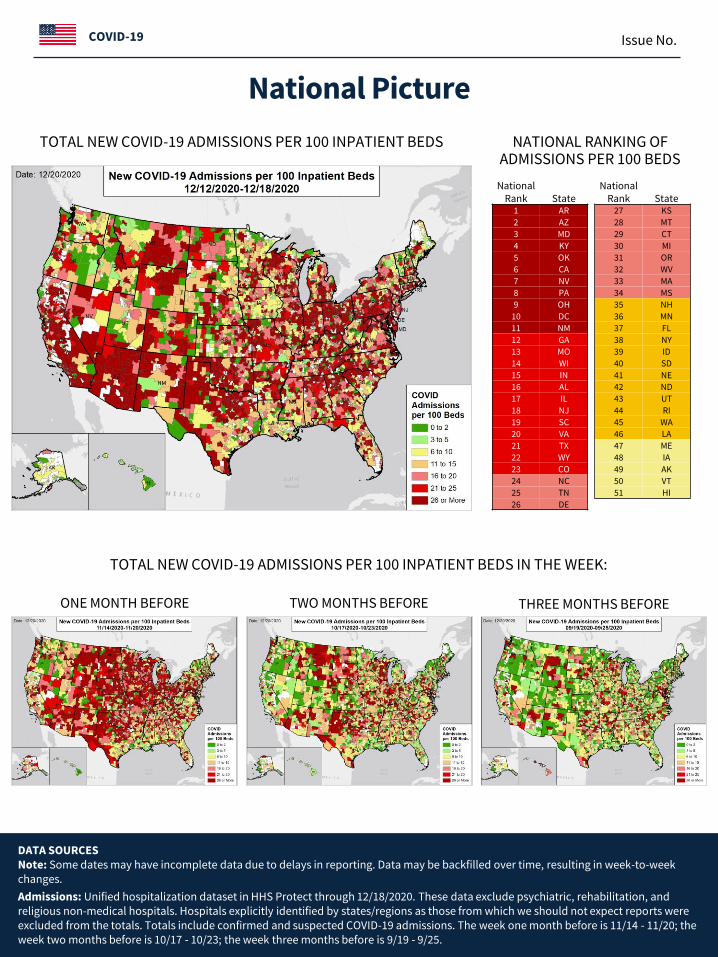
National PictureNATIONAL
RANKING OF NEW CASES PER 100,000
NEW CASES PER 100,000
DATA SOURCESNote: Some dates may have incomplete data due to delays in reporting. Data may be backfilled over time, resulting in week-to-week changes.
Cases: State values are calculated by aggregating county-level data from a CDC managed aggregate county dataset that is compiled from state and local health departments; therefore, the values may not match those reported directly by the state. Data is through 12/18/2020.European community mitigation information sourced from European CDC — Situation Update Worldwide.
Issue 27
NationalRank State
1 TN
2 CA
3 AZ
4 RI
5 IN
6 NV
7 UT
8 OK
9 OH
10 DE
11 PA
12 AR
13 NM
14 KS
15 WV
16 MS
17 MA
18 ID
19 SD
20 AK
21 CT
22 KY
23 WY
24 WI
25 IL
26 GA
27 AL
28 NE
29 NC
30 NH
31 LA
32 CO
33 SC
34 MT
35 NY
36 TX
37 NJ
38 MN
39 MO
40 IA
41 FL
42 MI
43 ND
44 MD
45 VA
46 DC
47 ME
48 OR
49 WA
50 VT
51 HI

COVID-19
National Picture
ONE MONTH BEFORE TWO MONTHS BEFORE
NEW CASES PER 100,000 IN THE WEEK:
THREE MONTHS BEFORE FOUR MONTHS BEFORE
FIVE MONTHS BEFORE SIX MONTHS BEFORE
DATA SOURCESNote: Some dates may have incomplete data due to delays in reporting. Data may be backfilled over time, resulting in week-to-week changes.
Cases: State values are calculated by aggregating county-level data from a CDC managed aggregate county dataset that is compiled from state and local health departments; therefore, the values may not match those reported directly by the state. The week one month before is 11/14 - 11/20; the week two months before is 10/17 - 10/23; the week three months before is 9/19 - 9/25; the week four months before is 8/22 - 8/28; the week five months before is 7/25 - 7/31; the week six months before is 6/27 - 7/3.

COVID-19
National Picture
ONE MONTH BEFORE THREE MONTHS BEFORETWO MONTHS BEFORE
VIRAL (RT-PCR) LAB TEST POSITIVITY NATIONAL RANKING OF TEST POSITIVITY
VIRAL (RT-PCR) LAB TEST POSITIVITY IN THE WEEK:
DATA SOURCESNote: Some dates may have incomplete data due to delays in reporting. Data may be backfilled over time, resulting in week-to-week changes.
Testing: Combination of CELR (COVID-19 Electronic Lab Reporting) state health department-reported data and HHS Protect laboratory data (provided directly to Federal Government from public health labs, hospital labs, and commercial labs) through 12/16/2020. Tthe week one month before is 11/12 - 11/18; the week two months before is 10/15 - 10/21; the week three months before is 9/17 - 9/23.
NationalRank State
1 OK
2 NV
3 TN
4 AL
5 ID
6 AZ
7 VA
8 IN
9 NE
10 MO
11 SC
12 UT
13 KS
14 PA
15 MS
16 OH
17 NH
18 GA
19 TX
20 CA
21 KY
22 SD
23 IA
24 NM
25 AR
26 NC
NationalRank State
27 IL
28 CT
29 NJ
30 FL
31 LA
32 MI
33 MT
34 WV
35 DE
36 WY
37 WI
38 MD
39 MN
40 CO
41 WA
42 RI
43 OR
44 NY
45 AK
46 MA
47 ME
48 DC
49 ND
50 VT
51 HI
Issue 27
COVID-19
National Picture
ONE MONTH BEFORE THREE MONTHS BEFORETWO MONTHS BEFORE
TOTAL NEW COVID-19 ADMISSIONS PER 100 INPATIENT BEDS NATIONAL RANKING OF ADMISSIONS PER 100 BEDS
TOTAL NEW COVID-19 ADMISSIONS PER 100 INPATIENT BEDS IN THE WEEK:
DATA SOURCESNote: Some dates may have incomplete data due to delays in reporting. Data may be backfilled over time, resulting in week-to-week changes.
Admissions: Unified hospitalization dataset in HHS Protect through 12/18/2020. These data exclude psychiatric, rehabilitation, and religious non-medical hospitals. Hospitals explicitly identified by states/regions as those from which we should not expect reports were excluded from the totals. Totals include confirmed and suspected COVID-19 admissions. The week one month before is 11/14 - 11/20; the week two months before is 10/17 - 10/23; the week three months before is 9/19 - 9/25.
NationalRank State
1 AR
2 AZ
3 MD
4 KY
5 OK
6 CA
7 NV
8 PA
9 OH
10 DC
11 NM
12 GA
13 MO
14 WI
15 IN
16 AL
17 IL
18 NJ
19 SC
20 VA
21 TX
22 WY
23 CO
24 NC
25 TN
26 DE
NationalRank State
27 KS
28 MT
29 CT
30 MI
31 OR
32 WV
33 MA
34 MS
35 NH
36 MN
37 FL
38 NY
39 ID
40 SD
41 NE
42 ND
43 UT
44 RI
45 WA
46 LA
47 ME
48 IA
49 AK
50 VT
51 HI
Issue No.

COVID-19
National Picture
ONE MONTH BEFORE THREE MONTHS BEFORETWO MONTHS BEFORE
NEW DEATHS PER 100,000 NATIONAL RANKING OF NEW DEATHS PER 100,000
NEW DEATHS PER 100,000 IN THE WEEK:
DATA SOURCESNote: Some dates may have incomplete data due to delays in reporting. Data may be backfilled over time, resulting in week-to-week changes.
Deaths: State values are calculated by aggregating county-level data from a CDC managed aggregate county dataset that is compiled from state and local health departments; therefore, the values may not match those reported directly by the state.. The week one month before is 11/14 - 11/20; the week two months before is 10/17 - 10/23; the week three months before is 9/19 - 9/25.
NationalRank State
1 SD
2 ND
3 NM
4 RI
5 PA
6 TN
7 KS
8 IL
9 MI
10 IN
11 AR
12 WV
13 IA
14 AZ
15 MS
16 MN
17 NV
18 CO
19 MO
20 ID
21 NE
22 WI
23 CT
24 NJ
25 WY
26 MA
NationalRank State
27 LA
28 MD
29 DE
30 TX
31 OH
32 MT
33 NY
34 AL
35 CA
36 KY
37 OR
38 OK
39 UT
40 NH
41 NC
42 AK
43 FL
44 GA
45 VA
46 DC
47 SC
48 ME
49 VT
50 WA
51 HI
Issue 27
COVID-19
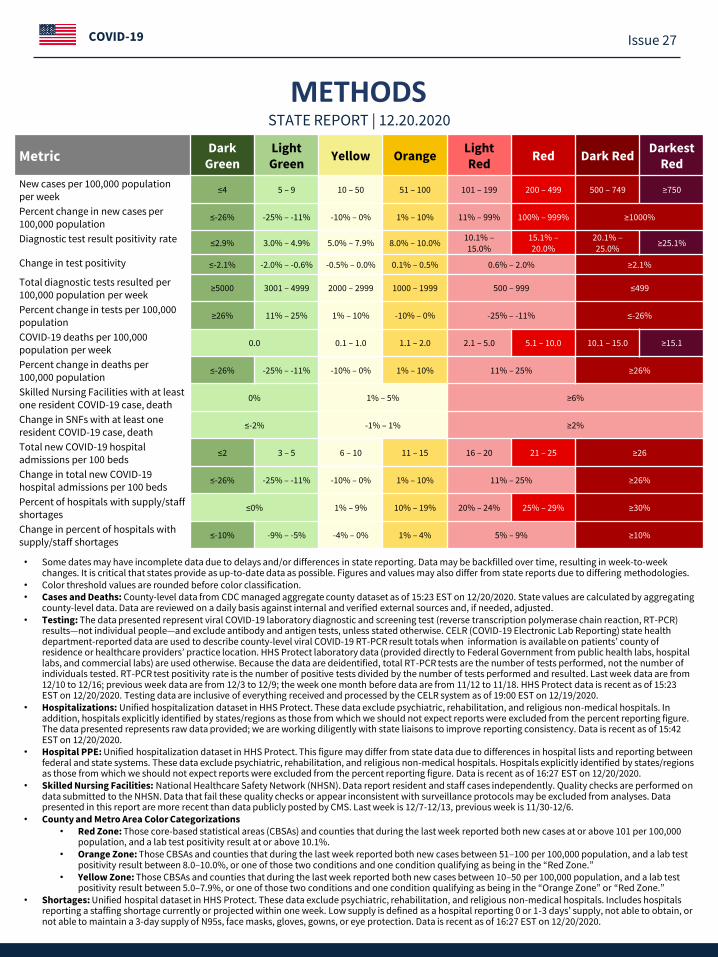
METHODS
MetricDark
GreenLight Green
Yellow OrangeLight Red
Red Dark RedDarkest
Red
New cases per 100,000 population per week
≤4 5 – 9 10 – 50 51 – 100 101 – 199 200 – 499 500 – 749 ≥750
Percent change in new cases per 100,000 population
≤-26% -25% – -11% -10% – 0% 1% – 10% 11% – 99% 100% – 999% ≥1000%
Diagnostic test result positivity rate ≤2.9% 3.0% – 4.9% 5.0% – 7.9% 8.0% – 10.0%10.1% –15.0%
15.1% –20.0%
20.1% –25.0%
≥25.1%
Change in test positivity ≤-2.1% -2.0% – -0.6% -0.5% – 0.0% 0.1% – 0.5% 0.6% – 2.0% ≥2.1%
Total diagnostic tests resulted per 100,000 population per week
≥5000 3001 – 4999 2000 – 2999 1000 – 1999 500 – 999 ≤499
Percent change in tests per 100,000 population
≥26% 11% – 25% 1% – 10% -10% – 0% -25% – -11% ≤-26%
COVID-19 deaths per 100,000 population per week
0.0 0.1 – 1.0 1.1 – 2.0 2.1 – 5.0 5.1 – 10.0 10.1 – 15.0 ≥15.1
Percent change in deaths per 100,000 population
≤-26% -25% – -11% -10% – 0% 1% – 10% 11% – 25% ≥26%
Skilled Nursing Facilities with at least one resident COVID-19 case, death
0% 1% – 5% ≥6%
Change in SNFs with at least one resident COVID-19 case, death
≤-2% -1% – 1% ≥2%
Total new COVID-19 hospital admissions per 100 beds
≤2 3 – 5 6 – 10 11 – 15 16 – 20 21 – 25 ≥26
Change in total new COVID-19 hospital admissions per 100 beds
≤-26% -25% – -11% -10% – 0% 1% – 10% 11% – 25% ≥26%
Percent of hospitals with supply/staff shortages
≤0% 1% – 9% 10% – 19% 20% – 24% 25% – 29% ≥30%
Change in percent of hospitals with supply/staff shortages
≤-10% -9% – -5% -4% – 0% 1% – 4% 5% – 9% ≥10%
STATE REPORT | 12.20.2020
• Some dates may have incomplete data due to delays and/or differences in state reporting. Data may be backfilled over time, resulting in week-to-week changes. It is critical that states provide as up-to-date data as possible. Figures and values may also differ from state reports due to differing methodologies.
• Color threshold values are rounded before color classification.• Cases and Deaths: County-level data from CDC managed aggregate county dataset as of 15:23 EST on 12/20/2020. State values are calculated by aggregating
county-level data. Data are reviewed on a daily basis against internal and verified external sources and, if needed, adjusted.• Testing: The data presented represent viral COVID-19 laboratory diagnostic and screening test (reverse transcription polymerase chain reaction, RT-PCR)
results—not individual people—and exclude antibody and antigen tests, unless stated otherwise. CELR (COVID-19 Electronic Lab Reporting) state health department-reported data are used to describe county-level viral COVID-19 RT-PCR result totals when information is available on patients’ county of residence or healthcare providers’ practice location. HHS Protect laboratory data (provided directly to Federal Government from public health labs, hospital labs, and commercial labs) are used otherwise. Because the data are deidentified, total RT-PCR tests are the number of tests performed, not the number of individuals tested. RT-PCR test positivity rate is the number of positive tests divided by the number of tests performed and resulted. Last week data are from 12/10 to 12/16; previous week data are from 12/3 to 12/9; the week one month before data are from 11/12 to 11/18. HHS Protect data is recent as of 15:23 EST on 12/20/2020. Testing data are inclusive of everything received and processed by the CELR system as of 19:00 EST on 12/19/2020.
• Hospitalizations: Unified hospitalization dataset in HHS Protect. These data exclude psychiatric, rehabilitation, and religious non-medical hospitals. In addition, hospitals explicitly identified by states/regions as those from which we should not expect reports were excluded from the percent reporting figure. The data presented represents raw data provided; we are working diligently with state liaisons to improve reporting consistency. Data is recent as of 15:42 EST on 12/20/2020.
• Hospital PPE: Unified hospitalization dataset in HHS Protect. This figure may differ from state data due to differences in hospital lists and reporting between federal and state systems. These data exclude psychiatric, rehabilitation, and religious non-medical hospitals. Hospitals explicitly identified by states/regions as those from which we should not expect reports were excluded from the percent reporting figure. Data is recent as of 16:27 EST on 12/20/2020.
• Skilled Nursing Facilities: National Healthcare Safety Network (NHSN). Data report resident and staff cases independently. Quality checks are performed on data submitted to the NHSN. Data that fail these quality checks or appear inconsistent with surveillance protocols may be excluded from analyses. Data presented in this report are more recent than data publicly posted by CMS. Last week is 12/7-12/13, previous week is 11/30-12/6.
• County and Metro Area Color Categorizations• Red Zone: Those core-based statistical areas (CBSAs) and counties that during the last week reported both new cases at or above 101 per 100,000
population, and a lab test positivity result at or above 10.1%.• Orange Zone: Those CBSAs and counties that during the last week reported both new cases between 51–100 per 100,000 population, and a lab test
positivity result between 8.0–10.0%, or one of those two conditions and one condition qualifying as being in the “Red Zone.”• Yellow Zone: Those CBSAs and counties that during the last week reported both new cases between 10–50 per 100,000 population, and a lab test
positivity result between 5.0–7.9%, or one of those two conditions and one condition qualifying as being in the “Orange Zone” or “Red Zone.”• Shortages: Unified hospital dataset in HHS Protect. These data exclude psychiatric, rehabilitation, and religious non-medical hospitals. Includes hospitals
reporting a staffing shortage currently or projected within one week. Low supply is defined as a hospital reporting 0 or 1-3 days’ supply, not able to obtain, or not able to maintain a 3-day supply of N95s, face masks, gloves, gowns, or eye protection. Data is recent as of 16:27 EST on 12/20/2020.
Issue 27