kempsey post bypass impacts monitoring study - final report · businesses had a web presence and...
TRANSCRIPT

Kempsey Post Bypass Impacts
Monitoring Study
FINAL REPORT
Prepared by Dr Bruno Parolin Transport Expert
Tran-Stat Research International
August 4, 2017
Prepared for
Kempsey Shire Council
Tran-Stat Research International

ii
Project Manager:
Dr Bruno Parolin
Contact:
Tran-Stat Research International
16 Vidal Street
Wetherill Park, NSW 2164
t: 0423948745
email: [email protected]
Date: August 4, 2017
Tran-Stat Research International

iii
Executive Summary
This report documents the findings of a study undertaken between May-June 2017 to monitor any
longer-term impacts of the opening of the Kempsey bypass and likely impacts of mitigation measures
on local businesses. The principal findings, which are based on a detailed survey of 124 businesses in
the town, are as follows:
The post bypass environment highlights that the bypass has triggered change on the main
street, predominantly in the town centre. In the period between 2013 and 2017, a total of 24
businesses that were part of the 2013 study had closed and 16 were under new ownership.
None of the 24 businesses had closed as a result of the bypass or any continuing negative
effects of the bypass- personal, management and lifestyle decisions were the main reasons for
closure.
During the same time period, 21 new businesses commenced operations in Kempsey with most
of these located in the town centre. Eleven out of 21 new businesses are in the eateries sector.
Only 11 out of 124 (8.8%) businesses in the 2017 survey indicated that they continued to be
negatively affected by the bypass since the 2013 study – through a continued downturn in sales
and turnover. Several of these businesses are in the eateries sector, other retail, auto services
and accommodation sectors, but no service stations indicated any continuing effects of the
bypass. Four out of the 11 affected businesses had experienced a greater than 50% downturn in
turnover after the opening of the bypass in March 2013, with the remaining businesses
reporting a 20%-50% downturn in turnover.
Only 5 out of the 11 (45.4%) businesses reported that they had put off additional staff in the
period following the 2013 study. An additional 20 jobs were lost, with 11 of these being full-time
positions and 9 being casual positions. However, some of these businesses increased
employment, especially after 2015, as their turnover began to improve and in 2 cases their
employment is now much higher than what was reported in the 2013 study. In aggregate terms,
these 11 businesses now employ 12 fewer persons than what was reported at the 2013 study.
The net effect of the loss of an additional 20 jobs is zero, especially considering the 170+
positions created at the service centre in 2015.
The 11 affected businesses continued to make adjustments to their business operations in
response to further loss of turnover by downsizing and reducing operating hours, increasing

iv
locally based advertising and promotions, diversifying product lines and engaging with social
media.
For most of these 11 businesses, the downturn in turnover continued for another 2 years
beyond the 2013 study, despite the continued presence of road construction workers and the
presence of hospital construction workers. Most indicated that their turnover had commenced
to improve by 2016 and there was a view that the worse was over.
A total of 113 out of 124 (91.1%) businesses reported that they did not experience any
continuing effects of the bypass since the 2013 study. Of these businesses, 92 were continuing
businesses and those under new ownership/management and 21 were new businesses. For the
92 businesses there were other non-bypass related factors that was affecting business
performance and profitability since the post-bypass survey in 2013 – the two main reasons
being a deteriorating retail environment and the changing nature of their respective industries
which exposes them to increased overseas influences and to concentration of ownership
patterns into large capital city based operations. The third mentioned factor was that of high
rents in the town centre in the context of a poorer retail trading environment.
Sixty two out of 92 (67.3%) businesses reported improved turnover, 17 (18.4%) reported that
turnover had stayed the same and 13 (14.1%) reported that turnover had got worse since the
2013 study. Across the 92 businesses, gross annual turnover had increased from $96.0 million to
$133.4 million - a 38.9% increase - between 2013 in the immediate post bypass period and the
surveys in 2017. The major share of the increase was accounted for by the clubs/hotels, food
sector, service stations and other retail sectors. The accommodation and auto services sectors
experienced the smallest absolute increases in turnover during this period. For the eateries
sector, there was a 61% increase in turnover that occurred at 5 out of the 11 eateries.
An additional 135 jobs were created across these 92 businesses compared to 2013. This
represents a 16.2% increase in total jobs recorded across these businesses at the time of the
2013 study – with increases in full-time and part-time jobs and casual positions. It is estimated
that the total wages/salaries figure for 2016-17 for these 92 businesses is in the order of $29.5
million. Only 7 out of the 92 businesses (7.6%) reported reducing the hours worked by staff.
Analysis of the data for these 92 businesses indicated that the 38.9% increase in turnover was
overwhelmingly associated with increased dependence on local trade, not unrelated to the
positive environmental effects of the diversion of traffic from the main street and to the
revitalisation of the town centre by Kempsey Shire Council.

v
Significant adjustments to business operations were made by these 92 businesses between
2013 and 2017, foremost among these had been to embrace social media and internet
technology for marketing and sales. At the time of the 2013 study, only 32 out of the 92 (34.7%)
businesses had a web presence and only 1 business had a social media presence. From the 2017
surveys, 50 out of the 92 (54.3%) businesses use Facebook and/or Instagram as a way of doing
business and generating sales; a total of 66 out of 92 businesses (71.3%) now have a web
presence. Other business adjustments mentioned included a move to local radio and TV
advertising, improving the appearance of their business, promotions and local branding,
enhanced training of staff and other customer service initiatives, and more traditional
adjustments such as new product lines or menus, working longer hours and re-doing signage for
the business.
For 19 out of 21 (90.4%) new businesses gross annual turnover had improved since commencing
business operations. It is estimated that gross annual turnover at the new businesses is in the
order of $23.4 million, of which $9.2 million is associated with the eateries sector.
Information provided by the 21 new businesses indicates that they employ a total of 250
persons in Kempsey, with 70% being made up of casual jobs. About 46% of all jobs are occupied
by females as casuals. Approximately 170 out of the 250 jobs are located at the service centre.
For the 21 new businesses, it is estimated that wages/salaries are in the order of $4.25 million
with 84% of wages/salaries accounted for by the eateries and other retail sectors.
Approximately 70% of wages are for casual employees of these businesses.
Most of the 21 new businesses also reported having to make adjustments to the way they
operate their business in light of changes in national and regional economic trends. Nineteen
out of the 21 new businesses commenced operations being social media ready. In general, they
have a greater focus on local marketing and promotions, customer service experiences and the
look and feel of their respective businesses. The emphasis of most owners/managers of the new
businesses was on making their business a destination for both locals and travellers.
In terms of gross annual turnover at all businesses (115 in 2013 and 124 in 2017), there has
occurred an increase in turnover from $109.5 million in 2013 to $159.2 million in 2017 – a 45.2%
increase over figures for 2013. The largest increases have occurred in the more traditional
highway related sectors of service stations and eateries but the food sector made a significant
contribution to the increase as well. Turnover figures for the 124 businesses in 2017 were now
higher than the total turnover figures for 2012 - one year before the opening of the bypass.
vi
Between the period 2013 and 2017, across all businesses, there has been an increase of 249
jobs – from 1137 jobs in 2013 to 1386 jobs in 2017 – an increase of 21.8% over 2013 levels. The
largest increases have occurred in the part-time and casual employment categories with casual
employment accounting for 53.6% of all jobs. A total of 170+ jobs out of the total of 249 jobs
were created following the opening of the service centre in 2015. The largest gains in
employment have occurred in the eateries sector (474 out of 1386 jobs or 34.1%), followed by
the other retail sector (349 out of 1386 jobs or 25.1%) and the food services sector (234 out of
1386 jobs or 11.8%). All other highway related sectors such as accommodation, clubs/hotels,
auto services and service stations all experienced increases in employment.
From the figures provided by the 124 businesses in 2017 it is estimated that total wages/salaries
is in the order of $36.1 million, with the accommodation and eatery sectors having the lowest
proportion of the total due to their high dependence on casual employees.
There were no continuing indirect effects of the bypass in the post 2013 survey period. None of
the businesses supplying the highway related sector that closed after 2013 had closed due to
continued reductions of purchases made by highway oriented businesses. Businesses reported
increased reliance on non-local wholesalers and distributors based in Coffs Harbour or Port
Macquarie, or in the capital cities. Lower prices, greater reliability and speed of delivery were
the main reasons cited by businesses for greater reliance on more corporate based supply chain
networks. Some businesses reported greater reliance on local supermarkets for supplies where
price, availability and freshness were major considerations. Some specialised eateries were
reliant on fresh local produce and maintain important linkages with local farmers for continuous
supply of produce.
A total of 23 out of 124 (18.5%) businesses reported that they had been affected by the
streetscape revitalisation program. Fourteen out of 23 (60%) businesses indicated that the
streetscape revitalisation program had a positive effect on their business, whereas for 9
businesses the effect had been negative. For the 14 businesses in the town centre that indicated
the effect had been positive, the main factors were increased pedestrian activity that had
translated into sales – the street upgrade had been good for business. Those for which the
effect had been negative, also located on the main street, their turnover had declined during
the construction phase and construction extended beyond the scheduled completion date –
they did not perceive any increased pedestrian activity.

vii
Across all 124 businesses, the positive impacts of the streetscape revitalisation program focus
on the enhanced attractiveness of the town centre, its vibrancy and beauty, and improved
parking for locals and visitors alike. The perceived negative impacts by businesses focus on
length of construction, perceived lack of consultation by Council prior to commencement of
works, removal of parking spaces and the view that it does not bring more people into town.
However, there is overwhelming agreement among the 124 businesses that the streetscape
revitalisation program has been a success for the shopping experience.
A total of 7 out of 124 (5.6%) businesses indicated they had been affected by the opening of the
highway service centre; 1 had been positively affected and 6 were negatively affected. Five out
of the 6 businesses that reported being negatively affected indicated that the effects were of
short-term duration and that the decrease in turnover was between 5-10%. For one business
the drop in turnover was higher and resulted in the loss of one job. There was overwhelming
agreement among the 124 businesses that the service centre has had a positive impact on the
economy of Kempsey, mainly through the multiplier effects of the 170+ jobs on the local
economy.
Only 28 out of 124 businesses (22.5%) indicated that they are likely to be affected either
positively or negatively after the opening of the Port Macquarie – Kempsey upgrade. Thirteen
out of 28 businesses (46.4%) perceive that the impacts are likely to be positive and 15
businesses (53.5%) perceive likely negative impacts. Those businesses that anticipate negative
impacts see further retail leakage to Port Macquarie and changes in travel behaviour due to
travel time savings as moving stopping patterns for highway related needs further north and
south of Kempsey. Those businesses that anticipate positive impacts perceive that travel time
savings should encourage further day trip travel to Kempsey from Port Macquarie and
surrounds.
Among those 15 businesses that anticipate negative impacts the view is that these are likely to
be of short-term duration, to be relatively small in terms of drop in turnover and not to lead to
any job losses or reductions in working hours of staff. Those businesses anticipating an increase
in turnover are likely to employ additional staff depending on the extent of increase in turnover.
There was much less criticism directed at Council by businesses due to the very proactive
measures adopted by Council between 2013 and 2017 as regards economic development and
job creation. Businesses noted that Council priorities should now be on a development vision
where there are much higher levels of growth in people, industry and jobs, and this plan should
viii
be widely promoted to attract new industry. There is also a priority for Council to facilitate in
attracting new retailers to the main street to replace some large retailers that closed down after
2013. Attracting visitors to the town with more events based activities of a sporting, social and
cultural nature through use of social media could also benefit the economy and the town
centre. The perceived opportunities for Council focus primarily on the need for economic
growth through encouragement of younger entrepreneurs, developing a transport interchange
for Kempsey and other forms of event based tourism.
The post bypass strategies adopted by Council to mitigate against negative impacts of the
bypass – streetscape revitalisation program and highway service centre – have been very
successful for the local economy and for the shopping experience. Investment in infrastructure
to beautify the main street in the town centre has created the necessary conditions for higher
dependence on local trade and visitors, and for attracting new retail businesses in the future.
For the overwhelming majority of businesses, the bypass is no longer a topic of discussion. The
continuing effects of the bypass for a very small number of businesses probably lingered on for
2 more years. For the majority of businesses, even those that had initially been negatively
affected to some extent, the impacts were of short-term duration. There were other economic
changes on the horizon such as the downturn on the retail environment that was concerning
businesses. For the economy of Kempsey, the proactive measures adopted by Council, and
more recent initiatives such as the flying school at the airport, cinema complex at Kempsey
Central, tourism initiatives and further infrastructure spending all contribute to economic
development and growth. The future expansion of the correctional facility at Kempsey will add a
further 110 full-time positions and benefit many businesses, including retailers on the main
street.
ix
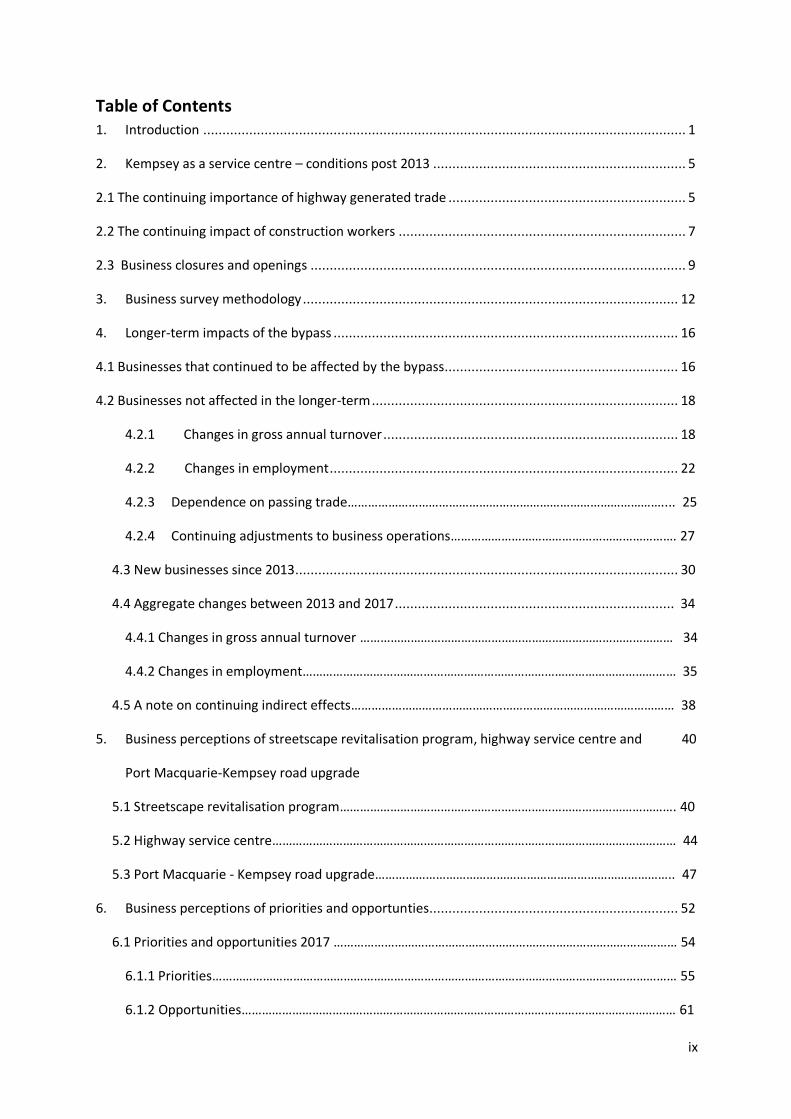
Table of Contents 1. Introduction .............................................................................................................................. 1
2. Kempsey as a service centre – conditions post 2013 .................................................................. 5
2.1 The continuing importance of highway generated trade .............................................................. 5
2.2 The continuing impact of construction workers ........................................................................... 7
2.3 Business closures and openings .................................................................................................. 9
3. Business survey methodology .................................................................................................. 12
4. Longer-term impacts of the bypass .......................................................................................... 16
4.1 Businesses that continued to be affected by the bypass............................................................. 16
4.2 Businesses not affected in the longer-term ................................................................................ 18
4.2.1 Changes in gross annual turnover ............................................................................. 18
4.2.2 Changes in employment ........................................................................................... 22
4.2.3 Dependence on passing trade………………………………………………………………………………….... 25
4.2.4 Continuing adjustments to business operations…………………………………………………………. 27
4.3 New businesses since 2013.................................................................................................... 30
4.4 Aggregate changes between 2013 and 2017 ......................................................................... 34
4.4.1 Changes in gross annual turnover ………………………………………………………………………………… 34
4.4.2 Changes in employment………………………………………………………………………………………………… 35
4.5 A note on continuing indirect effects…………………………………………………………………………………… 38
5. Business perceptions of streetscape revitalisation program, highway service centre and 40
Port Macquarie-Kempsey road upgrade
5.1 Streetscape revitalisation program………………………………………………………………………………………. 40
5.2 Highway service centre………………………………………………………………………………………………………… 44
5.3 Port Macquarie - Kempsey road upgrade…………………………………………………………………………….. 47
6. Business perceptions of priorities and opportunties................................................................. 52
6.1 Priorities and opportunities 2017 ………………………………………………………………………………………… 54
6.1.1 Priorities………………………………………………………………………………………………………………………… 55
6.1.2 Opportunities………………………………………………………………………………………………………………… 61

x
7. Summary and conclusion ......................................................................................................... 63
References
Appendix 1 Employment by Industry - Kempsey Shire 2010/11 to 2015/16
Appendix 2 Letter to businesses
Appendix 3 Business survey

1
1. Introduction
In October 2013, UNSW Global Pty Ltd – the consulting arm of the University of New South
Wales – was contracted to undertake a study for Kempsey Shire Council to monitor the
economic impacts of the opening of the bypass at Kempsey and Frederickton on local
businesses (Parolin, 2013). At the time of the study, the bypass had been opened for seven
months (opened March 27 2013). This was seen as an opportune time to monitor economic
impacts given that responses by highway related businesses that were negatively affected
by the bypass tend to be of short-term duration, normally within the first year (Parolin and
Garner, 1996a; Parolin, 2012).
The 2013 study made a number of key findings, these included:
The total reduction in gross annual turnover among businesses that were negatively
affected by the opening of the bypass (service stations, food stores and eateries) was
relatively small when compared to gross annual turnover and to the estimated total
economic output of the town.
The effect on employment of the opening of the bypass was a net loss of 74 jobs, much
smaller than predicted. Redundancies primarily affected those in casual and full-time
employment: females accounted for the majority of job losses in the casual
employment category.
Thirty-four out of the 68 businesses (50%) that reported a decrease in their turnover as
a direct result of the diversion of through traffic from the town reduced the hours
worked by staff – predominantly in the eateries, food and service station sectors. For
remaining businesses the preference was to absorb the downturn in turnover rather
than reduce staff hours or shed labour.
About half of the businesses that experienced a downturn in turnover had made
compensatory adjustments to their operations. There was no evidence to suggest that
the opening of the bypass directly resulted in the closure of businesses.

2
Just over half (54.9%) of all businesses surveyed perceived that the impact of the bypass
on the economy of the town had not been positive. On the other hand, there was a
widespread belief that the diversion of through traffic from the town had positive
environmental effects as a result of the reduction in noise levels (particularly from
heavy traffic) and pollution and dust levels, that the main street had become safer for
pedestrians and that this would enhance the quality of the town centre as a place for
shopping and service provision for local residents as well as making it more attractive as
a stopping place for motorists in future.
Businesses perceived that the priorities for Council in the post bypass environment
should focus on completion of the beautification of the main street scheme, rectifying
the signage on the bypass and in bringing more jobs and people to the town. The
perceived opportunities for Council focussed primarily on the need for strong economic
growth.
Proactive measures adopted by Council in the pre- and post-bypass period led to the
development of a post-bypass strategy targeted at highway related businesses that
attempted to mitigate against the adverse impacts of the bypass documented in the
study. A key focus of this strategy was additional employment opportunities in town,
especially support for development of a highway service centre at the southern
interchange.
In sum, the above findings indicated that, while there were both positive and negative
impacts of the bypass, there would indeed be ‘Life After The Bypass’, that adverse economic
impacts of the bypass were minimal, generally of short-term duration and would be
surpassed by employment to be generated by various economic developments that were in
the pipeline. Since 2013, the street revitalisation program has been completed by Council
and a highway service centre opened in May 2015 at the southern interchange – both of
these elements were critical components of the Kempsey Shire Council Bypass Strategy
developed in 2011 to mitigate against the expected negative impacts of the bypass. A key
question for the present study is how have the mitigation measures impacted the business
community in Kempsey and Frederickton?
3
The upgrade of the Pacific highway from Port Macquarie to Kempsey is also due to be
opened in the latter half of 2017. Given some concerns raised by highway related businesses
in the 2013 study about the extent of retail leakage to Port Macquarie, how do businesses
perceive the road improvements that will lead to a reduction in travel time between Port
Macquarie and Kempsey, and vice-versa? It is now opportune to assess the anticipated
impacts of this highway upgrade on business activity in Kempsey and Frederickton.
This report, commissioned by Kempsey Shire Council, aims to address the Bypass Strategy
requirement for longer-term monitoring and assessment of economic impacts, if any, of the
Kempsey bypass and the impact of mitigation strategies on businesses. The objectives are
to:
Document whether the impacts of the bypass were short-term or lingered on for some
time, especially due to the continuing presence of road construction workers and
construction workers associated with other employment opportunities;
Understand what other non-highway related factors may have affected business
performance since the last study, as some of these factors could be relatively more
important than the impacts of the bypass;
Understand the degree of importance of highway generated trade to the economic base
of Kempsey and Frederickton four years since the opening of the bypass;
Document what other adjustments were made by businesses since the last study;
Investigate the impacts of the provision and upgrade of infrastructure designed to
mitigate against negative impacts of the bypass on businesses and on the economy of
Kempsey, and;
Document any further perceived priorities and opportunities on the part of businesses
for Council consideration into the future.
The underlying assumption of the present study is that a highway bypass triggers change in
the highway related sector of a town economy so that the retail landscape may be quite
different in the longer-term (Parolin, 2011). How well businesses, the community and other

4
key stakeholders capitalise on these changes is a key ingredient in managing longer-term
post bypass recovery and change.
To understand the above dimensions and provide comparable data, the approach adopted
in this study is similar to that of the 2013 study where the After effects are quantified. Given
that it is four years since the opening of the Kempsey bypass, two years since the opening of
the highway service centre and 18 months since completion of the street revitalisation
program in the town centre of Kempsey, the focus of this study is on longer-term monitoring
of post bypass impacts. This is an aspect that, with the exception of two studies (Phibbs,
Heidrich and Cooney, 2009; Parolin, 2012), has been largely absent from local studies of the
economic impacts of bypass roads on town economies.
This report presents the results of the assessment of potential longer-term impacts of the
bypass on highway related businesses within Kempsey and at Frederickton, impacts of
initiatives such as the streetscape revitalisation program and highway service centre, and
likely impacts of the upgrade of the highway from Port Macquarie to Kempsey. The
document includes the following information:
Background on Kempsey in the post-bypass environment; Key findings of the study in terms of any longer-term economic impact on
businesses, or impacts of other changes since 2013; and
Conclusions and recommendations.

5
2. Kempsey as a service centre –
conditions post 2013
The recent availability of 2016 census data does not allow one to directly compare
employment by industry numbers at the urban centre locality level for Kempsey with
corresponding numbers at the 2011 census. The main reason for this is that urban centre
locality data and employment by industry data at any level for Kempsey has yet to be
released (expected October 2017).
However, comparisons can be made of employment by industry for Kempsey Shire between
2010-11 and 2015-16 using data provided by a private company called .id
(http://www.id.com.au ). Appendix 1 provides the complete table for all 19 industry types.
The totals are estimates of employment based on outputs of a national model but these
provide a view of trends in employment, especially across the retail trade and
accommodation and food services industries - two industries that are most directly linked to
highway-generated trade.
The figures in Appendix 1 highlight a small decline in retail trade jobs across the two years
and an increase in jobs in the accommodation and food services industry. When retail trade
is combined with the accommodation and food services industry sectors they account for
19.4% of estimated total employment in Kempsey Shire in 2015/16. Other significant
increases in employment were experienced in agriculture, forestry and fishing,
manufacturing, healthcare and social assistance, education and training, and the
construction industries.
2.1 The continuing importance of highway generated trade
Despite the downturn in gross annual turnover and reduced dependence on highway
generated trade experienced by highway related businesses as a direct result of the opening
of the Kempsey bypass (as documented in the 2013 study), Kempsey continues to maintain

6
a strong role as a mid-journey service centre serving the demands of motorists travelling on
the Pacific Highway.
A proportion of jobs in the town still depend on the highway (directly or indirectly), and
many businesses (especially the service stations, eateries and accommodation
establishments) still exist because of, or depend to some extent, on expenditures made by
motorists stopping or staying overnight in the town. Nowhere is this more evident than at
the highway service centre located at the southern interchange. Interviews with businesses
at the highway service centre indicated that, on average, 90% of turnover is from through
travellers stopping for highway related needs such as petrol and food. The remaining 10% is
made up from locals who use the centre for the same reasons.
Further, the business surveys undertaken for the present study indicate that a total of 170
persons are employed at the highway service centre – this number exceeds 200 employees
during the main holiday periods (Xmas, Easter and school holidays). The vast majority of
persons employed at the highway service centre reside in Kempsey and surrounding
localities. It is safe to assume that the wages and salaries of highway service centre
employees will be spent in Kempsey and elsewhere and, therefore, this expenditure will also
be reflected in the turnover of highway related and other retail businesses in Kempsey and
Frederickton.
The values in Appendix 1 also suggest that the importance of highway-generated trade at
Kempsey may have increased somewhat in the three years following the opening of the
bypass. Increased employment in the accommodation and food services industry suggests
an increased level of traffic and business activity on the main street, either from local
customers or through motorists stopping for highway related needs, or both, and from through
motorists staying overnight or longer in accommodation establishments.
All of the motels and caravan parks in Kempsey still depend to a large degree on through
travellers who have either pre-booked or come in off the highway for an overnight stop.
It is very likely that through travellers stopping for highway related needs and day trip
travellers stopping to experience Kempsey may be increasing since the 2013 study. This can
only be documented through evidence from the survey of businesses on the main street

7
and, of course, from the responses of businesses at the highway service centre. While the
scope of this study did not permit a survey of through stopping travellers or of overnight
stayers, the volume of traffic evident on Macleay Valley Way from South Kempsey through
the town centre and to Smith Street and beyond, would suggest that through travellers
stopping for highway related needs are slowly beginning to return to the main street.
Businesses surveyed as part of this study also indicated the increasing presence of regional
day trippers on the main street. When the above trends are added to the importance of
local shopping on the main street due to the enhanced environmental amenity of the town
in the post bypass period, it is very likely that highway generated trade and serving the
needs of highway travellers has increased in importance in the post bypass environment.
2.2 The continuing impact of construction workers
The 2013 study highlighted that many businesses in Kempsey benefited for several years
during construction of the bypass and continued to benefit to a lesser extent in the
immediate post bypass period. For example, construction of the 2nd stage of the 40
kilometre Kempsey to Eungai project continued after the opening of the Kempsey bypass
until it’s opening in May 2016. The Port Macquarie to Kempsey road upgrade commenced in
2014 and is due for completion in the latter part of 2017. These road projects have been
associated with road construction workers spending income in Kempsey and Frederickton,
and at the highway service centre in particular. In 2015/16, the estimated number of
construction workers in the town was higher than that estimated for 2010/11 (Appendix 1).
Many of those included in this category would have been temporarily resident in the town
while working on the Frederickton to Eungai upgrade and to a lesser extent the Port
Macquarie-Kempsey upgrade - a fact documented by local real estate agents, moteliers, and
hoteliers.
Data are not available to enable the total amount of income brought into the town by the
construction workforce between 2013 and 2017 when the field work for the present study
was undertaken. However, it is reasonable to assume that this amounted to several million
dollars annually during this period. As a result, expenditures by construction workers had
undoubtedly inflated the gross annual turnover of a number of retail businesses, the hotels

8
and motels for at least 2-3 years after the opening of the bypass and, in no measure, would
have contributed to the adjustments that many had to make to survive in the post bypass
period. Many businesses surveyed as part of the present study also indicated that gross
annual turnover had commenced to recover in the 2-3 year post bypass period, and for a
limited number of businesses had only begun to decline again in the past financial year due
to a poorer retail trading environment.
From information collected during fieldwork for this study, the hotels and motels in
particular reported higher than normal occupancy rates as a result of construction workers,
road engineers and other personnel dealing with road projects. Several garages, auto
repairers and auto parts businesses indicated that turnover had increased since the 2013
study as a result of the extra work servicing vehicles and equipment associated with
construction activities.
In addition, many highway related businesses would have benefitted from the expenditures
of construction workers and construction activity associated with the major upgrade of
Kempsey Hospital that commenced in 2014 and was completed in early 2016. The loss of
this additional income and expenditure following the departure of workers upon completion
of both road and hospital projects would have required further adjustments to business
operations at some of the highway related businesses in Kempsey and Frederickton. From
the field surveys for the present study, the consensus among the motels and caravan parks
is that road construction workers on the Port Macquarie-Kempsey upgrade are
predominantly locals and that very few are residing at caravan parks in particular.
At the time the surveys for this study were undertaken, the effects of construction workers
on the town was therefore significantly diminished and what was still present was largely
being felt at the service centre. All of the businesses at the service centre expect a slight
downturn in turnover as a result of a reduction in construction-related expenditure due to
the imminent departure of the main body of workers as the Port Macquarie-Kempsey road
upgrade approaches completion in the latter part of 2017.

9
2.3 Business closures and openings
The reconnaissance and fieldwork undertaken for this study indicates substantial changes to
the 115 businesses surveyed as part of the 2013 study.
A total of 24 (20.8%) out of the 115 businesses had closed outright (Table 1). During
interviews with the proprietors of new business establishments at the old address, the main
reasons cited for closure of the 24 businesses were retirement, mismanagement,
unwillingness on the part of family members to take over the business, the negative impacts
of retail leakage to Port Macquarie, and a deteriorating retail environment (similar reasons
were given in the 2013 study). None of the 24 businesses had closed as a result of
continuing effects of the bypass. Most of these businesses had closed by 2015, despite the
positive multiplier effects of construction activity from road and hospital projects. One
clothing business had closed during fieldwork for the present study. From Table 1 the types
of businesses that had closed occurred across most categories, except for the
accommodation sector where 6 out of the 9 accommodation establishments have new
owners.
Most closures have occurred in the town centre (Smith and Belgrave Street), except for
several businesses in South Kempsey and one butcher in Frederickton. A total of 7 eateries
had closed and 13 ‘other retail’ businesses. The most notable closures were Barsby’s
department store and Harvey’s furniture store in the town centre. Among the ‘other retail’
category are included a national discount store (Crazy Clarks), two bike stores, antique store
and pharmacy store, etc.
Sixteen (13.9 %) out of the 115 original businesses are trading with new owners
(commenced trading after the survey in 2013) and 87 (75.6%) are continuing businesses that
are included in the current survey of businesses. There is no doubt that the retailing
landscape on the main street has witnessed quite rapid change since the 2013 study as a
result of closures and new ownership patterns, and new businesses as well. In addition,
seven continuing businesses had relocated, predominantly to the town centre and along
Smith Street, to take advantage of increased access, parking and visibility to customers.

10
Table 1
Current status of surveyed businesses at Kempsey from 2013 study, and new businesses
Category Description
Surveyed in 2013
Closed New
Ownership Continuing
New Business
(since 2013)
A Motels Caravan Parks 2 - 2 - -
Caravan Parks Motels 7 - 4 4 -
B Clubs Clubs 1 - - 1 -
Pubs 3 1 1 1 -
C Food Supermarket/Grocery 5 1 - 4 -
Stores Butcher 3 1 - 2 1
Fruit-Vegetables 1 1 - - -
Bread/Cakes 3 - - 3 -
Specialised Food 1 - - 1 -
D Automotive Car Dealers 1 - - - -
Auto Electrical 2 - - 2 -
Car Maintenance 2 - - 2 -
Tyre Retailing 4 - 1 3 -
Repairs/Spare Parts Services 9 - - 11 1
E Service Stations Service Stations 5 - 1 6 1
F Eateries Take-away Food 8 5 2 6 1
Café/Restaurant 14 2 3 4 10
G Other Retail Liquor Retailing 1 - - 1 -
Department Stores 2 1 - 1 -
Clothing 7 3 - 6 1
Footware 1 - - 1 -
Furniture 2 1 - 1 -
Gifts/Homewares/Hardware 3 - - 4 1
Appliances 1 1 - - 1
Sports/Camping/Recreational 2 1 - 2 -
Newspapers/Books/Stationary 5 2 2 2 -
Toys & Games 2 - - 2 -
Pharmacies 3 1 - 3 1
Antiques 1 1 - - -
Jewellers 1 - - 1 -
Other retail n/c 10 1 - 11 2
Caravans/Trailers 1 1 - - -
Cultural Centre/Museum - - - - 1
Laundries and Drycleaners 1 - - 1 -
Visitor Information Centre 1 - - 1 -
Total 115 24 16 87 21

11
Of the 21 completely new businesses that have opened up since 2013, five are located at the
service centre – most are national brands – and the majority of other new businesses are
located in the town centre. It is interesting to note that there are 11 new businesses in the
eateries sector (4 of these are located at the service centre). The Slim Dusty Centre which
incorporates the Slim Dusty Museum opened in 2015.
This section has highlighted the fact that Kempsey has been undergoing rapid change over a
relatively short period of time since the 2013 study. Much of this change has been triggered
by the bypass and, undoubtedly, the role of other national economic factors. The perceived
impacts on the part of highway related businesses to post bypass mitigation measures put in
place by Council, and perceptions of other road infrastructure development, remains the key
question for investigation in the present study.

12
3. Business survey methodology
In this study the baseline data was collected as part of the 2013 study (UNSW Global, 2013)
and enables a comparison of changes in employment, gross annual turnover, passing trade,
business adjustments and perceptions of the longer-term impacts of the bypass on the
economy of Kempsey and on the liveability of the town with businesses included as part of
the present study.
This report summarises the results of findings from a study undertaken between May 1st and
June 2nd 2017, approximately 42 months since the 2013 study and 4 years since the opening
of the bypass. Extensive reconnaissance work was undertaken prior to the commencement
of the survey work to (i) determine which of the businesses that were part of the 2013
survey had closed, were under new ownership, were continuing, were new businesses, and
(ii) determine those additional businesses to be included in the present study.
The information collected in the business surveys allows assessment of changes in business
turnover and employment levels that, if present, are directly attributable to the on-going
effects of the bypass. Information is also sought on reductions in staff working hours and
wages/salaries that may also be attributable to the on-going effects of the bypass. How
these on-going direct effects have further affected indirect linkages with local suppliers is
also assessed. The business survey also assesses the perceived impact of the two key
infrastructure initiatives – the street revitalisation program and highway service centre –
that were part of Council’s mitigation strategies in the post bypass environment, and the
perceived impacts of the Port Macquarie-Kempsey road upgrade. Several questions in the
survey identify business perceptions of priorities and opportunities for Council in the post
bypass environment, and this can be compared with similar perceptions in the 2013 study.
A total of 126 business establishments were initially selected for inclusion in the survey. All
businesses included in the survey were personally visited in order to meet the manager or
proprietor, to briefly explain the purpose of the study, to leave a cover letter outlining in
more detail the scope of the study and ethical considerations, and inviting them to
participate in the questionnaire based survey. A copy of this letter is provided in Appendix 2.

13
This occurred at the same time as a press release appeared in The Macleay Valley Argus
announcing the study and its objectives. The business survey was conducted as a face-to-
face interview with the owner, manager or proprietor of the business, and only after
permission had been granted for the interview to take place. A copy of the business survey is
provided in Appendix 3.
Of the 126 businesses selected for inclusion in the survey, two declined to participate (in the
food sector). A total of 124 businesses therefore participated in and completed the
interview based questionnaire survey. Several businesses that existed in 2013, but not
surveyed, were included in the present study. Two of these businesses had relocated to
Smith Street and the town centre respectively from locations in West Kempsey and the
industrial estate in South Kempsey. One business in the accommodation sector, which is
now under new ownership, was not surveyed in 2013 due to absentee owners but is
included in the present study.
The businesses are classified by their ANZSIC code in Table 2. For the purpose of analysis,
they have been grouped into the same seven broad functional categories as in the 2013
study: accommodation, clubs/hotels, food stores, automotive services, service stations,
eateries (including take-away places, cafes, and restaurants), and ‘other retail’
establishments. These broad categories are used in summarising the findings in this report.
It should be noted that several business types within the study area were excluded from the
business surveys including banks and building societies, building, painting and home
improvement outlets, personal services (e.g. massage therapy), and professional services
(e.g. accountants/ financial planners, solicitors, real estate agents, recreation and travel
outlets, medical centres, doctor’s offices, chiropractors and optometrists. On a priori
grounds these are highly unlikely to service the needs of travellers and would not have been
affected or continue to be affected by the bypass. However, since many of these businesses
are located in the town centre or in close vicinity of the town centre, they would have
benefitted from the street revitalisation program.

14
Table 2
Classification of businesses by ANZSIC Code and functional category
Category ANZSIC Code
Description Number Total Percent
A Accommodation 9990 Caravan Parks 2 - -
9999 Motels 8 10 8.06%
B Clubs/Hotels 5740 Clubs 1 - -
5720 Pubs 2 3 2.41%
C Food 5110 Supermarket/Grocery 4 - -
5121 Butcher 3 - -
5124 Bread/Cakes 3 - -
5129 Specialised Food 1 11 8.87%
D Automotive Services 5322 Auto Electrical 2 - -
5323 Car Maintenance 2 - -
5324 Tyre Retailing 4 - -
5329 Repairs/Spare Part Services 12 20 16.12%
E Service Stations 5321 Service Stations 8 8 6.45%
F Eateries 5125 Take-away Food 9 - -
5730 Cafe/Restaurant 17 26 20.96%
G Other Retail 5123 Liquor Retailing 1 - -
5210 Department Stores 1 - -
5221 Clothing 7
5222 Foot-ware 1 - -
5231 Furniture 1 - -
5233 Hardware/Gifts/Homewares 5 - -
5234 Appliances 1 - -
5241 Sports/Recreational/Camping 2 - -
5242 Toys & Games 2 - -
5243 Newspapers/Books /Stationary 4 - -
5251 Pharmacies 4 - -
5255 Jewellers 1 - -
5259 Other Retail n/c 13 - -
8910 Cultural Centre/Museum 1
9521 Laundries and Drycleaners 1 - -
9980 Visitor Information Centre 1 46 37.09%
TOTAL 124 124 100.00%
Most of the businesses included in the survey (71 establishments) are concentrated in the
town centre along Belgrave Street and Smith Street, and in streets that are one or two
blocks behind these main streets. The town centre is bordered by Stuart Street, Sydney
Street, Verge Street and York Lane. This is especially the case for the hotels and clubs,
15
eateries, service stations, accommodation, most of the businesses in the ‘other retail’ and
food categories, and some of the automotive businesses. Smith Street also includes a
number of accommodation, service station, eatery, and automotive businesses from the
McDonalds Restaurant north to the Shell petrol station. A number of businesses are located
in South Kempsey, from the service centre at the southern interchange to Lord Street, in
which are found eateries, accommodation establishments, two 24 hour service stations and
some automotive businesses. Several businesses are also located in East Kempsey along
Lord Street to the Macleay River Bridge and several are also located in Rudder Street – these
are in the accommodation and eatery sectors. The remainder of businesses are located
north of Kempsey in Frederickton and include businesses in the eatery, club/hotel, and
‘other retail’ categories.

16
4. Longer-term impacts of the bypass
This section presents results from the survey of businesses and assesses the nature and
extent of longer-term economic impacts of the bypass, if any, on businesses and
adjustments to business operations since 2013.
4.1 Businesses that continued to be affected by the bypass
Only 11 out of the 124 businesses in the survey (8.8%) indicated that they continued to be
negatively affected by the bypass since the 2013 study – through a continued downturn in
sales and turnover. As might be expected, these are all businesses serving the needs of
motorists and through travellers, but also serving local needs (Table 3) and for the most part
were very dependent on highway generated trade. Among the two accommodation
establishments one is a motel and the other a caravan park. The ‘other retail’
establishments include two businesses at South Kempsey and one at Frederickton.
Table 3
Did your business continue to be affected by the bypass since the 2013 study?
Affected by the bypass
Accommodation Clubs/
Hotels Food
Auto
Services
Service
Stations Eateries
Other
Retail
Total
No. %
Yes 2 1 - 1 - 4 3 11 8.8
No 8 2 11 19 8 22 43 113 91.1
Total businesses 10 3 11 20 8 26 47 124
Of the 11 businesses that reported continuing negative effects on their business
profitability, four had experienced a greater than 50% downturn in annual turnover after the
bypass opened in March 2013, with remaining businesses experiencing a downturn in
revenue of between 25% - 50% (from the 2013 study). Seven (7) out of the 11 businesses
(63.6%) reported that their turnover in 2016-17 was less than in 2013 after the opening of
the bypass; 2 businesses indicated that turnover had remained the same, and; 2 businesses
indicated that turnover had improved significantly since 2013, but only after the short-term
effects of the opening of the service centre in 2015 had run their course. In general, there
was a consensus among 9 out of the 11 businesses (those whose turnover had decreased or

17
remained the same) that turnover figures were now improving and would continue to do so
in the future as the retail trading environment improves.
In terms of employment impacts, only 5 out of the 11 businesses (45.4%) reported that they
had put off additional staff after the 2013 study. An additional 20 jobs were lost, with 11 of
these being full-time positions and 9 being casual positions. However, these additional job
loss figures need to be placed in context as they occurred over a 3 year period and several of
the same businesses that laid-off additional staff then employed staff as their turnover
increased after 2015. In the case of one business, an eatery, turnover began to substantially
increase to the point where it now employs 30 more people than what was reported in the
2013 study. In essence, the net effect of the loss of an additional 20 jobs is zero, especially
considering the employment created at the service centre in 2015.
The employment structure in 2017 at the 11 businesses (Table 4) indicates that, on average,
the businesses are employing 12 fewer persons as compared to that reported at the time of
the 2013 study. Table 3 highlights less reliance on full-time employees, a significant increase
in part-time employment and employment for casual males, but a decrease in jobs for casual
females.
Further, the 11 businesses continued to make adjustments to their operations since the
2013 study in response to a more competitive trading environment. The most commonly
cited ways in which businesses tried to recover from further loss of turnover was to
downsize and reduce operating hours, increase locally based advertising and promotions,
diversify product lines and menus (if an eatery), and embrace social media. Only 1 business
reported a reduction in the working hours of staff. Two businesses mentioned that they
tried to improve customer service as part of a bundle of adjustment strategies. It is
interesting to note that only 3 out of the 11 businesses did not have a social media
presence, and the proprietors of these businesses were not intending to embrace social
media in the future given their stage in the life-cycle.

18
Table 4
Employment structure - 2013 and 2017 for 11 businesses
Category 2013 2017
No. of businesses 11 11
Full-time male 17 6
Full-time female 16 8
Part-time male 4 26
Part-time female 9 25
Casual male 39 47
Casual female 95 56
Total 180 168
4.2 Businesses not affected in the longer-term
Table 3 indicates that the vast majority (91.1%) of businesses (113 out 124) reported that
they were not affected by the bypass or did not experience any continuing effects of the
bypass since the 2013 study. This number also includes the 21 new businesses that
commenced trading since 2013 but for which there is no data from the 2013 study. In order
to more accurately determine the types of changes occurring in employment, passing trade,
annual turnover and business adjustments for those not affected in the longer-term, the
following analysis excludes the 21 new businesses (they are treated separately in a later
section). In essence, the analysis for the present is focussed on continuing businesses and
those under new management/ownership (n=92) for which data is available from the 2013
study. This provides a more realistic assessment of changes since 2013.
4.2.1 Changes in gross annual turnover
It must be stressed at the outset that for these 92 businesses there were other non-bypass
related factors affecting business performance and profitability since the survey in 2013.
Table 5 highlights that 62 out of the 92 businesses (67.3%) reported improved changes in
turnover since the 2013 study, 17 (18.4%) reported that turnover stayed the same and 13
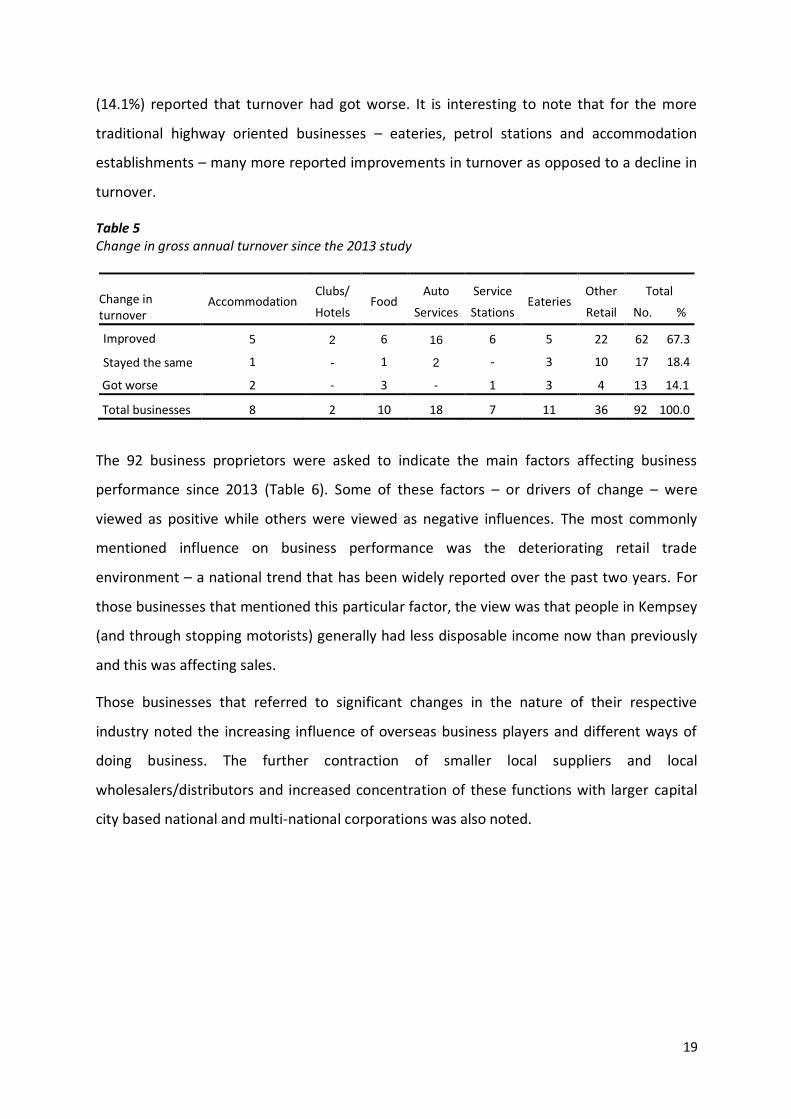
19
(14.1%) reported that turnover had got worse. It is interesting to note that for the more
traditional highway oriented businesses – eateries, petrol stations and accommodation
establishments – many more reported improvements in turnover as opposed to a decline in
turnover.
Table 5 Change in gross annual turnover since the 2013 study
Change in turnover
Accommodation Clubs/
Hotels Food
Auto
Services
Service
Stations Eateries
Other
Retail
Total
No. %
Improved 5 2 6 16 6 5 22 62 67.3
Stayed the same 1 - 1 2 - 3 10 17 18.4
Got worse 2 - 3 - 1 3 4 13 14.1
Total businesses 8 2 10 18 7 11 36 92 100.0
The 92 business proprietors were asked to indicate the main factors affecting business
performance since 2013 (Table 6). Some of these factors – or drivers of change – were
viewed as positive while others were viewed as negative influences. The most commonly
mentioned influence on business performance was the deteriorating retail trade
environment – a national trend that has been widely reported over the past two years. For
those businesses that mentioned this particular factor, the view was that people in Kempsey
(and through stopping motorists) generally had less disposable income now than previously
and this was affecting sales.
Those businesses that referred to significant changes in the nature of their respective
industry noted the increasing influence of overseas business players and different ways of
doing business. The further contraction of smaller local suppliers and local
wholesalers/distributors and increased concentration of these functions with larger capital
city based national and multi-national corporations was also noted.

20
Table 6
Factors affecting business operations since 2013
Most frequently mentioned factors
Most frequently mentioned changes by businesses
Frequency1
A poorer retail environment 40
Our industry is changing rapidly due to overseas and local influences 20
Rents are too high given the trading situation 13
Financial constraints of public and private sectors generating fewer sales 8
Changes in people’s travel behaviour on Pacific Highway due to upgrades 7
Floods further north affected us as well this year 6
Higher than normal temperatures during the summer 5
Opening of K-Mart in Port Macquarie 4
Downturn in the mining sector 3
Higher agricultural prices – farmers are spending 2
Note: 1The frequency figures are total number of mentions: some businesses mentioned more than one factor affecting changes to business operations.
The perceived problem of high rents was mentioned exclusively by businesses in the town
centre, and most of these businesses also reported being affected by the downturn in the
retail trade environment. However, it should be noted that several other businesses
reported a reduction in rent as compared to 12 months ago. Changes in travel behaviour
along the Pacific Highway refer to the longer-term cumulative changes in people’s stopping
behaviour along the highway and not as a result of the Kempsey bypass or opening of the
service centre. The recent opening of K-Mart in Port Macquarie was mentioned by very few
businesses, predominantly from the ‘Other Retail’ sector, but his was viewed as a temporary
impact on change in turnover. The occurrence of floods on the north coast of NSW was
mentioned by several accommodation establishments as this was perceived to have affected
bookings in Kempsey. The same accommodation establishments also mentioned the higher
temperatures during the summer as this was perceived to have forced the ‘grey nomads’
and families to postpone their travel arrangements.

21
The estimate of the change in gross annual turnover is based on figures provided by the 92
businesses during the recent survey and that provided by the same businesses in the 2013
post-bypass survey. Table 7 highlights that over the period between October 2013 (8
months after the opening of the bypass) and July 2017, gross annual turnover had increased
by $37.4 million. This represents a 38.9% increase in gross annual turnover from that
reported in 2013 in the immediate post-bypass period. The relative magnitude of the
increase in gross annual turnover by business category indicates that the major share of the
increase was accounted for by the clubs/hotels, food businesses, service stations and other
retail businesses.
Table 7 Change in gross annual turnover by business category
Category Turnover in 2013
($millions)* Turnover in 2016-2017 ($millions)*
Accommodation 2.83 3.38
Clubs/Hotels 4.90 10.00
Food 10.58 22.09
Auto Services 38.56 41.90
Service Stations 9.84 13.96
Eateries 7.71 12.42
Other Retail 21.60 29.68
Total $96.02m $133.43m
Note: Turnover figures are for 92 businesses
The accommodation and auto services sectors experienced the smallest absolute increases
in turnover over this period. For the eateries sector as a whole, the 61% increase in turnover
occurred at 5 out of the 11 eateries. The increase in turnover among eatery businesses had
occurred at both larger and smaller establishments. In relative terms, the accommodation
sector contributed the smallest increase to gross annual turnover over this period. While
turnover had improved for 5 out of the 8 accommodation establishments, and 3
establishments had experienced static or declining turnover, all had mentioned that the
2016-2017 Xmas holiday period and Easter were periods of lower than normal room
occupancy – it was a ‘poor’ tourist season compared to the previous year. In addition, the
accommodation and eatery sectors had also experienced some additional decline in

22
turnover as a result of the departure of construction workers – this is particularly so for the
takeaways and caravan parks, and several indicated that they had experienced short-term
and small declines in turnover following the opening of the service centre in 2015.
4.2.2 Changes in employment
Given the 38.9% increase in turnover between 2013 and 2017, it could be expected that
employment would also increase across most business sectors in the longer-term. This
would also be expected based on findings from the Hume highway studies of bypassed
towns (Parolin, 2012a and 2012b). An additional 135 persons are now employed across the
92 businesses as compared to 2013 (Table 8). This represents a 16.2% increase in total jobs
recorded across these businesses at the time of the 2013 survey.
Table 8
Employment structure - 2013 and in 2017 for 92 businesses
Category 2013 2017 Percent
Change (%)
No. of businesses 92 92
Full-time male 127 153 20.4
Full-time female 67 84 25.3
Part-time male 104 124 19.2
Part-time female 148 142 -4.0
Casual male 137 176 28.4
Casual female 247 289 17.0
Total 833 968 16.2%
The increase has occurred across all employment categories, except for part-time females.
Significant increases in full-time and part-time employment are unexpected results given the
continued trends toward casualization of the workforce. Several of the larger businesses
indicated that they now employ more full-time and part-time workers given their continued
growth from year to year since 2013. In addition, it was mentioned during the surveys that

23
persons employed in these job categories are more reliable and productive than casual
employees who prefer flexible working hours.
The increase in employment by major business category is shown in Table 9. In terms of
relative size, employment gains were greatest at the other retail sector (303 out of 968 jobs
or 31.3%), followed by the food services sector (228 out of 968 jobs or 23.5%) and the
eateries sector (140 out of 968 jobs or 14.4%) and the. All other highway related sectors –
such as accommodation, clubs/hotels, auto services and service stations all experienced
increases in employment.
Table 9 Employment status and business category - 2013 and 2017 for 92 businesses
Category Accommodation Clubs/
Hotels Food
Auto
Services
Service
Stations Eateries
Other
Retail Total
No. of estabs. 8 2 10 18 7 11 36 92
Full-time male 3 (1) 12 (10) 26 (27) 69 (35) 2 (11) 5 (7) 32 (36) 153 15.8%
Full-time female 4 (1) 6 (6) 23 (19) 6 (5) 1 (3) 9 (6) 35 (27) 84 8.6%
Part-time male 1 (1) 4 (3) 46 (31) 6 (17) 18 (10) 9 (5) 40 (40) 124 12.8%
Part-time female - (1) 8 (8) 46 (61) 5 (1) 8 (5) 11 (8) 64 (14) 142 14.6%
Casual male 7 (6) 20 (8) 25 (25) 20 (13) 16 (6) 42 (36) 46 (43) 176 18.1%
Casual female 29 (23) 32 (37) 62 (33) 11 (8) 9 (11) 50 (54) 86 (81) 289 29.8%
Total 2017 44 82 228 117 54 140 303 968
(Total 2013) 33 72 196 79 46 116 291 833
Note: Values in brackets are corresponding job figures for 2013.
The growth in full-time employment has predominantly occurred cross the auto services and
the eateries sectors. Growth in part-time male employment in particular is evident in the
food and eateries sectors. The growth in casual employment, which accounts for 465 out of
968 jobs (48.0%), occurs across all business sectors but is very prevalent across the highway
related sectors - eateries, food services, auto services and accommodation establishments.
Associated with the increase in gross annual turnover and employment is the increase in
wages and salaries. However, it is not possible to compare the increase in wages/salaries

24
from the surveys of the 92 businesses in 2013 given the sparse data collected from
businesses at that time. Most had difficulty remembering their total wage/salary figures for
2012-13 financial year as reported in the 2013 study. In the 2017 business surveys several
businesses also had difficulty with wages/salary figures. These businesses were assigned the
median value for the category of business to which they were allocated (Table 2). From the
figures provided by the 92 businesses in 2017 it is estimated that the total wages/salaries
figure for 2016-17 is in the order of $29.55 million. Table 10 indicates that, in relative terms,
the accommodation, service station, eatery and clubs/hotels sectors have the lowest
wages/salaries figures – mainly due to their high dependence on casual employees,
especially females.
Table 10 Estimated wages/salaries by business category for 2016-17
Category
Wages/Salaries
($millions) Percentage of total (%)
Accommodation 1.82 6.1
Clubs/Hotels 3.63 12.2
Food 5.34 18.0
Auto Services 6.08 20.5
Service Stations 1.54 5.2
Eateries 3.49 11.8
Other Retail 7.65 25.8
Total $29.55m 100.0%
Further analysis indicated that only 7 out of the 92 businesses (7.6%) reported a reduction in
the hours worked by staff between the two survey periods. These businesses comprised 1
eatery, 2 food places, 1 auto services business and 3 other retail businesses. Five out of the 7
businesses reported an increase in gross annual turnover between 2013 and 2017, and did
not continue to experience further impacts of the bypass after the 2013 surveys. These 7
businesses were primarily affected by higher wages/salaries and higher rents. As a way of
adjusting to the changing business environment, these businesses reduced the working

25
hours of their casual staff and, in some cases, also reduced the trading hours of the business
(several had stopped trading on Sundays). In most cases, the business proprietor/owner
indicated they they were now working even longer hours in order to maintain the
profitability of their business.
It is not possible to provide an estimate of the reduction in the total number of hours
worked by staff as figures were only provided by 3 out of the 7 businesses. The remaining
businesses could recall reducing the hours of their staff but not the actual number of hours
per week. However, it is likely that the total reduction in hours worked is in the order of 300-
350 hours per week across these 7 businesses – a very small proportion of total hours
worked per week. The average wage rate mentioned by the 7 businesses that reduced the
hours worked by staff was $23 per hour. Using this value and multiplying it by the reduced
hours worked by staff it is estimated that there occurred a reduction in income in the order
of $6,900 -$8,000 per week. This figure is substantially less than the $71,547 reduction in
income per week that was directly related to the negative impacts of the opening of the
bypass and reported in the 2013 study.
4.2.3 Dependence on passing trade
The business survey provided owners/managers with the opportunity to indicate the extent
to which their business has a dependence on passing trade and local trade. This can be
compared with similar values provided in the 2013 study. Many of the highway related
businesses, among the 92 businesses, had experienced reductions in passing trade – some
such as the petrol stations and eateries were very substantial reductions – and had to adjust
business operations to cater for local needs in the post bypass environment. The general
view expressed by many businesses at the time of the 2013 study was that Kempsey would
become a much better place for shopping and to visit – not unrelated to the positive
environmental effects of the diversion of traffic from the main street. Planned
improvements to Macleay Valley Way and the street revitalisation program in the town
centre were perceived to make the town even more attractive for shopping by locals and
visitors. This meant that, in the longer-term, dependence on highway generated trade could
be expected to increase along with higher levels of dependence on local trade. The studies
of bypassed town along the Hume Highway (Parolin, 2012a, 2012b) suggested that increased

26
dependence on passing trade had occurred at several towns and was now higher than pre-
bypass levels (although this had occurred over a 15 year time period).
A comparison of perceived dependence on passing trade with that reported in the 2013
study indicates that there has occurred no upward shift in the median value for dependence
on passing trade (Table 11). The median category remains at less than 5%.
Table 11 Perceived extent to which businesses depend on passing trade
Passing Trade
Accommodation Clubs/
Hotels Food
Auto
Services
Service
Stations Eateries
Other
Retail
Total
No. %
Less than 5%* - - 5 (7) 16 (15) 2 (1) 2 (7) 21 (21) 46 50.0
5-9% - - - 1 (1) - 3 2 (1) 6 6.5
10-14% - 1 (1)+ 4 (1) 1 1 (3) 1 (2) 7 (3) 15 16.3
15-19% - 1 (1) - - 1 1 (1) - 3 3.2
20-24% - - - - 1 (1) 1 1 (2) 3 3.2
25-29% - - 1 - - - - 1 1.0
30-34% - - - - 1 (1) 2 (1) 4 (1) 7 7.6
35-39% - - - - 1 1 - 2 2.1
40-44% - - - - - - - - -
45-49% - - - - - - - - -
More than 50% 8 (7) - - - - (1) - 1 (1) 9 9.7
Total businesses 8 2 10 18 7 11 36 92
Note: *This value represents the median value for responses in the survey of businesses in 2013 and
2017. +Values in brackets refer to the number of businesses in 2013.
The average values for dependence on passing trade have only increased from 9.2% in 2013
to 11.6% in 2017 – a very insignificant increase. The accommodation sector continues to be
totally dependent on external bookings - both online and telephone bookings. The caravan
parks that contain permanent vans cater to permanent residents that are predominantly
local. Among the eateries and petrol stations, only 7 out of a total of 18 businesses have a
dependence on passing trade which is in the order of 20-24%. In essence, what Table 11
highlights is that the 92 businesses are overwhelmingly now serving the needs of locals and
not through travellers. Further analysis has indicated that the businesses now have, on
average, a 90% dependence on local trade. The significant increases in gross annual turnover

27
and employment experienced by these businesses since the 2013 study has been generated
for the most part from increased dependence on local trade.
4.2.4 Continuing adjustments to business operations
The 2013 study reported that about half of the businesses that experienced a downturn in
turnover had made compensatory adjustments to their operations following the diversion of
through traffic from the town, principally through increased advertising and promotions,
diversifying product lines, and reducing operating times. Other businesses that experienced
a downturn in turnover have adopted a ‘wait and see’ attitude. Developing or enhancing a
web presence or enhancing customer service skills did not figure highly in adjustment
strategies mentioned by businesses at that time.
Given the changes in the post 2013 period reported in section 2 of this report, and the
factors perceived by businesses to be affecting their business operations (Table 6), it can be
expected that across the 92 businesses there have occurred substantial adjustments to
business operations. The most frequently cited adjustments are shown in Table 12. At the
time of the 2013 study, only 32 out of the 92 business (34.7%) had a website and only 1
business had a social media presence. Table 12 highlights the very significant strides made
by businesses in embracing internet and social media technology as part of their longer-term
adjustments in the post-bypass environment. The use of Facebook and Instagram in
particular are now used by at least 50 out of the 92 businesses (54.3%) as a way of doing
business and generating sales. On the other hand, the use of websites or enhancement of
websites has also increased but to a lesser extent. A total of 66 out of the 92 businesses
(71.3%) have a web presence and there are several businesses that only use Facebook and
Instagram for promotions and sales. The overwhelming view among the businesses that
have embraced social media technology is that it is now more important than local
advertising and marketing as a way of reaching potential customers.

28
Table 12
Changes to business operations at 92 businesses
Most frequently mentioned changes by businesses
Most frequently mentioned changes by businesses
Frequency1
Established a social media presence (Facebook, Instagram, etc.) 45
Established or updated web-site 36
Local advertising (including TV and radio) 20
Improving appearance of business (e.g. renovation and/or expansion) 17
Subscribe to online booking reservation systems (e.g. Bookings.com) 7
Promotions and local branding 6
Increased focus on online sales and orders 4
Better training of staff and other customer service initiatives 4
Examined their product offerings and looked at new initiatives 4
Owners/proprietors working longer hours 4
Extended opening/closing hours 3
Increased support local sport clubs/sponsorships
3 Set up better signage 2
Note: 1The frequency figures are total number of mentions: some businesses implemented more than one change to business operations.
However, local radio and TV advertising was the next most frequently mentioned change by
businesses. This was not mentioned at all in the 2013 study. Many businesses have realised
the extensive audience reach of radio and TV advertising and the businesses that use this
form of advertising indicated that it was less expensive than originally thought and offered
‘bang for the buck’ as put by one business proprietor – it translates into customers and
sales.
The other major change that was reported by businesses was improvement in the
appearance of their business. This involved rehabilitation or renovation of premises - both
inside and out – as a way of attracting customers and enhancing the customer experience. In
some cases, these businesses also placed tables and chairs on the street following

29
revitalisation of Smith Street at the town centre with a view to attracting more locals and
visitors to the establishment and to make them a destination.
A total of 7 out of the 8 accommodation establishments have now subscribed to online
booking systems such as Bookings.com and ResOnline. It was reported that subscriptions to
these booking systems are relatively expensive but are essential for generating occupancy.
As one moves down the list, the last nine changes reported by businesses are the more
traditional changes relied upon by businesses to sustain profitability in a more competitive
post bypass environment. The use of local promotions, working longer hours, new product
offerings, extended operating hours and better signage are serious attempts at increasing
sales from the local population, although several businesses are also increasingly targeting
sales from through travellers stopping for highway related needs.
It is noteworthy that enhancing customer service was only mentioned four times by
businesses. This is only a slight improvement on the frequency mentioned in the 2013 study.
The impression is that many businesses perceive having embraced social media and web
technology as part of the customer service domain. While this perceived view may correct,
the focus on face-to-face customer service aspects appears to have a diminished role for
many businesses. Businesses were also informally asked about what information they collect
about their customers, such as location analytics data, to assist them in better
understanding their market. Very few businesses collect such information.
The types of changes noted in Table 12 highlight that businesses have made substantial
adjustments in their business operations since 2013. Two-thirds (67%) of these businesses
(62 out of 92) have experienced an increase in turnover. Notwithstanding these changes,
several businesses view the ultimate change as being the sale of the business. At the time of
the business surveys for the present study, a total of 10 businesses were for sale of which 2
were accommodation establishments, 2 are in the food sector, 2 are in the auto services
sector and the remainder are in the other retail sector and located in the town centre. It is
very likely that several more businesses have been put up for sale since completion of the
field work for the surveys. In all cases, the decision to sell is not related to the reduction in
passing trade (no bypass effect) but to other economic or personal factors.

30
4.3 New businesses since 2013
As indicated in Table 1 a total of 21 new businesses commenced operations in Kempsey
between 2013 and 2017. One business had commenced one month after completion of the
2013 study, 4 had commenced in 2014, 8 in 2015, 6 in 2016 and 1 in 2017 while fieldwork
for the survey of businesses was being undertaken. The latter business, an eatery, is
included in the study as relevant data was provided during the survey. Eleven of the new
businesses are in the eateries sector, 1 is a service station, 1 is in the food sector and 8 are in
the other retail sector (see Table 1). Of the 21 new businesses, 5 are located at the service
centre in South Kempsey, 3 are located in South Kempsey, with the remainder located in the
area defined as the town centre and extending to Smith Street.
The owner/manager of each new business was asked to provide the main reason for
commencing their business in Kempsey. For the majority of businesses the dominant
response was the perceived high level of opportunity that had presented itself in a post
bypass environment. This was especially the case for new businesses at the service centre
which cater for the needs of travelling motorists. Several of the businesses that established
themselves in the town centre noted that the bypass had markedly improved the
environmental and shopping amenity of the town centre and that the street revitalisation
program had created a ‘beautiful’ town centre conducive to local shoppers and visitors.
Other new businesses mentioned that part of their decision to locate in the town centre was
related to rent reductions provided by building owners.
The new business owners were asked to indicate if their gross annual turnover had changed
since commencing business operations. For 19 out of 21 new businesses (90.4%) turnover
had improved by the time of the surveys in 2017, for 2 businesses it had remained the same
(Table 13). Improvements in business turnover had occurred across all the business sectors.
It should be noted that the presentation of findings on turnover and employment related to
new businesses is not by business sector as it may be possible to identify individual
businesses. In some cases, a business category is referred to if it contains sufficient numbers
of businesses thereby reducing the likelihood of identifying any particular business.

31
Table 13 Change in gross annual turnover since commencing business
Change in turnover
Total
No. %
Improved 19 90.4
Stayed the same 2 9.5
Got worse - -
Total businesses 21 100.0
From turnover figures provided by the businesses during the interview surveys it is possible
to estimate gross annual turnover for the 2016-17 financial year. At the time of
commencement of the business surveys the financial year had 2 more months to run before
it ended. As a result, turnover figures provided by businesses were not for the full financial
year and were, therefore, pro-rated by two months to obtain a completed turnover profile.
It is estimated that total gross annual turnover at the 21 new businesses is in the order of
$23.4 million. The eateries sector, which contains 11 out of the 21 new businesses, has an
estimated gross annual turnover in the order of $9.2 million. For the other retail sector,
which has 8 out of the 21 new businesses, gross annual turnover is estimated to be in the
order of $3.4 million.
Information provided by the 21 new businesses indicates that they employ a total of 250
persons in Kempsey (Table 14). The vast majority of these employees are locals and
overwhelmingly from Kempsey itself. Seventy percent of total employment is made up of
casual jobs and almost half (46%) of all jobs are occupied by females as casuals. The
overwhelming majority of casual jobs are found in the eateries and other retail sectors. Part-
time jobs account for 19.6% of total jobs and it is interesting to note that there are twice as
many part-time females employees as there are males. These types of jobs are generally
associated with longer hours of work and higher wage rates and are in no small measure a
contributing factor to household income and disposable income. Part-time jobs are also
exclusively in the eateries and other retail sectors. Full-time jobs are generally filled by
managers of the new businesses and are found across all business sectors. As mentioned
previously in section 2 of the report, 170 out of the 250 new jobs are located at the service
centre.

32
Table 14
Employment structure of new businesses
Category 2017 Percent of
total (%)
No. of businesses 21
Full-time male 20 8.0
Full-time female 6 2.4
Part-time male 17 6.8
Part-time female 32 12.8
Casual male 60 24.0
Casual female 115 46.0
Total 250 100%
From the figures provided by the 21 new businesses it is estimated that the total
wages/salaries figure for 2016-17 is in the order of $4.25 million. The eateries and other
retail business sectors account for 84.8% of total wages/salaries at the 21 businesses. In
turn, approximately 70% of wages/salaries are for casual employees of these businesses.
The information presented so far for these new businesses suggests that for the most part
they are performing well in a competitive and changing retail environment. They are a very
significant contributor both directly and indirectly to the local economy of Kempsey. These
new businesses were also asked about any changes to business operations they have made
since commencing operations in Kempsey. It should be noted that many of the new
businesses, especially those that commenced operation before 2015, also made similar
comments as the 92 continuing businesses in relation to a slowdown in the retail
environment and rapid change in the nature of their respective industries.
Since commencement of business operations, the new businesses reported that they have
also made adjustments to the way they operate their business in light of competition or
slower than expected growth (Table 15). What is very noticeable from Table 15 is that for
the most part the new businesses commenced operations being social media ready. It was
not an add-on as in the case of many of the continuing businesses. Only 2 out of the 21 new

33
businesses do not presently use social media or have a web presence but both indicate this
is likely to change in the near future.
Table 15
Changes to business operations at 21 new businesses
Most frequently mentioned changes by businesses
Most frequently mentioned changes by businesses
Frequency1
Using social media constantly (Facebook, Instagram, etc.) for marketing/sales 18
Local promotions and local marketing 15
Improving the customer service experience 15
Experimenting with alternative product/menu items 10
Improvements to the look and feel of the business 7
Providing and enhanced Wi-Fi experience for customers 3
Note: 1The frequency figures are total number of times an item was mentioned.
In general, the new businesses have a greater focus on marketing, local or otherwise,
customer service experiences and the look and feel of their respective businesses. During
discussions with the new business owners/managers it was very clear that the emphasis is
on making their respective businesses a destination for both locals and travellers. Many of
these businesses also indicated that they spent time talking with customers about their
experiences at the business and make subsequent adjustments to operations as a result.
Providing an enhanced Wi-Fi experience for customers or overnight stayers was one
example mentioned of listening to feedback from customers.
For the majority of the 21 new businesses their dependence is predominantly on local trade
and not passing trade. The exceptions are the 5 businesses located at the service centre
which, on average, reported a 90% dependence on passing trade. The non-highway service
centre businesses in general reported a 10% or less dependence on passing trade. However,
there are 3 non-highway service centre businesses that reported a 20-40% dependence on
passing trade; these were all from the eateries sector.
34
4.4 Aggregate changes between 2013 and 2017
Up to this point in the report, the data has been presented separately for those businesses
that experienced continuing effects of the bypass, those which did not experience any
continuing effects and new businesses in terms of turnover, employment and business
adjustments. This has been justified in terms of a greater understanding of which businesses
and business sectors continued to be affected and which were not. In order to obtain a
more comprehensive view of the differences in these characteristics between 2013 and
2017, the information has been aggregated at each of these two years. The figures
presented for 2013 are for the 115 businesses that completed the surveys. Those for 2017
are for the 124 businesses that participated in and completed the interview surveys
between 1st May and 1st June.
4.4.1 Changes in gross annual turnover
In terms of gross annual turnover at all businesses, there has occurred an increase in the
order of $49.7 million between 2013 and 2017 (Table 16). This represents an aggregate
increase of 45.2% over the turnover figures for 2013. The largest increases have occurred in
the more traditional highway related sectors of service stations and eateries but the food
sector made a significant contribution to the increase as well. It should be noted that the
small increase in turnover at the accommodation establishments is consistent with short-
term loss of turnover due to the departure of both road and hospital construction workers,
and the lower than expected occupancy rates in the 2016-17 financial year. The small
downturn in turnover experienced in the auto services sector is also related to the departure
of construction workers and the loss of contracts for auto related services to construction
companies.
Table 16 also highlights that gross annual turnover at the 124 businesses in 2017 now
exceeds turnover at businesses in the year before the opening of the bypass where turnover
was estimated at $124.78 million (2013 study). Even among the 92 continuing businesses,
the turnover in 2017 exceeds reported turnover by the same businesses in the pre-bypass
period. In aggregate terms, the increase in turnover is indicative of a relatively strong

35
economy and one which has been able to adjust quickly and grow to surpass pre-bypass
levels.
Table 16 Change in gross annual turnover by business category
Category
Turnover in 2013 ($millions)*
Turnover in 2016-2017 ($millions)*
Absolute Difference ($millions)
Accommodation 2.90 3.88 0.98
Clubs/Hotels 4.90 10.78 5.88
Food 9.70 22.63 12.93
Auto Services 43.08 42.35 -0.73
Service Stations 10.12 23.96 13.84
Eateries 12.67 22.31 9.64
Other Retail 26.14 33.34 7.20
Total $109.51m $159.25m
Note: *Turnover figures are for 115 businesses in 2013 and 124 businesses in 2017.
The aggregate turnover figures for 2013 and 2017 do not reveal that for many businesses
their turnover since 2013 has been volatile but with a slow upward trend in business growth.
For 11 businesses that reported continuing effects of the bypass it has been difficult to
increase their turnover, even to pre-bypass levels. Despite having made the same types of
adjustments as other businesses, these particular businesses that were generally very
dependent on highway generated trade have not been able to make the transition to a
more sustainable level of dependence on local trade. While some of the business
owners/managers lay the blame squarely at the opening of the bypass, others reported that
it is a combination of economic factors, of which the bypass is one. At the time of the field
surveys, 4 out of 11 of these businesses were for sale and it was likely that several more
would be put up for sale.
4.4.2 Changes in employment
Between the period 2013 and 2017, across all businesses, there has been an increase of 249
jobs – from 1137 jobs in 2013 to 1386 jobs in 2017, an increase of 21.8% over 2013 levels

36
(Table 17). The largest increases, as noted earlier, have occurred in the part-time and casual
employment categories, especially for males. Casual employment across the 7 business
sectors now accounts for over half of all jobs (53.6%) as compared to 51.2% of all jobs in
2013. Full-time female employment has declined over this time period. The opening of the
service centre in 2015 has generated approximately 170 jobs out of the 249 additional jobs
over this time period. Employment levels across the 7 business sectors are now at a higher
level than that reported by businesses one year prior to the opening of the bypass (1386
jobs in 2017 as compared to 1231 jobs in 2012).
The increase in employment by major business category is shown in Table 18. In terms of
relative size, employment gains were greatest in the eateries sector (474 out of 1386 jobs or
34.1%), due in large part to the number of jobs created at the service centre. This is followed
by the other retail sector (349 out of 1386 jobs or 25.1%) and the food services sector (234
out of 1386 jobs or 11.8%). All other highway related sectors – such as accommodation,
clubs/hotels, auto services and service stations - experienced increases in employment.
Table 17
Employment structure - 2013 and in 2017
Category 2013 2017 Percent
Change (%)
No. of businesses 115 124
Full-time male 168 179 6.5
Full-time female 109 98 -10.0
Part-time male 118 167 41.5
Part-time female 172 199 15.6
Casual male 186 283 52.1
Casual female 384 460 19.8
Total 1137 1386 21.8%
The growth in full-time employment has predominantly occurred across the auto services
and the eateries sectors. Growth in part-time male employment in particular is evident in
the food and eateries sectors. The growth in casual employment, which accounts for 743 out

37
of 1386 jobs (53.6%), occurs across all business sectors but is most noticeable in the eateries
sector which is traditionally reliant on casual employment.
Table 18 Employment status and business category - 2013 and 2017
Category Accommodation Clubs/
Hotels Food
Auto
Services
Service
Stations Eateries
Other
Retail Total
No of estabs. (2017) 10 3 11 20 8 26 46 124
Full-time male 4 (1) 12 (11) 29 (31) 73 (49) 3 (11) 17 (15) 41 (50) 179 13.0%
Full-time female 5 (1) 7 (7) 23 (27) 6 (9) 1 (3) 19 (22) 37 (40) 98 7.1%
Part-time male 1 (1) 4 (4) 46 (32) 6 (19) 18 (10) 51 (8) 41 (44) 167 12.2%
Part-time female - (1) 8 (9) 46 (61) 5 (1) 8 (5) 54 (15) 78 (80) 199 14.5%
Casual male 8 (6) 25 (8) 27 (27) 20 (13) 21 (6) 132 (80) 50 (46) 283 20.6%
Casual female 30 (26) 37 (41) 63 (40) 13 (9) 14 (11) 201 (162) 102 (95) 460 33.6%
Total 2017 48 93 234 123 65 474 349 1386
(Total 2013) 36 80 218 100 46 302 355 1137
Note: Values in brackets are corresponding job figures for 2013.
From the figures provided by the 124 businesses in 2017 it is estimated that the total
wages/salaries figure for 2016-17 is in the order of $36.19 million. Table 19 indicates that, in
relative terms, the accommodation and eateries sectors have the lowest wages/salaries
figures – mainly due to their high dependence on casual employees, especially females.
Unfortunately it is not possible to place the wages/salary figure for 2017 in the context of
total income for Kempsey from the 2016 census. This will need to await the release of urban
centre locality data and personal income data – scheduled for October 2017.

38
Table 19 Estimated wages/salaries by business category for 2016-17
Category
Wages/Salaries
($millions) Percentage of total (%)
Accommodation 2.01 5.9
Clubs/Hotels 3.81 11.7
Food 5.88 17.3
Auto Services 6.65 19.7
Service Stations 1.85 13.1
Eateries 6.46 7.2
Other Retail 9.52 24.8
Total $36.18m 100.0%
4.5 A note on continuing indirect affects
The 2013 study reported that the indirect impacts of the opening of the bypass appeared to
be relatively insignificant, predominantly affecting gross annual turnover rather than
employment at only a small number of businesses. Those most affected were businesses
providing inputs to food outlets in the town (butchers, bakeries, greengrocer, and
supermarkets). Only 2 businesses reported that they displaced staff because of a downturn
in orders from highway related businesses following the diversion of traffic from the town
and a total of 4 staff were displaced – 2 male casuals and 2 part-time females. Given that
almost 4 years have elapsed since that study, any further indirect effects are likely to be
associated with those businesses who reported that they continued to be affected by the
bypass beyond 2013. As only 11 out of 124 businesses fall into this category, it is reasonable
to assume that if any businesses were indirectly affected they would have been able to
absorb the reduction in gross annual turnover resulting from the reduction in purchases.
In the 2017 study most businesses were not able to provide detailed accounts on purchases
made from local suppliers. Only very general and ‘sketchy’ figures were provided but from

39
the data available it is possible to distinguish several trends in the way highway related
businesses deal with local and regional suppliers. At the outset it should be noted that no
businesses that supply goods and services to the highway related sector such as
accommodation, service station and eateries establishments indicated that they
experienced a further decrease in gross annual turnover as a result of a reduction in
purchases made by these businesses.
The very small and insignificant indirect impacts in the immediate period reported upon in
the 2013 study were mainly absorbed through lower profit margins and attempts at
expanding the business through local promotions, advertising and marketing. None of the
businesses supplying the highway related sector – such as the green grocer and butchers -
that closed after 2013 had closed due to continued reductions of purchases made by
highway oriented businesses.
However, since the 2013 study, businesses reported increased reliance on non-local
wholesalers and distributors. Some are regional and based in either Coffs Harbour or Port
Macquarie or are based in Sydney and Brisbane. Lower costs, greater reliability and speed of
delivery (usually the next day) were the main reasons cited for greater reliance on more
corporate based supply chain networks.
At the local level, many businesses reported greater reliance on supermarkets for supplies
where price, availability and freshness were major considerations. The only exception to
these trends comes from the specialised eateries where reliance on fresh local produce is
critical to their business success. These eateries usually have important linkages with local
farmers for continuous supply of produce.

40
5. Business perceptions of the
streetscape revitalisation program,
highway service centre and Port
Macquarie-Kempsey road upgrade
5.1 Streetscape revitalisation program
Proactive measures adopted by Council in the pre- and post-bypass period led to the
development of a post-bypass strategy, targeted for the most part at highway related
businesses that attempted to mitigate against the adverse impacts of the bypass that were
anticipated from the Environmental Impact Assessment (2007) and documented in the 2013
study. A key component of this strategy was development of a Corridor Master Plan in 2012
and implementation of a streetscape revitalisation program for the town centre. Aspects of
this program commenced in 2013 with changes to parking on the main street and urban
design enhancements to the town centre where completed in 2015. This involved a major
upgrade of the infrastructure in the town centre that could potentially benefit all businesses
in terms of their performance in a post bypass environment through increased shopping
activity. The perceived impact of the program on businesses is the subject of this section.
At the time of the fieldwork for this study, other aspects of the Corridor Master Plan were
being implemented along Smith Street up to the bus/coach stop near the Shell service
station. In addition, the streetscape revitalisation program of Macleay Valley Way was
completed at Frederickton. Many businesses also commented on these programs, and on
planned improvements to Macleay Valley Way in South Kempsey, but the main focus was
the program in the town centre along Smith Street.
A total of 23 out of 124 businesses (18.5%) indicated that they had been affected by the
streetscape revitalisation program. All of these businesses were located in the town centre

41
or immediately adjacent to it on Smith Street, and included several businesses located at
Kempsey Central. These businesses were then asked to indicate if the effect had been
positive or negative on their business. Fourteen out of the 23 businesses (60%) indicated
that the effect had been positive while for the remaining 9 businesses the effect had been
negative. Businesses were then asked to indicate a percent increase or decrease in turnover
depending on whether they had experienced a positive or negative effect on their business.
In all cases, businesses were not able to provide a percentage figure in either direction, but
did indicate what they perceived as the main impact. For example, the 14 businesses for
which the effect had been positive indicated that the main effect was increased pedestrian
activity and that this had translated into extra sales – the street upgrade had been good for
business. Those for which the effect had been negative indicated that their turnover had
gone down during the construction phase and that construction had extended beyond the
scheduled completion date. These businesses did not perceive any increased pedestrian
activity as a result of the program.
Businesses were also asked to indicate specific positive and negative effects which meant
that businesses could provide both. Table 20 summarises the most frequently mentioned
perceived positive and negative effects of the program among businesses located in the
town centre. The positive impacts tend to focus on the markedly enhanced attractiveness of
the town centre, its vibrancy and beauty, and that it has made the town centre a busier
place with ease of parking and improved access to shops. Many town centre businesses
made very positive comments on the street furniture. As one business owner stated, ‘….it’s
now a pleasure coming to work every day in the town centre’. The 3 businesses at Kempsey
Central who mentioned that it was also a lot busier as a result, in turn, noted that the
upgrade of Riverside Park had had a similar positive impact at Kempsey Central.
The perceived negative impacts by town centre businesses focus on the length of
construction, perceived lack of consultation and removal of parking spaces and that it did
not bring more people into town. There was a view as well that their turnover had suffered
during the long construction phase and that investment of public funds on street furniture
could have been better spent elsewhere. Several businesses in Frederickton noted that
during the streetscape revitalisation program through Frederickton, the use of traffic control

42
measures to limit movements on the main street led to many travellers bypassing the main
street and using the alternative back road to access the interchange and Macleay Valley
Way. This had negatively affected turnover for quite some time.
For all other businesses in the survey, those that had not been affected by the streetscape
revitalisation program (101 out of 124 businesses), the perception was that the program was
an overwhelming success and an asset for Kempsey. Most of the comments of these
businesses mirrored those of the positive impacts mentioned in Table 20. To these could be
added that it has made the street very beautiful and attractive for locals and visitors alike, it
has given the town centre a nicer feel and as one business owner in South Kempsey
commented, ‘…it has created a new vibe in the town centre’. These comments speak to the
high value placed on the results of the streetscape revitalisation program not only for
businesses but for the local community as a whole.
Table 20 Perceived positive and negative impacts of the streetscape revitalisation program
Positive impacts Frequency
Made the town centre more attractive and vibrant 15
More people in the main street 8
It’s a busier town centre 5
Easier to park and better access to shops 5
Made Kempsey Central a lot busier 3
Negative impacts Frequency
Construction took too long 6
Not bringing more people into town 4
Turnover went down during construction 4
No consultation on when works would commence 3
Took away parking spaces (need more) 2
Note: Businesses were able to identify more than one impact.
When asked about their perceptions, many of the businesses in South Kempsey (not located
at the highway service centre) sought clarification about the long awaited upgrade of

43
Macleay Valley Way in South Kempsey which is also a major feature of the Corridor Master
Plan. Most of these businesses indicated that the upgrade was also critical for South
Kempsey given growth in traffic in the post bypass period. They expressed concerns that the
original plans, or any revised plans, should now place more consideration on needs for
parking and access to their respective businesses in any upgrade plans. There are several
businesses in South Kempsey that have deliveries to their premises by large B-Double trucks
and, therefore, require adequate access and turning spaces.
All businesses were asked to indicate their strength of agreement or disagreement with the
statements “Do you believe the Street revitalisation program has had a positive effect on
the Town Centre and Frederickton as a whole?” and “Do you believe the Street revitalisation
program has made Kempsey a better place to shop?”. The first question sought feedback on
the economic effects of the upgrades for businesses while the latter question deals with
perceptions of the overall shopping experience following the upgrades.
The values in Figure 1 indicate that when all 124 businesses are considered the
overwhelming perception is that the streetscape revitalisation program(s) have been
successful, notwithstanding the 9 businesses in the town centre and few businesses in
Frederickton that noted the impacts were negative. In Figure 2 there is overwhelming
agreement that the streetscape revitalisation programs have been an overwhelming success
for the shopping experience.
The evidence presented above suggests that the streetscape revitalization programs have
been a very useful investment of public funds by Kempsey Shire Council on much needed
infrastructure improvements to the main street in the post bypass period. The data in turn
suggest that the infrastructure investment is perceived by businesses in Kempsey and
Frederickton as necessary for growth in shopping activity on the main street but also as a
necessary condition for attracting other new retail businesses to the main street in future.

44
Figure 1
Street revitalization program has had a positive effect on the town centre and Frederickton?
0
10
20
30
40
50
60
Strongly Agree Agree Don't Know Disagree StronglyDisagree
Res
po
nd
ents
Source: Survey of businesses 2017
Figure 2
Street revitalization program has made Kempsey a better place to shop?
0
10
20
30
40
50
60
70
80
90
Strongly Agree Agree Don't Know Disagree StronglyDisagree
Res
po
nd
ents
Source: Survey of businesses 2017
5.2 Highway service centre
Another key component of the post-bypass strategy developed by Council was facilitation of
development of a service centre at the southern interchange of the bypass at South
Kempsey. As noted in section 4 of the report, the service centre was opened in 2015 and

45
survey fieldwork for this study has documented that 170+ jobs are associated with the 5
businesses at the centre. By any measure, the facilitation of this development by Council has
been a success story.
However, at the time of the 2013 study there were concerns expressed by some traditional
highway related businesses, such as service stations and eateries, that a service centre
would further reduce their turnover to such an extent that they could be forced to close or
sell their business. Even among some businesses in the accommodation sector, there was
concern expressed that a highway service centre could potentially reduce the number of off-
the-highway travellers that stop in Kempsey and seek overnight accommodation. The
perception was that these travellers would stop for fuel and petrol at the service centre and
then continue their journey further north/south for overnight accommodation. These types
of pre-highway service centre opening concerns were also expressed by businesses in Before
studies of the opening of bypass roads on the Hume Highway where mitigation measures by
a Council proposed development of a highway service centre (Parolin and Garner, 1996a).
The After studies of these same communities and businesses documented that these
negative perceptions were unfounded due to extensive growth in local shopping activity,
and that highway service centres had become the new stopping locations for through
travellers (Parolin and Garner, 1996a).
The survey in 2017 sought to document any actual impacts of the highway service centre on
individual businesses, and requested business owners/managers to provide their
perceptions of the impacts of the service centre on businesses in Kempsey and on the
economy of Kempsey as a whole. Analysis of the data indicated that 7 out of 124 businesses
(5.6%) in the survey had been affected by the opening of the service centre. Three of these
businesses were from the eateries sector, 2 from the service station sector, 1 from the
accommodation sector and 1 from the auto services sector. Out of the 7 businesses, one
business reported positive impacts and 6 businesses therefore reported negative impacts of
the opening of the service centre.
The one business that reported a positive impact was from the auto services sector and had
substantially benefitted from orders for parts from a business at the service centre. Those
businesses that reported a negative impact were from the eateries, service station and

46
accommodation sectors. The latter business – a caravan park – reported that they had
noticed a short-term downturn in off-the-highway overnight stayers due to changed
stopping travel behaviour as a result of the opening of the service centre – some potential
overnight stayers sought accommodation elsewhere further north/south of Kempsey due to
changed stopping behaviour.
Five out of the 6 businesses that reported being negatively affected by the highway service
centre indicated that the effects were of short-term duration (not beyond 6 months) and
that the decrease in turnover was between 5-10%. For one business – an eatery – the drop
in turnover as a result of the opening of the service centre was in the order of 15-20% and
resulted in the loss of one casual position. At one service station the opening of the highway
service centre led to a further 10% decline in turnover but no loss of jobs.
From the above findings, it is suggested that the impacts of the service centre were very
small and of short-term duration as 5 out of the 6 businesses that reported being negatively
affected also reported that their turnover began to increase again after 6 months. These 5
businesses reported that they made no further changes or adjustments to operation of their
business as a result of the negative impact of the opening of the service centre. For the one
business, turnover was not able to increase and was then also affected by the downturn in
the retail environment nationally.
All businesses that participated in the 2017 study were asked to respond to the questions
‘Do you believe the Highway service centre has had a positive effect on the economy of
Kempsey as a whole? There was overwhelming agreement among businesses that the
service centre has had a positive effect on the economy of Kempsey (Figure 3). This very
high level of agreement stems predominantly from the high number of jobs created at the
service centre and the positive multiplier effects of these jobs on the local economy. Beyond
the positive economic role that the highway service plays in the economy of Kempsey, it also
has a social function as it has become a major destination for locals for food and petrol
services and has been embraced by the Kempsey community. Further planned expansion of
the centre itself, and progress with development of the industrial estate adjacent to the
centre, should see an enhanced economic role for the centre in the future.

47
Figure 3
Do you believe the highway service centre has had a positive effect on the economy of
Kempsey?
Source: Survey of businesses 2017
As mentioned at the beginning of this section, the pro-active measure adopted by Council in
relation to development of the service centre has been a very successful strategy and could
serve as a model for post bypass mitigation measures by other Council’s on the Pacific
Highway that will face the opening of a bypass in the near future. A service centre is
important for the creation of many jobs that have positive multiplier effects on the local
economy, is important as a destination for locals and acts as a gateway to the town.
5.3 Port Macquarie-Kempsey highway upgrade
The Port Macquarie to Kempsey highway upgrade is part of the larger Port Macquarie to
Coffs Harbour Pacific Highway upgrade. The upgrade is occurring over two sections – Oxley
Highway to Kundabung (23 kilometres) and Kundabung to Kempsey (14 kilometres).
Motorists travelling north and south are already using sections of the new highway with
diversions onto the old highway alignment as construction work continues. According to
RMS the upgrade is expected to be open in the latter half of 2017 with travel time savings in
both directions. However, project documents do not specify an actual figure for estimated
travel time savings as a result of the upgrade.

48
The business survey included a set of questions aimed at identifying perceptions of the likely
impacts of the upgrade on business activity and some estimate of the magnitude of either
positive or negative impacts on turnover. The broader context of these questions is the long-
standing concern of many businesses in Kempsey over the extent of retail leakage to Port
Macquarie – the upgrade has the potential to further increase retail leakage. This was a
concern expressed by businesses at the time of the 2013 study in the immediate post bypass
environment. Shopper surveys undertaken by Kempsey and District Chamber of Commerce
and Industry in 2011 had indicated that 34% of shopper dollars were being lost to Port
Macquarie and 46% of shopper dollars were being lost to Port Macquarie and Coffs Harbour
combined. The opening of the K-MART store in Port Macquarie in March 2017 and further
travel time savings as a result of the upgrade could, therefore, potentially increase retail
leakage to Port Macquarie and affect turnover and employment decisions among businesses
in Kempsey.
Only 28 out of 124 businesses (22.5%) indicated that they are likely to be affected either
positively or negatively after the opening of the Port Macquarie – Kempsey upgrade. (Table
21). Thirteen out of 28 businesses (46.4%) perceive that the impacts are likely to be positive
and 15 businesses (53.5%) perceive likely negative impacts. Table 21 indicates that 50% (14
out of 28 businesses) of businesses that perceive some likely effects, either positive or
negative, are from the more traditional highway sectors - eateries and service stations –
followed by businesses in the other retail sector and a very small number in remaining
sectors.
Table 21
Do you believe that your business is likely to be affected by the opening of the Port Macquarie to Kempsey Highway Upgrade?
Effect on turnover
Accommodation Clubs/
Hotels Food
Auto
Services
Service
Stations Eateries
Other
Retail
Total
No. %
Positive 1 1 2 - 1 5 3 13 46.4
Negative 1 - - 1 3 5 5 15 53.5
Total businesses 2 1 2 1 4 10 8 28 100.0
Source: Surveys of businesses 2017
49
There are two main types of concerns expressed by the 15 businesses that perceive likely
negative impacts and these are related to the location of the business. Those businesses
located in the town centre (11 out of 15) are expressly concerned about the potential for
additional retail leakage and that this could further reduce an already volatile gross annual
turnover situation for several businesses. Four out of the 15 businesses are located in South
Kempsey and perceive a small downturn in turnover as a result of a likely reduction in
stopping traffic. The concern was expressed that for motorists travelling south the travel
time savings could encourage more stopping at the highway service centre at Port
Macquarie. For motorists travelling north, the travel time savings could potentially
encourage more stopping at the Kempsey service centre and less at businesses in South
Kempsey. It is interesting to note that 5 out of the 15 businesses that perceive likely
negative impacts also reported negative impacts following opening of the Kempsey service
centre.
Those businesses that perceive a likely positive impact are also characterised by their
location in Kempsey. Those located at the highway service centre perceive the reduced
travel times as increasing the propensity of travellers to stop at the service centre. This
would include more potential stops of daily commuters from Port Macquarie to Kempsey
and vice-versa. Those businesses located in the town centre and at Frederickton perceive a
greater influx of day trippers and visitors from Port Macquarie and surrounding areas to
their respective businesses. The same positive view was expressed of for completion of the
upgrade to Coffs Harbour – the travel time savings for those located north of Kempsey
would generate more day trip travel and tourism to Kempsey and have a positive effect on
turnover.
Further analysis of those businesses that indicated they perceive either a positive or
negative impact from the road upgrade were asked to indicate the likely percentage change
in their turnover. In all except one business – an eatery – businesses indicated that turnover
would either increase or decrease by not more than 10%. For the one eatery, the expected
downturn from the upgrade was likely to be in the order of 15%. However, all 15 businesses
that expect a decrease of turnover are, in turn, not expecting to make any additional

50
adjustments to business operations and are not considering any reductions in staff – mainly
because this was viewed as a temporary reduction. Several of the businesses expecting an
increase of turnover of up to 10% noted that they will be increasing their advertising and
marketing in Port Macquarie and surrounding areas to inform communities of the shorter
travel times to Kempsey and to their premises.
In sum, analysis of business perceptions of likely impacts of the Port Macquarie – Kempsey
upgrade highlights that only 15 out of 124 businesses (11.1%) perceive a likely negative
impact and that the magnitude of this impact is likely to be relatively small. For the
overwhelming majority of surveyed businesses, the question of the impacts of the road
upgrade is a non-issue for their business. There may be several reasons for this situation.
First, road upgrades on the Pacific Highway have been occurring for many years and changes
in travel behaviour occur along with these changes so that businesses are dealing with these
changes on a periodic basis – the highway bypass of Kempsey being the most significant
upgrade and modifier of travel behaviour for Kempsey businesses. (Highway related
businesses in Kempsey would also have been affected to some extent by the opening of the
service centre on the Oxley Highway at Port Macquarie). It is also very likely that some
businesses, especially those at the Kempsey service centre, will experience some adjustment
in turnover when the service centre opens at Nambucca as a result of motorists changing
their stopping patterns in response to further travel time savings from completion of the
upgrade to Nambucca.
Second, the phenomenon of retail leakage has been a feature of the economic and spatial
relationship between Port Macquarie and Kempsey for decades and most businesses have
made some adjustments accordingly. (It should be noted that potential retail leakage to Port
Macquarie did not prevent the start-up of 23 new businesses between 2013 and 2017).
From discussions with many business owners/managers they indicated that there is a need
to be aware of retail leakage and respond by ensuring high levels of customer service, price
competitiveness, a range of products and convenient trading hours. These were the main
reasons given by respondents in the 2011 shopper survey for shopping in Port Macquarie
and Coffs Harbour. An unattractive CBD was another reason cited by shopper survey
respondents. The streetscape revitalisation program in the town centre and at Frederickton
has now made the main street a very attractive place for shopping and visiting.

51
However, what is surprising from the survey is that more businesses have not identified with
the potential positives of the upgrade (travel time savings). It is possible that many
businesses view it as just another temporary change and therefore they do not need to
respond in anticipation of the upgrade. The 13 out of 124 businesses who see a likely
positive impact as an opportunity indicated that they cannot wait for the upgrade to open as
they see their business as a destination and anticipate more travellers and shoppers coming
to Kempsey to their business from Port Macquarie and surrounding areas. It is
recommended that Kempsey and District Chamber of Commerce, and Council, facilitate
some workshops prior to the opening of the upgrade on what businesses can do to capitalise
on the positives of the upgrade.
52
6. Business perceptions of priorities
and opportunities
The attitudes and perceptions of businesses to the priorities and opportunities that
Kempsey Shire Council could support as part of set of on-going actions for longer-term
economic development in a post bypass environment provides businesses in the highway
related sector with an opportunity to voice their specific concerns. Similar perceptions were
identified in the 2013 study. The main priorities and opportunities identified for Council in
the 2013 study are listed below (Table 22).
It is important to note from Table 22 that many of the identified priorities have actually
been implemented by Council. Beautification of the main street in the town centre was
completed some 18 months ago, and the streetscape revitalisation program at Frederickton
was also completed. In addition, Council had added turning lanes on Smith Street and also
commenced a beautification upgrade of Smith Street. Enhanced signage at either end of the
bypass has yet to be implemented but is likely to be finalised once the Port-Macquarie –
Kempsey upgrade is completed. In addition, Council is facilitating a town entrance statement
competition.
In terms of the economic development dimension businesses at the time voiced strong
opinions on the need for Council to develop plans for more jobs, industry, people and
growth in the town given concerns about the negative impacts of the bypass at the time of
the 2013 study. In that study several developments that were in the pipeline were noted
and these have since been completed or become operational. These developments include:
expansion of the Nestle’ factory at Smithtown, completion of the redevelopment of
Kempsey Hospital, opening of the highway service centre, a new manufacturing partnership
between Akubra hats and DKM Blue, completion of stage 2 and 3 of Macleay Valley House,
and the new Green Leaf Farm development became operational.

53
Table 22 Perceived priorities and opportunities for a post-bypass strategy in 2013
Priorities and Opportunities for Council Frequency
Priorities
Beautification of the main street and town centre 35
Urgent need for better signage at either end of the bypass 18
Urgent need for jobs, industry, people and growth 15
Need to make Kempsey a destination for travellers 15
Urgent road infrastructure improvements 10
Fix up the mall 4
Need to improve facilities for persons with caravans – need a good RV
park 4
Tackle crime problem in the town centre 3
Need a movie theatre in Kempsey 3
No highway service centre 2
Opportunities
Vision to encourage more economic growth – jobs, industry, tourism 30
Develop Kempsey as a transport interchange 10
Encourage more indigenous employment projects 8
Need for more events based tourism 8
Make better use of the river as an asset for tourism etc. 6
Encourage more government departments to locate in town 5
Source: Survey of businesses 2013
In the period between 2013 and 2017 Council established a new partnership with Arena
International Aviation College for long-term plans for a $18m training facility for Chinese
student pilots at Kempsey Airport; successfully developed and launched the Macleay Valley
Food Bowl promotion; developed a highly targeted marketing campaign to promote the
Macleay Valley as a key holiday destination for families, couples and grey nomads; launched
the Macleay Valley Coast, Discover Something New visitor information guide in April, 2016
to entice visitors to the region and encourage visitors that are already in the region to get
out and explore, and; received a $2 million grant from the Federal Government as part of its

54
National Stronger Regions Fund to support development of a four-screen commercial
cinema complex for Kempsey. In 2016 the NSW Department of Justice announced that the
Mid North Coast Correctional Centre at Kempsey is to be expanded to create an additional
440 beds and 110 jobs for the region. In July 2017 Council adopted an ambitious Delivery
Program, focused around significant investment in economic and social growth over the
next four years.
The initiatives listed above that have occurred between the period of the two studies
highlights the pro-active nature of Kempsey Shire Council and its focus on significant
economic development strategies for the town and Shire which have generated or will
generate a substantial number of jobs for the local community (estimated at upwards of 200
full-time jobs). By any measure, Council has taken notice of the views expressed by
businesses in the 2013 study that were very critical of its perceived inertia on economic
development initiatives after the bypass and perceived lack of consideration of business
views in formulating plans for the future.
6.1 Priorities and opportunities in 2017
Given the above economic development and tourism related initiatives by Kempsey Shire
Council, and those by the private sector who value the locational choice of the Macleay
Valley and Kempsey in particular, how do businesses now perceive the proactive nature of
Council in supporting economic growth and the economic sustainability of businesses in
town through infrastructure investments? The last question in the business survey sought
information from businesses on their perceptions of what other priorities and opportunities
for local economic growth they would like to see Council support as part of its continuing
post-bypass strategy.
In discussions with businesses on this question, it was clear from their considered responses
that there was much less blame on Council for economic development issues or inertia in
not being proactive enough to help businesses in the immediate post bypass period. A
reason for businesses having a more moderate and considered view is the track record of
Council during this period as discussed above. Many more businesses were willing to say
that Council was actually doing a good job in 2017 as compared to 2013. Second, for most
businesses the bypass was a no longer a talking point and other economic changes in the

55
national economy were now impacting businesses in Kempsey, especially the downturn in
the mining sector and the retail environment in general.
6.1.1 Priorities
Many of the priorities noted by businesses in the 2017 survey are variations on a theme and
have been classified under some broader themes. These are presented in Table 23 and
discussed separately below. What is immediately apparent from Table 23 is the similarity of
priorities with the 2013 study. However, the context of this similarity is different given the
time that has passed since the opening of the bypass and the overwhelming majority of
businesses indicating that they were not affected by any continuing effects of the bypass.
Need for jobs, industry, people and growth
Many businesses noted that while Council had made significant strides in the area of
economic development there was a need to raise Kempsey to a higher level of economic
growth – a more virtuous economic cycle – that links industry (commercial, industrial and
retail etc.) with employment, residential expansion and economic interaction. A good way of
achieving this was to develop a strategic economic plan that focussed more on Kempsey
than the Macleay Valley.
In addition there was a view that attributes such as lower housing costs, cheaper industrial
land prices, availability of skilled labour and a strategic location should be marketed to the
capital cities in order to attract industry. The idea was for Council to more effectively market
the economic and locational advantages of Kempsey as a place for business in capital cities
and overseas. Businesses understood all-to-well the direct and indirect multiplier effects of
additional industry, people and jobs on economic growth potential. There was a view among
some businesses that population in Kempsey urban centre needed to rise substantially in
order to achieve a threshold of population that could support larger retailers in the main
street.

56
Table 23
Perceived priorities and opportunities for Council
Priorities and Opportunities for Council Frequency
Priorities
Need for jobs, industry, people and growth 34
More retailers in the town centre 22
More major events for Kempsey and promotion of events 14
Need to make Kempsey a destination for travellers 8
Urgent road infrastructure improvements in South Kempsey 7
Get cinema up and running – good for town and businesses 6
Need to fix up signage at interchanges 4
Council to encourage younger entrepreneurs to commence businesses 3
CCTV cameras in town centre 2
Get on with setting up flying school 2
Champion and streamline process for major development applications 1
Opportunities
Develop Kempsey as a transport interchange 20
Retailers to cater for needs of younger people 8
More promotion of town and its opportunities more widely 7
Need to encourage more day trip tourism to Kempsey (and town
centre)/ Set up new tourism routes to Kempsey 8
Need for more events based tourism (e.g. BoyzN’Bikes event) 8
More employment opportunities for kids and school leavers
Upgrade of showgrounds 5
Source: Survey of businesses 2017
More retailers in the town centre
When Barsby’s and Harvey’s Furniture closed their doors many businesses perceived that
their departure from the main street left a big hole in retailing in the town centre that has
not been filled. Even though the closure of these stores was not highway related, and that

57
they may not have been as well patronised by locals, they were seen as retail anchor points
for the town centre; locals and outsiders would come to town and visit the stores or use
them as a social gathering place. Despite the opening of new stores in the town centre,
some businesses perceive that the quality of the retailing mix has declined – made even
more problematic by a static retail environment – and that there is an urgent need for
Council to attract more traditional retailers to the town centre. This was not a view shared
by all businesses that perceive the retailing mix to be positive and beneficial but, in turn,
would also like to see more retailers in the town centre.
Businesses mentioned the need for a sport store in Kempsey, a Cotton On store, a Jay-Jays
store. Others mentioned a Lowes menswear store on the main street and that Kempsey
should have an Akubra signature store in the town centre to sell Akubra hats and the range
of other products manufactured at the factory in Kempsey. There is a perception that these
types of businesses in the town centre would go a long way to making the town centre a
destination. A Cotton On and Jay-Jays store would also cater for younger persons in
Kempsey as several businesses noted there were not enough stores for younger people in
the town centre.
More major events for Kempsey and promotion of events
Most of the accommodation establishments mentioned that while their room occupancy
levels tend to be lower during the weekdays, the weekends can be fully booked with families
from outside the region travelling to Kempsey and surrounding local communities to attend
major sporting or cultural events. These events were of regional significance and attracted
visitors from Newcastle, Hunter Region, mid north coast and north coast. Examples of these
regionally significant events are in the areas of BMX bike racing, rugby league, fly fishing,
bowling, swimming carnivals, horse dressage and stock horses, car rally’s, music festivals,
indigenous cultural events and so on.
Businesses noted two issues for Council to consider; first, the perception that many of these
events are not as well promoted as they could be. The view was that the ‘What’s on in
Kempsey’ this month webpage of the Visitor Information Centre or the Council Facebook
page do not capture all the significant events that are on the horizon and that other social
media savvy ways of promoting these events is required. One business strongly

58
recommended that Council develop an android and iPhone ‘What’s on in Kempsey’ mobile
phone app which would capture and promote all events at one time.
The second issue that businesses noted is that more of these events should be staged in
Kempsey so that nearly every weekend of the year is taken up by events that bring visitors
to the town and, hopefully, to the town centre etc. The economic benefits of these
regionally significant events are difficult to estimate but would comprise a significant
proportion of turnover for the accommodation establishments and other sectors as well.
Need to make Kempsey a destination for travellers
Many businesses were once again of the view that Council, along with the Chamber of
Commerce and Industry, should develop tourism strategies that make the town, and
especially the town centre, a destination for travellers. There was a view that drawing more
locals to the town centre following completion of the streetscape program was worthwhile,
but there needed to be more effort in attracting day trip travellers and in developing and
marketing the benefits for day trip travellers to Kempsey. Other businesses noted that this
was already evident on the main street and that a marketing campaign along with new
businesses in the town centre could bring travellers back into the town. Several businesses
noted that for this strategy to be successful, many businesses in the town centre that cater
for travellers – such as the eateries - would need to extend their hours of operation,
especially on weekends.
Urgent road infrastructure improvements in South Kempsey
Respondents in South Kempsey expressed concern that Council had not yet commenced the
streetscape revitalisation program on Macleay Valley Way in South Kempsey. For these
businesses, the issues of parking and access, as noted in section 5, were important and
needed to be re-assessed as part of any revitalisation program. In addition, those businesses
located close to the industrial estate noted the deteriorated condition of roads within the
estate – a situation not conducive to attracting new industry to the area.
Businesses in South Kempsey were very supportive of the streetscape revitalisation program
in the town centre and at Frederickton and could see the value of Council’s infrastructure
investment to the town centre at present and in the future. They perceive the same types of

59
infrastructure spending on upgrades and beautification works would greatly enhance the
amenity of the area for the community but also current and future business operators.
Get cinema up and running – good for town and businesses
The majority of business respondents’, and certainly all of those located at Kempsey Central,
were of the view that such an entertainment facility was needed in the town and praised
Council for securing grant funds to make this possible. The main economic benefits for the
town were perceived to be: propensity to reduce retail leakage to Port Macquarie so that
more shopper dollars could potentially be spent locally; the jobs that would be created
during construction and on-going employment once the project was completed; benefits of
a redevelopment of Kempsey Central; new businesses such as eateries that may start-up to
cater for the needs of cinema patrons. Several businesses noted that there would be no
eateries open late at night to cater for the needs of cinema goers and that this could present
an opportunity for younger entrepreneurs.
Need to fix up signage at interchanges
Several businesses noted that Council, in association with RMS, had not yet finalised signage
for Kempsey at either end of the bypass, especially signage that indicates to potential
visitors or through travellers what Kempsey has to offer. The businesses that noted the
signage issue indicated that this was not consistent with a proactive Council and urged
Council to quickly develop these signs. The signs which they perceive as being necessary at
the interchanges are not the standard RMS blue on white signs that use international
symbols. They would like to see signs that inform the travelling public about key features
present in the town for the traveller or visitor. Most businesses were not aware of the
development of the town entrance statement that Council was facilitating.
Some businesses indicated that they will develop their own signs to promote their individual
business as a destination but there is some confusion among business owners as to whether
they are/are not allowed to place signs on the highway or on the bypass.
Council to encourage younger entrepreneurs to commence businesses

60
Several businesses mentioned this as a priority that Council and the Chamber of Commerce
and Industry could support. There was a view that several new businesses in town were
associated with younger owners/managers and this should be further encouraged in
marketing and promotional materials. The presence of younger business owners was
perceived to have generated a new dynamic in town and be the beginning of generational
change in business ownership.
CCTV cameras in town centre
Only a few respondents mentioned this as a priority for Council. There was awareness of a
rising crime problem in the town centre. The same businesses also noted that Council had
received funding for these cameras but were wondering why they had not yet been
installed. These were perceived to be very important for encouraging a safer town centre for
locals and travellers.
Get on with setting up flying school
The overwhelming majority of businesses were very supportive of this Council initiative and
could see the positive economic benefits of the development. However, some businesses
expressed concern at the politics around the initiative and that concerns over noise in some
sections of the community could potentially de-rail the project. These particular businesses
stated that Council should be making this initiative an even greater priority.
Champion and streamline processes for major development applications
Only a few respondents mentioned this as a priority for Council, and this was also a priority
issue mentioned in the 2013 study. The perception was that large development applications
were being scrutinised for too long as part of the DA approval process and businesses were
not sure of who was handling their application. As a result, the perception is that delays are
costing them money and holding back a project that would contribute to the local economy.
The view is that Council should assign a ‘champion’ – a key person in Council – who will be
responsible for the DA from initial submission to approval stage.

61
6.1.2 Opportunities
The list of perceived opportunities mentioned by business respondents (Table 21) are
predominantly characterised by the economic development dimension as in the 2013 study.
A group of respondents expressed the desire for Council to support establishment of a
transport interchange in Kempsey that would capitalise on the strategic location of Kempsey
and on its transport orientation. This interchange was not perceived as being located at the
highway service centre, where large trucks and B-Doubles already refuel, but at a site in the
South Kempsey area where trucks could interchange their loads and take the required
amount of rest time. At present, many trucks perform this interchange function on Smith
Street between the Liberty and Shell service stations.
It is interesting to note again that the concept of a transport interchange at Kempsey was
also recommended for further investigation in the Kempsey Shire Council Bypass Strategy
(2011). In that document the specific recommendation was for Council to consider whether
Kempsey could provide a transport logistics function for the distribution of goods across
northern NSW. The document recommended that investigations should focus on both
Kempsey’s potential as an intermodal site or as a road haulage logistics site.
Several businesses indicated that there was an opportunity for Council to attract retailers to
the town centre that would cater for the needs of younger people. This would help in
stemming the retail leakage to Port Macquarie. The same types of businesses were
mentioned as in the priorities section. One way of attracting these types of businesses was
for Council to promote the town and its opportunities more widely.
The need for Council to encourage more day trip tourism to Kempsey and the town centre
was seen as an opportunity for tourism personnel in Council to work with regional tourism
groups to set up new tourism routes to Kempsey. Some businesses said this was also an
opportunity to link with community groups within and outside the Shire to establish bus
services for day trippers to Kempsey. In this regard, one business mentioned the need to
enlarge the museum at the Visitor Information Centre to include the maritime history of
Kempsey – this could attract further day visitors with an interest in the significant maritime
history of the area.

62
Several businesses also noted that Council has an opportunity to facilitate other significant
tourism based events to attract people to Kempsey. Mention was made of a BoyzN’Bikes
event for motorcycle enthusiasts, a stock horse and quarter horse event (assuming the
upgrade of the showgrounds), and river based events like water skiing and dragon boat
racing.
Five businesses noted the need for Council to upgrade the showgrounds to prevent water
build up during periods of heavy rain. This led to the postponement of the Kempsey Show in
March. These businesses also noted that upgrades of other facilities at the showgrounds had
the potential to attract other sporting events to the area and, in turn, benefit other
businesses in town.

63
7. Summary and conclusion
At the time of the 2013 study there was considerable optimism in the community that once
things ‘settled down’ from the diversion of traffic onto the bypass, Kempsey would become
a much better place for shopping and to visit and that the future environment for business
would be enhanced, especially following beautification of the main street. At the time
several businesses reported signs that sales were starting to improve. It was believed that
this was due to the fact that more of the town’s residents and those from the hinterland
were spending more money in the town than before, in itself not unrelated to the positive
environmental effects the diversion of through traffic had on the town centre.
Four years after the opening of the bypass the survey of businesses in 2017 found that only
a very small number of businesses (11 out of 124) continued to be negatively affected by the
bypass and that these businesses had laid off an additional 20 workers. At the same time,
the overwhelming majority of businesses reported no continuing effects of the bypass, but
other economic drivers were determining increases or decreases in turnover and all
businesses had made further adjustments to business operations to remain competitive and
sustainable in a post bypass environment.
From the evidence presented in the study, it appears that the effects of the bypass for the
small number of businesses concerned continued for another 2 years before they too began,
for the most part, to turn the corner in terms of gross annual turnover. In the period
between 2013 and 2017, the mitigation measures put in place by Council as part of its post
bypass strategy resulted in investment in infrastructure to assist businesses in the town
centre, and facilitation of development of the service centre. Other proactive measures by
Council in the same period, and by the private sector, had generated employment far in
excess of the relatively small number of jobs lost directly from the opening of the bypass.
The bypass did trigger rapid change in the town centre particularly with the closure of 24
businesses between 2013 and 2017. However, in the same period, 21 new businesses
commenced operations in Kempsey with 11 of these being in the eateries sector. These new
businesses alone generated 250 new jobs, 170 of which are located at the service centre.

64
Among those continuing businesses and those under new ownership/management, there
occurred additional growth in employment and in turnover. For these businesses, turnover
in 2016-17 was now higher than that reported one year prior to the opening of the bypass.
In aggregate terms, across all businesses, the employment levels rose from 1137 jobs in
2013 to 1386 jobs in 2017 – an increase of 21.8% over 2013 levels. In terms of gross annual
turnover, there has occurred an increase in the order of $49.7 million between 2013 and
2017 – an increase of 45.2% over turnover levels for 2013. Much of this increase could be
attributed to the positive impact of the new businesses, but also to further adjustments
made by businesses – especially embracing social media and web technology for sales and
marketing – and to higher dependence on local trade which was enhanced by the
streetscape revitalisation program in the town centre.
For the economy of Kempsey, the proactive measures adopted by Council, and more recent
initiatives such as the flying school at the airport, cinema complex at Kempsey Central,
tourism initiatives and further infrastructure spending all contribute to economic
development and growth. The future expansion of the correctional facility at Kempsey will
add a further 110 full-time positions and benefit many businesses, including retailers on the
main street.
For the overwhelming majority of businesses, the bypass and the service centre were no
longer topics of discussion; they have been embraced just as they have by travellers and
locals alike. Even the road upgrade between Port-Macquarie and Kempsey received scant
attention by businesses in the survey as most recognise it is necessary and will benefit not
just motorists but potential visitors to Kempsey.
In concluding, it can be stated that based on the surveys undertaken for this study, that
Kempsey has a bright future and that there is indeed “Life After the Bypass”. Kempsey will
continue to play a role as an important mid-journey service centre serving the needs of
motorists travelling along the Pacific Highway. Given all the proactive measures by Council
and the initiatives of businesses, Kempsey also has the potential to become a major
destination for visitors – something which many businesses in the town centre would say
has already commenced.

65
References Kempsey Shire Council (2013) Pacific Highway bypass strategy and Kempsey bypass background issues paper. NSW Roads and Traffic Authority (2007) Kempsey to Eungai – upgrading the Pacific Highway – traffic and transport assessment prepared by PB (unpublished) NSW Roads and Traffic Authority (2007) Kempsey to Eungai – upgrading the Pacific Highway – environmental assessment, Vol. 1, Chapter 18 Socio-economic assessment. Parolin, B and Garner, B (1996a) Evaluation of the economic impacts of bypass roads on country towns – final report, prepared for the Roads and Traffic Authority of NSW. Parolin, B and Garner, J (1996b) Evaluation of the economic impacts of bypass roads on country towns – a guide to good practice, prepared for the Roads and Traffic Authority of NSW. Parolin, B (2011a) Economic evaluation of town bypass. Review of Literature. Prepared for NSW Roads and Traffic Authority. University of New South Wales. Parolin, B (2011b) Economic evaluation of town bypass. Final Report. Prepared for NSW Roads and Traffic Authority. University of New South Wales. Parolin, B (2013) Economic impacts of the Kempsey bypass. Final Report. Prepared for Kempsey Shire Council by UNSW Global Pty Ltd. Phibbs, P., Heidrich, A., and Cooney, C (2009) The Karuah bypass: economic and social impacts. The five year report. University of Sydney. Roadnet (2011) Kempsey local area traffic corridor study. Kempsey Shire Council. Rowe, H. and Phibbs, P (2005) The Karuah bypass: economic and social impacts. The one year report. University of Sydney.

66
Appendix 1
Employment by Industry – Kempsey Shire 2010/11 and 2015/16

67
Employment (total) by Industry
Kempsey Shire Change
Industry Number %Regional
NSW%Number %
Regional
NSW%
2010/11 to
2015/16
Agriculture, Forestry and Fishing 752 6.4 6.6 552 5.3 6.6 +200
Mining 34 0.3 2.7 29 0.3 2.5 +5
Manufacturing 1,025 8.8 8.3 800 7.7 8.6 +225
Electricity, Gas, Water and Waste Services 118 1.0 1.7 111 1.1 1.6 +7
Construction 1,427 12.2 8.2 1,280 12.2 8.4 +148
Wholesale Trade 267 2.3 2.8 280 2.7 2.9 -12
Retail Trade 1,365 11.7 11.6 1,371 13.1 11.7 -6
Accommodation and Food Services 914 7.8 8.1 876 8.4 8.1 +38
Transport, Postal and Warehousing 521 4.4 4.2 500 4.8 4.2 +21
Information Media and Telecommunications 84 0.7 0.9 84 0.8 1.0 +0
Financial and Insurance Services 138 1.2 1.9 134 1.3 2.1 +4
Rental, Hiring and Real Estate Services 130 1.1 1.5 133 1.3 1.5 -2
Professional, Scientific and Technical
Services314 2.7 4.2 318 3.0 4.5 -4
Administrative and Support Services 314 2.7 2.8 303 2.9 2.9 +10
Public Administration and Safety 805 6.9 6.3 808 7.7 6.5 -3
Education and Training 1,145 9.8 9.2 980 9.4 8.8 +165
Health Care and Social Assistance 1,849 15.8 13.2 1,451 13.9 12.7 +399
Arts and Recreation Services 119 1.0 1.3 102 1.0 1.3 +17
Other Services 390 3.3 4.4 344 3.3 4.2 +46
Total Industries 11,713 100.0 100.0 10,453 100.0 100.0 +1,260
Source: National Institute of Economic and Industry Research (NIEIR) ©2016.
Compiled and presented in economy.id by .id , the population experts.
http://www.id.com.au
2015/16 2010/11

68
Appendix 2
Letter to Businesses

69
Tran-Stat Research International
KEMPSEY POST-BYPASS IMPACT MONITORING STUDY
BUSINESS SURVEY
To: Owner/Manager 26 April 2017
Dear Sir/Madam,
I am writing to you in regards to a study investigating the continuing positive and negative economic impacts of the Kempsey bypass on business activity since the initial survey in October 2013. The study is again being undertaken by Dr Bruno Parolin, Trans-Stat Research International, for Kempsey Shire Council.
As you know, the bypass has now been opened for four years and much has changed in Kempsey over this time period. The study in 2013 documented both positive and negative impacts of the bypass and, generally, the negative impacts were much less than expected and the business community felt that the bypass made Kempsey a better place to live. Since then, the Street revitalisation program has been completed by Council and a Highway service centre opened in May 2015 at the southern interchange. The upgrade of the Pacific highway from Port Macquarie to Kempsey is also due to be opened later in 2017. It is now time to assess the impacts of these initiatives as well on business activity. Your business has been identified as one who can provide valuable information for this study. With your permission, I would like to include your business in the survey which I will undertake in Kempsey between Monday 1
st May and Friday 2
nd June,
where I would like to visit your business during normal business hours.
The survey will be conducted as an interview with the aim of obtaining information on any continuing impacts the bypass may have had on your own business and businesses in Kempsey, on the impacts of the Street revitalisation program and Highway service centre, and on potential impacts of the highway upgrade from Port Macquarie to Kempsey. All information provided by you will be kept strictly confidential as per the ethical requirements of the New South Wales Government and will be stored in a secure location. The data from the study will be collated to provide a summary of all the businesses in the town as a whole. Individual businesses will not be identified.
Reports of the study will be made freely available to businesses and the community at the completion of the study. If you wish to contact me at any time during the study, or do not wish to participate in this study, please phone me on 0423948745 or email [email protected] with the title ‘Kempsey Post-Bypass Impact Monitoring Study’.
In advance I would like to thank you for your time and co-operation in the study.
Yours sincerely,
Dr Bruno Parolin – Study Director

70
Appendix 3
Business Survey

71
KEMPSEY POST-BYPASS IMPACT MONITORING STUDY
This questionnaire is being used to collect information about any continuing effects the
opening of the bypass has had on business activity in Kempsey since the initial survey in
October 2013. The survey is part of a research project being undertaken by Dr Bruno Parolin
for Kempsey Shire Council.
All of the information you provide will be considered as STRICTLY CONFIDENTIAL
and neither you nor your business will be separately identified in any discussions
relating to or in any reports resulting from the project.
We would like to stress that it is only THE EFFECTS OF THE BYPASS to date that we
are interested in, any SEPARATE EFFECTS of the Street revitalisation program and
HIGHWAY SERVICE CENTRE, and any POTENTIAL IMPACTS of the opening of the
Port Macquarie-Kempsey highway upgrade (expected later in 2017). We appreciate that
the downturn in the Australian economy and other factors such as the higher Aussie
dollar, etc. may have affected business in the town as well since 2013.
Business type:............................................... Location:..........................................
_____________________________________________________________________
Q1. How long have you been operating this business? since 19_____ or since
20______
If commenced operating since October 2013, then go to Q2. Otherwise go to Q4.
Q2. Is the business?
Owner operated ........
A franchise ........
A branch, agency or chain ........
Q3. What are the main reasons you decided to establish this business in Kempsey?
a. ………………………….. b. ………………………………
c. ………………………….. d. ………………………………
Q4. Do you believe that your business has been affected by the bypass, or continues
to be affected by the bypass, since we last spoke to you?
YES............ NO............
Strongly Agree…………………….…….….… Agree……………….……………….…..……..
Don’t Know……………………...….…...….… Disagree…………………………………..…..

72
Strongly Disagree……………………….………
Q5. How many employees do you have now (including paid and unpaid family
members) and how many did you have one year ago?
2017 (now) 2016
Full time: Male........... Female............ Full time: Male...........
Female............
Part time: Male........... Female............ Part time: Male..........
Female............
Casual: Male.......... Female............ Casual: Male.......... Female............
Q6. Have you had to put off any staff since we last spoke to you in October 2013
BECAUSE of a decrease in passing trade?
YES............ NO.............
Q7. If YES, how many?
Full time: M.............. F............... Part time: M.............. F...............
Casual: M.............. F...............
Q8. Did any of these live outside Kempsey? If YES, where did they live?
(Place of residence) (indicate M or F)
Full time: ............................ M F
............................ M F
Part time: ............................ M F
............................ M F
............................ M F
Casual: ............................ M F
............................ M F
Q9. Were any of the staff you put off considered to be Family members?
YES............ NO.............
Q10. Are you considering putting-off staff in the foreseeable future BECAUSE of the
diversion of traffic – say within the next couple of months?
YES............ NO.............(If NO, go to Question 12)

73
Q11. If YES, how many do you expect to put off?
Full time: M……… F………
Part time: M……… F………
Casual: M……… F………
Q12. Have you had to reduce the hours of staff since October 2013 because of the
decline in passing trade from the bypass?
YES.................. NO....................
If YES, give details:
Full time: M……… F………
Part time: M……… F………
Casual: M……… F………
Q13. Have you taken on additional staff because of the opening of the bypass since the
last time we spoke to you in October 2013?
YES............. NO...............
Q14. If YES, how many?
Full time: Males............ Females...............
Part time: Males............ Females...............
Casual: Males............ Females...............
Q15. Do any of these live outside Kempsey?
YES................ NO..................
If YES, where do they come from?
Full time: ....................... M F
....................... M F
....................... M F
Part time: ....................... M F
....................... M F
....................... M F
Casual: ....................... M F
....................... M F

74
Q16. Since October 2013 has your turnover:
IMPROVED STAYED THE SAME GOT WORSE
Q17. Could you please indicate your Turnover (or expected turnover) for 2016-2017?
If you cannot estimate your turnover for this financial year, could you indicate your
turnover for the previous financial year?
2015-2016 (000s) 2016-2017 (000s)
Less than $50,000 ...... 1 Less than $50,000 ..... . 1
$50-100....................... 2 $50-100........................ 2
$100-150..................... 3 $100-150...................... 3
$150-250..................... 4 $150-250...................... 4
$250-500..................... 5 $250-500...................... 5
$500-1million.............. 6 $500-1million.......... .... 6
$1m-1.5m................... 7 $1m-1.5m................... . 7
Over $1.5m................. 8 Over $1.5m................. 8
Q18. By how much do you estimate that your turnover has decreased or
increased since October 2013 year BECAUSE of the diversion of traffic from the
opening of the bypass?
Less than 5% 5 - 9% 10-14% 15-19% 20-24% 25-29%
30-34% 35-39% 40-44% 45-49% over 50%
Q19. Has your wages/salaries bill been further affected by the bypass?
YES................ NO..................
If Yes, what are the wages/salaries figures for the 2016-2017 financial
year or 2015-2016?
In 2015-2016 $..........................................In 2016-2017 $......................................

75
Q20. How much of your trade do you think now comes from people who are passing
through but stopping in town, i.e. passing trade?
%........................................ $…………………………
Q21. How has the composition of your business or the way that you now do business
changed since the last time we spoke as a result of the opening of the bypass?
.................................................................................................................. ..
……………………………………………………………………………
....................................................................................................................
....................................................................................................................
.................................................................................................................. ..
....................................................................................................................
…................................................................................................................
Q22. Have you changed your business hours since October 2013 BECAUSE of the
diversion of traffic?
YES.................. NO....................
If YES, give details:
....................................................................................................................
....................................................................................................................
Q23. We are not only interested in the way the bypass has directly affected your own
business, but also how it has affected others with which you deal since the last
time we spoke to you.
Have you reduced the amount you spend on goods and services PURCHASED
from other businesses in Kempsey since 2013 because of the diversion of traffic?
YES.................. NO....................
(If No, go to Question 26)
Q24. If YES, can you indicate by how much you have reduced the amount you spend on
the following items from other businesses in Kempsey since we talked to you in
October 2013 and the name of the supplier?
Item $ Amount

76
(name) (or % of total) Name and Place of Supplier
1. Meat .................. .....................................................
2. Bread/Cakes .................. .....................................................
3. Pies .................. .....................................................
4. Fruit/Veg .................. .....................................................
5. Groceries .................. .....................................................
6. Milk Products .................. .....................................................
7. Newspapers .................. .....................................................
8. Stationary .................. .....................................................
9. Cleaning Stuff .................. .....................................................
10. Other Items .................. .....................................................
Q25. Can you comment on the ways in which the opening of the bypass has
changed your dealings with any of the suppliers you have mentioned?
....................................................................................................................
....................................................................................................................
....................................................................................................................
....................................................................................................................
Q26. Do you believe the bypass has had a positive effect on the ECONOMY of
Kempsey as a whole?
Strongly Agree…………………………….…
Agree………………………………………....
Don’t Know…………………………….……..
Disagree……………………………………...
Strongly Disagree……………………………
Specific Positive effects
...........................................................................................................................
...........................................................................................................................
...........................................................................................................................
...........................................................................................................................
Specific Negative effects
...........................................................................................................................
...........................................................................................................................
...........................................................................................................................

77
...........................................................................................................................
Q27. Do you believe the bypass has made Kempsey a better place to live?
Strongly Agree…………………….…….….…
Agree……………….……………….…..……..
Don’t Know……………………...….…...….…
Disagree…………………………………..……
Strongly Disagree……………………….…….
Effects of Implementation of Kempsey Streetscape Revitalisation Program
Kempsey Shire Council has undertaken a Streetscape Revitalisation Program in the CBD
(Smith Street) and Frederickton. We are interested in the EFFECTS, if any, of this
Streetscape Revitalisation Program on your business.
Q28. Do you believe that your business has been affected by the Streetscape
Revitalisation Program?
YES...........(If YES, go to Q29) NO............(If NO, go to Q33)
Strongly Agree…………………….…….….…
Agree……………….……………….…..……..
Don’t Know……………………...….…...….…
Disagree…………………………………..……
Strongly Disagree……………………….…….
Q29. If YES, has the EFFECT on your business been:
(a) POSITIVE............ (b) NEGATIVE............ (c) MADE NO DIFFERENCE……..
Specific Positive effects
...........................................................................................................................
...........................................................................................................................
...........................................................................................................................
...........................................................................................................................
Specific Negative effects
...........................................................................................................................
...........................................................................................................................
...........................................................................................................................
...........................................................................................................................

78
Q30. If (a) or (b) in Q29. by how much do you estimate that your turnover has
decreased or increased this financial year BECAUSE of the Street Revitalisation
Program?
Less than 5% 5 - 9% 10-14% 15-19% 20-24% 25-29%
30-34% 35-39% 40-44% 45-49% over 50%
Q31. How much of your trade do you think now comes from people who are locals or
from the Kempsey region?
%........................................ $…………………………
Q32. How has the composition of your business or the way that you now do
business changed since the completion of the Street revitalisation program? .................................................................................................................. ....................................................................................................................
....................................................................................................................
....................................................................................................................
....................................................................................................................
…................................................................................................................
Q33. Do you believe the Street revitalisation program has had a positive effect on the
Town Centre and Frederickton as a whole?
Strongly Agree…………………………….…
Agree………………………………………....
Don’t Know…………………………….……..
Disagree……………………………………...
Strongly Disagree……………………………
Specific Positive effects
...........................................................................................................................
...........................................................................................................................

79
...........................................................................................................................
...........................................................................................................................
Specific Negative effects
...........................................................................................................................
...........................................................................................................................
...........................................................................................................................
...........................................................................................................................
Q34. Do you believe the Street revitalisation program has made Kempsey a better
place to shop?
Strongly Agree…………………….…….….…
Agree……………….……………….…..……..
Don’t Know……………………...….…...….…
Disagree…………………………………..……
Strongly Disagree……………………….…….
Effects of Opening of Highway service centre at South Kempsey (Opened in May 2015)
Q35. Do you believe that your business has been affected by the Highway Service
Centre at South Kempsey?
YES...........(If YES, go to Q36) NO............(If NO, go to Q39)
Strongly Agree…………………….…….….…
Agree……………….……………….…..……..
Don’t Know……………………...….…...….…
Disagree…………………………………..……
Strongly Disagree……………………….…….
Q36. If YES, has the EFFECT on your business been:
(a) POSITIVE............ (b) NEGATIVE............ (c) MADE NO DIFFERENCE……..
Specific Positive effects
...........................................................................................................................
...........................................................................................................................

80
...........................................................................................................................
...........................................................................................................................
Specific Negative effects
...........................................................................................................................
...........................................................................................................................
...........................................................................................................................
...........................................................................................................................
Q37. If (a) or (b) by how much do you estimate that your turnover has decreased or
increased this financial year BECAUSE of the Highway service centre?
Less than 5% 5 - 9% 10-14% 15-19% 20-24% 25-29%
30-34% 35-39% 40-44% 45-49% over 50%
Q38. How has the composition of your business or the way that you now do
business changed BECAUSE of the opening of the Highway service centre?
....................................................................................................................
....................................................................................................................
....................................................................................................................
.................................................................................................................. ..
Q39. Do you believe the Highway service centre has had a positive effect on
businesses in Kempsey?
Strongly Agree…………………………….…
Agree………………………………………....
Don’t Know…………………………….……..
Disagree……………………………………...
Strongly Disagree……………………………
Specific Positive effects
...........................................................................................................................
...........................................................................................................................
...........................................................................................................................
...........................................................................................................................
81
Specific Negative effects
...........................................................................................................................
...........................................................................................................................
...........................................................................................................................
...........................................................................................................................
Q40. Do you believe the Highway service centre has had a positive effect on the
economy of Kempsey as a whole?
Strongly Agree…………………….…….….…
Agree……………….……………….…..……..
Don’t Know……………………...….…...….…
Disagree…………………………………..……
Strongly Disagree……………………….…….
Potential impacts of completion of the Port Macquarie-Kempsey Highway Upgrade (expected
later in 2017).
Q41. Do you believe that your business is likely to be affected by the opening of the Port
Macquarie-Kemspey Highway Upgrade?
YES...........(If YES, go to Q42) NO............(If NO, go to Q45)
Strongly Agree…………………….…….….…
Agree……………….……………….…..……..
Don’t Know……………………...….…...….…
Disagree…………………………………..……
Strongly Disagree……………………….…….
Q42. If YES, do you anticipate the impact on your business will be:
(a) POSITIVE............ (b) NEGATIVE............
Specific Positive effects
...........................................................................................................................
...........................................................................................................................
...........................................................................................................................
...........................................................................................................................
Specific Negative effects

82
...........................................................................................................................
...........................................................................................................................
...........................................................................................................................
...........................................................................................................................
Q43. If (a) or (b) in Q42. by how much do you estimate that your turnover is likely to
decrease or increase BECAUSE of the anticipated impacts of the Port Macquarie-
Kempsey Highway Upgrade?
Less than 5% 5 - 9% 10-14% 15-19% 20-24% 25-29%
30-34% 35-39% 40-44% 45-49% over 50%
Q44. Have you made any changes, or will you be making any changes, to the
composition of your business or the way that you run the business in anticipation
of the opening of the Port Macquarie-Kempsey Highway Upgrade?
....................................................................................................................
....................................................................................................................
....................................................................................................................
....................................................................................................................
....................................................................................................................
....................................................................................................................
....................................................................................................................
Q45. From a big picture perspective, what other priorities and opportunities for
local economic growth would you like to see Council support as part of
it’s continuing post-bypass strategy?
Priorities
...........................................................................................................................
...........................................................................................................................
...........................................................................................................................
...........................................................................................................................
……………………………………………………………………………………………………………………..
Opportunities
...........................................................................................................................
...........................................................................................................................

83
...........................................................................................................................
...........................................................................................................................
Thank you for your participation in the survey.