keeping our world moving - l.b. foster company
TRANSCRIPT

Keeping ourworldmoving
2020 ANNUAL REPORT®
7490_NARc1_Sngs.indd 1 4/7/21 3:55 PM

EXECUTIVE OFFICERS
ROBERT P. BAUERPresident and Chief Executive Offi cer
PATRICK J. GUINEESenior Vice President, General Counsel, and Secretary
JOHN F. KASELSenior Vice President and Chief Operating Offi cer
BRIAN H. KELLYSenior Vice President, Human Resources and Administration
JAMES M. KEMPTON Controller and Principal Accounting Offi cer
GREGORY W. LIPPARDSenior Vice President, Rail Technologies & Services
WILLIAM F. TREACYSenior Vice President, Infrastructure Solutions
WILLIAM M. THALMAN*Senior Vice President and Chief Financial Offi cer
*Started March 1, 2021
BOARD OF DIRECTORS
LEE B. FOSTER IIChairman of the BoardL.B. Foster Company
ROBERT P. BAUERPresident and Chief Executive Offi cerL.B. Foster Company
RAYMOND T. BETLERFormer President and CEO Wabtec Corporation
DIRK JUNGÉFormer ChairmanPitcairn Company
DIANE B. OWENFormer Senior Vice President – Corporate AuditH.J. Heinz Company
ROBERT S. PURGASONDirector Altus Midstream
WILLIAM H. RACKOFFFormer PresidentANDRITZ ASKO, Inc.
SUZANNE B. ROWLANDFormer Group Vice President,Industrial Specialties,Ashland Global Holdings, Inc.
BRADLEY S. VIZIExecutive ChairmanRCM Technologies, Inc.
SHAREHOLDER INFORMATION
Form 10-KA copy of the Company’s Annual Report on Form 10-K to the Securities and Exchange Commission is available upon request from L.B. Foster’s Investor Relations Department or from the Company website at www.lbfoster.com.
Stock ExchangeL.B. Foster’s common stock is traded on NASDAQ. Ticker symbol: FSTR
Transfer Agent Broadridge Corporate Issuer Solutions, Inc.1.866.321.8022
CORPORATE HEADQUARTERS
415 Holiday DriveSuite 100Pittsburgh, Pennsylvania USA 15220
1.412.928.34171.800.255.4500
www.lbfoster.com
FINANCIAL HIGHLIGHTS
2020 2019
Net Sales $497.4 $616.4
Gross Profi t $95.0 $120.9
Net Income $25.8 $48.0
Diluted Earningsper common share
$0.71 $4.00
Adjusted EBITDA (a) $32.0 $47.4
Adjusted Net Income (a) $10.5 $21.3
Adjusted Diluted Earnings (a)
per common share$0.98 $2.00
YEAR ENDED DECEMBER 31(In millions, except per share data)
(a) See “Non-GAAP Disclosures” on page 8, for a further description of and additional information regarding Adjusted EBITDA, Adjusted Net Income, Adjusted Diluted Earnings Per Share, Net Debt, and related reconciliations to the comparable GAAP fi nancial measures.
RESULTS SUMMARY
$497MREVENUE
YEAR END BACKLOG
$248M
OPERATING CASH FLOW
$21M
NOTE: Numbers above are rounded.
39PLANTS YARDS
OFFICES
1,130EMPLOYEES
WORLDWIDE
1902FOUNDED
$0.98 (a)
ADJUSTED DILUTED EPS
NASDAQ: FSTR
L.B. Foster Company and its subsidiaries provide solutions across numerous rail and infrastructure markets. Our product and service portfolio creates attractive value for our customers and supports their critical needs. The Company maintains locations in North America, Europe, and Asia.
2020 Net Sales by Region($ in millions)
$497
United States
United Kingdom
Canada
Other
$398.3
$44.6
$34.5
$20.0
ADJUSTED EBITDA (a)
$32M
15%NET DEBT (a) REDUCTION
All data contained herein is presented on a continuing operations basis.
7490_CVRc1.indd 27490_CVRc1.indd 2 4/7/21 4:03 PM4/7/21 4:03 PM

LETTER TOSHAREHOLDERS
Throughout 2020, there were many times when the Company encountered moments of extraordinary circumstances.
At each occurrence, we were prepared to address the challenges and the opportunities presented by a rapidly changing environment resulting from the pandemic. The Company was considered an “essential business” where we conduct business around the world, and our team of dedicated employees faced the challenge of keeping our factories and service operations running. Throughout the year, we made adjustments to create a safe working environment capable of providing a high level of service to our customers. For our shareholders, it’s a reminder of the critical projects we work on and the degree to which the infrastructure and transportation systems we support are crucial to moving goods through global supply chains, as well as moving people in an increasingly mobile environment. It highlights the core megatrend of mobility that is behind a great deal of the infrastructure we support.
As 2020 came to a close, we encountered a rather resilient market for both transit and freight rail projects, as well as general infrastructure projects for transportation and non-transportation applications. With the exception of cutbacks that rail operators made due to declining traffi c volume, numerous other projects moved forward. The Rail Technologies and Services segment fi nished the year with sales down by $45 million, or 14%. However, new orders were down by only 11%, ultimately peaking in the 4th quarter, helping us to complete the year with a 17% increase in year-over-year ending backlog. Similarly, the decline in sales of $74 million in the Infrastructure Solutions segment was driven by a decline in new orders of $67 million, which included a $70 million decline in new orders from the Coatings and Measurement businesses. Backlog for this segment increased 1.3% from prior year end. However, the year end
backlog in the non-energy divisions increased 32%. This highlights the resiliency of the non-energy businesses in this segment and the degree to which we were able to secure new business on infrastructure projects despite a diffi cult fi eld operating environment for highly engineered complex projects.
These comparisons underscore the impact that businesses serving energy projects had on our results for the year. Following an unprecedented decline in oil demand, projects of all kinds in the upstream and midstream energy sectors were stopped. The demand for services to upstream customers became so weak and caused so much uncertainty about future demand, that we decided to sell our test and inspection services business that was operating at a loss. The upstream services market never fully recovered from the last downturn in 2015, and we saw no path to acceptable returns for a business that would need more
7490_NARc1_Sngs.indd 3 4/7/21 3:56 PM

NEW BUSINESS REPORTING SEGMENTS
To better align L.B. Foster’s competencies to changing market dynamics, a recent reorganization was completed which consolidated the Company’s reporting into two segments: Rail Technologies & Services and Infrastructure Solutions. The Company believes this structure will eff ectively support its growth opportunities and leverage rebounding markets, both domestic and global.
RAIL TECHNOLOGIES & SERVICES
This reporting segment is comprised of legacy Rail Products and Services businesses.
INFRASTRUCTURE SOLUTIONS
This reporting segment is comprised of the legacy Construction Products and Tubular and Energy Services businesses.
capital to adjust to ongoing changes. Our remaining energy businesses now make up a small part of our overall revenue and are largely focused on midstream pipeline projects, with opportunities to diversify into non-energy market applications using our core competencies in coatings for corrosion protection and in measurement systems that could serve water and gas applications.
As we dealt with a sales decline that amounted to $119 million for the year, management created plans to maximize profi t margins and cash fl ow. Intense focus on expenses, coupled with specifi c restructuring actions, helped us limit segment profi t margins to a 20 basis point decline in the rail segment. The severe decline in energy division volume in the second half created pressure on profi t margins in
the Infrastructure Solutions segment, ultimately driving the consolidated performance lower for the year. Adjusted EBITDA for the year was $32.0 million compared to $47.4 million in 2019.
Despite the challenges faced, we achieved better than $20 million of operating cash fl ow and reduced debt for the fi fth consecutive year. Our top priority for cash continued to
LETTER TOSHAREHOLDERS Continued
7490_NARc1_Sngs.indd 4 4/7/21 3:56 PM
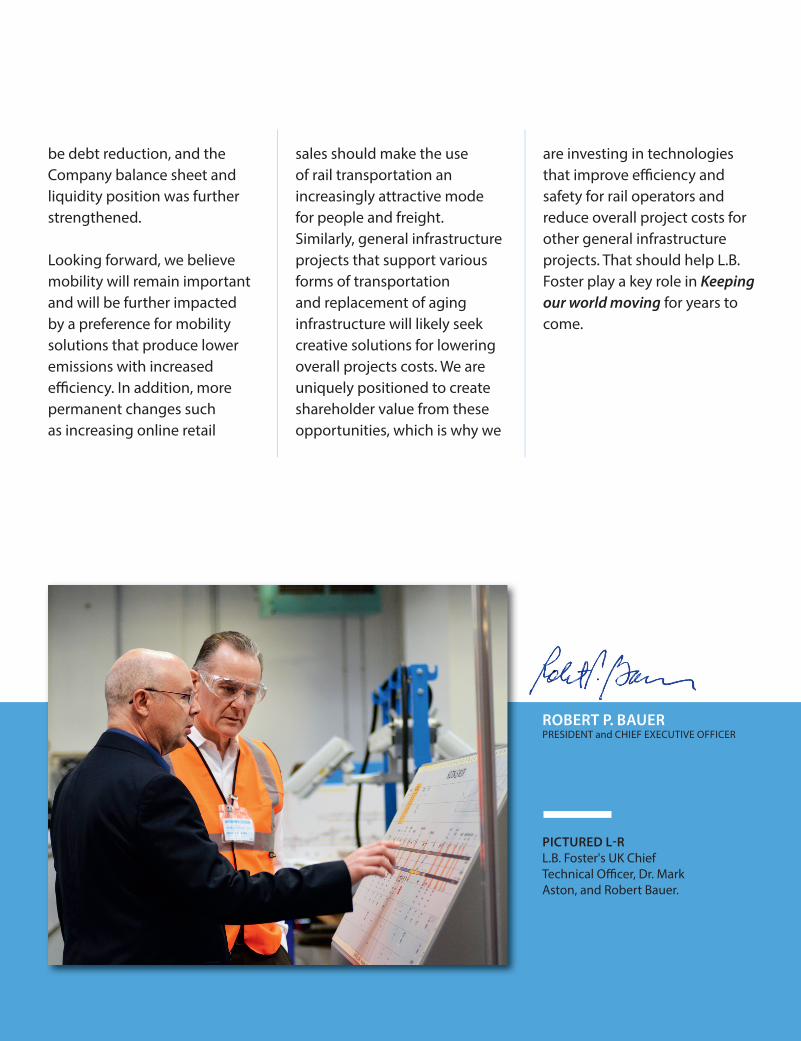
ROBERT P. BAUERPRESIDENT and CHIEF EXECUTIVE OFFICER
be debt reduction, and the Company balance sheet and liquidity position was further strengthened.
Looking forward, we believe mobility will remain important and will be further impacted by a preference for mobility solutions that produce lower emissions with increased effi ciency. In addition, more permanent changes such as increasing online retail
sales should make the use of rail transportation an increasingly attractive mode for people and freight. Similarly, general infrastructure projects that support various forms of transportation and replacement of aging infrastructure will likely seek creative solutions for lowering overall projects costs. We are uniquely positioned to create shareholder value from these opportunities, which is why we
are investing in technologies that improve effi ciency and safety for rail operators and reduce overall project costs for other general infrastructure projects. That should help L.B. Foster play a key role in Keeping our world moving for years to come.
PICTURED L-RL.B. Foster's UK Chief Technical Offi cer, Dr. Mark Aston, and Robert Bauer.
7490_NARc1_Sngs.indd 5 4/7/21 3:56 PM
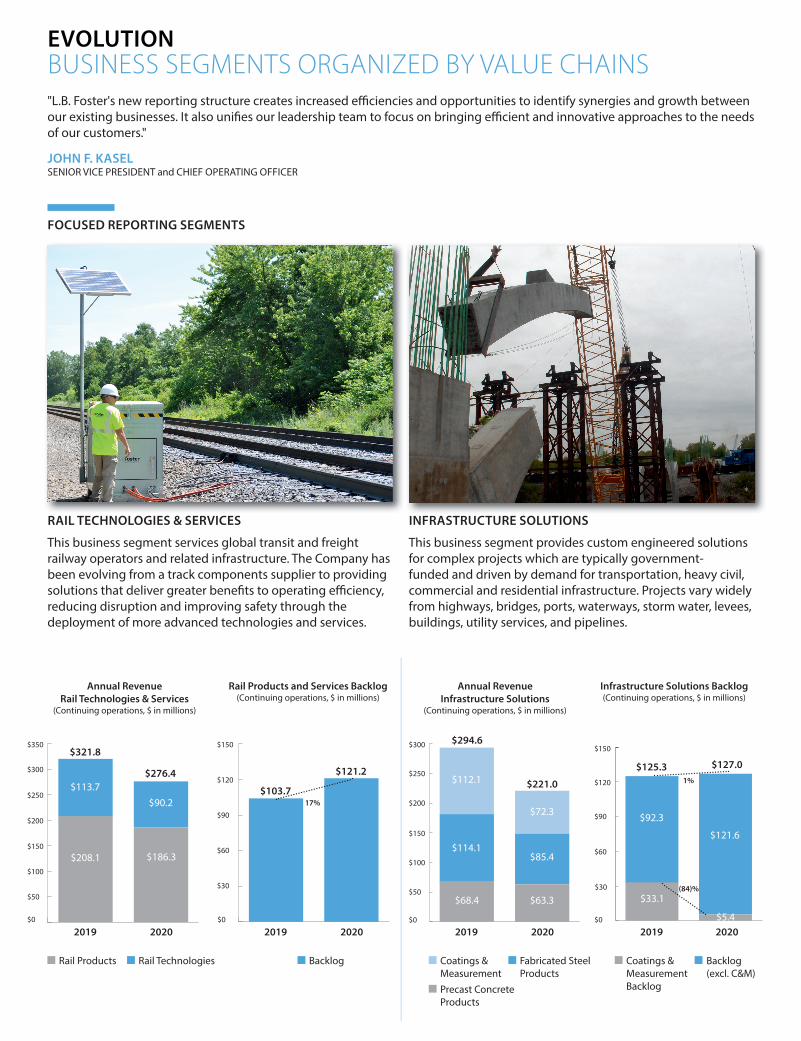
FOCUSED REPORTING SEGMENTS
EVOLUTION BUSINESS SEGMENTS ORGANIZED BY VALUE CHAINS
RAIL TECHNOLOGIES & SERVICES
This business segment services global transit and freight railway operators and related infrastructure. The Company has been evolving from a track components supplier to providing solutions that deliver greater benefi ts to operating effi ciency, reducing disruption and improving safety through the deployment of more advanced technologies and services.
INFRASTRUCTURE SOLUTIONS
This business segment provides custom engineered solutions for complex projects which are typically government-funded and driven by demand for transportation, heavy civil, commercial and residential infrastructure. Projects vary widely from highways, bridges, ports, waterways, storm water, levees, buildings, utility services, and pipelines.
Annual RevenueRail Technologies & Services
(Continuing operations, $ in millions)
$0
$50
$100
$150
$200
$250
$300
$321.8
$276.4$113.7
$208.1
$90.2
$186.3
20202019
Rail Products Rail Technologies
$350
$0
$50
$100
$150
$200
$250
$300 $294.6
$221.0$112.1
$114.1
$68.4
$72.3
$85.4
$63.3
20202019
Coatings & Measurement
Fabricated Steel Products
Precast Concrete Products
Annual RevenueInfrastructure Solutions
(Continuing operations, $ in millions)
$0
Infrastructure Solutions Backlog(Continuing operations, $ in millions)
Coatings & Measurement Backlog
Backlog (excl. C&M)
20202019
$30
$60
$90
$120
$150
$125.3 $127.01%
Rail Products and Services Backlog(Continuing operations, $ in millions)
20202019$0
$30
$60
$90
$120
$150
$103.7
$121.2
17%
Backlog
"L.B. Foster's new reporting structure creates increased effi ciencies and opportunities to identify synergies and growth between our existing businesses. It also unifi es our leadership team to focus on bringing effi cient and innovative approaches to the needs of our customers."
JOHN F. KASELSENIOR VICE PRESIDENT and CHIEF OPERATING OFFICER
$121.6
$92.3
$33.1
$5.4
(84)%
7490_NARc1_Sngs.indd 6 4/7/21 3:56 PM

GROWTHTRANSPORTATION AND INFRASTRUCTURE SOLUTIONSL.B. Foster plays a key role in Keeping our world moving. We leverage our core manufacturing competencies and utilize our expertise to address complex transportation and infrastructure projects that support global supply chains. Successfully delivering solutions that provide mobility for people and systems are proving to make a diff erence now and are helping to shape the future.
Highly customized, modular buildings and concrete products that support a variety of infrastructure needs.
» Multi-functional buildings for parks and recreation, hazmat, and storage.
» Box culverts for road crossings, underground storm water detention, and mine shafts.
» Box beams for bridge rehabilitation and new construction.
» Median barriers, manholes, and lagging walls for highways.
» Underground structures for drainage and utilities.
» Water wells for irrigation» Agricultural products
Solutions in corrosion protection, measurement, and control systems for the safe transportation and accurate measurement of liquids and gas.
» Corrosion protection for line pipe, fi ttings, risers, and fabricated steel used in pipline construction.
» Metering and measurement systems for custody transfer.
» Complete additive and dye injection systems for petroleum truck and rail loading racks.
PORTFOLIO OF PRODUCTS AND SOLUTIONS FOR KEY END MARKETS
Critical Infrastructure that drives the movement of goods and people.
» Reinforced steel grid decking and corrugated steel forms for rapid bridge construction and rehabilitation.
» Steel piling for earth/water retention systems such as ports, dams, waste water, and levee/fl ood control.
» Temporary steel barriers for underground worker protection during highway renovation.
COMMERCIAL / HEAVY CIVIL RESIDENTIAL, COMMERCIAL AND AGRICULTURAL
NATURAL GAS AND LIQUIDS
Advanced technologies that deliver effi ciencies, minimize disruptions, and improve safety to the rail industry.
» Single source track materials for heavy haul and transit rail construction and rehabilitation.
» Friction management to increase rail life, reduce energy consumption, and mitigate noise.
» Monitoring and anti-trespass solutions for safety at rail crossings and platforms.
» Information systems for wayfi nding and passenger comfort.
» Mitagating disruption through early detection monitoring systems for fl ood, avalanche, and rockfall conditions.
HEAVY HAUL AND COMMUTER RAIL
7490_NARc1_Sngs.indd 7 4/7/21 3:56 PM

CORPORATEENVIRONMENTAL, SOCIAL & GOVERNANCE (ESG)"At L.B. Foster, we know that our success is measured not only by our fi nancial performance but also by our ability to do what’s right, today and in the future. As the ESG landscape evolves, we are continually working to embed responsible business practices across L.B. Foster to build long-term value for our employees, shareholders, customers, and the communities we serve."
BRIAN H. KELLYSENIOR VICE PRESIDENT, HUMAN RESOURCES and ADMINISTRATION
“At L.B. Foster, we strive to constantly improve the impact we have on the environment and promote a safe workplace for all of our employees. Environmental, health, safety, and sustainability initiatives are integrated into short-and long-term strategies across our various businesses, and we have reporting systems in place across the Company to capture data on an ongoing basis. For example, we evaluate and track greenhouse gas emissions, energy and water consumption, water reuse, waste generation, and recycling eff orts. We set sustainability targets and programs each year to meet and exceed our customers’ expectations and deliver value for our stakeholders.”
BEN McCLELLANDIRECTOR, ENVIRONMENT, HEALTH AND SAFETY
“The St. Jean, Quebec, track components manufacturing plant is a great example of sustainability and recycling initiatives in action. At our facility, 99.9% of the electricity used is generated either by hydro or wind sources. Up to 70-75% of the process water used in our production is recycled through a cooling tower. On average, 76% of the steel that we purchase for our rail anchors and spikes is produced using recycled scrap steel. And we ship our anchors and spikes in either fuel effi cient bulk gondola cars, or in used burlap coff ee bean sacks. We also ship product in kegs which are made from 30% recycled steel.”
JEAN-PAUL HOMETGENERAL MANAGER, TRACK COMPONENTS
“When our sister CXT Precast plant in Spokane, WA, relocated to Nampa, ID, in late 2019, our concrete tie plant was challenged with changing several processes to recycle raw materials without impacting the quality of our product. For example, we began to use by-products from pulverized fuel ash produced by burning coal (fl y ash) and blast furnace slag from molten iron production, formerly only used by the Precast plant. The increase in fl y ash consumption helps to reduce the landfi lling requirement for the coal and blast furnace byproducts, as well as reduce the amount of Portland cement. We also began to recycle water more extensively to cool the saws used to cut ties when they are fully cured. Rather than purchasing water from the local municipality, we are reusing our process water, along with rainwater, that collects in our settling pond.”
TIM CARDENGENERAL MANAGER, PLANT OPERATIONS, CXT® CONCRETE TIES
“Each of the skids we fabricate every year must be hydrotested with water before being shipped to the customer. In 2019, we initiated a sustainability program to engineer a recapture system that would recycle a portion of that used water rather than disposing of it. In 2020, we were able to recycle more than 25% of the water needed for hydrotesting. As we increase our sustainability eff orts to reduce the use of city water, we now have a new program under development to capture rain water from our property, using that water as much as possible in lieu of using city water.”
TRAVIS CREIGHTONPLANT MANAGER, CHEMTEC ENERGY SERVICES
ENVIRONMENTAL INITIATIVES
7490_NARc1_Sngs.indd 8 4/7/21 3:57 PM

L.B. FOSTER'S PURPOSE AND VALUES
L.B. Foster's purpose - Keeping our world moving - refects our role in helping to support an increasingly mobile environment with innovative engineering and product development solutions that inspire the safety, reliability, and performance of critical transportation and infrastructure projects. Within the Company lies a SPIRIT that drives a culture around continuous improvement and high performance.
L.B. Foster's Values:
We strive to create and promote a culture that makes our Company a great place to work. It's not just about ‘what’ you do every day, but ‘how’ you do it. We use these six principles to guide us every day. The expectation of all employees, at every level of the organization, is to execute our business strategy in a manner that adheres to these core values and demonstrates commitment to the L.B. Foster SPIRIT.
"Last fall we kicked off a new initiative that we call Spark. This has created an opportunity for all L.B. Foster employees across the globe to collaborate in furthering the mission of empowering and supporting the professional growth of women in the workplace. The spirit of Spark is to build upon our existing culture and further strengthen opportunities for women, while providing the guidance and support needed while navigating through the unique challenges that they may experience in their career."
JAMIE O’NEILL VICE PRESIDENT, HUMAN RESOURCES
“I am really honored to serve as a founding member of this unique initiative. Spark provides a platform at L.B. Foster to have conversations about the distinct challenges women face and an opportunity to build a system of support around that. Spark will raise awareness regarding issues that impact women, both inside L.B. Foster, at home and in our communities, and present opportunities to make a diff erence and collaborate with all colleagues across the globe to inspire change. As an example, in early 2021, we began a program to promote employee health and mental wellness.”
CAROLINE TOPLAKMANAGER, DIGITAL MARKETING
“This employee-led initiative is intended to serve as a platform for an exchange of ideas and resources. The goal is to serve as a source of connection and networking for individuals interested in female empowerment and other similar topics. In particular, Spark will off er resources and open dialogue about health and wellness, including mental health, especially as they pertain to women. Already we are seeing a broad level of participation across all of L.B. Foster.”
STEPHANIE LISTWAKMANAGER, FINANCIAL REPORTING and INVESTOR RELATIONS
“Spark is open to all employees who support the growth and development of women. A key element of the program is to present unique mentorship opportunities that will instill confi dence and assist in professional growth. In addition, it will support diversity and inclusion in our workplace, both inside and outside of Spark, as well as all other employee resource groups or initiatives. Over time, we also hope that Spark will serve as a catalyst for the formation of other social initiatives within the Company.”
NICOLE WILSONMANAGER, TALENT DEVELOPMENT
SOCIAL INITIATIVES
7490_NARc1_Sngs.indd 9 4/7/21 3:57 PM

This report discloses adjusted net income from continuing operations, adjusted diluted earnings per share (“EPS”) from continuing operations, earnings before interest, taxes, depreciation, and amortization (“EBITDA”) from continuing operations, adjusted EBITDA from continuing operations, and net debt, which are non-GAAP fi nancial measures. The Company believes that adjusted net income from continuing operations is useful to investors as a supplemental way to compare historical periods without regard to various charges that the Company believes are unusual, nonrecurring, unpredictable, or non-cash. The Company believes that EBITDA from continuing operations is useful to investors as a supplemental way to evaluate the ongoing operations of the Company’s business since EBITDA may enhance investors’ ability to compare historical periods as it adjusts for the impact of fi nancing methods, tax law and strategy changes, and depreciation and amortization. In addition, EBITDA is a fi nancial measure that management and the Company’s Board of Directors use in their fi nancial and operational decision-making and in the determination of certain compensation programs. Adjusted net income from continuing operations, adjusted diluted earnings per share from continuing operations, and adjusted EBITDA from continuing operations adjusts for certain charges to net income from continuing operations and EBITDA from continuing operations that the Company believes are unusual, non-recurring, unpredictable, or non-cash. In 2020, the Company made an adjustment for a non-recurring benefi t from a distribution associated with the Company's interest in an unconsolidated partnership. In 2020 and 2019, the Company made adjustments to exclude the impact of restructuring activities and site relocation. In 2019, the Company made adjustments to exclude the impact of the U.S. pension settlement expense and the income tax benefi t from the release of the U.S. deferred tax asset valuation allowance. The Company views net debt, which is total debt less cash and cash equivalents, as an important metric of the operational and fi nancial health of the organization and is useful to investors as an indicator of our ability to incur additional debt and to service our existing debt.
Non-GAAP fi nancial measures are not a substitute for GAAP fi nancial results and should only be considered in conjunction with the Company’s fi nancial information that is presented in accordance with GAAP. Quantitative reconciliations of adjusted net income from continuing operations, adjusted diluted earnings per share from continuing operations, EBITDA from continuing operations, adjusted EBITDA from continuing operations, and net debt are presented below (in thousands, except per share):
Year Ended December 31(In thousands, except per share data)
2020 2019
Adjusted EBITDA from Continuing Operations Reconciliation
Net income from continuing operations $ 25,823 $ 47,974
Interest expense, net 3,761 4,911
Income tax benefi t (11,841) (23,835)
Depreciation expense 7,850 7,944
Amortization expense 5,729 6,445
Total EBITDA from continuing operations $ 31,322 $ 43,439
Relocation and restructuring costs 2,545 1,768
Proceeds from unconsolidated partnership (1,874) —
U.S. pension settlement expense — 2,210
Adjusted EBITDA from continuing operations $ 31,993 $ 47,417
Adjusted Diluted Earnings Per Share From Continuing Operations Reconciliation
Net income from continuing operations, as reported $ 25,823 $ 47,974
Relocation and closure costs, net of tax benefi ts of $636, and $430, respectively 1,909 1,338
Distribution from unconsolidated partnership, net of tax expense of $446, and $0, respectively (1,428) —
Income tax benefi ts resulting from the divestiture of IOS (15,824) —
U.S. pension settlement expense, net of tax expense of $0, and $563, respectively — 1,647
Deferred tax asset valuation allowance reversal — (29,648)
Adjusted net income from continuing operations $ 10,480 $ 21,311
Average number of common shares outstanding - Diluted, as reported 10,671 10,644
Diluted earnings per common share from continuing operations, as reported $ 2.42 $ 4.51
Diluted earnings per common share from continuing operations, as adjusted $ 0.98 $ 2.00
Net Debt Reconciliation
Total Debt $ 45,024 $ 58,152
Less: cash and cash equivalents (7,564) (14,178)
Net debt $ 37,460 $ 43,974
NON-GAAP DISCLOSURES
pg. 8
7490_NARc1_Sngs.indd 10 4/7/21 3:58 PM

UNITED STATES SECURITIES AND EXCHANGE COMMISSIONWashington, D.C. 20549
FORM 10-K(Mark One)
È Annual Report Pursuant to Section 13 or 15(d)of the Securities Exchange Act of 1934For the fiscal year ended December 31, 2020
Or
‘ Transition Report Pursuant to Section 13 or 15(d)of the Securities Exchange Act of 1934For the transition period from to
Commission File Number 0-10436
L.B. FOSTER COMPANY(Exact name of registrant as specified in its charter)
Pennsylvania 25-1324733(State of Incorporation) (I.R.S. Employer Identification No.)
415 Holiday Drive, Suite 100, Pittsburgh, Pennsylvania 15220(Address of principal executive offices) (Zip Code)
Registrant’s telephone number, including area code:(412) 928-3400
Securities registered pursuant to Section 12(b) of the Act:Title of Each Class Trading Symbol(s) Name of Each Exchange On Which Registered
Common Stock, Par Value $0.01 FSTR NASDAQ Global Select Market
Securities registered pursuant to Section 12(g) of the Act:None
Indicate by check mark if the registrant is a well-known seasoned issuer, as defined in Rule 405 of the SecuritiesAct. ‘ Yes È No
Indicate by check mark if the registrant is not required to file reports pursuant to Section 13 or Section 15(d) of theAct. ‘ Yes È No
Indicate by check mark whether the registrant (1) has filed all reports required to be filed by Section 13 or 15(d) of the SecuritiesExchange Act of 1934 during the preceding 12 months (or for such shorter period that the registrant was required to file such reports),and (2) has been subject to such filing requirements for the past 90 days. È Yes ‘ No
Indicate by check mark whether the registrant has submitted electronically every Interactive Data File required to be submittedpursuant to Rule 405 of Regulation S-T (§ 232.405 of this chapter) during the preceding 12 months (or for such shorter period that theregistrant was required to submit such files). È Yes ‘ No
Indicate by check mark whether the registrant is a large accelerated filer, an accelerated filer, a non-accelerated filer, a smallerreporting company, or an emerging growth company. See the definitions of “large accelerated filer,” “accelerated filer,” “smallerreporting company,”and “emerging growth company” in Rule 12b-2 of the Exchange Act.
Large accelerated filer ‘ Accelerated filer È Non-accelerated filer ‘ Smaller reporting company ‘ Emerging growth company ‘
If an emerging growth company, indicate by check mark if the registrant has elected not to use the extended transition period forcomplying with any new or revised financial accounting standards provided pursuant to Section 13(a) of the Exchange Act. ‘
Indicate by check mark whether the registrant has filed a report on and attestation to its management’s assessment of the effec-tiveness of its internal control over financial reporting under Section 404(b) of the Sarbanes-Oxley Act (15 U.S.C. 7262(b)) by theregistered public accounting firm that prepared or issued its audit report. È
Indicate by check mark whether the registrant is a shell company (as defined in Rule 12b-2 of the Act). ‘ Yes È No
The aggregate market value of the voting and non-voting common equity held by non-affiliates computed by reference to theprice at which the common equity was last sold, or the average bid and asked price of such common equity, as of the last business dayof the registrant’s most recently completed second fiscal quarter was $126,070,586.
As of February 24, 2021, there were 10,738,899 shares of the registrant’s common stock, par value $0.01 per share, outstanding.
Documents Incorporated by Reference:
Portions of the Definitive Proxy Statement for the 2021 Annual Meeting of Shareholders (“2021 Proxy Statement”) areincorporated by reference in Items 10, 11, 12, 13 and 14 of Part III of this Form 10-K. The 2021 Proxy Statement will be filed withthe U.S. Securities and Exchange Commission within 120 days after the end of the fiscal year to which this Form 10-K relates.
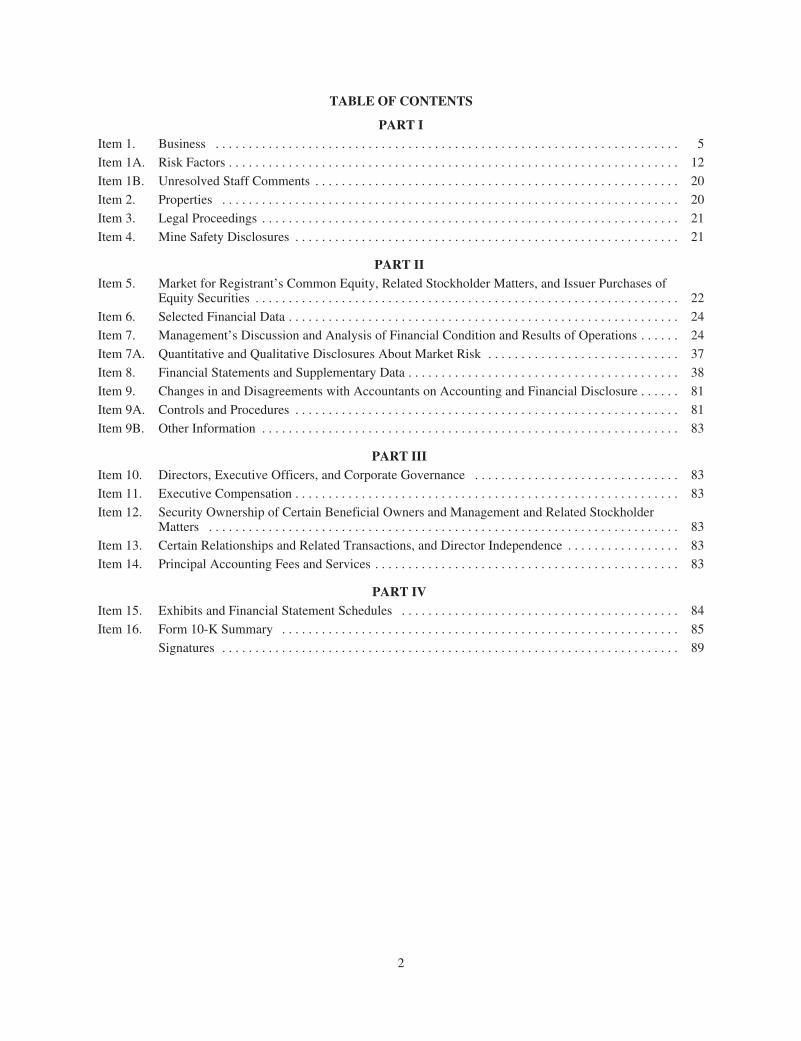
TABLE OF CONTENTS
PART IItem 1. Business . . . . . . . . . . . . . . . . . . . . . . . . . . . . . . . . . . . . . . . . . . . . . . . . . . . . . . . . . . . . . . . . . . . . . . 5
Item 1A. Risk Factors . . . . . . . . . . . . . . . . . . . . . . . . . . . . . . . . . . . . . . . . . . . . . . . . . . . . . . . . . . . . . . . . . . . . 12
Item 1B. Unresolved Staff Comments . . . . . . . . . . . . . . . . . . . . . . . . . . . . . . . . . . . . . . . . . . . . . . . . . . . . . . . 20
Item 2. Properties . . . . . . . . . . . . . . . . . . . . . . . . . . . . . . . . . . . . . . . . . . . . . . . . . . . . . . . . . . . . . . . . . . . . . 20
Item 3. Legal Proceedings . . . . . . . . . . . . . . . . . . . . . . . . . . . . . . . . . . . . . . . . . . . . . . . . . . . . . . . . . . . . . . . 21
Item 4. Mine Safety Disclosures . . . . . . . . . . . . . . . . . . . . . . . . . . . . . . . . . . . . . . . . . . . . . . . . . . . . . . . . . . 21
PART IIItem 5. Market for Registrant’s Common Equity, Related Stockholder Matters, and Issuer Purchases of
Equity Securities . . . . . . . . . . . . . . . . . . . . . . . . . . . . . . . . . . . . . . . . . . . . . . . . . . . . . . . . . . . . . . . . 22
Item 6. Selected Financial Data . . . . . . . . . . . . . . . . . . . . . . . . . . . . . . . . . . . . . . . . . . . . . . . . . . . . . . . . . . . 24
Item 7. Management’s Discussion and Analysis of Financial Condition and Results of Operations . . . . . . 24
Item 7A. Quantitative and Qualitative Disclosures About Market Risk . . . . . . . . . . . . . . . . . . . . . . . . . . . . . 37
Item 8. Financial Statements and Supplementary Data . . . . . . . . . . . . . . . . . . . . . . . . . . . . . . . . . . . . . . . . . 38
Item 9. Changes in and Disagreements with Accountants on Accounting and Financial Disclosure . . . . . . 81
Item 9A. Controls and Procedures . . . . . . . . . . . . . . . . . . . . . . . . . . . . . . . . . . . . . . . . . . . . . . . . . . . . . . . . . . 81
Item 9B. Other Information . . . . . . . . . . . . . . . . . . . . . . . . . . . . . . . . . . . . . . . . . . . . . . . . . . . . . . . . . . . . . . . 83
PART IIIItem 10. Directors, Executive Officers, and Corporate Governance . . . . . . . . . . . . . . . . . . . . . . . . . . . . . . . 83
Item 11. Executive Compensation . . . . . . . . . . . . . . . . . . . . . . . . . . . . . . . . . . . . . . . . . . . . . . . . . . . . . . . . . . 83
Item 12. Security Ownership of Certain Beneficial Owners and Management and Related StockholderMatters . . . . . . . . . . . . . . . . . . . . . . . . . . . . . . . . . . . . . . . . . . . . . . . . . . . . . . . . . . . . . . . . . . . . . . . 83
Item 13. Certain Relationships and Related Transactions, and Director Independence . . . . . . . . . . . . . . . . . 83
Item 14. Principal Accounting Fees and Services . . . . . . . . . . . . . . . . . . . . . . . . . . . . . . . . . . . . . . . . . . . . . . 83
PART IVItem 15. Exhibits and Financial Statement Schedules . . . . . . . . . . . . . . . . . . . . . . . . . . . . . . . . . . . . . . . . . . 84
Item 16. Form 10-K Summary . . . . . . . . . . . . . . . . . . . . . . . . . . . . . . . . . . . . . . . . . . . . . . . . . . . . . . . . . . . . 85
Signatures . . . . . . . . . . . . . . . . . . . . . . . . . . . . . . . . . . . . . . . . . . . . . . . . . . . . . . . . . . . . . . . . . . . . . 89
2

Forward-Looking Statements
This Annual Report on Form 10-K contains “forward-looking” statements within the meaning of Section 21Eof the Securities Exchange Act of 1934, as amended, and Section 27A of the Securities Act of 1933, as amended.Many of the forward-looking statements are located in “Management’s Discussion and Analysis of FinancialCondition and Results of Operations.” Forward-looking statements include any statement that does not directlyrelate to any historical or current fact. Sentences containing words such as “believe,” “intend,” “plan,” “may,”“expect,” “should,” “could,” “anticipate,” “estimate,” “predict,” “project,” or their negatives, or other similarexpressions of a future or forward-looking nature generally should be considered forward-looking statements.Forward-looking statements in this Annual Report on Form 10-K are based on management’s current expectationsand assumptions about future events that involve inherent risks and uncertainties and may concern, among otherthings, L.B. Foster Company’s (the “Company’s”) expectations relating to our strategy, goals, projections, andplans regarding our financial position, liquidity, capital resources, and results of operations and decisionsregarding our strategic growth initiatives, market position, and product development. While the Company considersthese expectations and assumptions to be reasonable, they are inherently subject to significant business, economic,competitive, regulatory, and other risks and uncertainties, most of which are difficult to predict and many of whichare beyond the Company’s control. The Company cautions readers that various factors could cause the actualresults of the Company to differ materially from those indicated by forward-looking statements. Accordingly,investors should not place undue reliance on forward-looking statements as a prediction of actual results. Amongthe factors that could cause the actual results to differ materially from those indicated in the forward-lookingstatements are risks and uncertainties related to: the COVID-19 pandemic, and any future global health crises, andthe related social, regulatory, and economic impacts and the response thereto by the Company, our employees, ourcustomers, and national, state, or local governments; a continued deterioration in the prices of oil and natural gasand the related impact on the upstream and midstream energy markets; a continuation or worsening of the adverseeconomic conditions in the markets we serve, whether as a result of the current COVID-19 pandemic, including itsimpact on travel and demand for oil and gas, the continued deterioration in the prices for oil and gas, governmentaltravel restrictions, project delays, and budget shortfalls, or otherwise; volatility in the global capital markets,including interest rate fluctuations, which could adversely affect our ability to access the capital markets on termsthat are favorable to us; restrictions on our ability to draw on our credit agreement, including as a result of anyfuture inability to comply with restrictive covenants contained therein; a continuing decrease in freight or transitrail traffic, including as a result of the COVID-19 pandemic; environmental matters, including any costs associatedwith any remediation and monitoring; the risk of doing business in international markets, including compliancewith anti-corruption and bribery laws, foreign currency fluctuations and inflation, and trade restrictions orembargoes; our ability to effectuate our strategy, including cost reduction initiatives, and our ability to effectivelyintegrate acquired businesses or to divest businesses, such as the recent disposition of the IOS Test and InspectionServices business and acquisition of LarKen Precast, LLC and to realize anticipated benefits; costs of and impactsassociated with shareholder activism; continued customer restrictions regarding the on-site presence of third partyproviders due to the COVID-19 pandemic; the timeliness and availability of materials from our major suppliers,including any continuation or worsening of the disruptions in the supply chain experienced as a result of theCOVID-19 pandemic, as well as the impact on our access to supplies of customer preferences as to the origin ofsuch supplies, such as customers’ concerns about conflict minerals; labor disputes; cyber-security risks such asdata security breaches, malware, ransomware, “hacking,” and identity theft, which could disrupt our business andmay result in misuse or misappropriation of confidential or proprietary information, and could result in thedisruption or damage to our systems, increased costs and losses, or an adverse effect to our reputation; thecontinuing effective implementation of an enterprise resource planning system; changes in current accountingestimates and their ultimate outcomes; the adequacy of internal and external sources of funds to meet financingneeds, including our ability to negotiate any additional necessary amendments to our credit agreement or the termsof any new credit agreement, and reforms regarding the use of LIBOR as a benchmark for establishing applicableinterest rates; the Company’s ability to manage its working capital requirements and indebtedness; domestic andinternational taxes, including estimates that may impact taxes; domestic and foreign government regulations,including tariffs; economic conditions and regulatory changes caused by the United Kingdom’s exit from theEuropean Union; a lack of state or federal funding for new infrastructure projects; an increase in manufacturing ormaterial costs; the loss of future revenues from current customers; and risks inherent in litigation and the outcome
3

of litigation and product warranty claims. Should one or more of these risks or uncertainties materialize, or shouldthe assumptions underlying the forward-looking statements prove incorrect, actual outcomes could vary materiallyfrom those indicated. Significant risks and uncertainties that may affect the operations, performance, and results ofthe Company’s business and forward-looking statements include, but are not limited to, those set forth under Item1A, “Risk Factors,” and elsewhere in this Annual Report on Form 10-K and our other periodic filings with theSecurities and Exchange Commission.
The forward-looking statements in this report are made as of the date of this report and we assume noobligation to update or revise any forward-looking statement, whether as a result of new information, futuredevelopments, or otherwise, except as required by the federal securities laws.
4

PART I
(Dollars in thousands, except share data unless otherwise noted)
ITEM 1. BUSINESS
Summary Description of Businesses
Formed in 1902, L.B. Foster Company is a Pennsylvania corporation with its principal office in Pittsburgh,PA. L.B. Foster Company provides products and services for the rail industry and solutions to support criticalinfrastructure projects. The Company’s innovative engineering and product development solutions inspire thesafety, reliability, and performance of its customer’s challenging requirements. The Company maintainslocations in North America, Europe, and Asia. As used herein, “L.B. Foster,” the “Company,” “we,” “us,” and“our” or similar references refer collectively to L.B. Foster Company and its subsidiaries, unless the contextindicates otherwise.
For the fourth quarter and year ended December 31, 2020, the Company realigned its operating segmentsunder two senior business leaders to provide clear line of sight around the opportunities for growth and assetleverage in each of the two segments. L.B. Foster’s business portfolio and external business segment reportingstructure will be consolidated into two primary segments: Rail Technologies and Services and InfrastructureSolutions. The Rail Technologies and Services segment will consist of businesses previously positioned withinthe Rail Products and Services segment. The Infrastructure Solutions segment will combine all businessespreviously within the legacy Construction Products and Tubular and Energy Services segments. Each segmentwill report to a business line executive that will have responsibility for the segment’s performance.
The following table shows the net sales generated by each business segment as a percentage of total netsales for the years ended December 31, 2020, 2019, and 2018:
Percentage of Net Sales2020 2019 2018
Rail Technologies and Services . . . . . . . . . . . . . . . . . . . . . . . . . . . . . . 56% 52% 55%
Infrastructure Solutions . . . . . . . . . . . . . . . . . . . . . . . . . . . . . . . . . . . . . 44 48 45
100% 100% 100%
Financial information concerning these segments is set forth in Part II, Item 8, Financial Statements andSupplementary Data, Note 2 to the Consolidated Financial Statements contained in this Annual Report onForm 10-K, which is incorporated by reference into this Item 1.
Rail Technologies and Services
The Company’s Rail Technologies and Services (“Rail”) segment is comprised of several manufacturing,distribution, and service businesses that provide a variety of products, solutions, and services for freight andpassenger railroads and industrial companies throughout the world. The Rail segment has sales officesthroughout North America and Europe, and works on rail projects where it offers products manufactured by theCompany, or sourced from numerous supply chain partners, and also offers aftermarket services. The Railsegment is comprised of the Rail Technologies and Rail Products business units.
Rail Technologies
The Company’s Rail Technologies business unit engineers, manufactures, and fabricates frictionmanagement products and application systems, railroad condition monitoring systems and equipment, wheelimpact load detection systems, wayside data collection and management systems, and also provides aftermarketservices. The Company’s friction management products control the friction at the rail/wheel interface and helpour customers reduce fuel consumption, improve operating efficiencies, extend the life of operating assets suchas rail and wheels, reduce track stresses, and lower the related maintenance and operating costs. Frictionmanagement products include mobile and wayside systems that apply lubricants and liquid or solid frictionmodifiers. In addition, the business unit provides controls, display, and telecommunication solutions for the
5
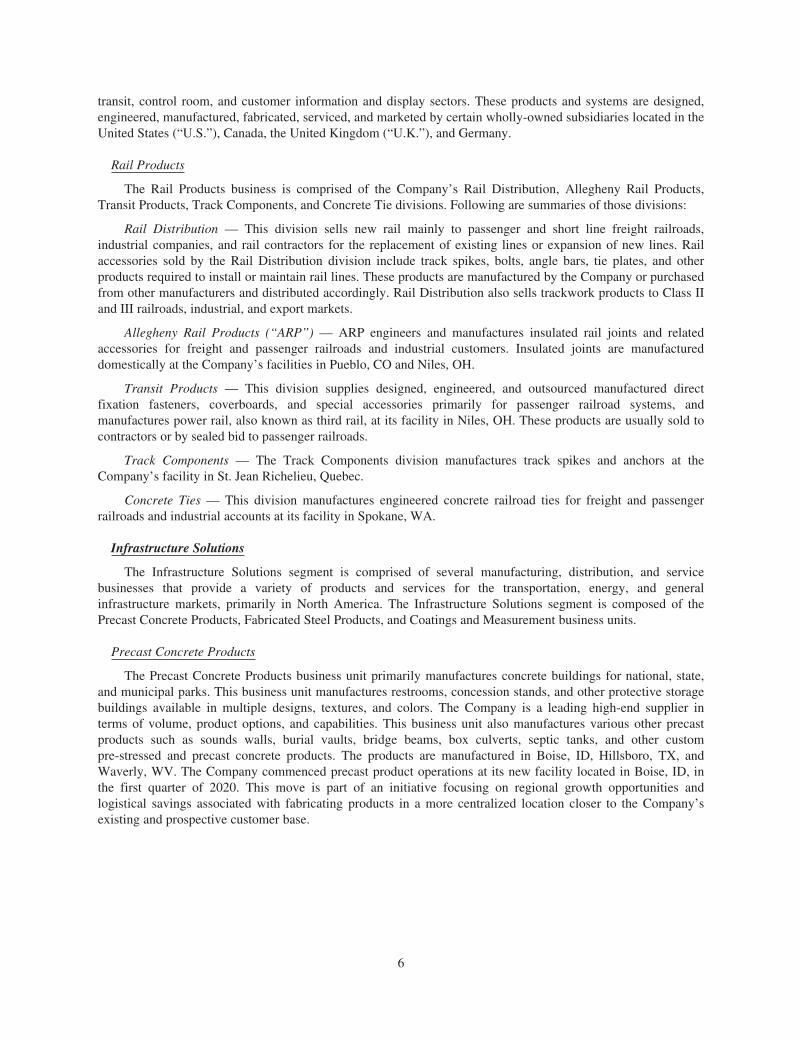
transit, control room, and customer information and display sectors. These products and systems are designed,engineered, manufactured, fabricated, serviced, and marketed by certain wholly-owned subsidiaries located in theUnited States (“U.S.”), Canada, the United Kingdom (“U.K.”), and Germany.
Rail Products
The Rail Products business is comprised of the Company’s Rail Distribution, Allegheny Rail Products,Transit Products, Track Components, and Concrete Tie divisions. Following are summaries of those divisions:
Rail Distribution — This division sells new rail mainly to passenger and short line freight railroads,industrial companies, and rail contractors for the replacement of existing lines or expansion of new lines. Railaccessories sold by the Rail Distribution division include track spikes, bolts, angle bars, tie plates, and otherproducts required to install or maintain rail lines. These products are manufactured by the Company or purchasedfrom other manufacturers and distributed accordingly. Rail Distribution also sells trackwork products to Class IIand III railroads, industrial, and export markets.
Allegheny Rail Products (“ARP”) — ARP engineers and manufactures insulated rail joints and relatedaccessories for freight and passenger railroads and industrial customers. Insulated joints are manufactureddomestically at the Company’s facilities in Pueblo, CO and Niles, OH.
Transit Products — This division supplies designed, engineered, and outsourced manufactured directfixation fasteners, coverboards, and special accessories primarily for passenger railroad systems, andmanufactures power rail, also known as third rail, at its facility in Niles, OH. These products are usually sold tocontractors or by sealed bid to passenger railroads.
Track Components — The Track Components division manufactures track spikes and anchors at theCompany’s facility in St. Jean Richelieu, Quebec.
Concrete Ties — This division manufactures engineered concrete railroad ties for freight and passengerrailroads and industrial accounts at its facility in Spokane, WA.
Infrastructure Solutions
The Infrastructure Solutions segment is comprised of several manufacturing, distribution, and servicebusinesses that provide a variety of products and services for the transportation, energy, and generalinfrastructure markets, primarily in North America. The Infrastructure Solutions segment is composed of thePrecast Concrete Products, Fabricated Steel Products, and Coatings and Measurement business units.
Precast Concrete Products
The Precast Concrete Products business unit primarily manufactures concrete buildings for national, state,and municipal parks. This business unit manufactures restrooms, concession stands, and other protective storagebuildings available in multiple designs, textures, and colors. The Company is a leading high-end supplier interms of volume, product options, and capabilities. This business unit also manufactures various other precastproducts such as sounds walls, burial vaults, bridge beams, box culverts, septic tanks, and other custompre-stressed and precast concrete products. The products are manufactured in Boise, ID, Hillsboro, TX, andWaverly, WV. The Company commenced precast product operations at its new facility located in Boise, ID, inthe first quarter of 2020. This move is part of an initiative focusing on regional growth opportunities andlogistical savings associated with fabricating products in a more centralized location closer to the Company’sexisting and prospective customer base.
6
Fabricated Steel Products
The Fabricated Steel Products business unit provides fabricated bridge products and piling to infrastructureend markets. The Fabricated Steel Products business unit, via a sales force deployed throughout the UnitedStates, markets and sells products both domestically and internationally. Following are summaries of thoseproduct offerings:
Fabricated Bridge Products — The fabricated bridge products facility in Bedford, PA manufactures anumber of fabricated steel and aluminum products primarily for the highway, bridge, and transit industries,including concrete reinforced steel grid deck, open steel grid deck, aluminum bridge railing, and stay-in-placesteel bridge forms.
Piling Products — Sheet piling products are interlocking structural steel sections that are generally used toprovide lateral support at construction sites. Bearing piling products are steel H-beam sections which are driveninto the ground for support of structures such as bridge piers and high-rise buildings. Piling is often used in waterand land applications, including cellular cofferdams and OPEN CELL® structures in inland river systems andports.
Piling products are sourced from various manufacturers and either sold or rented to project owners andcontractors. This business unit offers its customers various types and dimensions of structural beam piling, sheetpiling, and pipe piling. The Company is a preferred distributor of domestic PZC steel sheet piling for its primarysupplier.
Coatings and Measurement
The Coatings and Measurement business unit provides protective coating services, threaded pipe, andprecision measurement products to infrastructure end markets. The following is a summary of those product andservice offerings:
Protective Coatings — There are two pipeline services locations that make up our Protective Coatingsdivision. Our Birmingham, AL facility coats the outside and inside diameter of pipe primarily for oil and gastransmission pipelines. This location partners with its primary customer, a pipe manufacturer, to market fusionbonded epoxy coatings, abrasion resistant coatings, and internal linings for a wide variety of pipe diameters foruse in pipeline projects throughout North America.
The second location is located in Willis, TX. The Willis, TX facility applies specialty outside and insidediameter coatings for a wide variety of pipe diameters for oil and gas transmission, mining, and waste waterpipelines, as well as provides custom coatings for specialty pipe fittings and connections.
Threaded Products — The Company’s Magnolia, TX facility cuts, threads, and paints pipe primarily forwater well applications for the agriculture industry and municipal water authorities and, to a lesser extent,threading services for the Oil Country Tubular Goods markets.
Precision Measurement Products and Systems — The Company manufactures and provides turnkeysolutions for metering and injection systems for the oil, and, to a lesser extent, gas industry. The Willis, TXlocation operates a fabrication plant that builds metering systems for custody transfer applications, includingcrude oil and other petroleum-based products. These systems are used at well sites, pipelines, refineries, chemicalplants, and loading/unloading facilities. The Willis,TX location also manufactures and installs additive and dyeinjection systems. These systems are used to inject performance additives and/or dyes into petroleum products.
Marketing and Competition
L.B. Foster Company generally markets its Rail Technologies and Services directly in all major industrialareas of the United States, Canada, and Europe. Infrastructure Solutions is primarily marketed domestically. TheCompany employs a sales force of approximately 89 people that is supplemented with a network of agents acrossEurope, South America, and Asia to reach current customers and cultivate potential customers in these areas. Forthe years ended 2020, 2019, and 2018, approximately 20%, 20%, and 24%, respectively, of the Company’s totalsales were outside the United States.
7

The major markets for the Company’s products are highly competitive. Product availability, quality, service,and price are principal factors of competition within each of these markets. No other company provides the sameproduct mix to the various markets the Company serves. However, there are one or more companies that competewith the Company in each product line. Therefore, the Company faces significant competition from differentgroups of companies.
Raw Materials and Supplies
Most of the Company’s products are purchased in the form of finished or semi-finished products. TheCompany purchases the majority of its supplies from domestic and foreign steel producers. Generally, theCompany has a number of vendor options. However, the Company has an arrangement with a steel mill todistribute steel sheet piling in North America. Should sheet piling from its present supplier not be available forany reason, the Company risks not being able to provide such product to its customers.
The Company’s purchases from foreign suppliers are subject to foreign currency exchange rate changes andthe usual risks associated with changes in international conditions, as well as United States and international lawsthat could impose import restrictions on selected classes of products and for anti-dumping duties if products aresold in the United States at prices that are below specified prices.
Backlog
The Company’s backlog represents the sales price of received customer purchase orders or contracts inwhich the performance obligations have not been met, and therefore are precluded from revenue recognition.Although the Company believes that the orders included in backlog are firm, customers may cancel or changetheir orders with limited advance notice; however, these instances are rare. Backlog should not be considered areliable indicator of the Company’s ability to achieve any particular level of revenue or financial performance.The backlog as of December 31, 2020 and 2019 by business segment was as follows:
December 31,2020 2019
Rail Technologies and Services . . . . . . . . . . . . . . . . . . . . . . . . . . . . . . . . . . . . . $121,231 $103,694
Infrastructure Solutions . . . . . . . . . . . . . . . . . . . . . . . . . . . . . . . . . . . . . . . . . . . . 127,001 125,338
Total . . . . . . . . . . . . . . . . . . . . . . . . . . . . . . . . . . . . . . . . . . . . . . . . . . . . . . . . $248,232 $229,032
Approximately 13.4% of the December 31, 2020 backlog was related to projects that is expected to extendbeyond 2021.
Patents and Trademarks
The Company owns a number of domestic and international patents and trademarks, primarily related to itsRail Technologies products. The Company’s business segments are not dependent upon any individual patents orrelated group of patents, nor any individual licenses or distribution rights. The Company believes that, in theaggregate, the rights under its patents, trademarks, and licenses are generally important to its operations, butconsiders neither any individual patent, nor any licensing or distribution rights related to a specific process orproduct, to be of material importance in relation to its total business.
Environmental Disclosures
Information regarding environmental matters is included in Part II, Item 8, Financial Statements andSupplementary Data, Note 18 to the Consolidated Financial Statements included in this Annual Report onForm 10-K, which is incorporated by reference into this Item 1.
Human Capital Management
People are the heart of L.B. Foster’s success. The Company strives to create and promote a culture thatmakes L.B. Foster a great place to work. The Company seeks to attract and retain employees that embody anddemonstrate its values, which are summarized in our SPIRIT model, focusing on Safety, People, Integrity,
8

Respect, Innovation, and Teamwork. The Company uses these six principles to guide its employees every day.The expectation of all employees, at every level of the organization, is to execute our business strategy in amanner that adheres to these core values and demonstrates commitment to the L.B. Foster SPIRIT.
Diversity, Equity, and Inclusion
The Company is dedicated to the principle of equal employment opportunity and the provision of aworkplace free from discrimination and harassment in accordance with all applicable federal, state, and locallaws and regulations. This statement and accompanying practices, which pertain to all persons involved inCompany operations, prohibit unlawful discrimination by any employee and apply to all terms, conditions, andprivileges of employment. Additionally, the Company will also make reasonable accommodations for individualswith known disabilities who are otherwise qualified to perform a job. The Company is committed to employingand advancing in employment qualified women, minorities, individuals with disabilities, covered veterans, andother classes at all levels of employment. The Company has implemented initiatives to advance diversity andinclusion, including changes to recruitment, onboarding, and employee training, and has developed the Sparkinitiative, which is an employee resource group targeting all employees interested in furthering the mission ofempowerment and professional growth of women in the workplace.
Health and Safety
L.B. Foster promotes a culture of environmental, health, safety, and sustainability (“EHSS”) excellence thatstrives to protect the environment as well as the safety and health of our employees, business, customers, andcommunities where we operate. The Company is committed to meet or exceed the requirements of all applicableenvironmental, health and safety (“EHS”) regulations as the Company raises its standards of excellence. Amongits core values are safety, teamwork, and innovation, which the Company will rely on to create more advancedsolutions around sustainability. The Company emphasizes continual improvement in its EHSS performance,particularly as it applies to preventing pollution and reducing the environmental impact of its operations whilemaximizing opportunities for environmental and social benefits. The Company continually strives to developbest practices in EHS management based on international standards such as ISO 14001:2015 and ISO45001:2018. The Company has 11 locations/ businesses throughout North America and Europe thatEnvironmental Management Systems has independently assessed and are compliant with the requirements of ISO14001:2015 and ISO 45001:2018.
Leadership and Talent Management
The Company’s executive leadership team sets the Company’s strategic direction and is dedicated tosustainable profitable growth through its commitment to providing quality products and services to its customersand treating our customers, suppliers, and employees as partners. L.B. Foster cultivates and empowers talentthrough performance management, career planning/development, and succession planning, creating anenvironment for people to be successful in achieving our strategic plan through the following areas:
Talent Acquisition and Onboarding
The process of finding and hiring the best-qualified candidate (from within or outside of the organization)for a job opening, in a timely and cost-effective manner. The recruitment process includes analyzing therequirements of a job, meeting with hiring management to determine the appropriate qualifications andexperience for the position, attracting qualified candidates to that job, providing opportunities to advancediversity in the workforce, screening and selecting applicants, hiring, and ultimately integrating the newemployee to the organization.
Development Planning
The proactive planning and implementation of action steps towards our employees’ career goals.Developmental experiences can consist of training, developing, mentoring, and coaching.
9

Succession Planning
A process for identifying and developing employees with the potential to fill key business leadershippositions within the Company are key to future success. Succession planning increases the availability ofexperienced and capable employees that are prepared to assume these critical roles as they become available.
Performance Management
An ongoing process of communication between a supervisor and an employee that occurs throughout theyear, in support of accomplishing the strategic objectives of the organization.
Workforce
As of December 31, 2020, the Company had approximately 1,130 employees, 774 located within the UnitedStates, 71 within Canada, and 285 in Europe. There were 624 hourly production workers and 506 salariedemployees. Of the hourly production workers, approximately 92 were represented by unions.
Three collective bargaining agreements covering approximately 34, 29, and 29 employees are scheduled toexpire in March 2025, August 2021, and September 2021, respectively. As a result of the Company’s relocationof the concrete products operations from Spokane, WA to Boise, ID, a separation agreement was executed withthe collective bargaining unit representing the employees affected by this relocation. This agreement had noimpact on the employees under the same collective bargaining agreement at the concrete tie operation inSpokane, WA. The Company has not suffered any major work stoppages during the past five years and considersits relations with its employees to be satisfactory.
All of the Company’s hourly paid employees are covered by one of the Company’s defined benefit plans ordefined contribution plans. All of the Company’s salaried employees are similarly covered by one of theCompany’s defined benefit or defined contribution plans.
Code of Ethics
L.B. Foster Company has a legal and ethical conduct policy applicable to all directors and employees,including its Chief Executive Officer, Chief Financial Officer, and Principal Accounting Officer. This policy isposted on the Company’s website, www.lbfoster.com. The Company intends to satisfy the disclosure requirementregarding certain amendments to, or waivers from, provisions of its policy by posting such information on theCompany’s website. In addition, the Company’s ethics hotline can also be used by employees and others for theanonymous communication of concerns about financial controls, human resource concerns, and other reportingmatters.
Available Information
The Company makes certain filings with the Securities and Exchange Commission (“SEC”), including itsAnnual Report on Form 10-K, Quarterly Reports on Form 10-Q, Current Reports on Form 8-K, and allamendments and exhibits to those reports, available free of charge through its website, www.lbfoster.com, assoon as reasonably practicable after they are filed with the SEC. The SEC maintains an internet site that containsreports, proxy and information statements, and other information regarding issuers that file electronically withthe SEC. These filings, including the Company’s filings, are available at the SEC’s internet site at www.sec.gov.The Company’s press releases and recent investor presentations are also available on its website.
10
Executive Officers of the Registrant
Information concerning the executive officers of the Company is set forth below:
Name Age Position
Robert P. Bauer . . . . . . . . . . . . . . . . . . . . . . . . . . 62 President and Chief Executive Officer
Patrick J. Guinee . . . . . . . . . . . . . . . . . . . . . . . . . 51 Senior Vice President, General Counsel, andSecretary
John F. Kasel . . . . . . . . . . . . . . . . . . . . . . . . . . . . 55 Senior Vice President and Chief OperatingOfficer
Brian H. Kelly . . . . . . . . . . . . . . . . . . . . . . . . . . . 61 Senior Vice President — Human Resourcesand Administration
James M. Kempton . . . . . . . . . . . . . . . . . . . . . . . 46 Corporate Controller and PrincipalAccounting Officer
Gregory W. Lippard . . . . . . . . . . . . . . . . . . . . . . 52 Senior Vice President — Rail Technologiesand Services
William M. Thalman . . . . . . . . . . . . . . . . . . . . . . 54 Senior Vice President and Chief FinancialOfficer
William F. Treacy . . . . . . . . . . . . . . . . . . . . . . . . 61 Senior Vice President — InfrastructureSolutions
Mr. Bauer was elected President and Chief Executive Officer upon joining the Company in 2012. Prior tojoining the Company, beginning in 2011, Mr. Bauer served as President of the Refrigeration Division of theClimate Technologies business of Emerson Electric Company, a diversified global manufacturing and technologycompany. From 2002 until 2011, Mr. Bauer served as President of Emerson Network Power’s Liebert Division.
Mr. Guinee serves as Senior Vice President, General Counsel, and Secretary and was elected Vice President,General Counsel, and Secretary in 2014. Prior to joining the Company, Mr. Guinee served as Vice President —Securities and Corporate and Assistant Secretary at Education Management Corporation from 2013 to early2014, and was employed by H. J. Heinz Company from 1997 to 2013, last serving as Vice President —Corporate Governance and Securities and Assistant Secretary.
Mr. Kasel was elected Senior Vice President and Chief Operating Officer in December 2019, havingpreviously served as Senior Vice President — Rail and Construction since 2017, Senior Vice President — RailProducts and Services from 2012 to 2017, Senior Vice President — Operations and Manufacturing from 2005 to2012, and Vice President — Operations and Manufacturing from 2003 to 2005. Mr. Kasel served as VicePresident of Operations for Mammoth, Inc., a Nortek company from 2000 to 2003.
Mr. Kelly serves as Senior Vice President — Human Resources and Administration and was elected VicePresident — Human Resources and Administration in 2012, having previously served as Vice President, HumanResources since 2006. Prior to joining the Company, Mr. Kelly headed Human Resources for 84 LumberCompany from 2004. Previously, he served as a Director of Human Resources for American Greetings Corp.from 1994 to 2004.
Mr. Kempton was appointed Corporate Controller and Principal Accounting Officer of the Company inFebruary 2020. Prior to joining the Company, Mr. Kempton served as Executive Vice President and ChiefFinancial Officer of Caliburn International from August 2018 to January 2020. He was previously employed byMichael Baker International from October 2013 to August 2018, last serving as Executive Vice President andChief Financial Officer. From January 2007 to October 2013, Mr. Kempton was employed by Michael BakerCorporation most recently as Vice President, Corporate Controller, and Treasurer from April 2009 to October2013. Prior to Michael Baker, he worked at Ernst & Young, LLP from October 1997 to January 2007, as anengagement senior manager.
Mr. Lippard serves as Senior Vice President — Rail Technologies and Services, and was previously VicePresident — Rail Technologies and Services from November 2020 to February 2021, Vice President — Railfrom January 2020 to November 2020 and Vice President — Rail Products from September 2017 to December2019. From 2000 to 2017, he served as Vice President — Rail Product Sales. Prior to re-joining the Company in
11
2000, Mr. Lippard served as Vice President — International Trading for Tube City, Inc. from 1998. Mr. Lippardserved in various other capacities with the Company after his initial employment in 1991.
Mr. Thalman was appointed Senior Vice President and Chief Financial Officer of the Company in February2021. Prior to joining the Company, Mr. Thalman was employed by Kennametal, Inc., most recently serving asVice President — Advanced Material Solutions since 2016 and Vice President — Transformation Office since2019, prior to which he served in roles of increasing responsibility, including: Vice President — FinanceInfrastructure, Director of Finance — M&A and Planning, Director of Finance –Kennametal Europe, Director ofFinance — MSSG Americas, Assistant Corporate Controller, and Director of Financial Reporting. Prior toKennametal, Mr. Thalman was employed by Wesco, Inc., from 2002 to 2004 as Corporate Controller, and by TheCarbide/Graphite Group, Inc. as Vice President and Treasurer and Manager of External Reporting and InvestorRelations from 1993 to 2002. He also worked in public accounting at Coopers & Lybrand (nowPriceWaterhouseCoopers) from 1988 to 1993.
Mr. Treacy serves as Senior Vice President — Infrastructure Solutions, and was previously Vice President —Infrastructure Solutions from November 2020 to February 2021, Vice President — Tubular and Energy Servicesfrom September 2017 to November 2020. Mr. Treacy previously served as Director of Technology and GeneralManager, Transit Products within the Rail Products and Services segment since 2013. Prior to joining the Company,Mr. Treacy served as Interim President of Tuthill Vacuum and Blower Systems from 2012 to 2013. Mr. Treacypreviously served as General Manager, Crane Vending Solutions for Crane Co. from 2009 to 2011 and wasemployed by Parker Hannifin from 2000 to 2009, last serving as Vice President of Operations Development.
Officers are elected annually at the organizational meeting of the Board of Directors following the annualmeeting of stockholders.
ITEM 1A. RISK FACTORS
Risks and Uncertainties
We operate in a changing environment that involves numerous known and unknown risks and uncertaintiesthat could have a material and adverse effect on our business, financial condition, and results of operations. Thefollowing risks highlight what we believe to be the more material factors that have affected us and could affect usin the future. We have grouped the risk factors into six categories for ease of reading, and without any reflectionon the importance of, or likelihood of, any particular category. We may also be affected by unknown risks orrisks that we currently believe are immaterial. If any one or more such events actually occur, our business,financial condition, and results of operations could be materially and adversely affected. One should carefullyconsider the following factors and other information contained in this Annual Report on Form 10-K and anyother risks discussed in our other periodic filings with the SEC before deciding to invest in our common stock.
COVID-19 Risks
The COVID-19 pandemic could continue to adversely affect our business.
The COVID-19 pandemic is adversely affecting, and is expected to continue to adversely affect, ouroperations and supply chains, and we have experienced and expect to continue to experience unpredictablereductions in demand for certain of our products and services. If we do not successfully manage our supply chainor identify new sources of supplies, we may be unable to satisfy customer orders, which could harm ourreputation and customer relationships and materially adversely affect our business, financial condition, andoperating results. While COVID-19 has adversely affected each of the markets we serve, the impact on theupstream and midstream energy markets has been particularly adverse, and has contributed to deteriorating pricesof oil and natural gas, weakened demand, and reduced customer spending. We expect these adverse marketconditions, particularly in the oil and gas markets, to continue, noting that in 2020, the Company exited itsupstream Test and Inspection Services business, reducing its overall exposure to oil and gas market volatility, butits Coatings and Measurement businesses remain. In the rail, transit, friction management, and fabricated steelproducts businesses, governmental stay-at-home and work-from-home orders both in the U.S. and globally,particularly in the U.K., have resulted in reduced traffic and demand for our products and services, and manypublic works projects have been deferred or delayed as a result of governmental pandemic mitigation efforts,
12

adversely impacting our businesses. While the majority of our employees have generally been permitted tocontinue to work because our businesses are regarded as essential, U.S. and non-domestic governmentalpandemic mitigation measures such as stay-at-home orders have slowed travel and movement of goodsthroughout the world, contributing to reduction in demand for our products and services. We expect that theseadverse impacts will continue but we are unable to predict the extent, nature, or duration of the impacts on ourresults of operations and financial condition at this time.
Business and Operational Risks
Our inability to successfully manage acquisitions, divestitures, and other significant transactions couldharm our financial results, business, and prospects.
As part of our business strategy, we acquire or divest businesses or assets, enter into strategic alliances andjoint ventures, or make investments to realize anticipated benefits, actions which involve a number of inherentrisks and uncertainties. Material acquisitions, dispositions, and other strategic transactions involve numerousrisks, including, but not limited to:
‰ we may not be able to identify suitable acquisition candidates, or we may not be able to dispose of assets,at prices we consider attractive;
‰ we may not be able to compete successfully for identified acquisition candidates, complete future acquis-itions or accurately estimate the financial effect of acquisitions on our business;
‰ future acquisitions may require us to spend significant cash and incur additional debt, resulting in addi-tional leverage;
‰ we may have difficulty retaining an acquired company’s key employees or clients;
‰ we may not be able to realize the operating efficiencies, synergies, costs savings, or other benefitsexpected;
‰ we may have difficulty integrating acquired businesses, resulting in unforeseen difficulties, such asincompatible accounting, information management or other control systems, or the need to significantlyupdate and improve the acquired business’s systems and internal controls;
‰ we may assume potential liabilities for actions of the target before the acquisition, including as a result ofa failure to comply with applicable laws;
‰ we may be subject to material indemnification obligations related to any assets that we dispose;
‰ acquisitions or dispositions may disrupt our business or divert our management from otherresponsibilities; and
‰ as a result of an acquisition, we may need to record write-downs from future impairments of intangibleassets, which could reduce our future reported earnings.
If these factors limit our ability to integrate the operations of our acquisitions or to execute other strategictransactions successfully or on a timely basis, we may not meet our expectations for future results of operations.In addition, our growth and operating strategies for businesses we acquire may be different from the strategiesthat such target businesses currently are pursuing. If our strategies are not the proper strategies for a company weacquire or with which we partner, it could have a material adverse effect on our business, financial condition, andresults of operations. Further, there can be no assurance that we will be able to maintain or enhance theprofitability of any acquired business or consolidate the operations of any acquired business to achieve costsavings.
In addition, there may be liabilities that we fail, or are unable, to discover in the course of performing duediligence investigations on each company or business that we have already acquired or disposed of or mayacquire or dispose of in the future. Such liabilities could include those arising from employee benefitscontribution obligations of a prior owner or non-compliance with, or liability pursuant to, applicable federal,state, or local environmental requirements by us or by prior owners for which we, as a successor or predecessorowner, may be responsible. In addition, there may be additional costs relating to acquisitions and dispositionsincluding,
13
but not limited to, possible purchase price adjustments. There can be no assurance that rights to indemnificationby sellers of assets to us, even if obtained, will be enforceable, collectible or sufficient in amount, scope orduration to fully offset the possible liabilities associated with the business or property acquired. Any suchliabilities, individually or in the aggregate, could have a material adverse effect on our business. We can give noassurances that the opportunities will be consummated or that financing will be available. We may not be able toachieve the synergies and other benefits we expect from strategic transactions as successfully or as rapidly asprojected, if at all.
Prolonged negative economic conditions, depressed energy prices, and other unfavorable changes in U.S.,global, or regional economic and market conditions could adversely affect our business.
We could be adversely impacted by prolonged negative economic conditions affecting either our suppliersor customers, as well as the capital markets. Negative changes in government spending may result in delayed orpermanent deferrals of existing or potential projects. No assurances can be given that we will be able tosuccessfully mitigate various prolonged uncertainties, including materials cost variability, delayed or reducedcustomer orders and payments, and access to available capital resources outside of operations.
In addition, volatile market conditions and depressed energy prices could continue for an extended period,which would negatively affect our business prospects and reduce profitability. Historically, oil and natural gasprices have been volatile and are subject to fluctuations in response to changes in supply and demand, marketuncertainty, a trend toward renewable or alternative energy resources, and a variety of additional factors that arebeyond our control. Sustained declines or significant and frequent fluctuations in the price of oil and natural gasmay have a material and adverse effect on our operations and financial condition.
Our ability to maintain or improve our profitability could be adversely impacted by cost pressures.
Our profitability is dependent upon the efficient use of our resources. Rising inflation, labor costs, labordisruptions, and other increases in costs due to tariffs or other reasons in the geographic areas in which weoperate could have a significant adverse impact on our profitability and results of operations.
Our success is in part dependent on the accuracy and proper utilization of our management informationand communications systems.
We are currently working through an enterprise resource planning (“ERP”) system transition. Certaindivisions of our Company migrated into the new ERP system during 2016, additional divisions have sincemigrated, including during 2020, and certain other divisions may be transitioned during 2021 and in subsequentyears. The system implementation is intended to enable us to better meet the information requirements of ourusers, increase our integration efficiencies, and identify additional synergies in the future. The implementation ofour ERP system is complex because of the wide range of processes and systems to be integrated across ourbusiness. Any disruptions, delays, or deficiencies in the design, operation, or implementation of our varioussystems, or in the performance of our systems, particularly any disruptions, delays, or deficiencies that impactour operations, could adversely affect our ability to effectively run and manage our business, including ourability to receive, process, ship, and bill for orders in a timely manner or our ability to properly manage ourinventory or accurately present our inventory availability or pricing. Project delays, business interruptions, orloss of expected benefits could have a material and adverse effect on our business, financial condition, or resultsof operations.
We are subject to cybersecurity risks and may incur increasing costs in an effort to minimize those risks.
Our business employs systems and websites that allow for the storage and transmission of proprietary orconfidential information regarding our customers, employees, job applicants, and other parties, includingfinancial information, intellectual property, and personal identification information. Security breaches and otherdisruptions could compromise our information, expose us to liability, and harm our reputation and business. InOctober 2020, we experienced a cyber-attack on our information technology systems. While the cyber-attackcaused temporary disruption and interference with our operations, we believe that it will not result in a materialadverse effect on our business operations, though our investigation is ongoing. Despite the steps we take to deterand mitigate cybersecurity risks, we may not be successful. We may not have the resources or technical
14

sophistication to anticipate or prevent current or rapidly evolving types of cyber-attacks including data andsecurity breaches, malware, ransomware, hacking, and identity theft. Data and security breaches can also occuras a result of non-technical issues, including an intentional or inadvertent breach by our employees or by personswith whom we have commercial relationships. Federal, state, and foreign government bodies and agencies haveadopted or are considering the adoption of laws and regulations regarding the collection, use, and disclosure ofpersonal information obtained from customers and individuals. The costs of compliance with, and other burdensimposed by, such data privacy laws and regulations, including those of the European Union (“E.U.”) and theU.K. which are, in some respects, more stringent than U.S. standards, could be significant. Any compromise orbreach of our security, including from the cyber-attack that we experienced or any future attack, could result in aviolation of applicable privacy and other laws, legal and financial exposure, negative impacts on our customers’willingness to transact business with us, and a loss of confidence in our security measures, which could have anadverse effect on our results of operations and our reputation.
Certain divisions of our business depend on a small number of suppliers. The loss of any such suppliercould have a material and adverse effect on our business, financial condition, and result of operations.
In our Rail Products business unit, we rely on a limited number of suppliers for key products that we sell toour customers. In addition, our Piling division is predominantly dependent upon one supplier for sheet pilingwhile our Protective Coatings division is predominately dependent on two suppliers of epoxy coating. Asignificant downturn in the business of one or more of these suppliers, a disruption in their manufacturingoperations, an unwillingness to continue to sell to us, or a disruption in the availability of existing and new piling,rail, or coating products and services may adversely impact our financial results.
Fluctuations in the price, quality, and availability of the primary raw materials used in our business couldhave a material and adverse effect on our operations and profitability.
Many of our businesses utilize steel as a significant product component. The steel industry is cyclical andprices and availability are subject to these cycles, as well as to international market forces. We also usesignificant amounts of cement and aggregate in our Concrete Ties and Precast Concrete Products businesses. Noassurances can be given that our financial results would not be adversely affected if prices or availability of thesematerials were to change in a significantly unfavorable manner.
Labor disputes may have a material and adverse effect on our operations and profitability.
Three of our manufacturing facilities are staffed by employees represented by labor unions. Approximately92 employees employed at these facilities are currently working under three separate collective bargainingagreements. Disputes with regard to the terms of these agreements or our potential inability to renegotiateacceptable contracts with these unions could result in, among other things, strikes, work stoppages, slowdowns,or lockouts, which could cause a disruption of our operations and have a material and adverse effect on ourresults of operations, financial condition, and liquidity.
Actions of activist shareholders could be disruptive and potentially costly and the possibility that activistshareholders may seek changes that conflict with our strategic direction could cause uncertainty about thestrategic direction of our business.
In February 2016, the Company entered into an agreement with an activist investor, Legion Partners AssetManagement, LLC and certain of its affiliates (collectively, “Legion Partners”), which had acquired a greaterthan 10% stake in our common stock. This agreement expired by its terms on February 13, 2018, and LegionPartners remains a greater than 5% owner of Company stock.
Activist investors may attempt to effect changes in the Company’s strategic direction and how the Companyis governed, or to acquire control over the Company. Some investors seek to increase short-term shareholdervalue by advocating corporate actions, such as financial restructuring, increased borrowing, special dividends,stock repurchases, or even sales of assets or the entire company. While the Company welcomes varying opinionsfrom all shareholders, activist campaigns that contest or conflict with our strategic direction could have anadverse effect on the Company’s results of operations and financial condition, as responding to proxy contests
15

and other actions by activist shareholders can disrupt our operations, be costly and time-consuming, and divertthe attention of the Company’s board and senior management from the pursuit of business strategies. In addition,perceived uncertainties as to our future direction as a result of changes to the composition of our Board may leadto the perception of a change in the direction of the business, instability or lack of continuity, which may beexploited by our competitors, may cause concern to our current or potential customers, may result in the loss ofpotential business opportunities and may make it more difficult to attract and retain qualified personnel andbusiness partners. These types of actions could cause significant fluctuations in our stock price based ontemporary or speculative market perceptions or other factors that do not necessarily reflect the underlyingfundamentals and prospects of our business.
Our success is highly dependent on the continued service and availability of qualified personnel.
Much of our future success depends on the continued availability and service of key personnel, includingour Chief Executive Officer, the executive team, and other highly skilled employees. Changes in demographics,training requirements, and the availability of qualified personnel could negatively affect our ability to competeand lead to a reduction in our profitability.
We may not foresee or be able to control certain events that could adversely affect our business.
Unexpected events, including fires or explosions at our facilities, natural disasters, such as hurricanes,flooding, and winter storms causing power failures or travel restrictions with respect to our operations, armedconflicts, terrorism, health epidemics or pandemics, such as COVID-19 in 2020 and 2021 and related restrictionson travel, economic or political uncertainties or instability, civil unrest, strikes, unplanned outages, equipmentfailures, failure to meet product specifications, or disruptions in certain areas of our operations, may cause ouroperating costs to increase or otherwise negatively impact our financial performance.
Competitive Risks
Our business operates in highly competitive markets and a failure to react to changing market conditionscould adversely impact our business.
We face strong competition in each of the markets in which we operate. A slow response to competitorpricing actions and new competitor entries into our product lines could negatively impact our overall pricing.Efforts to improve pricing could negatively impact our sales volume in all product categories. We may berequired to invest more heavily to maintain and expand our product offerings. There can be no assurance thatnew product offerings will be widely accepted in the markets we serve. Significant negative developments in anyof these areas could adversely affect our financial results and condition.
If we are unable to protect our intellectual property and prevent its improper use by third parties, our abilityto compete may be harmed.
We possess intellectual property including proprietary rail product formulations and systems and componentdesigns, and we own a number of patents and trademarks under the intellectual property laws of the UnitedStates, Canada, Europe, and other countries in which product sales are possible. While we have not perfectedpatent and trademark protection of our proprietary intellectual property for all products in all countries, weperiodically assess our portfolio to determine the need for pursuing further protection. The decision not to obtainpatent and trademark protection in additional countries may result in other companies copying and marketingproducts that are based upon our proprietary intellectual property. This could impede growth into new marketswhere we do not have such protections and result in a greater supply of similar products in such markets, whichin turn could result in a loss of pricing power and reduced revenue. In some cases, we may decide that the bestway to protect our intellectual property is to retain proprietary information as trade secrets and confidentialinformation rather than to apply for patents, which would involve disclosure of proprietary information to thepublic. Any misappropriation or reverse engineering of our trade secrets could result in competitive harm andmay result in costly and time-consuming litigation. If any of these events should occur, it could materiallyadversely affect our results of operations and financial condition.
16

We are dependent upon key customers.
We could be adversely affected by changes in the business or financial condition of a customer orcustomers. A prolonged decrease in capital spending by our rail customers or decline in sales orders from othercustomers could negatively impact our sales and profitability. No assurances can be given that a significantdownturn in the business or financial condition of a current customer, or customers, or potential litigation with acurrent customer, would not also impact our future results of operations and/or financial condition.
Financial Risks
Our future performance and market value could cause write-downs of long-lived and intangible assets infuture periods.
We are required under U.S. generally accepted accounting principles to review intangible and long-livedassets for impairment when events or changes in circumstances indicate that the carrying value may not berecoverable. In addition, goodwill is required to be tested for impairment at least annually. Factors that maycause the carrying value of our intangible and long-lived assets to not be recoverable include, but are not limitedto, a decline in stock price and resulting market capitalization, a significant decrease in the market value of anasset, or a significant decrease in operating or cash flow projections. No impairments of goodwill or intangibleassets were recorded in 2020, 2019, or 2018. Impairment charges were recorded on long-lived assets related tothe since divested IOS Test and Inspection Services business during 2020.
No assurances can be given that we will not be required to record future significant charges related totangible or intangible asset impairments.
Our indebtedness could materially and adversely affect our business, financial condition, and results ofoperations and prevent us from fulfilling our obligations.
Our indebtedness could materially and adversely affect our business, financial condition, and results ofoperations. For example, it could:
‰ require us to dedicate a substantial portion of our cash flows to service our indebtedness, which wouldreduce the availability of our cash flows to fund working capital, capital expenditures, expansion efforts,or other general corporate purposes;
‰ limit our flexibility in planning for, or reacting to, changes in our business and the industries in which weoperate;
‰ place us at a competitive disadvantage compared to our competitors that have less debt; and
‰ limit, among other things, our ability to borrow additional funds for working capital, capital expenditures,acquisitions, or other general corporate purposes.
Our inability to comply with covenants in place or our inability to make the required principal and interestpayments may cause an event of default, which could have a substantial adverse impact to our business, financialcondition, and results of operations. There is no assurance that refinancings or asset dispositions could beeffected on a timely basis or on satisfactory terms, if at all, particularly if credit market conditions deteriorate.Furthermore, there can be no assurance that refinancings or asset dispositions would be permitted by the terms ofour credit agreements or debt instruments. Our existing credit agreements contain, and any future debtagreements we may enter into may contain, certain financial tests and other covenants that limit our ability toincur indebtedness, acquire other businesses, and any such future debt agreements may impose various otherrestrictions. Our ability to comply with financial tests may be adversely affected by changes in economic orbusiness conditions beyond our control, and these covenants may limit our ability to take advantage of potentialbusiness opportunities as they arise. We cannot be certain that we will be able to comply with the financial testsand other covenants, or, if we fail to do so, that we will be able to obtain waivers or amended terms from ourlenders. An uncured default with respect to one or more of the covenants could result in the amounts outstandingbeing declared immediately due and payable, which may also trigger an obligation to redeem our outstandingdebt securities and repay all other outstanding indebtedness. Any such acceleration of our indebtedness wouldhave a material and adverse effect on our business, financial condition, and results of operations.
17

Certain portions of our variable rate debt, including our revolving credit facility, currently uses LIBOR as abenchmark for establishing the interest rate. The SEC staff has stated that “[i]t is expected that a number ofprivate-sector banks currently reporting information used to set LIBOR will stop doing so after 2021 when theircurrent reporting commitment ends, which could either cause LIBOR to stop publication immediately or causeLIBOR’s regulator to determine that its quality has degraded to the degree that it is no longer representative of itsunderlying market.” The consequences of this and other developments with respect to LIBOR cannot be entirelypredicted but may result in an increase in the interest cost of our variable rate debt.
Changes in our tax rates or exposure to additional income tax liability could impact our profitability andmanagement projections, estimates, and judgments, particularly with respect to reserves for litigation,deferred tax assets, and the fair market value of certain assets and liabilities, may be inaccurate and not beindicative of our future performance.
Our management team is required to use certain estimates in preparing our financial statements, includingaccounting estimates to determine reserves related to litigation, deferred tax assets, and the fair market value ofcertain assets and liabilities. Certain asset and liability valuations are subject to management’s judgment andactual results are influenced by factors outside our control.
We are required to maintain a valuation allowance for deferred tax assets and record a charge to income ifwe determine, based on evidence available at the time the determination is made, that it is more likely than notsome portion or all of the deferred tax assets will not be realized. This evaluation process involves significantmanagement judgment about assumptions that are subject to change from period to period. The use of differentestimates can result in changes in the amount of deferred taxes recognized, which can result in earnings volatilitybecause such changes are reported in current period earnings. See Part II, Item 8, Financial Statements andSupplementary Data, Note 14 to the Consolidated Financial Statements, contained in this Annual Report on Form10-K, for additional discussion of our deferred taxes. Item 3 — Legal Proceedings and in Part II, Item 8,Financial Statements and Supplementary Data, Note 18 to the Consolidated Financial Statements, contained inthis Annual Report on Form 10-K, for additional discussion related to relating to legal proceedings andcompliance risks
Legal, Tax, and Regulatory Risks
An adverse outcome in any pending or future litigation or pending or future warranty claims against theCompany or its subsidiaries or our determination that a customer has a substantial product warranty claimcould negatively impact our financial results and/or our financial condition.
We are party to various legal proceedings. In addition, from time to time our customers assert claims againstus relating to the warranties which apply to products we have sold. There is the potential that an outcome adverseto us or our subsidiaries in pending or future legal proceedings or pending or future product warranty claimscould materially exceed any accruals we have established and adversely affect our financial results and/orfinancial condition. In addition, we could suffer a significant loss of business from a customer who is dissatisfiedwith the resolution of a warranty claim.
Violations of the U.S. Foreign Corrupt Practices Act and similar worldwide anti-corruption laws and otherforeign governmental regulations, could result in fines, penalties, and criminal sanctions against theCompany, its officers, or both and could have a material and adverse effect on our business.
The U.S. Foreign Corrupt Practices Act and other similar worldwide anti-corruption laws, such as the U.K.Bribery Act, prohibit improper payments for the purpose of obtaining or retaining business. Although we haveestablished an internal control structure, corporate policies, compliance, and training processes to reduce the riskof violation, we cannot ensure that these procedures protect us from violations of such policies by our employeesor agents. Failure to comply with applicable laws or regulations could subject us to fines, penalties, andsuspension or debarment from contracting. Events of non-compliance could harm our reputation, reduce ourrevenues and profits, and subject us to criminal and civil enforcement actions. Violations of such laws orallegations of violation could disrupt our business and result in material adverse results to our operating results orfuture profitability.
18

Our foreign operations are subject to governmental regulations in the countries in which we operate, as wellas U.S. laws. These regulations include those related to currency conversion, repatriation of earnings, taxation ofour earnings and the earnings of our personnel, and the increasing requirement in some countries to make greateruse of local employees and suppliers, including, in some jurisdictions, mandates that provide for greater localparticipation in the ownership and control of certain local business assets.
Shifting federal, state, local, and foreign regulatory policies impose risks to our operations.
We are subject to regulation by federal, state, local, and foreign regulatory agencies and are thereforesubject to a variety of legal proceedings and compliance risks, including those described in Item 3 — LegalProceedings and in Part II, Item 8, Financial Statements and Supplementary Data, Note 18 to the ConsolidatedFinancial Statements, contained in this Annual Report on Form 10-K. Like other companies engaged inenvironmentally sensitive businesses, we are required to comply with numerous laws and regulations, includingenvironmental matters relating to, among other things, the treatment, disposal, and storage of wastes,investigation and remediation of contaminated soil and groundwater, the discharge of effluent into waterways,and the emissions of substances into the air. We are required to obtain various authorizations, permits, approvals,and certificates from governmental agencies. The Company could be subject to liability with respect toremediation of past contamination in the operation of some of its current and former facilities and remediation ofcontamination by former owners or operators of the Company’s current or former facilities. Compliance withemerging regulatory initiatives, delays, discontinuations, or reversals of existing regulatory policies in themarkets in which we operate, including costs associated with any required environmental remediation andmonitoring, could have an adverse effect on our business, results of operations, cash flows, and financialcondition.
A substantial portion of our operations is heavily dependent on governmental funding of infrastructureprojects. Many of these projects have “Buy America” or “Buy American” provisions. Significant changes in thelevel of government funding of these projects could have a favorable or unfavorable impact on our operatingresults. Additionally, government actions concerning “Buy America” provisions, taxation, tariffs, theenvironment, or other matters could impact our operating results.
Government actions in the United States or other countries where we have a higher concentration ofbusiness may change tax policy, trade policy, or enact other legislation that could create an unfavorableenvironment for the Company, making it more difficult to compete or adversely impact our operating results.
The United States-Mexico-Canada Trade Agreement (“USMCA”) and certain other international tradeagreements could affect our business, financial condition, and results of operations.
On July 1, 2020, the USMCA became effective, replacing the North American Free Trade Agreement. It isuncertain how the USMCA will impact foreign trade and our international operations. Potential materialmodifications to USMCA, or certain other international trade agreements, including with respect to themodification of trade agreements with or among the E.U. and the U.K., may have a material adverse effect on ourbusiness, financial condition, and results of operations.
International Risks
A portion of our sales are derived from our international operations, which expose us to certain risksinherent in doing business on an international level.
Doing business outside the United States subjects the Company to various risks, including changingeconomic and political conditions, work stoppages, exchange controls, currency fluctuations, armed conflicts,and unexpected changes in U.S. and foreign laws relating to tariffs, trade restrictions, transportation regulations,foreign investments, and taxation. Increasing sales to foreign countries, including Canada, China, India, Mexico,the U.K., and countries within the E.U., expose the Company to increased risk of loss from foreign currencyfluctuations and exchange controls as well as longer accounts receivable payment cycles. We have little controlover most of these risks and may be unable to anticipate changes in international economic and politicalconditions and, therefore, be unable to alter our business practices in time to avoid the adverse effect of any ofthese possible changes.
19
Changes in exchange rates for foreign currencies may reduce international demand for our products orincrease our labor or supply costs in non-U.S. markets. Fluctuations in the relative values of the U.S. dollar,Canadian dollar, British pound, and Euro may result in volatile earnings that reflect exchange rate translation inour Canadian and European sales and operations. If the U.S. dollar strengthens in value as compared to the valueof the Canadian dollar, British pound, or Euro, our reported earnings in dollars from sales in those currencies willbe unfavorable. Conversely, a favorable result will be reported if the U.S. dollar weakens in value as compared tothe value of the Canadian dollar, British pound, or Euro.
Economic conditions and regulatory changes caused by the United Kingdom’s exit from the EuropeanUnion could adversely affect our business.
Pursuant to a June 2016 referendum, the U.K. left the E.U. on January 31, 2020, commonly referred to as“Brexit.” The U.K. government and the E.U. operated under a transitional arrangement that expired onDecember 31, 2020. The EU-UK Trade and Cooperation Agreement was agreed in principle and becameprovisionally operative on January 1, 2021 and terms of this new relationship between the U.K. and the E.U.remains subject to uncertainties. There has been volatility in currency exchange rate fluctuations between theU.S. dollar relative to the British pound, which could continue. The withdrawal of the U.K. from the E.U. hasalso created market volatility and could continue to contribute to instability in global financial and foreignexchange markets, political institutions, and regulatory agencies as negotiations of trade deals between the U.K.and the E.U., and also between the U.K. and other countries, possibly including the U.S., occur during the nearfuture. Brexit is an unprecedented event, and, accordingly, it is unclear what long-term economic, financial,trade, and legal effects will result.
The majority of our U.K. operations are heavily concentrated within the U.K. borders; however, this couldadversely affect the future growth of our U.K. operations into other European locations. Our U.K. operationsrepresented approximately 9%, 9%, and 11% of our total revenue for the years ended December 31, 2020, 2019,and 2018, respectively. During the years ended December 31, 2020, 2019, and 2018, less than 1% of ourconsolidated net revenue was from the U.K. operation’s sales exported to E.U. members.
ITEM 1B. UNRESOLVED STAFF COMMENTS
None.
ITEM 2. PROPERTIES
The location and general description of the principal properties that are owned or leased by L.B. FosterCompany, together with the segment of the Company’s business using such properties, are set forth in thefollowing table:
Location Function Acres Business SegmentLeaseExpiration
Bedford, PA . . . . . . . . . . . . . . . Bridge componentfabricating plant
16 Infrastructure Solutions Owned
Birmingham, AL . . . . . . . . . . . Protective coatings facility 32 Infrastructure Solutions 2022Burnaby, BC, Canada . . . . . . . . Friction management
products plantN/A Rail Technologies and
Services2021
Columbia City, IN . . . . . . . . . . Rail processing facility andyard storage
22 Rail Technologies andServices
Owned
Hillsboro, TX . . . . . . . . . . . . . . Precast concrete facility 9 Infrastructure Solutions OwnedMagnolia, TX . . . . . . . . . . . . . . Threading facility 34 Infrastructure Solutions OwnedNampa, ID . . . . . . . . . . . . . . . . Precast concrete facility 12 Infrastructure Solutions 2029Niles, OH . . . . . . . . . . . . . . . . . Rail fabrication, friction
management products, andyard storage
35 Rail Technologies andServices
Owned
Petersburg, VA . . . . . . . . . . . . . Piling storage facility 35 Infrastructure Solutions OwnedPueblo, CO . . . . . . . . . . . . . . . . Rail joint manufacturing
facility9 Rail Technologies and
ServicesOwned
20

Location Function Acres Business SegmentLeaseExpiration
Saint-Jean-sur-Richelieu, QC,Canada . . . . . . . . . . . . . . . . .
Rail anchors and track spikesmanufacturing plant
17 Rail Technologies andServices
Owned
Sheffield, United Kingdom . . . Track component and frictionmanagement products facility
N/A Rail Technologies andServices
2030
Spokane, WA . . . . . . . . . . . . . . Concrete tie plant 13 Rail Technologies andServices
2020
Waverly, WV . . . . . . . . . . . . . . Precast concrete facility 85 Infrastructure Solutions Owned
Willis, TX . . . . . . . . . . . . . . . . . Protective coatings facility 16 Infrastructure Solutions Owned
Willis, TX . . . . . . . . . . . . . . . . . Measurement servicesfacility
13 Infrastructure Solutions Owned
Included in the table above are certain facilities leased by the Company for which there is no acreageincluded in the lease. For these properties a “N/A” has been included in the “Acres” column.
Including the properties listed above, the Company has a total of 17 sales offices, including its headquartersin Pittsburgh, PA, and 22 warehouses, plants, and yard facilities located throughout the United States, Canada,and Europe. The Company’s facilities are in good condition and suitable for the Company’s business as currentlyconducted and as currently planned to be conducted.
ITEM 3. LEGAL PROCEEDINGS
Information regarding the Company’s legal proceedings and other commitments and contingencies is setforth in Part II, Item 8, Financial Statements and Supplementary Data, Note 18 to the Consolidated FinancialStatements, contained in this Annual Report on Form 10-K, which is incorporated by reference into this Item 3.
ITEM 4. MINE SAFETY DISCLOSURES
This item is not applicable to the Company.
21
PART II
ITEM 5. MARKET FOR REGISTRANT’S COMMON EQUITY, RELATED STOCKHOLDERMATTERS, AND ISSUER PURCHASES OF EQUITY SECURITIES
(Dollars in thousands, except share data unless otherwise noted)
Stock Market Information
The Company had 299 common shareholders of record on February 24, 2021. The number of record holdersdoes not include stockholders who are beneficial owners but whose shares are held in “street name” by brokersand other nominees or persons, partnerships, associates, corporations, or other entities identified in securityposition listings maintained by depositories. Common stock is traded on the NASDAQ Global Select Marketunder the symbol: FSTR.
Dividends
During 2020, 2019, and 2018 the Company did not declare any quarterly dividends.
The Company’s April 30, 2019 credit facility, and as amended, permits it to pay dividends and distributionsand to make redemptions with respect to its stock providing no event of default or potential default (as defined inthe facility agreement) has occurred prior to or after giving effect to the dividend, distribution, or redemption.
Performance Graph
(In whole dollars)
The Company’s 2020 peer group (“2020 Peer Group”), which is compromised of companies that we believehave comparable characteristics and are in the same industry or line-of-business, consists of Alamo Group, Inc.,Ampco-Pittsburgh Corporation, CIRCOR International, Inc., Columbus McKinnon Corporation, GibraltarIndustries, Inc., Hawkins, Inc., Haynes International, Inc., Houston Wire & Cable Company, Insteel IndustriesInc., Lindsay Corporation, Lydall Inc., Manitex International, Inc., NN Inc., Orion Group Holdings, Inc., QuanexBuilding Products Corporation, Raven Industries Inc., Sterling Construction Co. Inc., and The Gorman-RuppCompany.
The following tables compare total shareholder returns for the Company over the last five years to theNASDAQ Composite Index and the 2020 Peer Group assuming a $100 investment made on December 31, 2015.Each of the three measures of cumulative total return assumes reinvestment of dividends. The stock performanceshown on the graph below is not necessarily indicative of future price performance.
22

COMPARISON OF 5 YEAR CUMULATIVE TOTAL RETURN*Among L.B. Foster Company, the NASDAQ Composite Index,
and a Peer Group
L.B. Foster Company NASDAQ Composite Peer Group
12/15 12/16 12/17 12/18 12/19 12/20$0
$50
$100
$150
$200
$250
$300
* $100 invested on 12/31/15 in stock or index, including reinvestment of dividends. Fiscal year endingDecember 31.
12/15 12/16 12/17 12/18 12/19 12/20
L.B. Foster Company . . . . . . . . . . . . . . . . . $100.00 $100.46 $200.54 $117.44 $143.15 $111.17
NASDAQ Composite . . . . . . . . . . . . . . . . . 100.00 108.87 141.13 137.12 187.44 271.64
2020 Peer Group . . . . . . . . . . . . . . . . . . . . . 100.00 141.27 148.26 114.93 144.37 159.67
Securities Authorized for Issuance Under Equity Compensation Plans
Under the 2006 Omnibus Incentive Plan, from May 2006 through May 2017, non-employee directors wereautomatically awarded fully-vested shares of the Company’s common stock as determined by the Board ofDirectors (“Board”) at each annual shareholder meeting at which such non-employee director is elected orre-elected. Since May 2018, the non-employee directors have received annual awards of forfeitable restricted sharessubject to a one-year vesting requirement. During 2020, pursuant to the 2006 Omnibus Incentive Plan, the Companyissued approximately 50,000 shares of the Company’s common stock for the annual non-employee director equityaward, which shares vest on the one-year anniversary of the date of grant. Commencing in 2020, in addition to theannual restricted stock award, those non-employee directors serving on the Board Strategy Committee have beenawarded restricted shares on an annual basis subject to a one-year vesting requirement. During 2020, there were nonon-employee directors who elected the option to receive fully-vested shares of the Company’s common stock inlieu of director cash compensation. Through December 31, 2020, there were approximately 216,000 fully vestedshares issued under the 2006 Omnibus Incentive Plan to non-employee directors. During the quarter ended June 30,2017, the Nomination and Governance Committee and Board of Directors jointly approved the DeferredCompensation Plan for Non-Employee Directors under the 2006 Omnibus Incentive Plan, which permitsnon-employee directors of the Company to defer receipt of earned cash and/or stock compensation for service on
23

the Board. As of December 31, 2020, approximately 66,000 deferred share units were allotted to the accounts ofnon-employee directors pursuant to the Deferred Compensation Plan for Non-Employee Directors.
The Company grants eligible employees restricted stock and performance unit awards under the 2006Incentive Omnibus Plan. The forfeitable restricted stock awards granted prior to March 2015 generally time-vestafter a four-year period, and those granted after March 2015 generally time-vest ratably over a three-year period,unless indicated otherwise in the underlying restricted stock award agreement. Performance unit awards areoffered annually under separate three-year long-term incentive programs. Performance units are subject toforfeiture and will be converted into common stock of the Company based upon the Company’s performancerelative to performance measures and conversion multiples as defined in the underlying program.
With respect to awards made prior to December 31, 2016, the Company will withhold or employees maytender shares of restricted stock when issued to pay for withholding taxes. Since 2017, the Company has withheldshares of restricted stock for satisfaction of tax withholding obligations. During 2020, 2019, and 2018, theCompany withheld 95,285, 34,198, and 11,445 shares, respectively, for this purpose. The values of the shareswithheld were $1,665, $621, and $316 in 2020, 2019, and 2018, respectively.
Issuer Purchases of Equity Securities
The Company’s purchases of equity securities for the three months ended December 31, 2020 were as fol-lows:
Total numberof shares
purchased (1)
Averageprice
paid pershare
Total numberof shares
purchased aspart of publicly
announced plansor programs
Approximate dollarvalue of sharesthat may yet be
purchased underthe plans or programs
October 1, 2020 — October 31, 2020 . . . . . . . . 356 $13.98 — $—
November 1, 2020 — November 30, 2020 . . . . — — — —
December 1, 2020 — December 31, 2020 . . . . — — — —
Total . . . . . . . . . . . . . . . . . . . . . . . . . . . . . . . . . . 356 $19.67 — $—
1. Reflects shares withheld by the Company to pay taxes upon vesting of restricted stock.
ITEM 6. SELECTED FINANCIAL DATA
Omitted pursuant to amendments to Item 301 of Regulation S-K effective February 10, 2021.
ITEM 7. MANAGEMENT’S DISCUSSION AND ANALYSIS OF FINANCIAL CONDITION ANDRESULTS OF OPERATIONS
(Dollars in thousands, except share data unless otherwise noted)
Executive Level Overview
2020 Developments and 2021 Outlook
During 2020, the Company:
‰ Produced net sales of $497,411, a decrease of $119,017, or 19.3% from 2019;
‰ Increased backlog(a) by 8.4% over the prior year end to $248,232, despite new orders(a) decreasing by16.3%;
‰ Generated net income from continuing operations of $25,823, or $2.42 per diluted share;
‰ Divested the IOS Test and Inspection Services business from the Infrastructure Solutions segment, result-ing in the recognition of an income tax benefit of $15,840 in continuing operations;
‰ Reported adjusted EBITDA(b) (earnings before interest, taxes, depreciation, amortization, and certainexpenses) of $31,993;
24

‰ Effectively managed working capital levels, resulting in $20,549 of net cash provided by operating activ-ities;
‰ Reduced borrowings by $13,114, or 22.6%, to $45,024, resulting in net debt(b) of $37,460;
‰ Successfully implemented cost containment programs, including in response to the COVID-19 pandemic,resulting in $8,880 decline year over year in selling and administrative expense;
‰ Amended the Company’s credit agreement, resulting in the termination of its term loan outstanding of$22,500 and a decrease in the maximum capacity of its revolver from $140,000 to $115,000 as ofDecember 31, 2020;
‰ Continued operations during the COVID-19 pandemic while minimizing any business interruptions andaddressing safety concerns of our employees and customers through implementation of our PandemicAction Plan which includes measures such as enhanced disinfecting, temperature screenings, social dis-tancing, telework, wearing masks, limiting access to facilities to only essential third parties, and adheringto travel and quarantine recommendations issued by the U.S. Centers for Disease Control and variousnational, state, provincial, and local departments of health where our facilities are located.
‰ Completed the relocation of the CXT Concrete Buildings facility from Spokane, WA to Boise, ID; and
‰ Realigned the Company’s operating segments under two senior business leaders to provide clear line ofsight around the opportunities for growth and asset leverage in each of the two segments.
(a) The Company defines new orders as a contractual agreement between the Company and a third-party in which the Company will, or hasthe ability to, satisfy the performance obligations of the promised products or services under the terms of the agreement. The Companydefines backlog as contractual commitments to customers for which the Company’s performance obligations have not been met, includ-ing with respect to new orders and contracts for which the Company has not begun any performance. Management utilizes new ordersand backlog to evaluate the health of the industries in which the Company operates, the Company’s current and future results of oper-ations and financial prospects, and strategies for business development. The Company believes that new orders and backlog are useful toinvestors as supplemental metrics by which to measure the Company’s current performance and prospective results of operations andfinancial performance. The Company defines its book-to-bill ratio as new orders divided by revenue. Management uses the book-to-billkey performance indicator as a monitoring metric for the levels of backlog a business unit is building (greater than 1.0) or consuming(less than 1.0), which may provide management and investors an indication of current market activity.
(b) The following tables display reconciliations of non-GAAP financial measures for the years ended December 31, 2020, 2019, and 2018.EBITDA is a financial metric utilized by management to evaluate the Company’s performance on a comparable basis. The Companybelieves that EBITDA is useful to investors as a supplemental way to evaluate the ongoing operations of the Company’s business asEBITDA enhances investors’ ability to compare historical periods as it adjusts for the impact of financing methods, tax law and strategychanges, and depreciation and amortization. In addition, EBITDA is a financial measurement that management and the Company’sBoard of Directors use in their financial and operational decision-making and in the determination of certain compensation programs.Adjusted EBITDA includes certain adjustments to EBITDA. In 2020, the Company made adjustments to exclude the impact of relocationand restructuring costs and the proceeds from an unconsolidated partnership. In 2019, the Company made adjustments to exclude theU.S. defined benefit plan settlements, costs associated with relocation and closure activities, including nonoperational start-up costsrelated to the Boise, ID facility. The Company views net debt, which is total debt less cash and cash equivalents, as an important metricof the operational and financial health of the organization and useful to investors as an indicator of our ability to incur additional debtand to service our existing debt. Non-GAAP financial measures are not a substitute for GAAP financial results and should only beconsidered in conjunction with the Company’s financial information that is presented in accordance with GAAP. Quantitativereconciliations of EBITDA and debt to the non-GAAP financial measures are presented below.
25

Year EndedDecember 31,
2020 2019
Adjusted EBITDA ReconciliationIncome from continuing operations . . . . . . . . . . . . . . . . . . . . . . . . . . . . . . . . . . . $ 25,823 $ 47,974
Interest expense, net . . . . . . . . . . . . . . . . . . . . . . . . . . . . . . . . . . . . . . . . . . . . . . . 3,761 4,911
Income tax benefit . . . . . . . . . . . . . . . . . . . . . . . . . . . . . . . . . . . . . . . . . . . . . . . . (11,841) (23,835)
Depreciation . . . . . . . . . . . . . . . . . . . . . . . . . . . . . . . . . . . . . . . . . . . . . . . . . . . . . 7,850 7,944
Amortization . . . . . . . . . . . . . . . . . . . . . . . . . . . . . . . . . . . . . . . . . . . . . . . . . . . . . 5,729 6,445
Total EBITDA from continuing operations . . . . . . . . . . . . . . . . . . . . . . . . . . . 31,322 43,439
Relocation and restructuring costs . . . . . . . . . . . . . . . . . . . . . . . . . . . . . . . . . . . . 2,545 1,768
Proceeds from unconsolidated partnership . . . . . . . . . . . . . . . . . . . . . . . . . . . . . . (1,874) —
U.S. pension settlement expense . . . . . . . . . . . . . . . . . . . . . . . . . . . . . . . . . . . . . — 2,210
Adjusted EBITDA from continuing operations . . . . . . . . . . . . . . . . . . . . . . . . $ 31,993 $ 47,417
December 31, September 30, December 31,2020 2020 2019
Net Debt ReconciliationTotal debt . . . . . . . . . . . . . . . . . . . . . . . . . . . . . . . . . . . . . . $45,024 $49,104 $ 58,152
Less: cash and cash equivalents . . . . . . . . . . . . . . . . . . . . . (7,564) (9,311) (14,178)
Net debt . . . . . . . . . . . . . . . . . . . . . . . . . . . . . . . . . . . . . . . $37,460 $39,793 $ 43,974
As a result of the ongoing pandemic, the Company has continued to experience disruptions in supply chains,delays in deliveries to customers, and customer unwillingness to have the Company’s employees work on sitewhere safe distance measures are difficult to follow, as well as general weakness in demand as certain travel andwork restrictions continued to be in place in most areas. Most notably, the collapse in oil demand associated withreduced travel resulting from the COVID-19 pandemic, which led to a significant drop in demand for certainproducts and services offered by our Infrastructure Solutions segment, has persisted. In the rail, transit, frictionmanagement, steel construction, and fabricated bridge businesses governmental stay-at-home and work-from-home orders both in the U.S. and globally, particularly in the U.K., have resulted in reduced traffic and demandfor our products and services, and many public works projects have been deferred or delayed as a result ofpandemic mitigation efforts, adversely impacting our business. The Company anticipates continued disruption atleast through the first half of 2021 as various restrictive measures have remained in effect in the major marketswe serve. The Company has experienced minimal disruption with its on-premise workforce up to this point, andthe Company expects to continue to operate under its pandemic protocols with minimal changes.
The Company’s strong balance sheet should continue to allow the Company to effectively manageoperations through the current environment and remain a leading provider of products and services to the globalinfrastructure markets. During the fourth quarter of 2020, the Company reduced its net debt to $37,460 as ofDecember 31, 2020 from $39,793 as of September 30, 2020, a reduction of $2,333. The Company’s totalavailable funding capacity was $76,838 as of December 31, 2020.
In the fourth quarter of 2020, the Company realigned its operating segments under two senior businessleaders to provide clear line of sight around the opportunities for growth and asset leverage in each of the twosegments. The Rail Technologies and Services, consisting of businesses previously reported in the former RailProducts and Services segment, reflects the Company’s current focus on serving transit and freight railwayoperators and related infrastructure. The Company has been evolving from a track components supplier to onethat has been introducing solutions that deliver greater benefits to operating efficiency, reducing disruption andimproving safety through the deployment of more advanced technology in its solutions. Services have become agreater part of the Company’s offerings as end users look to the Company for expertise in managing moresophisticated systems often coupled with these new technologies. The former Construction Products segment and
26

former Tubular and Energy segment were realigned into the Infrastructure Solutions operating segment, as thesebusinesses collectively provide a variety of products and services for infrastructure markets to support theefficient transportation of people, goods, commodities, and for general civil works, primarily in the UnitedStates. Engineering and construction firms and general contractors seek assistance from the Company for designand application engineering help when addressing needs across highway, bridge, ports, railways, heavy civil,marine, water and storm water, agricultural, commercial, and residential projects. The Company’s expertise infabricated steel, precast concrete, measurement systems and corrosion protection coupled with competenciesaround managing large complex projects results in custom solutions for each project. Within the productofferings, there is a significant overlap of infrastructure markets, including water, transportation, energy,chemical and fabrication infrastructure markets.
The fourth quarter has historically seen a decline in activity for the Company, but the current year was moresevere as sales for the fourth quarter of 2020 declined by 18.2% when compared to the prior year quarter. Thiscontributed to a year-over-year sales decline of 19.3%. Along with the sales decline in the current year, both theRail Technologies and Services and Infrastructure Solutions segments reported reduced order activity during2020, as compared to 2019, primarily as a result of the COVID-19 pandemic. However, new order activity didoutpace revenue volume for the year, which we consider a favorable indicator for the Company. The book-to-billratio for the Rail segment was 1.08 for 2020, which drove the year-over-year increase in backlog of $17,537, or16.9%. This increase highlights the ongoing spending in the infrastructure markets served by the Rail segmentdespite pockets of weakness associated with rail and transit traffic volume and transportation related projects andservices due to the pandemic. Infrastructure Solutions backlog increased by $1,663 or 1.3% from the prior yeardespite a $27,643 decline in the Coatings and Measurement business unit, which principally serves themidstream energy markets. The energy market continues to have an unfavorable outlook and the industry expectssignificant difficulties in funding ongoing development activity that requires the Company’s services. As such,the Company has experienced continued weakness in new order activity in the businesses serving the energymarket and is forecasting sales to decline significantly year-over-year for its Coatings and Measurement businessunit in 2021.
Despite the significant decrease in revenue year-over-year, and the significant challenges experienced by themidstream energy market focused businesses in 2020, the Company was able to generate a gross margin of19.1%, a 50 basis point decline from 2019, with the Rail segment reflecting a 20 basis point increase year-over-year to 20.0%. In addition, the Company decreased its selling, general and administrative costs to $73,644, a10.8% decline from 2019, partially due to cost reduction actions taken during the year. As a result, the Companywas able to generate income before taxes from continuing operations of $13,982 in 2020, and after the impact ofthe tax benefits generated in the IOS Test and Inspection Services divestiture, the Company produced net incomefrom continuing operations of $25,823, or $2.42 per diluted share.
The Rail segment is anticipating further recovery in Rail Technologies, although continued pandemic-related lockdowns in the U.K. may hamper such recovery in the near term. Rail Products bookings were strong inthe fourth quarter of 2020, reflecting a $15,064 increase over the third quarter of 2020. As the Company monitorsthe budget shortfalls incurred by transit operators, projects associated with long-term planning have been movingforward. However, the Company is not expecting a notable improvement in the sales of consumable productsuntil passenger and freight volumes improve.
The 1.3% increase in the Infrastructure Solutions segment backlog as compared to December 31, 2019resulted from increases in the Fabricated Steel Products and Precast Concrete Products business units. TheFabricated Steel Products division experienced substantial year-over-year increases in backlog of $22,276 as aresult of securing several key projects during the year. In particular, the backlog for bridge decking is expected tocontinue to result in production rates at near capacity levels in 2021. The Precast Concrete Products divisioncontinues to benefit from new infrastructure projects in the regions it serves, which is reflected in a year-over-year backlog increase of $7,030. While this business often depends on municipal, state, and federal spending thatmay experience budget pressures, these programs could benefit from continued government spending oninfrastructure and economic stimulus efforts related to civil construction projects. Offsetting these increases inthe Infrastructure Solutions segment was the reduction in the Coatings and Measurement division’s backlog,which fell by $27,643 from December 31, 2019. This decline is primarily due to Coatings and Measurement’s
27

exposure to the midstream energy market, and the associated weakness in demand for oil in 2020. New orders forCoatings and Measurement reached its lowest point in the fourth quarter of 2020 at $6,057. Current projectinquiries lead the Company to believe that the first half of 2021 will improve modestly from this level.
Since the middle of 2019, the upstream energy markets that the Company served have deteriorated as pricesof oil and natural gas declined due to weakening demand. This deterioration accelerated as a result of the globalCOVID-19 pandemic and the associated reduction in demand due to reduced travel and movement of goodsthroughout the world. As U.S. exploration and production companies have reduced production and implementedspending cuts, demand for much of what the Company did in its upstream oil and gas test and inspection business(“Test and Inspection Services”) had sharply declined. Consequently, the Company did not see a path to earningacceptable returns for the Test and Inspections Services business. As a result, on September 4, 2020, theCompany completed the sale of the issued and outstanding membership interests of its Test and InspectionServices business. Proceeds from the sale were $4,000 and resulted in a loss of $10,034, net of tax. As a result ofthe sale of this business, the Company recognized an aggregate of $18,978 in tax benefits, including tax benefitsrecognized in discontinued operations, for the year ended December 31, 2020. In addition, the Companyanticipates receiving approximately $9,008 in tax refunds within the next year due to extended carrybackprovisions in the Coronavirus Aid, Relief, and Economic Security Act of 2020, as amended (“CARES Act”), andthe acceleration of existing deferred tax assets related to the sale. The sale represents a strategic shift away fromproviding services to the upstream oil and gas market. The Company believes that this divestiture also changesthe risk profile of the Company by: (a) eliminating dependence on the upstream energy market and the liabilityassociated with serving upstream applications; (b) reducing exposure to a volatile industry that can turn offdemand quickly under poor conditions; and (c) avoiding the price and production cyclicality of the global oilmarket. On a prospective basis, the Company’s Coatings and Measurement business will continue to be focusedon core competencies around corrosion protection and measurement systems in midstream pipeline applications,where the market has been much less volatile and tends to have longer term investments and associated backlogcompared to upstream activities. The Company has reflected the results of operations of the Test and InspectionServices business as discontinued operations in the Consolidated Financial Statements and recast theInfrastructure Solutions segment results for all periods presented.
In October 2020, during the COVID-19 pandemic, the Company was the subject of a cyber-attack (the“Cybersecurity Event”). Upon becoming aware of the Cybersecurity Event, the Company immediately notifiedfederal law enforcement, acted quickly to take its systems offline, and began assessing the nature of the attack, all aspart of its comprehensive response. The Company was able to act quickly to restore normal operations with nomaterial operational, financial, or other impact to the Company. The Company maintains a cyber insurance policythat assisted with risk mitigation of the Cybersecurity Event and any potential future events. As part of the Compa-ny’s response, it has implemented enhanced cybersecurity measures across its network. The investigation of theCybersecurity Event is ongoing with assistance from external cybersecurity, forensics, and legal experts and advi-sors, and the Company will make any and all appropriate regulatory filings and disclosures once the investigation iscomplete. While the investigation is ongoing, the Company does not expect any adverse impact on its operations,financial results or performance, or reputation.
Year-to-date Results Comparison
Results of Operations
Year EndedDecember 31,
PercentIncrease/(Decrease)
Percent of TotalNet Sales
Year EndedDecember 31,
2020 2019 2020 vs. 2019 2020 2019
Net Sales:
Rail Technologies and Services . . . . . . . . . . . . . . . . . . $276,447 $321,808 (14.1)% 55.6% 52.2%
Infrastructure Solutions . . . . . . . . . . . . . . . . . . . . . . . . . 220,964 294,620 (25.0) 44.4 47.8
Total net sales . . . . . . . . . . . . . . . . . . . . . . . . . . . . . . $497,411 $616,428 (19.3)% 100.0% 100.0%
28

Year EndedDecember 31,
PercentIncrease/(Decrease)
Gross ProfitPercentageYear Ended
December 31,2020 2019 2020 vs. 2019 2020 2019
Gross Profit:
Rail Technologies and Services . . . . . . . . . . . . . . . . . . $ 55,263 $ 63,667 (13.2)% 20.0% 19.8%
Infrastructure Solutions . . . . . . . . . . . . . . . . . . . . . . . . . 39,743 57,271 (30.6) 18.0 19.4
Total gross profit . . . . . . . . . . . . . . . . . . . . . . . . . . . . $ 95,006 $120,938 (21.4)% 19.1% 19.6%
Year EndedDecember 31,
PercentIncrease/(Decrease)
Percent of TotalNet Sales
Year EndedDecember 31,
2020 2019 2020 vs. 2019 2020 2019
Expenses:
Selling and administrative expenses . . . . . . . . . . . . . . . $ 73,644 $ 82,524 (10.8)% 14.8% 13.4%
Amortization expense . . . . . . . . . . . . . . . . . . . . . . . . . . 5,729 6,445 (11.1) 1.2 1.0
Interest expense — net . . . . . . . . . . . . . . . . . . . . . . . . . 3,761 4,911 (23.4) 0.8 0.8
Other (income) expense — net . . . . . . . . . . . . . . . . . . . (2,110) 2,919 (172.3) (0.4) 0.5
Income from continuing operations before incometaxes . . . . . . . . . . . . . . . . . . . . . . . . . . . . . . . . . . . . . . $ 13,982 $ 24,139 (42.1)% 2.8% 3.9%
Income tax benefit . . . . . . . . . . . . . . . . . . . . . . . . . . . . . (11,841) (23,835) 50.3 (2.4) (3.9)
Income from continuing operations . . . . . . . . . . . . . . . $ 25,823 $ 47,974 (46.2)% 5.2% 7.8%
Fiscal 2020 Compared to Fiscal 2019 — Company Analysis
Net sales of $497,411 for the year ended December 31, 2020 decreased by $119,017, or 19.3%, compared tothe prior year. Both of the reporting segments contributed to the decrease, with Infrastructure Solutionsdecreasing by 25.0% and Rail Technologies and Services decreasing by 14.1% from the prior year. The salesdecline was primarily attributable to the circumstances around the COVID-19 pandemic, resulting in reduceddemand in each of the business units within the segments and most severely impacting the Coatings andMeasurement business unit, which principally serves the midstream energy market, within the InfrastructureSolutions segment.
Gross profit decreased by $25,932 from the prior year to $95,006 for 2020. This decrease was attributable toboth of the segments, with Infrastructure Solutions decreasing by $17,528 and Rail Technologies and Servicesdecreasing by $8,404. Along with the decrease in gross profit, gross profit margin for 2020 was 19.1%, or 50basis points (“bps”) lower than the prior year. The decrease in the current year margin was due to theInfrastructure Solutions segment, which was impacted by decreased sales volume, primarily within the Coatingsand Measurement business unit, that outpaced decreases in expense. The 2020 gross profit margin decline waspartially offset by a 20 bps increase in the Rail Technologies and Services segment.
Selling and administrative expenses decreased by $8,880, or 10.8%, from the prior year. The decrease wasprimarily attributable to decreases in personnel related expenses of $7,149 from the prior year, including a$2,019 decrease in stock-based compensation expense, and a reduction in third-party services of $2,116compared to the prior year. These decreases were partially offset by an increase in bad debt expense of $441when compared to the prior year. As a result of the suppressed sales levels in 2020, selling and administrativeexpenses increased by 140 bps as a percentage of net sales as compared to the prior year.
For the year ended December 31, 2020, the Company recorded expense of $673 related to relocation andclosure activities and income of $1,874 from an unconsolidated partnership distribution recorded in “Other(income) expense — net.” Interest expense, net of interest income, for the year ended December 31, 2020 wasreduced by $1,150 as a result of the $13,114 reduction in outstanding debt.
29

The Company’s effective income tax rate for 2020 was (84.7)%, compared to (98.7)% in the prior yearperiod. The Company’s income tax benefit from continuing operations for 2020 included a discrete income taxbenefit of $15,840, net of valuation allowance, related to the disposition of the Test and Inspection Servicesbusiness. During 2019, the Company reversed $29,648 of its valuation allowance previously recorded againstU.S. deferred tax assets. The positive evidence considered in evaluating U.S. deferred tax assets includedcumulative financial income over the three-year period ended December 31, 2020, as well as the composition andreversal patterns of existing taxable and deductible temporary differences between financial reporting and tax.Based on our evaluation, the Company believed it was appropriate to rely on forecasted future taxable income tosupport its U.S. deferred tax assets. The amount of deferred tax assets considered to be realizable, however, couldbe adjusted if negative evidence outweighs additional subjective evidence such as our projections for growth.
Net income from continuing operations for the year ended December 31, 2020 was $25,823, or $2.42 perdiluted share, compared to net income from continuing operations for the 2019 period of $47,974, or $4.51 perdiluted share.
Results of Operations — Segment Analysis
Rail Technologies and ServicesYear Ended
December 31,(Decrease)/
Increase(Decrease)/
Increase2020 2019 2020 vs. 2019 2020 vs. 2019
Net Sales . . . . . . . . . . . . . . . . . . . . . . . . . . . . . . . $276,447 $321,808 $(45,361) (14.1)%
Gross Profit . . . . . . . . . . . . . . . . . . . . . . . . . . . . . $ 55,263 $ 63,667 $ (8,404) (13.2)%
Gross Profit Percentage . . . . . . . . . . . . . . . . . . 20.0% 19.8% 0.2% 1.0%
Segment Profit . . . . . . . . . . . . . . . . . . . . . . . . . . . $ 16,321 $ 19,641 $ (3,320) (16.9)%
Segment Profit Percentage . . . . . . . . . . . . . . . 5.9% 6.1% (0.2)% (3.3)%
Rail Technologies and Services segment sales decreased by $45,361, or 14.1%, compared to the prior year.The sales decline was driven almost equally by our Rail Products and Rail Technologies business units, whichexperienced year-over-year declines of $21,882, or 10.5%, and $23,479, or 20.7%, respectively. The decreaseswere due primarily to impacts experienced as a result of the pandemic, including: reductions in demand for NorthAmerican transit projects and friction management consumable products and services as freight and transit railcustomer traffic declined, as well as reduced activity levels on the London Crossrail project in the U.K., as theproject nears its completion and continues to experience temporary work stoppages due to stay-at-home ordersimplemented.
Segment gross profit decreased by $8,404, or 13.2%, which was driven by decreases in sales volumes acrossthe segment. The Rail segment gross profit margin increased by 20 bps over the prior year, which is attributableto management’s cost control measures as well as a more favorable product mix of higher margin offerings,especially within the Rail Products business unit. The Rail segment profit for 2020 was $16,321, a segment profitmargin of 5.9%, compared to $19,641, and a margin of 6.1% for 2019.
During 2020, the new orders within the Rail Technologies and Services segment decreased by 10.7% whencompared to the prior year. Each of the business units within the segment had decreases in new orders comparedto 2019, which were primarily related to declines in order activity for global transit projects, friction managementconsumables, and on-track services. Despite the decline in new orders, backlog increased by 16.9% compared tothe prior year, ending 2020 at $121,231, which illustrates expected future spending in markets served despitechallenges faced in the current year.
Infrastructure Solutions
On September 4, 2020, we sold our Test and Inspection Service business to an unrelated third party buyer.Proceeds from the sale were $4,000 and resulted in a loss of $10,034 net of tax. The sale represents a strategicshift away from providing services to the upstream oil and gas market. We believe that this divestiture alsochanges the risk profile of our Company by (a) eliminating dependence on the upstream energy market and the
30

liability associated with serving upstream applications; (b) reducing exposure to a volatile industry that can turnoff demand quickly under poor conditions; and (c) avoiding the price and production cyclicality of the global oilmarket. On a prospective basis, our Coatings and Measurement businesses will continue to be focused on corecompetencies around corrosion protection and measurement systems in midstream pipeline applications, wherethe market has been much less volatile and tends to have longer term investments and associated backlog com-pared to upstream activities. We have reflected the results of operations of the Test and Inspection Services busi-ness as discontinued operations in our Consolidated Financial Statements and recast the segment results for allperiods presented.
Year EndedDecember 31, Decrease
PercentDecrease
2020 2019 2020 vs. 2019 2020 vs. 2019
Net Sales . . . . . . . . . . . . . . . . . . . . . . . . . . . . . . . $220,964 $294,620 $(73,656) (25.0)%
Gross Profit . . . . . . . . . . . . . . . . . . . . . . . . . . . $ 39,743 $ 57,271 $(17,528) (30.6)%
Gross Profit Percentage . . . . . . . . . . . . . . . . . . . . 18.0% 19.4% (1.5)% (7.5)%
Segment Profit . . . . . . . . . . . . . . . . . . . . . . . . . . . $ 8,250 $ 23,615 $(15,365) (65.1)%
Segment Profit Percentage . . . . . . . . . . . . . . . 3.7% 8.0% (4.3)% (53.4)%
The Infrastructure Solutions segment sales decreased by $73,656, or 25.0%, compared to the prior year,which was attributable to each of the business units within the segment. Coatings and Measurement experienceda sales decrease of 35.6%, primarily due to the pandemic-related deteriorated oil and gas market conditions inaddition to already weakened demand for crude oil. The Fabricated Steel Products sales decrease of 25.1% wasprimarily driven by the completion of the Port Everglades project in 2019 without a comparably sized project in2020. The Precast Concrete Products sales decline of 7.5% was primarily attributable to down time as a result ofthe move to the new precast concrete facility in Boise, ID.
The Infrastructure Solutions segment gross profit decreased by $17,528, or 30.6%, compared to the prioryear. The gross profit decrease was primarily due to depressed sales volume within the segment and plantinefficiencies during the production ramp-up of the new precast concrete facility in Boise, ID. The afore-mentioned items also contributed to a 150 bps reduction in gross profit margin for the segment. The segmentprofit of $8,250 decreased by $15,365 compared to the prior year to 3.7% of net sales. Included within segmentprofit for 2020 and 2019 are relocation and closure costs of $673 and $1,768, respectively, related to our closureof the Spokane, WA concrete building facility and subsequent relocation of operations to Boise, ID, which wascompleted during the first quarter of 2020. This relocation is part of an initiative to focus on regional growthopportunities and logistical savings associated with a more centralized location closer to the Company’s existingand prospective customer base.
For 2020, the Infrastructure Solutions segment had a 22.5% decrease in new orders compared to the prioryear period. This decrease was primarily attributable to the Coatings and Measurement business unit. The seg-ment’s backlog as of December 31, 2020 was $127,001, a 1.3% increase compared to the prior year end.
Liquidity and Capital Resources
Our principal sources of liquidity are our existing cash and cash equivalents, cash generated by operations,and the available capacity under our revolving credit facility, which provides for a total commitment of up to$115,000, of which $69,274 was available for borrowing as of December 31, 2020. Our primary needs for liquid-ity relate to working capital requirements for operations, capital expenditures, debt service obligations, paymentsrelated to the Union Pacific Railroad Settlement, tax obligations, and outstanding purchase obligations. Our totaldebt was $45,024 and $58,152 as of December 31, 2020 and December 31, 2019, respectively, and was primarilycomprised of borrowings under our revolving credit facility.
31

The following table reflects our available funding capacity as of December 31, 2020:
December 31, 2020
Cash and cash equivalents . . . . . . . . . . . . . . . . . . . . . . . . . . . . . . . . . . . . . . . . . . . $ 7,564
Credit agreement:
Total availability under the credit agreement . . . . . . . . . . . . . . . . . . . . . . . . . . . . $115,000
Outstanding borrowings on revolving credit facility . . . . . . . . . . . . . . . . . . . . . . (44,777)
Letters of credit outstanding . . . . . . . . . . . . . . . . . . . . . . . . . . . . . . . . . . . . . . . . . (949)
Net availability under the revolving credit facility . . . . . . . . . . . . . . . . . . . . . . . . 69,274
Total available funding capacity . . . . . . . . . . . . . . . . . . . . . . . . . . . . . . . . . . . . . . $76,838
Our cash flows are impacted from period to period by fluctuations in working capital. While we place anemphasis on working capital management in our operations, factors such as our contract mix, commercial terms,days sales outstanding (“DSO”), and market conditions as well as seasonality may impact our working capital.We regularly assess our receivables for collectability, and provide allowances for doubtful accounts whereappropriate. We believe that our reserves for doubtful accounts are appropriate as of December 31, 2020, butadverse changes in the economic environment, including further deterioration of demand for crude oil and naturalgas in the energy markets, and adverse financial conditions of our customers resulting from, among other things,the COVID-19 pandemic, may impact certain of our customers’ ability to access capital and compensate us forour products and services, as well as impact demand for our products and services.
The change in cash and cash equivalents for the years ended December 31, 2020, 2019, and 2018 were asfollows:
Year EndedDecember 31,
2020 2019 2018
Net cash provided by continuing operating activities . . . . . . . . . . . $ 20,549 $ 26,242 $ 26,536
Net cash (used in) provided by continuing investing activities . . . . (10,319) (5,096) 3,761
Net cash used in continuing financing activities . . . . . . . . . . . . . . . (15,277) (18,209) (55,337)
Effect of exchange rate changes on cash and cash equivalents . . . . (195) 525 (308)
Net cash (used in) provided by discontinued operations . . . . . . . . . (1,372) 434 (2,048)
Net (decrease) increase in cash and cash equivalents . . . . . . . . . . . $ (6,614) $ 3,896 $(27,396)
Cash Flows from Operating Activities
During the year ended December 31, 2020, net cash provided by operating activities was $20,549, compared to$26,242 during the prior year period. For the year ended December 31, 2020, income and adjustments to incomefrom continuing operating activities provided $36,521, compared to $37,216 in 2019. Working capital and otherassets and liabilities, used $15,972 in the current period compared to $10,974 during 2019, including payments of$8,000 and $10,000, in 2020 and 2019, respectively, related to the Union Pacific Railroad Concrete Tie Settlement.
The Company’s calculation of days sales outstanding was 51 days as of December 31, 2020 compared to49 days as of December 31, 2019. We believe our receivables portfolio is strong.
Cash Flows from Investing Activities
For the year ended December 31, 2020, the Company had capital expenditures of $9,179, a $3,153 increasefrom 2019. The current year expenditures were primarily related to plant expansions and a plant relocation withinour Infrastructure Solutions segment, the purchase of a continuous welded rail car and unloader within our RailTechnologies and Services segment, and general plant and operational improvements throughout the Company.The capital expenditures during 2019 related to a plant expansion within our Infrastructure Solutions segment,progress payments towards the purchase of a continuous welded rail car and unloader within our Rail
32

Technologies and Services segment, and general plant and operational improvements. The Company receivedproceeds of $16 from the sale of assets during the year ended December 31, 2020, compared to $930 in 2019.The prior year proceeds were primarily attributable to the sale of land and improvements in Castle Rock, CO.Cash used in investing activities for 2020 also includes cash paid of $1,156 for the asset acquisition of LarKenPrecast, LLC in Boise, Idaho to expand our precast concrete offerings in that region.
Cash Flows from Financing Activities
The Company reduced its outstanding debt by $13,114 during the year ended December 31, 2020, primarilyfrom operational cash flows, net proceeds from the sale of the Test and Inspection Services business, and excessinternational cash repatriation. During the year ended December 31, 2019, the Company reduced outstandingdebt by $2,584, primarily utilizing proceeds from operational cash flows and the sale of non-core assets. Duringthe years ended December 31, 2020 and 2019, the Company paid financing fees of $498 and $836, respectively,related to its amended credit facility agreements. For the years ended December 31, 2020 and 2019, the Companyrepurchased 95,285 and 34,198 shares of its stock, respectively, for $1,665 and $621, respectively. These shareswere withheld from employees to pay their withholding taxes in connection with the vesting of stock awards.
Financial Condition
The Company generated $20,549 from cash flows from operations during 2020, which was primarilyutilized to make payments against our outstanding debt and to fund capital expenditures. As of December 31,2020, we had $7,564 in cash and cash equivalents and $69,274 of availability under our revolving credit facility.
Our principal uses of cash in recent years have been to fund our operations, including capital expenditures,and to service our indebtedness. We view our short and long-term liquidity as being dependent on our results ofoperations, changes in working capital and our borrowing capacity. As of December 31, 2020, our current ratio,which we define as current assets divided by current liabilities, was 2.05.
Non-domestic cash balances of $6,995 are held in various locations throughout the world. Managementdetermined that should the cash balances of our Canadian and U.K. subsidiaries exceed our projected workingcapital needs, excess funds will be repatriated. The Company repatriated $5,387 of excess cash during 2020.
On June 26, 2020, we entered into an amendment to our credit agreement (as amended, “First Amendment”)that reduced the total commitments under the revolving credit facility to $120,000 from $140,000. The FirstAmendment requires additional $5,000 annual reductions to the revolving credit facility capacity beginning onDecember 31, 2020 through the maturity of the facility on April 30, 2024. As a result, the revolving credit facilityhas $115,000 of total capacity as of December 31, 2020. In addition, the First Amendment terminated the existingterm loan by drawing on the revolving credit facility. Borrowings under the First Amendment continue to bearinterest rates based upon either the base rate or Euro-rate plus applicable margins. However, the First Amendmentincreased the applicable margins on the interest rates, and implemented an interest rate floor of 100 basis points.The First Amendment also modified the covenants associated with the credit agreement. For a discussion of theterms and availability of the Company’s credit facilities, please see Part II, Item 8, Financial Statements andSupplementary Data, Note 10 of the Notes to Consolidated Financial Statements contained in this Annual Report onForm 10-K.
As of December 31, 2020, the Company was in compliance with the covenants in the Amended CreditAgreement.
To reduce the impact of interest rate changes on outstanding variable-rate debt, the Company entered intoforward starting LIBOR-based interest rate swaps with notional values totaling $50,000. The swaps becameeffective on February 28, 2017 at which point they effectively converted a portion of the debt from variable tofixed-rate borrowings during the term of the swap contract. As of December 31, 2020 and December 31, 2019,the swap liability was $1,097 and $480, respectively. The Company continues to monitor the impact of thedissolution of LIBOR and its effect on our LIBOR-based interest rate swaps.
On September 4, 2020, the Company sold its Test and Inspection Services business for gross proceeds of$4,000. As a result of this divestiture, the Company has reclassified the results of this business into discontinued
33
operations. Due to the sale of this business, the Company recognized approximately $18,978 in tax benefits,including tax benefits recognized in discontinued operations, for the year ended December 31, 2020. In addition,the Company anticipates receiving approximately $9,008 in tax refunds within the next year due to extendedcarryback provisions in the CARES Act and the acceleration of existing deferred tax assets related to the sale.For additional information regarding the Test and Inspection Services sale, please refer to Note 3 of the Notes toConsolidated Financial Statements contained in this Annual Report on Form 10-K.
We believe that the combination of our cash and cash equivalents, cash generated from operations and thecapacity under our revolving credit facility will provide us with sufficient liquidity to provide the flexibility tooperate the business in a prudent manner, enable us to continue to service our outstanding debt and to selectivelypursue accretive bolt-on acquisitions to augment our core service offerings.
Backlog
Although backlog is not necessarily indicative of future operating results, the following table provides thebacklog by business segment:
December 31,2020 2019 2018
Rail Technologies and Services . . . . . . . . . . . . . . . . . . . . . . . . . . . $121,231 $103,694 $ 97,447
Infrastructure Solutions . . . . . . . . . . . . . . . . . . . . . . . . . . . . . . . . . 127,001 125,338 120,681
Total backlog . . . . . . . . . . . . . . . . . . . . . . . . . . . . . . . . . . . . . . . . . $248,232 $229,032 $218,128
While a considerable portion of our business is backlog driven, certain businesses, including the RailTechnologies business unit, are not driven by backlog and therefore have insignificant levels of backlogthroughout the year.
Critical Accounting Policies and Estimates
The accompanying consolidated financial statements have been prepared in conformity with accountingprinciples generally accepted in the United States. The preparation of the consolidated financial statementsrequires management to make estimates and judgments that affect the reported amount of assets, liabilities,revenues, and expenses, and the related disclosure of contingent assets and liabilities. The following criticalaccounting policies, which are reviewed by the Company’s Audit Committee of the Board of Directors, relate tothe Company’s more significant estimates and judgments used in the preparation of its consolidated financialstatements. Actual results could differ from those estimates.
For a summary of the Company’s significant accounting policies, see Part II, Item 8, Financial Statements andSupplementary Data, Note 1 to the Consolidated Financial Statements, which is incorporated by reference into thisItem 7.
Income Taxes — The recognition of deferred tax assets requires management to make judgments regardingthe future realization of these assets. As prescribed by the Financial Accounting Standards Board’s (“FASB”)Accounting Standards Codification (“ASC”) 740, “Income Taxes,” valuation allowances must be provided forthose deferred tax assets for which it is more likely than not (a likelihood of more than 50%) that some portion orall of the deferred tax assets will not be realized. This guidance requires management to evaluate positive andnegative evidence regarding the recoverability of deferred tax assets. The determination of whether the positiveevidence outweighs the negative evidence and quantification of the valuation allowance requires management tomake estimates and judgments of future financial results.
The Company evaluates all tax positions taken on its federal, state, and foreign tax filings to determine if theposition is more likely than not to be sustained upon examination. For positions that meet the more likely than not tobe sustained criteria, the largest amount of benefit to be realized upon ultimate settlement is determined on acumulative probability basis. A previously recognized tax position is derecognized when it is subsequentlydetermined that a tax position no longer meets the more likely than not threshold to be sustained. The evaluation ofthe sustainability of a tax position and the expected tax benefit is based on judgment, historical experience, andother assumptions. Actual results could differ from those estimates upon subsequent resolution of identified matters.
34

The Company’s income tax rate is significantly affected by the tax rate on global operations. In addition tolocal country tax laws and regulations, this rate depends on the extent earnings are indefinitely reinvested outsideof the United States. Indefinite reinvestment is determined by management’s judgment about and intentionsconcerning the future operations of the Company. There has been no material changes in the underlyingassumptions and estimates used in these calculations in the relevant period.
Refer to Part II, Item 8, Financial Statements and Supplementary Data, Note 14 which is incorporated byreference into this Item 7, for additional information regarding the Company’s deferred tax assets. TheCompany’s ability to realize these tax benefits may affect the Company’s reported income tax expense and netincome.
Revenue Recognition — We account for revenue in accordance with the ASC 606, “Revenue fromContracts with Customers,” whereby the unit of account is a performance obligation. The majority of theCompany’s revenue is from products transferred and services rendered to customers at a point in time. TheCompany recognizes revenue at the point in time at which the customer obtains control of the product or service,which is generally when product title passes to the customer upon shipment or the service has been rendered tothe customer. In limited cases, title does not transfer, and revenue is not recognized until the customer hasreceived the products at its physical location.
The Company also derives revenue from products and services provided under long-term agreements withits customers. The transaction price of a long-term agreement is allocated to each distinct performanceobligation. The majority of the Company’s long-term contracts have a single performance obligation as thepromise to transfer products or services is not separately identifiable from other promises in the contract and,therefore, not distinct. Revenue is measured as the amount of consideration the Company expects to receive inexchange for transferring products or providing services.
The Company’s performance obligations under long-term agreements with its customers are generallysatisfied as over time. Revenue under these long-term agreements is generally recognized over time either usingan input measure based upon the proportion of actual costs incurred to estimated total project costs or an inputmeasure based upon actual labor costs as a percentage of estimated total labor costs, depending upon whichmeasure the Company believes best depicts the Company’s performance to date under the terms of the contract.A certain portion of the Company’s revenue recognized over time under these long-term agreements isrecognized using an output method, specifically units delivered, based upon certain customer acceptance anddelivery requirements. Contract assets from over time contracts are recorded in “Inventories — net” within theConsolidated Balance Sheets and contract liabilities from over time contracts are recorded in “Deferred revenue”within the Consolidated Balance Sheets.
Accounting for these long-term agreements involves the use of various techniques to estimate total revenuesand costs. The Company estimates profit on these long-term agreements as the difference between total estimatedrevenues and expected costs to complete a contract and recognizes that profit over the life of the contract. Contractestimates are based on various assumptions to project the outcome of future events that may span several years.These assumptions include, among other things, labor productivity, cost and availability of materials, and timing offunding by customers. The nature of these long-term agreements may give rise to several types of variableconsiderations, such as claims, awards, and incentive fees. Historically, these amounts of variable considerationhave not been considered significant. Contract estimates may include additional revenue for submitted contractmodifications if there exists an enforceable right to the modification, the amount can be reasonably estimated, andits realization is probable. These estimates are based on historical collection experience, anticipated performance,and the Company’s best judgment at that time. These amounts are generally included in the contract’s transactionprice and are allocated over the remaining performance obligations. As significant changes in the above estimatescould impact the timing and amount of revenue and profitability of our long-term contracts, we review and updatecontract-related estimates regularly. In the event a contract loss becomes known, the entire amount of the estimatedloss is recognized in the Consolidated Statements of Operations. There has been no material changes in theunderlying assumptions and estimates used in these calculations in the relevant period.
See Part II, Item 8, Financial Statements and Supplementary Data, Note 3 to the Consolidated FinancialStatements, which is incorporated by reference into this Item 7.
35
Goodwill — Goodwill is the cost of an acquisition less the fair value of the identifiable net assets of theacquired business. Goodwill is required to be tested for impairment at least annually. The Company performs itsannual impairment test in the fourth quarter, or whenever events or changes in circumstances indicate that it ismore likely than not that the fair value of a reporting unit is less than its carrying amount.
The Company may first consider qualitative factors to assess whether there are indicators that it is morelikely than not that the fair value of a reporting unit may not exceed its carrying amount. The quantitativegoodwill impairment analysis involves comparing the fair value of a reporting unit to its carrying value,including goodwill. If the carrying amount of the reporting unit exceeds its fair value, an impairment loss equalto the excess amount up to the goodwill balance is recorded as an impairment to goodwill of the reporting unit.The Company uses a combination of a discounted cash flow method and a market approach to determine the fairvalues of the reporting units.
A number of significant assumptions and estimates are involved in the estimation of the fair value ofreporting units, including the identification of macroeconomic conditions, industry and market considerations,cost factors, and overall financial performance. The estimated fair value of a reporting unit is sensitive to changesin assumptions, including forecasted future operating cash flows, weighted-average cost of capital, terminalgrowth rates, and industry multiples.
The Company considers historical experience and available information at the time the fair values of itsreporting units are estimated. The Company believes the estimates and assumptions used in estimating the fairvalue of its reporting units are reasonable and appropriate; however, different assumptions and estimates couldmaterially impact the estimated fair value of its reporting units and the resulting determinations about goodwillimpairment. This could materially impact the Company’s Consolidated Statements of Operations andConsolidated Balance Sheets. There has been no material changes in the underlying assumptions and estimatesused in these calculations in the relevant period. Future estimates may differ materially from current estimatesand assumptions.
Additional information concerning the impairments is set forth in Part II, Item 8, Financial Statements andSupplementary Data, Note 4 to the Consolidated Financial Statements included herein, which is incorporated byreference into this Item 7.
Intangible Assets and Long-Lived Assets — The Company tests intangible assets and long-lived assets forimpairment whenever events or changes in circumstances indicate that the carrying value of an asset or assetgroup may not be recoverable. Recoverability of assets is determined by comparing the estimated undiscountedfuture cash flows of the asset or asset group to their carrying amount. If the carrying value of the assets exceedstheir estimated undiscounted future cash flows, an impairment loss would be determined as the differencebetween the fair value of the assets and its carrying value. Typically, the fair value of the assets would bedetermined using a discounted cash flow model which would be sensitive to judgments of what constitutes anasset group and certain assumptions such as estimated future financial performance, discount rates, and otherassumptions that marketplace participants would use in their estimates of fair value. There has been no materialchanges in the underlying assumptions and estimates used in these calculations in the relevant period. Theaccounting estimate related to asset impairments is highly susceptible to change from period to period because itrequires management to make assumptions about the existence of impairment indicators and cash flows overfuture years. These assumptions impact the amount of an impairment, which would have an impact on theConsolidated Statements of Operations.
Additional information concerning the impairments is set forth in Part II, Item 8, Financial Statements andSupplementary Data, Note 4 to the Consolidated Financial Statements included herein, which is incorporated byreference into this Item 7.
36
ITEM 7A. QUANTITATIVE AND QUALITATIVE DISCLOSURES ABOUT MARKET RISK
(Dollars in thousands)
Interest Rate Risk
In the ordinary course of business, the Company is exposed to interest rate risks that may adversely affectfunding costs associated with its variable-rate debt. To reduce the impact of interest rate changes on a portion ofthis variable-rate debt, the Company entered into forward starting interest rate swap agreements, whicheffectively convert a portion of the debt from a variable to a fixed-rate borrowing during the term of the swapcontracts. See Part II, Item 8, Financial Statements and Supplementary Data, Note 18, to the ConsolidatedFinancial Statements included herein, for additional information.
For the year ended December 31, 2020, a 1% change in the interest rate for variable rate debt would haveincreased or decreased interest expense by approximately $905.
The Company does not purchase or hold any derivative financial instruments for trading purposes. Atcontract inception, the Company designates its derivative instruments as hedges. The Company recognizes allderivative instruments on the balance sheet at fair value. Fluctuations in the fair values of derivative instrumentsdesignated as cash flow hedges are recorded in accumulated other comprehensive income and reclassified intoearnings within other income as the underlying hedged items affect earnings. To the extent that a change in aderivative does not perfectly offset the change in value of the interest rate being hedged, the ineffective portion isrecognized in earnings immediately.
The Company has entered into three forward starting LIBOR-based interest rate swap agreements withnotional values totaling $50,000. At December 31, 2020 and 2019, the interest rate swap liability was $1,097 and$480, respectively.
Foreign Currency Exchange Rate Risk
The Company is subject to exposures to changes in foreign currency exchange rates. The Company maymanage its exposure to changes in foreign currency exchange rates on firm sale and purchase commitments byentering into foreign currency forward contracts. The Company’s risk management objective is to reduce itsexposure to the effects of changes in exchange rates on these transactions over the duration of the transactions.The Company did not engage in foreign currency hedging transactions during the three-year period endedDecember 31, 2020.
37

ITEM 8. FINANCIAL STATEMENTS AND SUPPLEMENTARY DATA
Report of Independent Registered Public Accounting Firm
To the Stockholders and the Board of Directors of L.B. Foster Company and Subsidiaries
Opinion on the Financial Statements
We have audited the accompanying consolidated balance sheets of L.B. Foster Company and Subsidiaries(the Company) as of December 31, 2020 and 2019, the related consolidated statements of operations,comprehensive income (loss), stockholders’ equity and cash flows for each of the three years in the period endedDecember 31, 2020, and the related notes and financial statement schedule listed in the Index at Item 15 (a)(collectively referred to as the “consolidated financial statements”). In our opinion, the consolidated financialstatements present fairly, in all material respects, the financial position of the Company at December 31, 2020and 2019, and the results of its operations and its cash flows for each of the three years in the period endedDecember 31, 2020, in conformity with U.S. generally accepted accounting principles.
We also have audited, in accordance with the standards of the Public Company Accounting Oversight Board(United States) (PCAOB), the Company’s internal control over financial reporting as of December 31, 2020,based on criteria established in Internal Control-Integrated Framework issued by the Committee of SponsoringOrganizations of the Treadway Commission (2013 framework) and our report dated March 3, 2021 expressed anunqualified opinion thereon.
Basis for Opinion
These financial statements are the responsibility of the Company’s management. Our responsibility is toexpress an opinion on the Company’s financial statements based on our audits. We are a public accounting firmregistered with the PCAOB and are required to be independent with respect to the Company in accordance withthe U.S. federal securities laws and the applicable rules and regulations of the Securities and ExchangeCommission and the PCAOB.
We conducted our audits in accordance with the standards of the PCAOB. Those standards require that weplan and perform the audit to obtain reasonable assurance about whether the financial statements are free ofmaterial misstatement, whether due to error or fraud. Our audits included performing procedures to assess therisks of material misstatement of the financial statements, whether due to error or fraud, and performingprocedures that respond to those risks. Such procedures included examining, on a test basis, evidence regardingthe amounts and disclosures in the financial statements. Our audits also included evaluating the accountingprinciples used and significant estimates made by management, as well as evaluating the overall presentation ofthe financial statements. We believe that our audits provide a reasonable basis for our opinion.
Critical Audit Matters
The critical audit matters communicated below are matters arising from the current period audit of thefinancial statements that were communicated or required to be communicated to the audit committee and that:(1) relate to accounts or disclosures that are material to the financial statements and (2) involved our especiallychallenging, subjective or complex judgments. The communication of critical audit matters does not alter in anyway our opinion on the consolidated financial statements, taken as a whole, and we are not, by communicatingthe critical audit matters below, providing separate opinions on the critical audit matters or on the accounts ordisclosures to which they relate.
38

Revenue recognition — contract estimates to complete
Description of theMatter
As explained in Notes 1 and 4 to the consolidated financial statements, revenue is recog-nized when the Company satisfies its performance obligations under a contract. TheCompany’s performance obligations under long-term agreements with its customers aregenerally satisfied over time. Revenue under these long-term agreements is generallyrecognized over time either using an input measure based upon the proportion of actualcosts incurred to estimated total project costs or an input measure based upon actual laborcosts as a percentage of estimated total labor costs, depending upon which measure theCompany believes best depicts the Company’s performance to date under the terms of thecontract. Accounting for these long-term agreements involves the use of various tech-niques to estimate total revenues and costs. Contract estimates are based on variousassumptions to project the outcome of future events that may span several years. Theseassumptions include, among other things, labor productivity, cost and availability of mate-rials, and timing of funding by customers. Significant changes in the above estimatescould impact the timing and amount of revenue and profitability of the Company’s long-term contracts.
Auditing these estimates requires subjective auditor judgment because of the significantmanagement judgment necessary to develop the estimated total project costs and laborcosts at completion due to the size and identified risks for each contract.
How We Addressedthe Matter in OurAudit
We obtained an understanding, evaluated the design, and tested the operating effective-ness of relevant internal controls over the Company’s process relating to the determinationof estimates for long-term projects. For example, we evaluated the design and tested theoperating effectiveness of controls over management’s review of the current status oflong-term projects, accumulation of costs incurred and costs remaining to complete.
To test the total estimates to complete for contracts, our audit procedures included, amongothers, obtaining an understanding of the contract, evaluating the consistency of estimatedcosts with the initial budget, and comparing the composition of costs to date with thecomposition of the costs in the estimates to complete for a sample of contracts. We alsoperformed a retrospective review of management’s cost estimates for a sample of com-pleted contracts by comparing initial estimates with the actual historical data to assessmanagement’s ability to estimate.
Income Tax — valuation allowances on deferred tax assets
Description of theMatter
As explained in Notes 1 and 14 to the consolidated financial statements, deferred taxassets and liabilities are recognized for the future tax consequences attributable to differ-ences between the financial statement carrying amounts of assets and liabilities and theirrespective tax bases. The Company makes judgments regarding the future realization ofdeferred tax assets and a valuation allowance must be provided for those assets which it ismore likely than not (a likelihood of more than 50%) that some portion or all of the assetswill not be realized. The Company evaluates positive and negative evidence regarding therecoverability of deferred tax assets. The determination of whether the positive evidenceoutweighs the negative evidence and the quantification of the valuation allowance requiresthe Company to make estimates and judgments of future financial results. AtDecember 31, 2020, the Company had total deferred tax assets of $47.1 million, net of$1.5 million of valuation allowances.
Auditing the Company’s assertion that it was more likely than not that the deferred taxassets would be realized and the related measurement of the valuation allowance wascomplex due to the highly judgmental nature of the projections of future sources and
39
amounts of taxable income, which rely on significant assumptions, such as the timing offuture reversals of existing temporary differences, assessing the impact of tax planningstrategies, and making projections of future taxable income. Certain of these significantassumptions are forward looking and could be materially affected by future market oreconomic conditions.
How We Addressedthe Matter in OurAudit
We obtained an understanding, evaluated the design, and tested the operating effective-ness of controls over the Company’s process to assess the realizability of the deferred taxassets and measurement of the valuation allowances, including controls over manage-ment’s review of the significant assumptions described above.
To test the realizability of the deferred tax assets and measurement of the valuation allow-ances, our audit procedures included, among others, evaluating the methodologies used,the significant assumptions for each type of evidence discussed above, and testing thecompleteness and accuracy of the underlying data used by the Company in its analysis.For example, as part of our evaluation of management’s significant assumptions, weinvolved our tax professionals to assist in our evaluation of the relevant tax laws and regu-lations in the various jurisdictions, including considering whether the estimated futuresources of taxable income were of the appropriate character to utilize the deferred taxassets in the relevant time period. We evaluated the cumulative income or loss positions ofthe Company’s various jurisdictions, assessed management’s model of estimated futurereversals of existing temporary differences and evaluated the Company’s forecasts offuture profits for the purposes of assessing the reasonableness of the Company’s estimatedfuture taxable income. We also compared the forecast of future taxable income with otherforecasted financial information prepared by the Company and performed sensitivityanalyses of the significant assumptions to evaluate the changes in realizability of deferredtax assets that would result from changes in the assumptions. In addition, we evaluated theCompany’s income tax disclosures related to the matters described above.
/s/ Ernst & Young LLP
We have served as the Company’s auditor since 1990
Pittsburgh, PennsylvaniaMarch 3, 2021
40

L.B. FOSTER COMPANY AND SUBSIDIARIES
CONSOLIDATED BALANCE SHEETS(In thousands, except share data)
December 31,2020 2019
ASSETS
Current assets:Cash and cash equivalents . . . . . . . . . . . . . . . . . . . . . . . . . . . . . . . . . . . . . . . . . . . . . . . . . . . . . . . . . $ 7,564 $ 14,178Accounts receivable — net (Note 6) . . . . . . . . . . . . . . . . . . . . . . . . . . . . . . . . . . . . . . . . . . . . . . . . . 58,298 73,616Inventories — net (Note 7) . . . . . . . . . . . . . . . . . . . . . . . . . . . . . . . . . . . . . . . . . . . . . . . . . . . . . . . . . 116,460 118,461Other current assets . . . . . . . . . . . . . . . . . . . . . . . . . . . . . . . . . . . . . . . . . . . . . . . . . . . . . . . . . . . . . . 12,997 4,101Current assets of discontinued operations (Note 3) . . . . . . . . . . . . . . . . . . . . . . . . . . . . . . . . . . . . . . — 6,308
Total current assets . . . . . . . . . . . . . . . . . . . . . . . . . . . . . . . . . . . . . . . . . . . . . . . . . . . . . . . . . . . 195,319 216,664Property, plant, and equipment — net (Note 8) . . . . . . . . . . . . . . . . . . . . . . . . . . . . . . . . . . . . . . . . . 62,085 60,435Operating lease right-of-use assets — net (Note 9) . . . . . . . . . . . . . . . . . . . . . . . . . . . . . . . . . . . . . . 16,069 11,280
Other assets:Goodwill (Note 5) . . . . . . . . . . . . . . . . . . . . . . . . . . . . . . . . . . . . . . . . . . . . . . . . . . . . . . . . . . . . . . . . 20,340 19,565Other intangibles — net (Note 5) . . . . . . . . . . . . . . . . . . . . . . . . . . . . . . . . . . . . . . . . . . . . . . . . . . . . 36,897 42,113Deferred tax assets (Note 14) . . . . . . . . . . . . . . . . . . . . . . . . . . . . . . . . . . . . . . . . . . . . . . . . . . . . . . . 38,481 19,522Other assets . . . . . . . . . . . . . . . . . . . . . . . . . . . . . . . . . . . . . . . . . . . . . . . . . . . . . . . . . . . . . . . . . . . . . 1,204 1,119Other assets of discontinued operations (Note 3) . . . . . . . . . . . . . . . . . . . . . . . . . . . . . . . . . . . . . . . . — 34,473
TOTAL ASSETS . . . . . . . . . . . . . . . . . . . . . . . . . . . . . . . . . . . . . . . . . . . . . . . . . . . . . . . . . . . . . . . . . $370,395 $405,171
LIABILITIES AND STOCKHOLDERS’ EQUITYCurrent liabilities:
Accounts payable . . . . . . . . . . . . . . . . . . . . . . . . . . . . . . . . . . . . . . . . . . . . . . . . . . . . . . . . . . . . . . . . $ 54,787 $ 63,029Deferred revenue (Note 4) . . . . . . . . . . . . . . . . . . . . . . . . . . . . . . . . . . . . . . . . . . . . . . . . . . . . . . . . . 7,144 8,446Accrued payroll and employee benefits . . . . . . . . . . . . . . . . . . . . . . . . . . . . . . . . . . . . . . . . . . . . . . . 9,182 13,194Current portion of accrued settlement (Note 18) . . . . . . . . . . . . . . . . . . . . . . . . . . . . . . . . . . . . . . . . 8,000 8,000Current maturities of long-term debt (Note 10) . . . . . . . . . . . . . . . . . . . . . . . . . . . . . . . . . . . . . . . . . 119 2,877Other accrued liabilities . . . . . . . . . . . . . . . . . . . . . . . . . . . . . . . . . . . . . . . . . . . . . . . . . . . . . . . . . . . 15,740 15,560Current liabilities of discontinued operations (Note 3) . . . . . . . . . . . . . . . . . . . . . . . . . . . . . . . . . . . 330 5,638
Total current liabilities . . . . . . . . . . . . . . . . . . . . . . . . . . . . . . . . . . . . . . . . . . . . . . . . . . . . . . . . . 95,302 116,744Long-term debt (Note 10) . . . . . . . . . . . . . . . . . . . . . . . . . . . . . . . . . . . . . . . . . . . . . . . . . . . . . . . . . . 44,905 55,275Deferred tax liabilities (Note 14) . . . . . . . . . . . . . . . . . . . . . . . . . . . . . . . . . . . . . . . . . . . . . . . . . . . . 4,085 4,751Long-term portion of accrued settlement (Note 18) . . . . . . . . . . . . . . . . . . . . . . . . . . . . . . . . . . . . . . 24,000 32,000Long-term operating lease liabilities (Note 9) . . . . . . . . . . . . . . . . . . . . . . . . . . . . . . . . . . . . . . . . . . 13,516 9,012Other long-term liabilities . . . . . . . . . . . . . . . . . . . . . . . . . . . . . . . . . . . . . . . . . . . . . . . . . . . . . . . . . 11,757 11,916Long-term liabilities of discontinued operations (Note 3) . . . . . . . . . . . . . . . . . . . . . . . . . . . . . . . . . — 5,611
Stockholders’ equity:Common stock, par value $0.01, authorized 20,000,000 shares; shares issued at December 31,
2020 and December 31, 2019, 11,115,779; shares outstanding at December 31, 2020 andDecember 31, 2019, 10,563,290 and 10,422,091, respectively (Note 11) . . . . . . . . . . . . . . . . . . . 111 111
Paid-in capital . . . . . . . . . . . . . . . . . . . . . . . . . . . . . . . . . . . . . . . . . . . . . . . . . . . . . . . . . . . . . . . . . . . 44,583 49,204Retained earnings . . . . . . . . . . . . . . . . . . . . . . . . . . . . . . . . . . . . . . . . . . . . . . . . . . . . . . . . . . . . . . . . 165,107 157,525Treasury stock — at cost, common stock, shares at December 31, 2020 and December 31, 2019,
552,489 and 693,688, respectively (Note 11) . . . . . . . . . . . . . . . . . . . . . . . . . . . . . . . . . . . . . . . . . (12,703) (16,795)Accumulated other comprehensive loss (Note 12) . . . . . . . . . . . . . . . . . . . . . . . . . . . . . . . . . . . . . . . (20,268) (20,183)
Total stockholders’ equity . . . . . . . . . . . . . . . . . . . . . . . . . . . . . . . . . . . . . . . . . . . . . . . . . . . . . . 176,830 169,862
TOTAL LIABILITIES AND STOCKHOLDERS’ EQUITY . . . . . . . . . . . . . . . . . . . . . . . . . . . . . $370,395 $405,171
The accompanying notes are an integral part of these Consolidated Financial Statements.
41

L.B. FOSTER COMPANY AND SUBSIDIARIES
CONSOLIDATED STATEMENTS OF OPERATIONS(In thousands, except share data)
Year Ended December 31,2020 2019 2018
Sales of goods . . . . . . . . . . . . . . . . . . . . . . . . . . . . . . . . . . . . . . . . . . . . . . . . . $421,307 $505,200 $459,694
Sales of services . . . . . . . . . . . . . . . . . . . . . . . . . . . . . . . . . . . . . . . . . . . . . . . 76,104 111,228 121,370
Total net sales . . . . . . . . . . . . . . . . . . . . . . . . . . . . . . . . . . . . . . . . . . . . . . . . . 497,411 616,428 581,064
Cost of goods sold . . . . . . . . . . . . . . . . . . . . . . . . . . . . . . . . . . . . . . . . . . . . . 344,306 414,461 378,398
Cost of services sold . . . . . . . . . . . . . . . . . . . . . . . . . . . . . . . . . . . . . . . . . . . . 58,099 81,029 89,198
Total cost of sales . . . . . . . . . . . . . . . . . . . . . . . . . . . . . . . . . . . . . . . . . . . . . . 402,405 495,490 467,596
Gross profit . . . . . . . . . . . . . . . . . . . . . . . . . . . . . . . . . . . . . . . . . . . . . . . . . . . 95,006 120,938 113,468
Selling and administrative expenses . . . . . . . . . . . . . . . . . . . . . . . . . . . . . . . 73,644 82,524 82,745
Amortization expense (Note 4) . . . . . . . . . . . . . . . . . . . . . . . . . . . . . . . . . . . 5,729 6,445 6,966
Concrete Tie Settlement expense (Note 18) . . . . . . . . . . . . . . . . . . . . . . . . . . — — 43,400
Interest expense — net . . . . . . . . . . . . . . . . . . . . . . . . . . . . . . . . . . . . . . . . . . 3,761 4,911 6,134
Other (income) expense — net (Note 19) . . . . . . . . . . . . . . . . . . . . . . . . . . . (2,110) 2,919 (1,208)
Income (loss) from continuing operations before income taxes . . . . . . . . . . 13,982 24,139 (24,569)
Income tax (benefit) expense . . . . . . . . . . . . . . . . . . . . . . . . . . . . . . . . . . . . . (11,841) (23,835) 6,017
Income (loss) from continuing operations . . . . . . . . . . . . . . . . . . . . . . . . . . . 25,823 47,974 (30,586)
Discontinued operations:
Loss from discontinued operations before income taxes . . . . . . . . . . . . . . . . (23,979) (6,742) (2,142)
Income tax benefit . . . . . . . . . . . . . . . . . . . . . . . . . . . . . . . . . . . . . . . . . . . . . (5,738) (1,336) (1,560)
Loss from discontinued operations (Note 3) . . . . . . . . . . . . . . . . . . . . . . . . . (18,241) (5,406) (582)
Net income (loss) . . . . . . . . . . . . . . . . . . . . . . . . . . . . . . . . . . . . . . . . . . . . . . $ 7,582 $ 42,568 $ (31,168)
Basic earnings (loss) per common share:
From continuing operations . . . . . . . . . . . . . . . . . . . . . . . . . . . . . . . . . . . . . . $ 2.45 $ 4.61 $ (2.95)
From discontinued operations . . . . . . . . . . . . . . . . . . . . . . . . . . . . . . . . . . . . (1.73) (0.52) (0.06)
Basic earnings (loss) per common share . . . . . . . . . . . . . . . . . . . . . . . . . . . . $ 0.72 $ 4.09 $ (3.01)
Diluted earnings (loss) per common share:
From continuing operations . . . . . . . . . . . . . . . . . . . . . . . . . . . . . . . . . . . . . . $ 2.42 $ 4.51 $ (2.95)
From discontinued operations . . . . . . . . . . . . . . . . . . . . . . . . . . . . . . . . . . . . (1.71) (0.51) (0.06)
Diluted earnings (loss) per common share (Note 13) . . . . . . . . . . . . . . . . . . $ 0.71 $ 4.00 $ (3.01)
The accompanying notes are an integral part of these Consolidated Financial Statements.
42

L.B. FOSTER COMPANY AND SUBSIDIARIES
CONSOLIDATED STATEMENTS OF COMPREHENSIVE INCOME (LOSS)(In thousands)
Year Ended December 31,2020 2019 2018
Net income (loss) . . . . . . . . . . . . . . . . . . . . . . . . . . . . . . . . . . . . . . . . . . . . $25,823 $47,974 $(30,586)
Other comprehensive (loss) income, net of tax:
Foreign currency translation adjustment . . . . . . . . . . . . . . . . . . . . . . . . . . . 1,500 2,033 (4,405)
Unrealized (loss) gain on cash flow hedges, net of tax benefit of $277,$296, and $0, respectively . . . . . . . . . . . . . . . . . . . . . . . . . . . . . . . . . . . . (809) (859) 453
Cash flow hedges reclassified to earnings, net of tax expense of $197,$0, and $0, respectively . . . . . . . . . . . . . . . . . . . . . . . . . . . . . . . . . . . . . . 273 — —
Pension and post-retirement benefit plans (expense) benefit, net of tax(benefit) expense of $(325), $523, and $(36), respectively . . . . . . . . . . (1,070) 1,406 (543)
Reclassification of pension liability adjustments to earnings, net of taxexpense of $9, $26, and $4, respectively* . . . . . . . . . . . . . . . . . . . . . . . . 21 61 71
Other comprehensive (loss) income . . . . . . . . . . . . . . . . . . . . . . . . . . . . . . (85) 2,641 (4,424)
Comprehensive income (loss) . . . . . . . . . . . . . . . . . . . . . . . . . . . . . . . . . . . $25,738 $50,615 $(35,010)
* Reclassifications out of Accumulated other comprehensive loss for pension obligations are reflected in sell-ing and administrative expense.
The accompanying notes are an integral part of these Consolidated Financial Statements.
43

L.B. FOSTER COMPANY AND SUBSIDIARIES
CONSOLIDATED STATEMENTS OF CASH FLOWS(In thousands)
Year EndedDecember 31,
2020 2019 2018
CASH FLOWS FROM OPERATING ACTIVITIES:Income (loss) from continuing operations . . . . . . . . . . . . . . . . . . . . . . . . . . . . . . . . . . $ 25,823 $ 47,974 $ (30,586)Adjustments to reconcile net income (loss) to cash provided by (used in) continuing
operating activities:Deferred income taxes . . . . . . . . . . . . . . . . . . . . . . . . . . . . . . . . . . . . . . . . . . . . . (4,317) (30,392) (1,598)Depreciation . . . . . . . . . . . . . . . . . . . . . . . . . . . . . . . . . . . . . . . . . . . . . . . . . . . . . 7,850 7,944 8,066Amortization . . . . . . . . . . . . . . . . . . . . . . . . . . . . . . . . . . . . . . . . . . . . . . . . . . . . . 5,729 6,445 6,966Concrete Tie Settlement expense (Note 18) . . . . . . . . . . . . . . . . . . . . . . . . . . . . . — — 43,400Equity (income) loss in nonconsolidated investments . . . . . . . . . . . . . . . . . . . . . (20) (17) 7Loss (gain) on sales and disposals of property, plant, and equipment . . . . . . . . . 47 (103) 511Loss on derivative . . . . . . . . . . . . . . . . . . . . . . . . . . . . . . . . . . . . . . . . . . . . . . . . . 273 — —Stock-based compensation . . . . . . . . . . . . . . . . . . . . . . . . . . . . . . . . . . . . . . . . . . 1,136 3,155 3,836Pension settlement . . . . . . . . . . . . . . . . . . . . . . . . . . . . . . . . . . . . . . . . . . . . . . . . — 2,210 —
Change in operating assets and liabilities:Accounts receivable . . . . . . . . . . . . . . . . . . . . . . . . . . . . . . . . . . . . . . . . . . . . . . . 15,722 3,368 (9,654)Inventories . . . . . . . . . . . . . . . . . . . . . . . . . . . . . . . . . . . . . . . . . . . . . . . . . . . . . . 3,279 6,500 (23,502)Other current assets . . . . . . . . . . . . . . . . . . . . . . . . . . . . . . . . . . . . . . . . . . . . . . . . 583 1,349 25Prepaid income tax . . . . . . . . . . . . . . . . . . . . . . . . . . . . . . . . . . . . . . . . . . . . . . . . (9,108) 437 (249)Other noncurrent assets . . . . . . . . . . . . . . . . . . . . . . . . . . . . . . . . . . . . . . . . . . . . . (2,870) (402) 1,319Accounts payable . . . . . . . . . . . . . . . . . . . . . . . . . . . . . . . . . . . . . . . . . . . . . . . . . (8,947) (13,024) 24,726Deferred revenue . . . . . . . . . . . . . . . . . . . . . . . . . . . . . . . . . . . . . . . . . . . . . . . . . . (1,315) 1782 (3,491)Accrued payroll and employee benefits . . . . . . . . . . . . . . . . . . . . . . . . . . . . . . . . (4,085) 1,130 1,637Accrued settlement . . . . . . . . . . . . . . . . . . . . . . . . . . . . . . . . . . . . . . . . . . . . . . . . (8,000) (10,000) —Other current liabilities . . . . . . . . . . . . . . . . . . . . . . . . . . . . . . . . . . . . . . . . . . . . . (4,074) (998) 5,893Other liabilities . . . . . . . . . . . . . . . . . . . . . . . . . . . . . . . . . . . . . . . . . . . . . . . . . . . 2,843 (1116) (770)
Net cash provided by continuing operating activities . . . . . . . . . . . . . . . . . . . . . . . . 20,549 26,242 26,536
Net cash (used in) provided by discontinued operating activities . . . . . . . . . . . . . . (3,631) 3,055 (572)
CASH FLOWS FROM INVESTING ACTIVITIES:Proceeds from the sale of property, plant, and equipment . . . . . . . . . . . . . . . . . . 16 930 2,309Capital expenditures on property, plant, and equipment . . . . . . . . . . . . . . . . . . . (9,179) (6,026) (3,658)Acquisition . . . . . . . . . . . . . . . . . . . . . . . . . . . . . . . . . . . . . . . . . . . . . . . . . . . . . . (1,156) — —Proceeds from sale of equity method investment . . . . . . . . . . . . . . . . . . . . . . . . . — — 3,875Repayment of revolving line of credit from equity method investment . . . . . . . . — — 1,235
Net cash (used in) provided by continuing investing activities . . . . . . . . . . . . . . . . (10,319) (5,096) 3,761
Net cash provided by (used in) discontinued investing activities . . . . . . . . . . . . . . . 2,278 (2,584) (1,513)
CASH FLOWS FROM FINANCING ACTIVITIES:Repayments of debt . . . . . . . . . . . . . . . . . . . . . . . . . . . . . . . . . . . . . . . . . . . . . . . (172,892) (210,286) (195,202)Proceeds from debt . . . . . . . . . . . . . . . . . . . . . . . . . . . . . . . . . . . . . . . . . . . . . . . . 159,778 193,534 140,181Debt issuance costs . . . . . . . . . . . . . . . . . . . . . . . . . . . . . . . . . . . . . . . . . . . . . . . . (498) (836) —Treasury stock acquisitions . . . . . . . . . . . . . . . . . . . . . . . . . . . . . . . . . . . . . . . . . . (1,665) (621) (316)
Net cash used in continuing financing activities . . . . . . . . . . . . . . . . . . . . . . . . . . . (15,277) (18,209) (55,337)
Net cash (used in) provided by discontinued financing activities . . . . . . . . . . . . . . (19) (37) 37
Effect of exchange rate changes on cash and cash equivalents . . . . . . . . . . . . . . . . . . (195) 525 (308)Net (decrease) increase in cash and cash equivalents . . . . . . . . . . . . . . . . . . . . . . . . . . (6,614) 3,896 (27,396)Cash and cash equivalents at beginning of period . . . . . . . . . . . . . . . . . . . . . . . . . . . . 14,178 10,282 37,678
Cash and cash equivalents at end of period . . . . . . . . . . . . . . . . . . . . . . . . . . . . . . . . . $ 7,564 $ 14,178 $ 10,282
Supplemental disclosure of cash flow information:Interest paid . . . . . . . . . . . . . . . . . . . . . . . . . . . . . . . . . . . . . . . . . . . . . . . . . . . . . . $ 3,266 $ 4,587 $ 5,577Income taxes paid . . . . . . . . . . . . . . . . . . . . . . . . . . . . . . . . . . . . . . . . . . . . . . . . . $ 2,625 $ 6,513 $ 4,512
The accompanying notes are an integral part of these Consolidated Financial Statements.
44

L.B. FOSTER COMPANY AND SUBSIDIARIES
CONSOLIDATED STATEMENTS OF STOCKHOLDERS’ EQUITY(In thousands, except share data)
CommonStock
Paid-inCapital
RetainedEarnings
TreasuryStock
AccumulatedOther
ComprehensiveLoss Total
(In thousands, except share data)Balance, January 1, 2018 . . . . . . . . . . . . . . . . . . $111 $45,017 $145,797 $(18,662) $(17,767) $154,496
Adjustment to adopt ASU 2016-16 . . . . . . . . . . — — (305) — — (305)Net loss . . . . . . . . . . . . . . . . . . . . . . . . . . . . . . . — — (31,168) — — (31,168)Other comprehensive loss, net of tax:
Pension liability adjustment . . . . . . . . . . . . . — — — — (472) (472)Foreign currency translation adjustment . . . . — — — — (4,405) (4,405)Unrealized derivative gain on cash flow
hedges . . . . . . . . . . . . . . . . . . . . . . . . . . . . — — — — 453 453Issuance of 25,431 common shares, net of
shares withheld for taxes . . . . . . . . . . . . . . . . — (813) — 497 — (316)Stock-based compensation and related excess
tax benefit . . . . . . . . . . . . . . . . . . . . . . . . . . . — 3,836 — — — 3,836
Balance, December 31, 2018 . . . . . . . . . . . . . . . 111 48,040 114,324 (18,165) (22,191) 122,119
Adjustment to adopt ASU 2018-02 . . . . . . . . . . — — 633 — (633) —Net income . . . . . . . . . . . . . . . . . . . . . . . . . . . . . — — 42,568 — — 42,568Other comprehensive income, net of tax:
Pension liability adjustment . . . . . . . . . . . . . — — — — 1,467 1,467Foreign currency translation adjustment . . . . — — — — 2,033 2,033Unrealized derivative loss on cash flow
hedges . . . . . . . . . . . . . . . . . . . . . . . . . . . . — — — — (859) (859)Issuance of 56,084 common shares, net of
shares withheld for taxes . . . . . . . . . . . . . . . . — (1,991) — 1,370 — (621)Stock-based compensation . . . . . . . . . . . . . . . . — 3,155 — — — 3,155
Balance, December 31, 2019 . . . . . . . . . . . . . . . 111 49,204 157,525 (16,795) (20,183) 169,862
Net income . . . . . . . . . . . . . . . . . . . . . . . . . . . . . — — 7,582 — — 7,582Other comprehensive loss, net of tax:
Pension liability adjustment . . . . . . . . . . . . . — — — — (1,049) (1,049)Foreign currency translation adjustment . . . . — — — — 1,500 1,500Unrealized derivative loss on cash flow
hedges . . . . . . . . . . . . . . . . . . . . . . . . . . . . — — — — (809) (809)Cash flow hedges reclassified to earnings . . . — — — — 273 273
Issuance of 141,199 common shares, net ofshares withheld for taxes . . . . . . . . . . . . . . . . — (5,757) — 4,092 — (1,665)
Stock-based compensation . . . . . . . . . . . . . . . . — 1,136 — — — 1,136
Balance, December 31, 2020 . . . . . . . . . . . . . . . $111 $44,583 $165,107 $(12,703) $(20,268) $176,830
The accompanying notes are an integral part of these Consolidated Financial Statements.
45

L.B. FOSTER COMPANY AND SUBSIDIARIES
NOTES TO CONSOLIDATED FINANCIAL STATEMENTS(Dollars in thousands, except share data unless otherwise noted)
Note 1. Summary of Significant Accounting Policies
Organization, operations, and basis of consolidation
The consolidated financial statements include the accounts of L.B. Foster Company and its wholly-ownedsubsidiaries, joint ventures, and partnerships in which a controlling interest is held. Inter-company transactionsand accounts have been eliminated. The Company utilizes the equity method of accounting for companies whereits ownership is less than or equal to 50% and significant influence exists.
L.B. Foster Company (“Company”) provides products and services for the rail industry and solutions tosupport critical infrastructure projects. The Company’s innovative engineering and product developmentsolutions inspire the safety, reliability, and performance of it’s customer’s challenging requirements. TheCompany maintains locations in North America, Europe, and Asia. The Company is organized and operates intwo business segments: Rail Technologies and Services (“Rail”) and Infrastructure Solutions. The Rail segmentis comprised of several manufacturing and distribution businesses that provide a variety of products and servicesfor freight and passenger railroads and industrial companies throughout the world. The Infrastructure Solutionssegment is composed of precast concrete products, piling, fabricated bridge, protective coating, threading andprecision measurement offerings across North America.
Use of estimates
The preparation of financial statements in conformity with U.S. generally accepted accounting principles(“U.S. GAAP”) requires management to make estimates, judgements, and assumptions that affect the amountsreported in the financial statements and accompanying notes. Actual results could differ from those estimates andchanges in these estimates are recorded when known.
Significant accounting policies
Cash and cash equivalents
The Company considers cash and other instruments with maturities of three months or less when purchasedto be cash and cash equivalents. The Company invests available funds in a manner to preserve investmentprincipal and maintain liquidity, while seeking the highest yield available.
Cash and cash equivalents held in non-domestic accounts were $6,995 and $13,660 as of December 31,2020 and 2019, respectively. Included in non-domestic cash equivalents are investments in bank term deposits ofapproximately $18 and $17 as of December 31, 2020 and 2019, respectively. The carrying amountsapproximated fair value due to the short maturity of the instruments.
Inventory
Inventory is valued at the lower of average cost or net realizable value. Slow-moving inventory is reviewedand adjusted regularly, based upon product knowledge, physical inventory observation, inventory turnover, andthe age of the inventory. Inventory contains product costs, including inbound freight, direct labor, overhead costsrelating to the manufacturing and distribution of products, and absorption costs representing the excessmanufacturing or production costs over the amounts charged to the cost of sales or services.
Property, plant, and equipment
Depreciation and amortization are provided on a straight-line basis over the estimated useful lives of 7 to 40years for buildings and 2 to 50 years for machinery and equipment. Leasehold improvements are amortized over 7to 19 years, which represent the lives of the respective leases or the lives of the improvements, whichever is shorter.Depreciation expense is recorded within “Cost of goods sold,” “Cost of services sold,” and “Selling andadministrative expenses” on the Consolidated Statements of Operations based upon the particular asset’s use. TheCompany reviews a long-lived asset for impairment whenever events or changes in circumstances indicate that
46

the carrying amount of the asset may not be recoverable. The Company recognizes an impairment loss if thecarrying amount of a long-lived asset is not recoverable and exceeds its fair value. There were no property, plant,and equipment impairments recorded for the years ended December 31, 2020, 2019, and 2018.
Maintenance, repairs, and minor renewals are charged to operations as incurred. Major renewals andbetterments that substantially extend the useful life of the property are capitalized at cost. Upon the sale or otherdisposition of assets, the costs and related accumulated depreciation and amortization are removed from theaccounts and the resulting gain or loss, if any, is reflected in “Other (income) expense — net” in theConsolidated Statements of Operations.
Allowance for doubtful accounts
On January 1, 2020, the Company adopted ASU 2016-13, “Financial Instruments — Credit Losses (Topic326): Measurement of Credit Losses on Financial Instruments” (“ASU 2016-13”), and all the relatedamendments using the modified retrospective approach, which did not result in any changes to the previouslyreported financial information. The updates related to ASU 2016-13 were applied to assets held as of January 1,2020.
In accordance with adoption of the new standard, the Company evaluated and revised its policiessurrounding the allowance for credit losses for trade receivables. The Company established the allowance forcredit losses by calculating the amount to reserve based on the age of a given trade receivable and consideringhistorical collection patterns and bad debt expense experience, in addition to any other relevant subjectiveadjustments to individual receivables made by management. The Company also considered current and expectedfuture market and other conditions. Trade receivables are pooled within the calculation based on a range of ages,which appropriately groups receivables of similar credit risk together.
The established reserve thresholds to calculate the allowance for credit loss are based on and supported byhistoric collection patterns and bad debt expense incurred by the Company, as well as the expectation thatcollection patterns and bad debt expense will continue to adhere to patterns observed in recent years, which wasformed based on trends observed as well as current and expected future conditions, including the estimatedeffects of the COVID-19 pandemic. Management maintains high-quality credit review practices as well aspositive customer relationships that further mitigate credit risk. Management monitors and reviews thecontributing factors to the Company’s reserve, and makes any appropriate revisions as they become necessary.Reserves for uncollectible accounts are recorded as part of “Selling and administrative expenses” in theConsolidated Statements of Operations.
Goodwill and other intangible assets
Goodwill is the cost of an acquisition less the fair value of the identifiable net assets of the acquiredbusiness. Goodwill is tested annually for impairment or more often if there are indicators of impairment within areporting unit. A reporting unit is an operating segment or a component of an operating segment for whichdiscrete financial information is available and reviewed by management on a regular basis. The goodwillimpairment test involves comparing the fair value of a reporting unit to its carrying value, including goodwill. Ifthe carrying amount of the reporting unit exceeds its fair value, an impairment loss equal to the excess amount upto the goodwill balance is recorded as a component of operations. The Company performs its annual impairmenttests in the fourth quarter.
The Company’s fourth quarter 2020 annual test included the assessment of a quantitative analysis todetermine whether it was more likely than not that the fair value of each reporting unit is less than its carryingvalue. The quantitative assessment considers fair value as the price that would be received to sell an asset or paidto transfer a liability in an orderly transaction between market participants at the measurement date. TheCompany’s quantitative analysis considered and evaluated each of the three traditional approaches to value: theincome approach, the market approach, and the asset approach. The Company primarily relied on the discountedcash flow method within the income approach to value the reporting units. There was no goodwill impairmentrecognized during the years ended December 31, 2020, 2019, and 2018. The Company continues to monitor therecoverability of the long-lived assets associated with certain reporting units of the Company and the long-termfinancial projections of the businesses. Sustained declines in the markets the Company serves may result infuture long-lived asset impairment.
47

The Company has no indefinite-lived intangible assets. The Company reviews a long-lived intangible assetfor impairment whenever events or changes in circumstances indicate that the carrying amount of the asset maynot be recoverable. All intangible assets are amortized over their estimated useful lives. There were no definite-lived intangible asset impairments during the years ended December 31, 2020, 2019, and 2018.
Environmental remediation and compliance
Environmental remediation costs are accrued when a liability is probable and costs are estimable.Environmental compliance costs, which principally include the disposal of waste generated by routineoperations, are expensed as incurred. Capitalized environmental costs, when appropriate, are depreciated overtheir useful life. Reserves are not reduced by potential claims for recovery and are not discounted. Claims forrecovery are recognized as agreements are reached with third parties or as amounts are received. Reserves areperiodically reviewed throughout the year and adjusted to reflect current remediation progress, prospectiveestimates of required activity, and other factors that may be relevant, including changes in technology orregulations. See Note 18 for additional information regarding the Company’s outstanding environmental andlitigation reserves.
Revenue recognition
The Company’s revenues are comprised of product and service sales, including products and servicesprovided under long-term agreements with its customers. All revenue is recognized when the Company satisfiesits performance obligations under the respective contract, either implicit or explicit, by transferring the promisedproduct or rendering a service to its customer either when or as its customer obtains control of the product or theservice is rendered. Deferred revenue consists of customer billings or payments received for which the revenuerecognition criteria have not yet been met as well as contract liabilities (billings in excess of costs) on over timecontracts. Advance payments from customers typically relate to contracts for which the Company hassignificantly fulfilled its obligations, but due to the Company’s continuing involvement with the project, revenueis precluded from being recognized until the performance obligation is met for the customer. See Note 4 foradditional information.
Product warranty
The Company maintains a current warranty liability for the repair or replacement of defective products. Forcertain manufactured products, an accrual is made on a monthly basis as a percentage of cost of sales based uponhistorical experience. For long-lived construction products, a warranty is established when the claim is knownand quantifiable. The product warranty accrual is periodically adjusted based on the identification or resolutionof known individual product warranty claims or due to changes in the Company’s historical warranty experience.As of December 31, 2020 and 2019, the product warranty reserve was $1,249 and $1,222, respectively. See Note18 for additional information regarding the product warranty.
Income taxes
Income taxes are accounted for under the asset and liability method. Deferred tax assets and liabilities arerecognized for the future tax consequences attributable to differences between the financial statement carryingamounts of assets and liabilities and their respective tax bases. Deferred taxes are measured using enacted taxlaws and rates expected to be in effect when such differences are recovered or settled. The effect of a change intax rates on deferred taxes is recognized in income in the period that includes the enactment date of the change.The Company has also elected to record global intangible low-taxed income (“GILTI”) as period costs if andwhen incurred.
The Company makes judgments regarding the recognition of deferred tax assets and the future realization ofthese assets. As prescribed by ASC 740, “Income Taxes” and applicable guidance, valuation allowances must beprovided for those deferred tax assets for which it is more likely than not (a likelihood of more than 50%) thatsome portion or all of the deferred tax assets will not be realized. The guidance requires the Company to evaluatepositive and negative evidence regarding the recoverability of deferred tax assets. The determination of whetherthe positive evidence outweighs the negative evidence and quantification of the valuation allowance requires theCompany to make estimates and judgments of future financial results. The Company has concluded that for
48

purposes of quantifying valuation allowances, it would be appropriate to consider the reversal of taxabletemporary differences related to indefinite-lived intangible assets when assessing the realizability of deferred taxassets that upon reversal, would give rise to operating losses that do not expire.
The Company evaluates all tax positions taken on its federal, state, and foreign tax filings to determine if theposition is more likely than not to be sustained upon examination. For positions that meet the more likely thannot to be sustained criteria, the largest amount of benefit to be realized upon ultimate settlement is determined ona cumulative probability basis. A previously recognized tax position is derecognized when it is subsequentlydetermined that a tax position no longer meets the more likely than not threshold to be sustained. The evaluationof the sustainability of a tax position and the expected tax benefit is based on judgment, historical experience,and various other assumptions. Actual results could differ from those estimates upon subsequent resolution ofidentified matters. The Company accrues interest and penalties related to unrecognized tax benefits in itsprovision for income taxes.
Foreign currency translation
The assets and liabilities of the Company’s foreign subsidiaries are measured using the local currency as thefunctional currency and are translated into U.S. dollars at exchange rates as of the balance sheet date. Incomestatement amounts are translated at the weighted-average rates of exchange during the year. The translationadjustment is accumulated as a separate component of “Accumulated other comprehensive loss” within itsConsolidated Balance Sheets. Foreign currency transaction gains and losses are included in “Other income orexpense.” For the years ended December 31, 2020, 2019, and 2018, foreign currency transaction gain ofapproximately $32, loss of $202, and gain of $483, respectively, were included in “Other (income) expense —net” in the Consolidated Statements of Operations.
Research and development
The Company expenses research and development costs as costs are incurred. For the years endedDecember 31, 2020, 2019, and 2018, research and development expenses were $2,643, $2,614, and $2,646,respectively, and were principally related to the Company’s friction management and railroad monitoring systemproducts within the Rail segment.
Reclassifications
Certain accounts in the prior year consolidated financial statements have been reclassified for comparativepurposes principally to conform to the presentation in the current year period, including discontinued operationsand the change in business segments.
Recently issued accounting guidance
In March 2020, the FASB issued ASU 2020-04, “Reference Rate Reform (Topic 848): Facilitation of theEffects of Reference Rate Reform on Financial Reporting” (“ASU 2020-04”), which provides optionalexpedients and exceptions for applying U.S. GAAP to contracts, hedging relationships, and other transactionsaffected by the discontinuation of the London Interbank Offered Rate (“LIBOR”) or by another reference rateexpected to be discontinued. The amendments are effective for all entities as of March 12, 2020 throughDecember 31, 2022. The Company is currently evaluating the impacts of the provisions of ASU 2020-04 on itsfinancial condition, results of operations, and cash flows.
Recently adopted accounting guidance
In June 2016, the FASB issued ASU 2016-13. ASU 2016-13 added a new impairment model (known as thecurrent expected credit loss (“CECL”) model) that is based on expected losses rather than incurred losses. Underthe new guidance, an entity recognizes as an allowance its estimate of expected credit losses and presentsfinancial assets measured at amortized cost basis at the net amount expected to be collected upon inception. TheCECL model applies to trade receivables, other receivables, and most debt instruments. The CECL model doesnot have a minimum threshold for recognition of impairment losses, and entities must measure expected credit
49

losses on assets that have a low risk of loss. The Company adopted the provisions of ASU 2016-13 on January 1,2020, using the modified retrospective approach as of the beginning of the period of adoption. In accordance withthe standard, the Company evaluated its allowance for credit losses for trade receivables and contract assets, theonly assets held by the Company that were included within the scope of the standard. The adoption of ASU2016-13 had no material effect on the Company’s financial position or results of operations, and no adjustment toRetained earnings as of January 1, 2020 was recorded. The Company has presented the disclosures required bythis new standard in Note 6 and Note 7.
In August 2018, the FASB issued ASU 2018-15, “Intangibles — Goodwill and Other — Internal-UseSoftware” (“ASU 2018-15”). ASU 2018-15 requires capitalization of certain implementation costs incurred in acloud computing arrangement that qualifies as a service contract. The amendments in ASU 2018-15 are effectivefor fiscal years beginning after December 15, 2019 and for interim periods therein with early adoption permitted.The adoption of ASU 2018-15 had no impact on the Company’s consolidated financial statements and relateddisclosures.
Note 2. Business Segments
The Company provides products and services for the rail industry and solutions to support criticalinfrastructure projects. The Company’s innovative engineering and product development solutions inspire thesafety, reliability, and performance of it’s customer’s challenging requirements. The Company maintainslocations in North America, Europe, and Asia. Effective for the quarter and year ended December 31, 2020, theCompany implemented operational changes in how its Chief Operating Decision Maker (“CODM”) manages itsbusinesses, including resource allocation and operating decisions. As a result of these changes, the Company nowhas two operating segments, representing the individual businesses that are run separately under the newstructure. The Company’s new reportable segments are: the Rail Technologies and Services segment and theInfrastructure Solutions segment. The segments represent components of the Company (a) that engage inactivities from which revenue is generated and expenses are incurred; (b) whose operating results are regularlyreviewed by the CODM, who makes decisions about resources to be allocated to the segments, and (c) for whichdiscrete financial information is available. Operating segments are evaluated on their segment profit contributionto the Company’s consolidated results. Other income and expenses, interest, income taxes, and certain otheritems are managed on a consolidated basis.
The Company has restated segment information for the historical periods presented herein to conform to thecurrent presentation. This change in segment presentation does not affect the Company’s consolidated statementsof income, balance sheets, or statements of cash flows.
The Company markets its products directly in major industrial areas of the United States, Canada, andEurope, primarily through an internal sales force.
The Company’s Rail Technologies and Services segment engineers, manufactures, and assembles frictionmanagement products and railway wayside data collection, application systems, railroad condition monitoringsystems and equipment, wheel impact load detection systems, management systems, and provides services forthese products. The Rail Technologies and Services segment also provides a full line of new and used rail,trackwork, and accessories to railroads, mines, and other customers in the rail industry. In addition, the RailTechnologies and Services segment designs and produces insulated rail joints, power rail, track fasteners,concrete railroad ties, coverboards, and special accessories for mass transit and other rail systems.
The Company’s Infrastructure Solutions segment provides make-to-order solutions that support projects forthe transportation, heavy civil, agricultural, energy, commercial, and residential infrastructure markets. Insupporting these markets, the Infrastructure Solutions segment sells bridge decking, bridge railing, structuralsteel fabrications, expansion joints, bridge forms, and other products for highway construction and repair. Thissegment also sells and rents steel sheet piling, H-bearing pile, and other piling products for foundation and earthretention requirements. In addition, the Infrastructure Solutions segment produces precast concrete buildings anda variety of specialty precast concrete products. Lastly, the Infrastructure Solutions segment provides pipecoatings for oil and gas pipelines and utilities, precision measurement systems for the oil and gas market, andproduces threaded pipe products for industrial water well and irrigation markets as well as the oil and gasmarkets.
50

The table set forth below illustrates net sales, profit, assets, depreciation/amortization, and expenditures forlong-lived assets of the Company by segment. Segment profit from operations includes allocated corporateoperating expenses. Operating expenses related to corporate headquarter functions that directly support thesegment activity were allocated based on segment headcount, revenue contribution, or activity of the businessunits within the segments, based on the corporate activity type provided to the segment. The expense allocationexcludes certain corporate costs that are separately managed from the segments.
Management believes the allocation of corporate operating expenses provides an accurate presentation ofhow the segments utilize corporate support activities. This provides the CODM a meaningful segmentprofitability information to support operating decisions and the allocation of resources.
The accounting policies of the reportable segments are the same as those described in the summary ofsignificant accounting policies found in Note 1.
The operating results and assets of the Company’s operating segments were as follows as of and for the yearended December 31, 2020:
Net SalesSegment
ProfitSegmentAssets
Depreciation/Amortization
Expendituresfor Long-Lived
Assets
Rail Technologies and Services . . . . . . . . . . $276,447 $16,321 $161,485 $ 6,138 $4,599
Infrastructure Solutions . . . . . . . . . . . . . . . . . 220,964 8,250 137,519 6,084 3,905
Total . . . . . . . . . . . . . . . . . . . . . . . . . . . . . $497,411 $24,571 $299,004 $12,222 $8,504
The operating results and assets of the Company’s operating segments were as follows as of and for the yearended December 31, 2019:
Net SalesSegment
ProfitSegmentAssets
Depreciation/Amortization
Expendituresfor Long-Lived
Assets
Rail Technologies and Services . . . . . . . . . . $321,808 $19,641 $186,323 $ 6,469 $2,293
Infrastructure Solutions . . . . . . . . . . . . . . . . . 294,620 23,615 130,688 6,592 3,381
Total . . . . . . . . . . . . . . . . . . . . . . . . . . . . . $616,428 $43,256 $317,011 $13,061 $5,674
The operating results and assets of the Company’s operating segments were as follows as of and for the yearended December 31, 2018:
Net SalesSegment
ProfitSegmentAssets
Depreciation/Amortization
Expendituresfor Long-Lived
Assets
Rail Technologies and Services . . . . . . . . . . $319,524 $19,468 $175,704 $ 6,810 $ 941
Infrastructure Solutions . . . . . . . . . . . . . . . . . 261,540 21,587 151,212 6,957 2,415
Total . . . . . . . . . . . . . . . . . . . . . . . . . . . . . $581,064 $41,055 $326,916 $13,767 $3,356
During 2020, 2019, and 2018, no single customer accounted for more than 10% of the Company’sconsolidated net sales. Sales between segments were immaterial.
51

Reconciliations of reportable segment net sales, profits, assets, depreciation/amortization, and expendituresfor long-lived assets to the Company’s consolidated totals are as follows as of and for the years endedDecember 31:
2020 2019 2018
Income from Operations:
Total segment profit . . . . . . . . . . . . . . . . . . . . . . . . . . . . . . . . . . . . $ 24,571 $ 43,256 $ 41,055
Interest expense — net . . . . . . . . . . . . . . . . . . . . . . . . . . . . . . . . . . (3,761) (4,911) (6,134)
Other income (expense) . . . . . . . . . . . . . . . . . . . . . . . . . . . . . . . . . 2,298 (2,919) 1,208
Concrete Tie Settlement expense (Note 18) . . . . . . . . . . . . . . . . . . — — (43,400)
Corporate expense and other unallocated charges . . . . . . . . . . . . . (9,126) (11,287) (17,298)
Income (loss) before income taxes . . . . . . . . . . . . . . . . . . . . . . . $ 13,982 $ 24,139 $ (24,569)
Assets:
Total segment assets . . . . . . . . . . . . . . . . . . . . . . . . . . . . . . . . . . . . $299,004 $317,011 $326,916
Unallocated corporate assets and discontinued operations . . . . . . 71,391 88,160 56,333
Assets . . . . . . . . . . . . . . . . . . . . . . . . . . . . . . . . . . . . . . . . . . . . . $370,395 $405,171 $383,249
Depreciation/Amortization:
Total segment depreciation/amortization . . . . . . . . . . . . . . . . . . . . $ 12,222 $ 13,061 $ 13,767
Other . . . . . . . . . . . . . . . . . . . . . . . . . . . . . . . . . . . . . . . . . . . . . . . . 1,357 1,328 1,265
Depreciation/amortization . . . . . . . . . . . . . . . . . . . . . . . . . . . . . $ 13,579 $ 14,389 $ 15,032
Expenditures for Long-Lived Assets:
Total segment expenditures for long-lived assets . . . . . . . . . . . . . $ 8,504 $ 5,674 $ 3,356
Other expenditures for long-lived assets . . . . . . . . . . . . . . . . . . . . 675 352 302
Expenditures for long-lived assets . . . . . . . . . . . . . . . . . . . . . . . $ 9,179 $ 6,026 $ 3,658
The following table summarizes the Company’s sales by major geographic region in which the Companyhad operations for the years ended December 31:
2020 2019 2018
United States . . . . . . . . . . . . . . . . . . . . . . . . . . . . . . . . . . . . . . . . . $398,288 $490,735 $439,002
United Kingdom . . . . . . . . . . . . . . . . . . . . . . . . . . . . . . . . . . . . . . . 44,643 41,879 66,451
Canada . . . . . . . . . . . . . . . . . . . . . . . . . . . . . . . . . . . . . . . . . . . . . . 34,498 57,574 42,810
Other . . . . . . . . . . . . . . . . . . . . . . . . . . . . . . . . . . . . . . . . . . . . . . . . 19,982 26,241 32,800
Total net sales . . . . . . . . . . . . . . . . . . . . . . . . . . . . . . . . . . . . . . . $497,411 $616,428 $581,064
The following table summarizes the Company’s long-lived assets by geographic region as of December 31:
2020 2019
United States . . . . . . . . . . . . . . . . . . . . . . . . . . . . . . . . . . . . . . . . . . . . . . . . . . . . . . $57,445 $55,222
Canada . . . . . . . . . . . . . . . . . . . . . . . . . . . . . . . . . . . . . . . . . . . . . . . . . . . . . . . . . . . 3,011 3,590
United Kingdom . . . . . . . . . . . . . . . . . . . . . . . . . . . . . . . . . . . . . . . . . . . . . . . . . . . 1,617 1,610
Other . . . . . . . . . . . . . . . . . . . . . . . . . . . . . . . . . . . . . . . . . . . . . . . . . . . . . . . . . . . . 12 13
Total property, plant, and equipment — net . . . . . . . . . . . . . . . . . . . . . . . . . . . . $62,085 $60,435
52
The following table summarizes the Company’s sales by major product and service line for the years endedDecember 31:
December 31,2020 2019 2018
Rail Products . . . . . . . . . . . . . . . . . . . . . . . . . . . . . . . . . . . . . . . . . $186,263 $208,145 $203,054
Rail Technologies . . . . . . . . . . . . . . . . . . . . . . . . . . . . . . . . . . . . . . 90,184 113,663 116,470
Rail Technologies and Services . . . . . . . . . . . . . . . . . . . . . . . . . 276,447 321,808 319,524
Fabricated Steel Products . . . . . . . . . . . . . . . . . . . . . . . . . . . . . . . . 85,399 114,076 102,246
Precast Concrete Products . . . . . . . . . . . . . . . . . . . . . . . . . . . . . . . 63,308 68,410 56,407
Coatings and Measurement . . . . . . . . . . . . . . . . . . . . . . . . . . . . . . 72,257 112,134 102,887
Infrastructure Solutions . . . . . . . . . . . . . . . . . . . . . . . . . . . . . . . 220,964 294,620 261,540
Total net sales . . . . . . . . . . . . . . . . . . . . . . . . . . . . . . . . . . . . . $497,411 $616,428 $581,064
Note 3. Discontinued Operations
Since the middle of 2019, the upstream energy markets that the Company served have deteriorated as pricesof oil and natural gas declined due to weakening demand. This deterioration accelerated as a result of the globalCOVID-19 pandemic and the associated reduction in demand for oil due to reduced travel patterns andmovement of goods throughout the world. As U.S. exploration and production companies reduced productionand implemented spending cuts, demand for much of the Company’s offerings in its upstream test and inspectionbusiness (“Test and Inspection Services”) services business had sharply declined. As a result, on September 4,2020, the Company completed the sale of its upstream oil and gas Test and Inspection Services business.Proceeds from the sale were $4,000 and resulted in a loss of $10,034 net of tax. The Company has reflected theresults of operations of the Test and Inspection Services business as discontinued operations in the ConsolidatedFinancial statements for all periods presented. The Test and Inspection Services business was historicallyincluded in the legacy Tubular and Energy segment, whose remaining divisions are now included as part of theInfrastructure Solutions segment.
The following table provides the net sales and losses from discontinued operations for the periods presented:
December 31,2020 2019 2018
Net sales . . . . . . . . . . . . . . . . . . . . . . . . . . . . . . . . . . . . . . . . . . . . . . . $ 13,590 $38,629 $45,905
Loss from discontinued operations . . . . . . . . . . . . . . . . . . . . . . . . . . . (10,807) (6,742) (2,142)
Income tax benefit . . . . . . . . . . . . . . . . . . . . . . . . . . . . . . . . . . . . . . . . 2,600 1,336 1,560
Loss on the sale of discontinued operations . . . . . . . . . . . . . . . . . . . . (13,172) — —
Income tax benefit on the sale of discontinued operations . . . . . . . . . 3,138 — —
Loss from discontinued operations . . . . . . . . . . . . . . . . . . . . . . . . . . . $(18,241) $ (5,406) $ (582)
53

The assets and liabilities of the discontinued operations as of December 31, 2019 were as follows:
December 31,2019
Current assets:
Accounts receivable — net . . . . . . . . . . . . . . . . . . . . . . . . . . . . . . . . . . $ 4,959
Inventories — net . . . . . . . . . . . . . . . . . . . . . . . . . . . . . . . . . . . . . . . . . 840
Other current assets . . . . . . . . . . . . . . . . . . . . . . . . . . . . . . . . . . . . . . . 509
Total current assets . . . . . . . . . . . . . . . . . . . . . . . . . . . . . . . . . . . . . . . . 6,308
Property, plant, and equipment — net . . . . . . . . . . . . . . . . . . . . . . . . . 21,879
Operating lease right-of-use assets — net . . . . . . . . . . . . . . . . . . . . . . 1,994
Other assets:
Other intangibles — net . . . . . . . . . . . . . . . . . . . . . . . . . . . . . . . . . . . . 1,401
Deferred tax assets (1) . . . . . . . . . . . . . . . . . . . . . . . . . . . . . . . . . . . . . 9,116
Other assets . . . . . . . . . . . . . . . . . . . . . . . . . . . . . . . . . . . . . . . . . . . . . . 83
Total assets . . . . . . . . . . . . . . . . . . . . . . . . . . . . . . . . . . . . . . . . . . . . . . $40,781
Current liabilities:
Accounts payable . . . . . . . . . . . . . . . . . . . . . . . . . . . . . . . . . . . . . . . . . $ 3,332
Accrued payroll and employee benefits . . . . . . . . . . . . . . . . . . . . . . . . 902
Current maturities of long-term debt . . . . . . . . . . . . . . . . . . . . . . . . . . 28
Other accrued liabilities . . . . . . . . . . . . . . . . . . . . . . . . . . . . . . . . . . . . 1,376
Total current liabilities . . . . . . . . . . . . . . . . . . . . . . . . . . . . . . . . . . . . . 5,638
Long-term debt . . . . . . . . . . . . . . . . . . . . . . . . . . . . . . . . . . . . . . . . . . . 13
Long-term operating lease liabilities . . . . . . . . . . . . . . . . . . . . . . . . . . 1,256
Other long-term liabilities . . . . . . . . . . . . . . . . . . . . . . . . . . . . . . . . . . 4,342
Total liabilities . . . . . . . . . . . . . . . . . . . . . . . . . . . . . . . . . . . . . . . . . . . $11,249
(1) The assets of discontinued operations as of December 31, 2019 included $9,116 attributable to IOS Acquisitions, Inc. As part of theCompany’s restructuring activities in the second quarter of 2020, IOS Acquisitions, Inc. was converted to a limited liability company andsubsequently treated as a disregarded entity for income tax purposes. As a result of this transaction, the deferred tax assets were nottransferred upon the disposition of the Test and Inspection Services business and have been retained by the Company.
Note 4. Revenue
The Company’s revenues are comprised of product and service sales, including products and services providedunder long-term agreements with its customers. All revenue is recognized when the Company satisfies its perform-ance obligations under the contract, either implicit or explicit, by transferring the promised product or rendering aservice to its customer either when or as its customer obtains control of the product or as the service is rendered. Aperformance obligation is a promise in a contract to transfer a distinct product or render a specific service to a cus-tomer. A contract’s transaction price is allocated to each distinct performance obligation. The majority of theCompany’s contracts have a single performance obligation, as the promise to transfer products or render services isnot separately identifiable from other promises in the contract and, therefore, not distinct. Revenue is measured asthe amount of consideration the Company expects to receive in exchange for transferring products or providingservices. Revenue is recorded net of returns, allowances, customer discounts, and incentives. Sales, value added,and other taxes collected from customers and remitted to governmental authorities are accounted for on a net(excluded from revenues) basis. Shipping and handling costs are included in cost of goods sold.
The Company’s performance obligations under long-term agreements with its customers are generally satisfiedover time. Over time revenue is primarily comprised of transit infrastructure projects within the Rail seg-
54

ment, and long-term bridge projects within the Fabricated Steel Products division, precast concrete buildingswithin the Precast Concrete Products division, and custom precision metering systems within the Coatings andMeasurement division in the Infrastructure Solutions segment. Revenue from products or services provided tocustomers over time accounted for 29.4%, 30.3%, and 28.1% of revenue for the years ended December 31, 2020,2019, and 2018, respectively. Revenue under these long-term agreements is generally recognized over time eitherusing an input measure based upon the proportion of actual costs incurred to estimated total project costs or aninput measure based upon actual labor costs as a percentage of estimated total labor costs, depending upon whichmeasure the Company believes best depicts the Company’s performance to date under the terms of the contract.Revenue recognized over time using an input measure was $101,160, $136,014, and $121,919 for the yearsended December 31, 2020, 2019, and 2018, respectively. A certain portion of the Company’s revenue recognizedover time under these long-term agreements is recognized using an output method, specifically units delivered,based upon certain customer acceptance and delivery requirements. Revenue recognized over time using anoutput measure was $44,860, $50,761, and $41,334 for the years ended December 31, 2020, 2019, and 2018,respectively. As of December 31, 2020 and 2019, the Company had contract assets of $37,843 and $37,032,respectively, that were recorded in “Inventories — net” within the Consolidated Balance Sheets. As ofDecember 31, 2020 and 2019, the Company had contract liabilities of $1,324 and $4,472, respectively, that wererecorded in “Deferred revenue” within the Consolidated Balance Sheets.
Accounting for these long-term agreements involves the use of various techniques to estimate total revenuesand costs. The Company estimates profit on these long-term agreements as the difference between total estimatedrevenues and expected costs to complete a contract and recognizes that profit over the life of the contract.Contract estimates are based on various assumptions to project the outcome of future events that may spanseveral years. These assumptions include, among other things, labor productivity, cost and availability ofmaterials, and timing of funding by customers. The nature of these long-term agreements may give rise to severaltypes of variable consideration, such as claims, awards, and incentive fees. Historically, these amounts ofvariable consideration have not been considered significant. Contract estimates may include additional revenuefor submitted contract modifications if there exists an enforceable right to the modification, the amount can bereasonably estimated, and its realization is probable. These estimates are based on historical collectionexperience, anticipated performance, and the Company’s best judgment at that time. These amounts are generallyincluded in the contract’s transaction price and are allocated over the remaining performance obligations.Changes in judgments related to the estimates above could impact the timing and amount of revenue recognizedand, accordingly, the timing and amount of associated income. In the event that a contract loss becomes known,the entire amount of the estimated loss is recognized in the Consolidated Statements of Operations.
The majority of the Company’s revenue is from products transferred and services rendered to customers at apoint in time, which is inherent in all major product and service categories. Point in time revenue accounted for70.6%, 69.7%, and 71.9% of revenue for the years ended December 31, 2020, 2019, and 2018, respectively. TheCompany recognizes revenue at the point in time in which the customer obtains control of the product or service,which is generally when product title passes to the customer upon shipment or the service has been rendered tothe customer. In limited cases, title does not transfer upon shipment and revenue is not recognized until thecustomer has received the products at a designated physical location.
For the years ended December 31, 2020, 2019, and 2018, net sales by the timing of the transfer of goods andservices were as follows:
Year Ended December 31, 2020Rail Technologies
and ServicesInfrastructure
Solutions Total
Point in time . . . . . . . . . . . . . . . . . . . . . . . . . . . . . . . . . . . . . . . . . . . $212,212 $139,179 $351,391
Over time . . . . . . . . . . . . . . . . . . . . . . . . . . . . . . . . . . . . . . . . . . . . . 64,235 81,785 146,020
Total net sales . . . . . . . . . . . . . . . . . . . . . . . . . . . . . . . . . . . . . . . . . . $276,447 $220,964 $497,411
55

Year Ended December 31, 2019Rail Technologies
and ServicesInfrastructure
Solutions Total
Point in time . . . . . . . . . . . . . . . . . . . . . . . . . . . . . . . . . . . . . . . . . . . $240,047 $189,606 $429,653
Over time . . . . . . . . . . . . . . . . . . . . . . . . . . . . . . . . . . . . . . . . . . . . . 81,761 105,014 186,775
Total net sales . . . . . . . . . . . . . . . . . . . . . . . . . . . . . . . . . . . . . . . . . . $321,808 $294,620 $616,428
Year Ended December 31, 2018Rail Technologies
and ServicesInfrastructure
Solutions Total
Point in time . . . . . . . . . . . . . . . . . . . . . . . . . . . . . . . . . . . . . . . . . . . $232,814 $184,997 $417,811
Over time . . . . . . . . . . . . . . . . . . . . . . . . . . . . . . . . . . . . . . . . . . . . . 86,710 76,543 163,253
Total net sales . . . . . . . . . . . . . . . . . . . . . . . . . . . . . . . . . . . . . . . . . . $319,524 $261,540 $581,064
See Note 2 for additional information for the Company’s net sales by major product and service category.
The timing of revenue recognition, billings, and cash collections results in billed receivables, costs in excessof billings (contract assets, included in “Inventories — net”), and billings in excess of costs (contract liabilities,included in “Deferred revenue”) on the Consolidated Balance Sheets.
Significant changes in contract assets during the year ended December 31, 2020 and 2019 included transfersto receivables from contract assets recognized at the beginning of the period of $27,126 and $24,487,respectively. Significant changes in contract liabilities during the year ended December 31, 2020 and 2019included increases of $803 and $4,358, respectively, due to billings in excess of costs, excluding amountsrecognized as revenue during the period. Contract liabilities were reduced due to revenue recognized during theyear ended December 31, 2020, 2019, and 2018 of $3,784, $1,462, and $1,141, respectively, which wereincluded in the contract liabilities at the beginning of each period.
Deferred revenue of $7,144 and $8,446 as of December 31, 2020 and 2019, respectively, consisted ofcustomer billings or payments received for which the revenue recognition criteria had not yet been met as well ascontract liabilities (billings in excess of costs) on over time revenue projects. As of December 31, 2020 and 2019,contract liabilities, recorded within “Deferred revenue,” was $1,324 and $4,472, respectively. Advancedpayments from customers typically relate to contracts with respect to which the Company has significantlyfulfilled its obligations, but due to the Company’s continuing involvement with the project, revenue is notrecognized until title, ownership, and risk of loss have passed to the customer.
As of December 31, 2020, the Company had approximately $248,232 of remaining performance obligations,which is also referred to as backlog. Approximately 13.4% of the backlog as of December 31, 2020 was relatedto projects that are anticipated to extend beyond December 31, 2021.
Note 5. Goodwill and Other Intangible Assets
As of December 31, 2020 and 2019, the following table represents the goodwill balance by reportablesegment:
Rail Technologiesand Services
InfrastructureSolutions Total
Balance as of December 31, 2018: . . . . . . . . . . . . . . . . . . . . . . . . . . . $14,111 $5,147 $19,258
Foreign currency translation impact . . . . . . . . . . . . . . . . . . . . . . . . . . 307 — 307
Balance as of December 31, 2019: . . . . . . . . . . . . . . . . . . . . . . . . . . . 14,418 5,147 19,565
Acquisitions . . . . . . . . . . . . . . . . . . . . . . . . . . . . . . . . . . . . . . . . . . . . — 450 450
Foreign currency translation impact . . . . . . . . . . . . . . . . . . . . . . . . . . 325 — 325
Balance as of December 31, 2020: . . . . . . . . . . . . . . . . . . . . . . . . . . . $14,743 $5,597 $20,340
56

As of December 31, 2020 and 2019, the components of the Company’s intangible assets were as follows:December 31, 2020
Weighted AverageAmortization
Period In Years
GrossCarrying
ValueAccumulatedAmortization
NetCarryingAmount
Patents . . . . . . . . . . . . . . . . . . . . . . . . . . . . . . . . . . . . . . . 10 $ 383 $ (206) $ 177
Customer relationships . . . . . . . . . . . . . . . . . . . . . . . . . . 18 36,269 (15,914) 20,355
Trademarks and trade names . . . . . . . . . . . . . . . . . . . . . . 16 7,809 (4,135) 3,674
Technology . . . . . . . . . . . . . . . . . . . . . . . . . . . . . . . . . . . 13 35,815 (23,124) 12,691
$80,276 $(43,379) $36,897
December 31, 2019Weighted Average
AmortizationPeriod In Years
GrossCarrying
ValueAccumulatedAmortization
NetCarryingAmount
Non-compete agreements . . . . . . . . . . . . . . . . . . . . . . . . 4 $ 1,272 $ (1,259) $ 13
Patents . . . . . . . . . . . . . . . . . . . . . . . . . . . . . . . . . . . . . . . 10 377 (188) 189
Customer relationships . . . . . . . . . . . . . . . . . . . . . . . . . . 18 35,605 (13,453) 22,152
Trademarks and trade names . . . . . . . . . . . . . . . . . . . . . . 16 7,787 (3,551) 4,236
Technology . . . . . . . . . . . . . . . . . . . . . . . . . . . . . . . . . . . 13 35,728 (20,205) 15,523
$80,769 $(38,656) $42,113
Intangible assets are amortized over their useful lives ranging from 5 to 25 years, with a total weighted averageamortization period of approximately 16 years. Amortization expense for the years ended December 31, 2020, 2019,and 2018 were $5,729, $6,445, and $6,966, respectively. During the years ended December 31, 2020 and 2019,certain fully amortized intangible assets of $1,232 and $2,830, respectively, related to non-compete agreements andfor the year ended December 31, 2019 fully amortized intangible assets of $723 related to trademarks and tradenames were eliminated from gross intangible assets and accumulated amortization. As a result of the sale of Testand Inspection Services during the year ended December 31, 2020, intangible assets related to customerrelationships with gross carrying values of $1,893 and accumulated amortization of $587 were eliminated.
Estimated annual amortization expense for the years ending December 31, 2021 and thereafter is as follows:Year Ending December 31,
2021 . . . . . . . . . . . . . . . . . . . . . . . . . . . . . . . . . . . . . . . . . . . . . . . . . . . . . . . . . . . . . . . . . . . . . . $ 5,856
2022 . . . . . . . . . . . . . . . . . . . . . . . . . . . . . . . . . . . . . . . . . . . . . . . . . . . . . . . . . . . . . . . . . . . . . . 5,767
2023 . . . . . . . . . . . . . . . . . . . . . . . . . . . . . . . . . . . . . . . . . . . . . . . . . . . . . . . . . . . . . . . . . . . . . . 5,296
2024 . . . . . . . . . . . . . . . . . . . . . . . . . . . . . . . . . . . . . . . . . . . . . . . . . . . . . . . . . . . . . . . . . . . . . . 4,293
2025 . . . . . . . . . . . . . . . . . . . . . . . . . . . . . . . . . . . . . . . . . . . . . . . . . . . . . . . . . . . . . . . . . . . . . . 2,458
2026 and thereafter . . . . . . . . . . . . . . . . . . . . . . . . . . . . . . . . . . . . . . . . . . . . . . . . . . . . . . . . . . . 13,227
$36,897
Note 6. Accounts Receivable
Accounts receivable as of December 31, 2020 and 2019 are summarized as follows:December 31,
2020 2019
Accounts receivable . . . . . . . . . . . . . . . . . . . . . . . . . . . . . . . . . . . . . . . . . . . . . . . . $59,242 $74,689
Allowance for doubtful accounts . . . . . . . . . . . . . . . . . . . . . . . . . . . . . . . . . . . . . . (944) (1,073)
Accounts receivable — net . . . . . . . . . . . . . . . . . . . . . . . . . . . . . . . . . . . . . . . . . . . $58,298 $73,616
57
On January 1, 2020, the Company adopted ASU 2016-13 and all the related amendments using the modifiedretrospective approach, which did not result in any changes to the previously reported financial information. Theupdates related to ASU 2016-13 were applied to assets held as of January 1, 2020.
In accordance with adoption of the new standard, the Company evaluated and revised its policiessurrounding the allowance for credit losses for trade receivables. The Company established the allowance forcredit losses by calculating the amount to reserve based on the age of a given trade receivable and consideringhistorical collection patterns and bad debt expense experience, in addition to any other relevant subjectiveadjustments to individual receivables made by management. The Company also considered current and expectedfuture market and other conditions. Trade receivables are pooled within the calculation based on a range of ages,which appropriately groups receivables of similar credit risk together.
The established reserve thresholds to calculate the allowance for credit loss are based on and supported byhistoric collection patterns and bad debt expense incurred by the Company, as well as the expectation thatcollection patterns and bad debt expense will continue to adhere to patterns observed in recent years, which wasformed based on trends observed as well as current and expected future conditions. Management maintains high-quality credit review practices as well as positive customer relationships that further mitigate credit risk.Management monitors and reviews the contributing factors to the Company’s reserve, and makes any appropriaterevisions as they become necessary.
The Company’s adoption of ASU 2016-13 did not require material changes to the allowance for creditlosses and no adjustment was recorded to opening retained earnings as of January 1, 2020.
Changes in reserves for uncollectible accounts are recorded as part of “Selling and administrative expenses”in the Consolidated Statements of Operations, and were expense of $365, and income of $75 and $1,274 for theyears ended December 31, 2020, 2019, and 2018, respectively.
The following table sets forth the Company’s allowance for doubtful accounts:
Allowance forDoubtful Accounts
December 31, 2019 . . . . . . . . . . . . . . . . . . . . . . . . . . . . . . . . . . . . . . . . . . . . . . . . . . . . $1,073
Current period provision . . . . . . . . . . . . . . . . . . . . . . . . . . . . . . . . . . . . . . . . . . . . . . . . 286
Write-off against allowance . . . . . . . . . . . . . . . . . . . . . . . . . . . . . . . . . . . . . . . . . . . . . (415)
December 31, 2020 . . . . . . . . . . . . . . . . . . . . . . . . . . . . . . . . . . . . . . . . . . . . . . . . . . . . $ 944
The Company’s customers are principally in the rail, transportation, heavy civil, agricultural, energy,commercial and residential infrastructure sectors. As of December 31, 2020 and 2019, trade receivables, net ofallowance for doubtful accounts, from customers were as follows:
December 31,2020 2019
Rail Technologies and Services . . . . . . . . . . . . . . . . . . . . . . . . . . . . . . . . . . . . . . . $33,960 $44,941
Infrastructure Solutions . . . . . . . . . . . . . . . . . . . . . . . . . . . . . . . . . . . . . . . . . . . . . . 24,252 28,557
Trade accounts receivable — net . . . . . . . . . . . . . . . . . . . . . . . . . . . . . . . . . . . . . . $58,212 $73,498
Credit is extended based upon an evaluation of the customer’s financial condition and, while collateral is notrequired, the Company periodically receives surety bonds that guarantee payment. Credit terms are consistentwith industry standards and practices.
58

Note 7. Inventory
Inventory is valued at average cost or net realizable value, whichever is lower. The Company’s componentsof inventory as of December 31, 2020 and 2019 are summarized in the following table:
December 31,2020 2019
Finished goods . . . . . . . . . . . . . . . . . . . . . . . . . . . . . . . . . . . . . . . . . . . . . . . . . . . $ 60,766 $ 59,024
Contract assets . . . . . . . . . . . . . . . . . . . . . . . . . . . . . . . . . . . . . . . . . . . . . . . . . . . 37,843 37,032
Work-in-process . . . . . . . . . . . . . . . . . . . . . . . . . . . . . . . . . . . . . . . . . . . . . . . . . 5,143 3,728
Raw materials . . . . . . . . . . . . . . . . . . . . . . . . . . . . . . . . . . . . . . . . . . . . . . . . . . . 12,708 18,677
Inventories — net . . . . . . . . . . . . . . . . . . . . . . . . . . . . . . . . . . . . . . . . . . . . . . . . $116,460 $118,461
In accordance with adoption of ASU 2016-13, the Company evaluated and revised its policies relating to theallowance for credit losses as they pertain to contract assets, as these assets held in inventory will convert to tradereceivables upon recognition of revenue for the contract to which they pertain.
In addition to contract-specific provisions for which reserves were historically established as a result of theCompany’s contract review process, management also elected to implement a standard credit loss provision overany remaining contract assets considered to have a similar low risk of credit loss.
The development of these estimates is based on historic collection trends, accuracy of estimates withincontract margin reporting, as well as the expectation that collection patterns, margin reporting, and bad debtexpense will continue to adhere to patterns observed in recent years. These expectations were formed based ontrends observed as well as current and expected future conditions. Management monitors and reviews thecontributing factors to the Company’s reserve, and makes any appropriate revisions as they become necessary.
Note 8. Property, Plant, and Equipment
Property, plant, and equipment as of December 31, 2020 and 2019 consisted of the following:
December 31,2020 2019
Land . . . . . . . . . . . . . . . . . . . . . . . . . . . . . . . . . . . . . . . . . . . . . . . . . . . . . . . . . . $ 6,627 $ 6,612
Improvements to land and leaseholds . . . . . . . . . . . . . . . . . . . . . . . . . . . . . . . . 17,573 17,172
Buildings . . . . . . . . . . . . . . . . . . . . . . . . . . . . . . . . . . . . . . . . . . . . . . . . . . . . . . 27,348 25,370
Machinery and equipment, including equipment under finance leases . . . . . . . 116,175 106,372
Construction in progress . . . . . . . . . . . . . . . . . . . . . . . . . . . . . . . . . . . . . . . . . . 915 3,778
Gross property, plant, and equipment . . . . . . . . . . . . . . . . . . . . . . . . . . . . . . 168,638 159,304
Less: accumulated depreciation and amortization, including accumulatedamortization of finance leases . . . . . . . . . . . . . . . . . . . . . . . . . . . . . . . . . . . . (106,553) (98,869)
Property, plant, and equipment — net . . . . . . . . . . . . . . . . . . . . . . . . . . . . . . $ 62,085 $ 60,435
Depreciation expense, including amortization of assets under capital leases, for the years endedDecember 31, 2020, 2019, and 2018 amounted to $7,850, $7,944, and $8,066, respectively.
There were no material asset impairments recorded for the year ended December 31, 2020. During the yearended December 31, 2019, the Company sold land and a building for cash proceeds of $900, resulting in a gainof $198. During the year ended December 31, 2018, the Company sold 54.5 acres of land and improvements inexchange for cash proceeds of $2,047, resulting in a loss of $269.
59

Note 9. Leases
On January 1, 2019, the Company adopted ASU 2016-02 and all related amendments using the modifiedretrospective approach, which resulted in an increase in assets of $13,585 and an increase in current and long-term liabilities of $3,322 and $10,263, respectively. This adoption did not affect the Company’s results ofoperations or cash flows.
The Company determines if an arrangement is a lease at its inception. Operating leases are included in“Operating lease right-of-use assets,” “Other current liabilities,” and “Long-term operating lease liabilities”within the Consolidated Balance Sheets. Finance leases are included in “Property, plant, and equipment — net,”“Current maturities of long-term debt,” and “Long-term debt” in the Consolidated Balance Sheets.
Right-of-use assets represent the Company’s right to use an underlying asset for the lease term and leaseliabilities represent the Company’s obligation to make lease payments arising from the lease. Operating leaseright-of-use assets and liabilities are recognized at the lease commencement date based on the present value oflease payments over the lease term. As most of the Company’s leases do not provide an implicit rate, theCompany uses its incremental borrowing rate based on the information available at the commencement date indetermining the present value of the lease payments. The Company uses the implicit rate when readilydeterminable. The operating lease right-of-use asset also includes indirect costs incurred and lease paymentsmade prior to the commencement date, less any lease incentives received. The Company’s lease terms mayinclude options to extend or terminate the lease and will be recognized when it is reasonably certain that theCompany will exercise that option. Lease expense for lease payments is recognized on a straight-line basis overthe lease term.
The Company has lease agreements with lease and non-lease components that it accounts for as a singlelease component. Also, for certain equipment leases, the Company applies a portfolio approach to effectivelyaccount for the operating lease right-of-use assets and liabilities.
Finance lease and lessor accounting recognition has remained substantially unchanged under ASU 2016-02.The adoption of ASU 2016-02 had no impact on the Company’s balance sheets, results of operations, or cashflows for finance leases.
The Company has operating and finance leases for manufacturing facilities, corporate offices, sales offices,vehicles, and certain equipment. As of December 31, 2020, its leases had remaining lease terms of 2 to 12 years,some of which include options to extend the leases for up to 12 years, and some of which include options toterminate the leases within 1 year.
The balance sheet components of the leases were as follows as of December 31, 2020 and 2019:
December 31, December 31,2020 2019
Operating leasesOperating lease right-of-use assets . . . . . . . . . . . . . . . . . . . . . . . . . . . . . . . $16,069 $11,280
Other current liabilities . . . . . . . . . . . . . . . . . . . . . . . . . . . . . . . . . . . . . . $ 2,553 $ 2,268
Long-term operating lease liabilities . . . . . . . . . . . . . . . . . . . . . . . . . . . . 13,516 9,012
Total operating lease liabilities . . . . . . . . . . . . . . . . . . . . . . . . . . . . . . . . . . $16,069 $11,280
Finance leasesProperty, plant, and equipment . . . . . . . . . . . . . . . . . . . . . . . . . . . . . . . . $ 1,116 $ 3,426
Accumulated amortization . . . . . . . . . . . . . . . . . . . . . . . . . . . . . . . . . . . . (869) (2,892)
Property, plant, and equipment — net . . . . . . . . . . . . . . . . . . . . . . . . . . . . . $ 247 $ 534
Current maturities of long-term debt . . . . . . . . . . . . . . . . . . . . . . . . . . . . $ 119 $ 377
Long-term debt . . . . . . . . . . . . . . . . . . . . . . . . . . . . . . . . . . . . . . . . . . . . . 128 157
Total finance lease liabilities . . . . . . . . . . . . . . . . . . . . . . . . . . . . . . . . . . . . $ 247 $ 534
60

The components of lease expense within the Consolidated Statements of Operations were as follows for theyears ended December 31, 2020 and 2019:
Year EndedDecember 31,
2020 2019
Finance lease cost:
Amortization of finance leases . . . . . . . . . . . . . . . . . . . . . . . . . . . . . . . . . . . . . . . . $ 429 $ 692
Interest on lease liabilities . . . . . . . . . . . . . . . . . . . . . . . . . . . . . . . . . . . . . . . . . . . . 72 54
Operating lease cost . . . . . . . . . . . . . . . . . . . . . . . . . . . . . . . . . . . . . . . . . . . . . . . . . . 2,964 3,176
Sublease income . . . . . . . . . . . . . . . . . . . . . . . . . . . . . . . . . . . . . . . . . . . . . . . . . . . . . (167) (18)
Total lease cost . . . . . . . . . . . . . . . . . . . . . . . . . . . . . . . . . . . . . . . . . . . . . . . . . . . . . . $3,298 $3,904
The cash flow components of the leases were as follows for the year ended December 31, 2020 and 2019:
Year EndedDecember 31,
2020 2019
Cash paid for amounts included in the measurement of lease liabilities:
Operating cash flows from operating leases . . . . . . . . . . . . . . . . . . . . . . . . . . . . . $(3,636) $(3,829)
Financing cash flows from finance leases . . . . . . . . . . . . . . . . . . . . . . . . . . . . . . (461) (692)
Right-of-use assets obtained in exchange for new lease liabilities:
Operating leases . . . . . . . . . . . . . . . . . . . . . . . . . . . . . . . . . . . . . . . . . . . . . . . . . . $ 7,753 $ 2,495
The weighted-average remaining lease term (in years) and discount rate related to the operating leases wereas follows for the periods presented:
December 31,2020 2019
Operating lease weighted-average remaining lease term . . . . . . . . . . . . . . . . . . . . . . . . . . . 7 7
Operating lease weighted-average discount rate . . . . . . . . . . . . . . . . . . . . . . . . . . . . . . . . . 5.1% 5.2%
Finance lease weighted-average remaining lease term . . . . . . . . . . . . . . . . . . . . . . . . . . . . 1 1
Finance lease weighted-average discount rate . . . . . . . . . . . . . . . . . . . . . . . . . . . . . . . . . . . 4.2% 4.3%
As of December 31, 2020, estimated annual maturities of lease liabilities for the year ending December 31,2021 and thereafter were as follows:
Year Ending December 31,Operating
LeasesFinanceLeases
2021 . . . . . . . . . . . . . . . . . . . . . . . . . . . . . . . . . . . . . . . . . . . . . . . . . . . . . . . . . . . . . $ 3,305 $174
2022 . . . . . . . . . . . . . . . . . . . . . . . . . . . . . . . . . . . . . . . . . . . . . . . . . . . . . . . . . . . . . 2,856 97
2023 . . . . . . . . . . . . . . . . . . . . . . . . . . . . . . . . . . . . . . . . . . . . . . . . . . . . . . . . . . . . . 2,632 29
2024 . . . . . . . . . . . . . . . . . . . . . . . . . . . . . . . . . . . . . . . . . . . . . . . . . . . . . . . . . . . . . 2,587 11
2025 . . . . . . . . . . . . . . . . . . . . . . . . . . . . . . . . . . . . . . . . . . . . . . . . . . . . . . . . . . . . . 2,385 —
2026 and thereafter . . . . . . . . . . . . . . . . . . . . . . . . . . . . . . . . . . . . . . . . . . . . . . . . . . 5,378 —
19,143 311
Interest . . . . . . . . . . . . . . . . . . . . . . . . . . . . . . . . . . . . . . . . . . . . . . . . . . . . . . . . . . . (3,074) (64)
Total . . . . . . . . . . . . . . . . . . . . . . . . . . . . . . . . . . . . . . . . . . . . . . . . . . . . . . . . . . . . . $16,069 $247
61
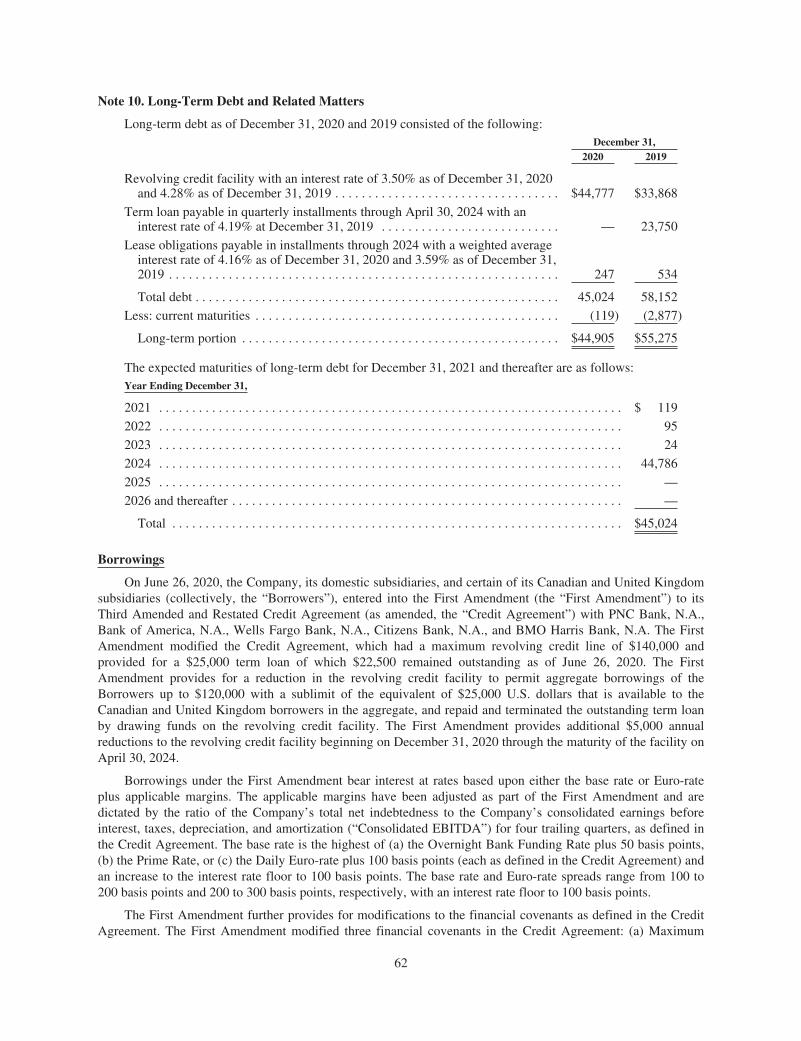
Note 10. Long-Term Debt and Related Matters
Long-term debt as of December 31, 2020 and 2019 consisted of the following:December 31,
2020 2019
Revolving credit facility with an interest rate of 3.50% as of December 31, 2020and 4.28% as of December 31, 2019 . . . . . . . . . . . . . . . . . . . . . . . . . . . . . . . . . . $44,777 $33,868
Term loan payable in quarterly installments through April 30, 2024 with aninterest rate of 4.19% at December 31, 2019 . . . . . . . . . . . . . . . . . . . . . . . . . . . — 23,750
Lease obligations payable in installments through 2024 with a weighted averageinterest rate of 4.16% as of December 31, 2020 and 3.59% as of December 31,2019 . . . . . . . . . . . . . . . . . . . . . . . . . . . . . . . . . . . . . . . . . . . . . . . . . . . . . . . . . . . 247 534
Total debt . . . . . . . . . . . . . . . . . . . . . . . . . . . . . . . . . . . . . . . . . . . . . . . . . . . . . . . 45,024 58,152
Less: current maturities . . . . . . . . . . . . . . . . . . . . . . . . . . . . . . . . . . . . . . . . . . . . . . (119) (2,877)
Long-term portion . . . . . . . . . . . . . . . . . . . . . . . . . . . . . . . . . . . . . . . . . . . . . . . . $44,905 $55,275
The expected maturities of long-term debt for December 31, 2021 and thereafter are as follows:Year Ending December 31,
2021 . . . . . . . . . . . . . . . . . . . . . . . . . . . . . . . . . . . . . . . . . . . . . . . . . . . . . . . . . . . . . . . . . . . . . . $ 119
2022 . . . . . . . . . . . . . . . . . . . . . . . . . . . . . . . . . . . . . . . . . . . . . . . . . . . . . . . . . . . . . . . . . . . . . . 95
2023 . . . . . . . . . . . . . . . . . . . . . . . . . . . . . . . . . . . . . . . . . . . . . . . . . . . . . . . . . . . . . . . . . . . . . . 24
2024 . . . . . . . . . . . . . . . . . . . . . . . . . . . . . . . . . . . . . . . . . . . . . . . . . . . . . . . . . . . . . . . . . . . . . . 44,786
2025 . . . . . . . . . . . . . . . . . . . . . . . . . . . . . . . . . . . . . . . . . . . . . . . . . . . . . . . . . . . . . . . . . . . . . . —
2026 and thereafter . . . . . . . . . . . . . . . . . . . . . . . . . . . . . . . . . . . . . . . . . . . . . . . . . . . . . . . . . . . —
Total . . . . . . . . . . . . . . . . . . . . . . . . . . . . . . . . . . . . . . . . . . . . . . . . . . . . . . . . . . . . . . . . . . . . $45,024
Borrowings
On June 26, 2020, the Company, its domestic subsidiaries, and certain of its Canadian and United Kingdomsubsidiaries (collectively, the “Borrowers”), entered into the First Amendment (the “First Amendment”) to itsThird Amended and Restated Credit Agreement (as amended, the “Credit Agreement”) with PNC Bank, N.A.,Bank of America, N.A., Wells Fargo Bank, N.A., Citizens Bank, N.A., and BMO Harris Bank, N.A. The FirstAmendment modified the Credit Agreement, which had a maximum revolving credit line of $140,000 andprovided for a $25,000 term loan of which $22,500 remained outstanding as of June 26, 2020. The FirstAmendment provides for a reduction in the revolving credit facility to permit aggregate borrowings of theBorrowers up to $120,000 with a sublimit of the equivalent of $25,000 U.S. dollars that is available to theCanadian and United Kingdom borrowers in the aggregate, and repaid and terminated the outstanding term loanby drawing funds on the revolving credit facility. The First Amendment provides additional $5,000 annualreductions to the revolving credit facility beginning on December 31, 2020 through the maturity of the facility onApril 30, 2024.
Borrowings under the First Amendment bear interest at rates based upon either the base rate or Euro-rateplus applicable margins. The applicable margins have been adjusted as part of the First Amendment and aredictated by the ratio of the Company’s total net indebtedness to the Company’s consolidated earnings beforeinterest, taxes, depreciation, and amortization (“Consolidated EBITDA”) for four trailing quarters, as defined inthe Credit Agreement. The base rate is the highest of (a) the Overnight Bank Funding Rate plus 50 basis points,(b) the Prime Rate, or (c) the Daily Euro-rate plus 100 basis points (each as defined in the Credit Agreement) andan increase to the interest rate floor to 100 basis points. The base rate and Euro-rate spreads range from 100 to200 basis points and 200 to 300 basis points, respectively, with an interest rate floor to 100 basis points.
The First Amendment further provides for modifications to the financial covenants as defined in the CreditAgreement. The First Amendment modified three financial covenants in the Credit Agreement: (a) Maximum
62
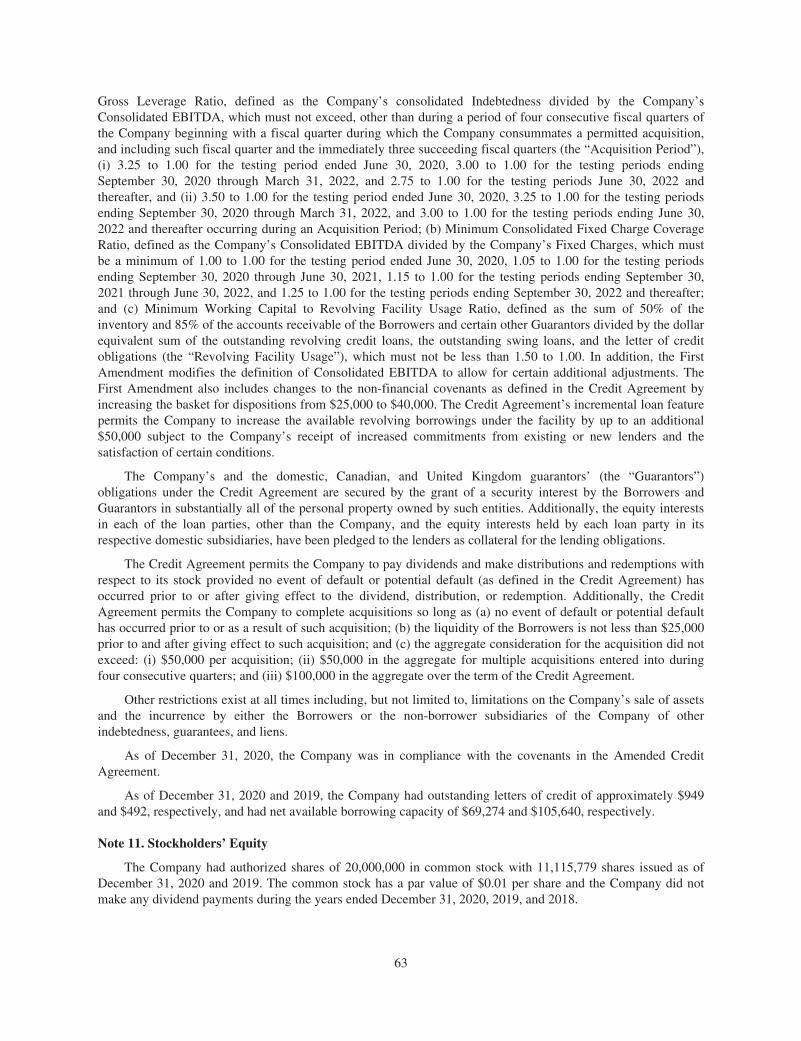
Gross Leverage Ratio, defined as the Company’s consolidated Indebtedness divided by the Company’sConsolidated EBITDA, which must not exceed, other than during a period of four consecutive fiscal quarters ofthe Company beginning with a fiscal quarter during which the Company consummates a permitted acquisition,and including such fiscal quarter and the immediately three succeeding fiscal quarters (the “Acquisition Period”),(i) 3.25 to 1.00 for the testing period ended June 30, 2020, 3.00 to 1.00 for the testing periods endingSeptember 30, 2020 through March 31, 2022, and 2.75 to 1.00 for the testing periods June 30, 2022 andthereafter, and (ii) 3.50 to 1.00 for the testing period ended June 30, 2020, 3.25 to 1.00 for the testing periodsending September 30, 2020 through March 31, 2022, and 3.00 to 1.00 for the testing periods ending June 30,2022 and thereafter occurring during an Acquisition Period; (b) Minimum Consolidated Fixed Charge CoverageRatio, defined as the Company’s Consolidated EBITDA divided by the Company’s Fixed Charges, which mustbe a minimum of 1.00 to 1.00 for the testing period ended June 30, 2020, 1.05 to 1.00 for the testing periodsending September 30, 2020 through June 30, 2021, 1.15 to 1.00 for the testing periods ending September 30,2021 through June 30, 2022, and 1.25 to 1.00 for the testing periods ending September 30, 2022 and thereafter;and (c) Minimum Working Capital to Revolving Facility Usage Ratio, defined as the sum of 50% of theinventory and 85% of the accounts receivable of the Borrowers and certain other Guarantors divided by the dollarequivalent sum of the outstanding revolving credit loans, the outstanding swing loans, and the letter of creditobligations (the “Revolving Facility Usage”), which must not be less than 1.50 to 1.00. In addition, the FirstAmendment modifies the definition of Consolidated EBITDA to allow for certain additional adjustments. TheFirst Amendment also includes changes to the non-financial covenants as defined in the Credit Agreement byincreasing the basket for dispositions from $25,000 to $40,000. The Credit Agreement’s incremental loan featurepermits the Company to increase the available revolving borrowings under the facility by up to an additional$50,000 subject to the Company’s receipt of increased commitments from existing or new lenders and thesatisfaction of certain conditions.
The Company’s and the domestic, Canadian, and United Kingdom guarantors’ (the “Guarantors”)obligations under the Credit Agreement are secured by the grant of a security interest by the Borrowers andGuarantors in substantially all of the personal property owned by such entities. Additionally, the equity interestsin each of the loan parties, other than the Company, and the equity interests held by each loan party in itsrespective domestic subsidiaries, have been pledged to the lenders as collateral for the lending obligations.
The Credit Agreement permits the Company to pay dividends and make distributions and redemptions withrespect to its stock provided no event of default or potential default (as defined in the Credit Agreement) hasoccurred prior to or after giving effect to the dividend, distribution, or redemption. Additionally, the CreditAgreement permits the Company to complete acquisitions so long as (a) no event of default or potential defaulthas occurred prior to or as a result of such acquisition; (b) the liquidity of the Borrowers is not less than $25,000prior to and after giving effect to such acquisition; and (c) the aggregate consideration for the acquisition did notexceed: (i) $50,000 per acquisition; (ii) $50,000 in the aggregate for multiple acquisitions entered into duringfour consecutive quarters; and (iii) $100,000 in the aggregate over the term of the Credit Agreement.
Other restrictions exist at all times including, but not limited to, limitations on the Company’s sale of assetsand the incurrence by either the Borrowers or the non-borrower subsidiaries of the Company of otherindebtedness, guarantees, and liens.
As of December 31, 2020, the Company was in compliance with the covenants in the Amended CreditAgreement.
As of December 31, 2020 and 2019, the Company had outstanding letters of credit of approximately $949and $492, respectively, and had net available borrowing capacity of $69,274 and $105,640, respectively.
Note 11. Stockholders’ Equity
The Company had authorized shares of 20,000,000 in common stock with 11,115,779 shares issued as ofDecember 31, 2020 and 2019. The common stock has a par value of $0.01 per share and the Company did notmake any dividend payments during the years ended December 31, 2020, 2019, and 2018.
63

As of December 31, 2020, 2019, and 2018, the Company withheld 95,285, 34,198, and 11,445 shares forapproximately $1,665, $621, and $316, respectively, from employees to pay their withholding taxes inconnection with the vesting of restricted stock awards. There were no shares repurchased or dividends declaredduring the years ended December 31, 2020, 2019, and 2018.
Common StockTreasury Outstanding
(Number of Shares)
Balance at end of 2017 . . . . . . . . . . . . . . . . . . . . . . . . . . . . . . . . . . . . . . . . . . . 775,203 10,340,576
Issued for stock-based compensation plans . . . . . . . . . . . . . . . . . . . . . . . . . . . (25,431) 25,431
Balance at end of 2018 . . . . . . . . . . . . . . . . . . . . . . . . . . . . . . . . . . . . . . . . . . . 749,772 10,366,007
Issued for stock-based compensation plans . . . . . . . . . . . . . . . . . . . . . . . . . . . (56,084) 56,084
Balance at end of 2019 . . . . . . . . . . . . . . . . . . . . . . . . . . . . . . . . . . . . . . . . . . . 693,688 10,422,091
Issued for stock-based compensation plans . . . . . . . . . . . . . . . . . . . . . . . . . . . (141,199) 141,199
Balance at end of 2020 . . . . . . . . . . . . . . . . . . . . . . . . . . . . . . . . . . . . . . . . . . . 552,489 10,563,290
Note 12. Accumulated Other Comprehensive Loss
The components of accumulated other comprehensive loss, net of tax, for the years ended December 31,2020 and 2019, were as follows:
December 31,2020 2019
Pension and post-retirement benefit plan adjustments . . . . . . . . . . . . . . . . . . . . . $ (4,008) $ (2,959)
Unrealized loss on interest rate swap contracts . . . . . . . . . . . . . . . . . . . . . . . . . . (766) (230)
Foreign currency translation adjustments . . . . . . . . . . . . . . . . . . . . . . . . . . . . . . . (15,494) (16,994)
Accumulated other comprehensive loss . . . . . . . . . . . . . . . . . . . . . . . . . . . . . . . . $(20,268) $(20,183)
Foreign currency translation adjustments are generally not adjusted for income taxes as they relate toindefinite investments in non-U.S. subsidiaries. See Note 14 for further information.
Note 13. Earnings Per Common Share
(Share amounts in thousands)
The following table sets forth the computation of basic and diluted earnings (loss) per common share for theyears ended December 31, 2020, 2019, and 2018:
Year Ended December 31,2020 2019 2018
Numerator for basic and diluted earnings (loss) per common share:
Income (loss) from continuing operations . . . . . . . . . . . . . . . . . $ 25,823 $47,974 $(30,586)
Loss from discontinued operations . . . . . . . . . . . . . . . . . . . . . . (18,241) (5,406) (582)
Net income (loss) . . . . . . . . . . . . . . . . . . . . . . . . . . . . . . . . . . . . $ 7,582 $42,568 $(31,168)
Denominator:
Weighted average shares outstanding . . . . . . . . . . . . . . . . . . . . 10,540 10,410 10,362
Denominator for basic earnings per common share . . . . . . . . . . . 10,540 10,410 10,362
Effect of dilutive securities:
Stock compensation plans . . . . . . . . . . . . . . . . . . . . . . . . . . . . . 131 234 —
Dilutive potential common shares . . . . . . . . . . . . . . . . . . . . . . . . . 131 234 —
64

Year Ended December 31,2020 2019 2018
Denominator for diluted earnings per common share — adjustedweighted average shares outstanding and assumedconversions . . . . . . . . . . . . . . . . . . . . . . . . . . . . . . . . . . . . . . . . 10,671 10,644 10,362
Basic earnings (loss) from continuing operations per commonshare . . . . . . . . . . . . . . . . . . . . . . . . . . . . . . . . . . . . . . . . . . . . . . . . $ 2.45 $ 4.61 $ (2.95)
Basic loss from discontinued operations per common share . . . . . . . (1.73) (0.52) (0.06)
Basic earnings (loss) per common share . . . . . . . . . . . . . . . . . . . . . . $ 0.72 $ 4.09 $ (3.01)
Diluted earnings (loss) from continuing operations per commonshare . . . . . . . . . . . . . . . . . . . . . . . . . . . . . . . . . . . . . . . . . . . . . . $ 2.42 $ 4.51 $ (2.95)
Diluted loss from discontinued operations per common share . . . (1.71) (0.51) (0.06)
Diluted earnings (loss) per common share . . . . . . . . . . . . . . . . . . . . $ 0.71 $ 4.00 $ (3.01)
For the year ended December 31, 2018, there were 117 anti-dilutive shares that were excluded from theabove calculation.
Note 14. Income Taxes
Income (loss) before income taxes, as shown in the accompanying Consolidated Statements of Operations,includes the following components for the years ended December 31, 2020, 2019, and 2018:
Year Ended December 31,2020 2019 2018
Domestic . . . . . . . . . . . . . . . . . . . . . . . . . . . . . . . . . . . . . . . . . . . . . . . $ 9,618 $18,972 $(32,466)
Foreign . . . . . . . . . . . . . . . . . . . . . . . . . . . . . . . . . . . . . . . . . . . . . . . . 4,364 5,167 7,897
Income (loss) from operations, before income taxes . . . . . . . . . . . . . $13,982 $24,139 $(24,569)
Significant components of the provision for income taxes for the years ended December 31, 2020, 2019, and2018 were as follows:
Year Ended December 31,2020 2019 2018
Current:
Federal . . . . . . . . . . . . . . . . . . . . . . . . . . . . . . . . . . . . . . . . . . . . . . . . . . . . . . $ (9,506) $ 4,012 $ 3,807
State . . . . . . . . . . . . . . . . . . . . . . . . . . . . . . . . . . . . . . . . . . . . . . . . . . . . . . . . 130 620 133
Foreign . . . . . . . . . . . . . . . . . . . . . . . . . . . . . . . . . . . . . . . . . . . . . . . . . . . . . . 1,852 1,925 3,675
Total current . . . . . . . . . . . . . . . . . . . . . . . . . . . . . . . . . . . . . . . . . . . . . . . . . . . . (7,524) 6,557 7,615
Deferred:
Federal . . . . . . . . . . . . . . . . . . . . . . . . . . . . . . . . . . . . . . . . . . . . . . . . . . . . . . (292) (23,661) (55)
State . . . . . . . . . . . . . . . . . . . . . . . . . . . . . . . . . . . . . . . . . . . . . . . . . . . . . . . . (3,458) (6,229) (8)
Foreign . . . . . . . . . . . . . . . . . . . . . . . . . . . . . . . . . . . . . . . . . . . . . . . . . . . . . . (567) (502) (1535)
Total deferred . . . . . . . . . . . . . . . . . . . . . . . . . . . . . . . . . . . . . . . . . . . . . . . . . . . (4,317) (30,392) (1,598)
Total income tax (benefit) expense . . . . . . . . . . . . . . . . . . . . . . . . . . . . . . . . . . $(11,841) $(23,835) $ 6,017
65

The reconciliation of income tax computed at statutory rates to income tax expense for the years endedDecember 31, 2020, 2019, and 2018 is as follows:
Year Ended December 31,2020 2019 2018
Amount Percent Amount Percent Amount Percent
Statutory rate . . . . . . . . . . . . . . . . . . . . . . . . . . $ 2,936 21.0% $ 5,069 21.0% $ (5,159) 21.0%Foreign tax rate differential . . . . . . . . . . . . . . . 65 0.5 129 0.5 156 (0.6)State income taxes, net of federal benefit . . . . 1,003 7.2 83 0.3 (700) 2.8Non-deductible expenses . . . . . . . . . . . . . . . . . 181 1.3 278 1.2 219 (0.9)Tax benefits related to disposition of the Test
and Inspection Services business . . . . . . . . . (16,282) (116.4) — — — —Global intangible low-taxed income, net of tax
credits . . . . . . . . . . . . . . . . . . . . . . . . . . . . . . 621 4.4 145 0.6 171 (0.7)Income tax credits . . . . . . . . . . . . . . . . . . . . . . (1,357) (9.7) (126) (0.5) (633) 2.6Nondeductible executive compensation . . . . . . 132 0.9 234 1.0 351 (1.4)Tax on unremitted foreign earnings . . . . . . . . . 174 1.2 216 0.9 149 (0.6)Change in valuation allowance . . . . . . . . . . . . 731 5.2 (29,966) (124.1) 11,400 (46.4)Other . . . . . . . . . . . . . . . . . . . . . . . . . . . . . . . . . (45) (0.3) 103 0.4 63 (0.3)
Total income tax (benefit) expense / Effectiverate . . . . . . . . . . . . . . . . . . . . . . . . . . . . . . . . $(11,841) (84.7)% $(23,835) (98.7)% $ 6,017 (24.5)%
Significant components of the Company’s deferred tax assets and liabilities as of December 31, 2020 and2019 were as follows:
December 31,2020 2019
Deferred tax assets:Goodwill and other intangibles . . . . . . . . . . . . . . . . . . . . . . . . . . . . . . . . . . . . $ 7,857 $ 8,782Accrued settlement . . . . . . . . . . . . . . . . . . . . . . . . . . . . . . . . . . . . . . . . . . . . . . 8,112 10,196Deferred compensation . . . . . . . . . . . . . . . . . . . . . . . . . . . . . . . . . . . . . . . . . . . 2,351 3,620Contingent liabilities . . . . . . . . . . . . . . . . . . . . . . . . . . . . . . . . . . . . . . . . . . . . 649 786Net operating loss / tax credit carryforwards . . . . . . . . . . . . . . . . . . . . . . . . . . 25,123 1,118Pension and post-retirement liability . . . . . . . . . . . . . . . . . . . . . . . . . . . . . . . . 1,696 1,414Inventories . . . . . . . . . . . . . . . . . . . . . . . . . . . . . . . . . . . . . . . . . . . . . . . . . . . . 1,529 1,118Warranty reserve . . . . . . . . . . . . . . . . . . . . . . . . . . . . . . . . . . . . . . . . . . . . . . . . 297 294Accounts receivable . . . . . . . . . . . . . . . . . . . . . . . . . . . . . . . . . . . . . . . . . . . . . 214 254Other . . . . . . . . . . . . . . . . . . . . . . . . . . . . . . . . . . . . . . . . . . . . . . . . . . . . . . . . . 709 585
Total deferred tax assets . . . . . . . . . . . . . . . . . . . . . . . . . . . . . . . . . . . . . . . . . . . . 48,537 28,167Less: valuation allowance . . . . . . . . . . . . . . . . . . . . . . . . . . . . . . . . . . . . . . . . . . . (1,483) (752)
Net deferred tax assets . . . . . . . . . . . . . . . . . . . . . . . . . . . . . . . . . . . . . . . . . . . . . 47,054 27,415
Deferred tax liabilities:Goodwill and other intangibles . . . . . . . . . . . . . . . . . . . . . . . . . . . . . . . . . . . . (4,116) (4,454)Depreciation . . . . . . . . . . . . . . . . . . . . . . . . . . . . . . . . . . . . . . . . . . . . . . . . . . . (7,140) (5,638)Inventory § 481(a) adjustment . . . . . . . . . . . . . . . . . . . . . . . . . . . . . . . . . . . . . (1,027) (2,065)Unremitted earnings of foreign subsidiaries . . . . . . . . . . . . . . . . . . . . . . . . . . . (200) (390)Other . . . . . . . . . . . . . . . . . . . . . . . . . . . . . . . . . . . . . . . . . . . . . . . . . . . . . . . . . (175) (97)
Total deferred tax liabilities . . . . . . . . . . . . . . . . . . . . . . . . . . . . . . . . . . . . . . . . . (12,658) (12,644)
Net deferred tax assets . . . . . . . . . . . . . . . . . . . . . . . . . . . . . . . . . . . . . . . . . . . . . $ 34,396 $ 14,771
66
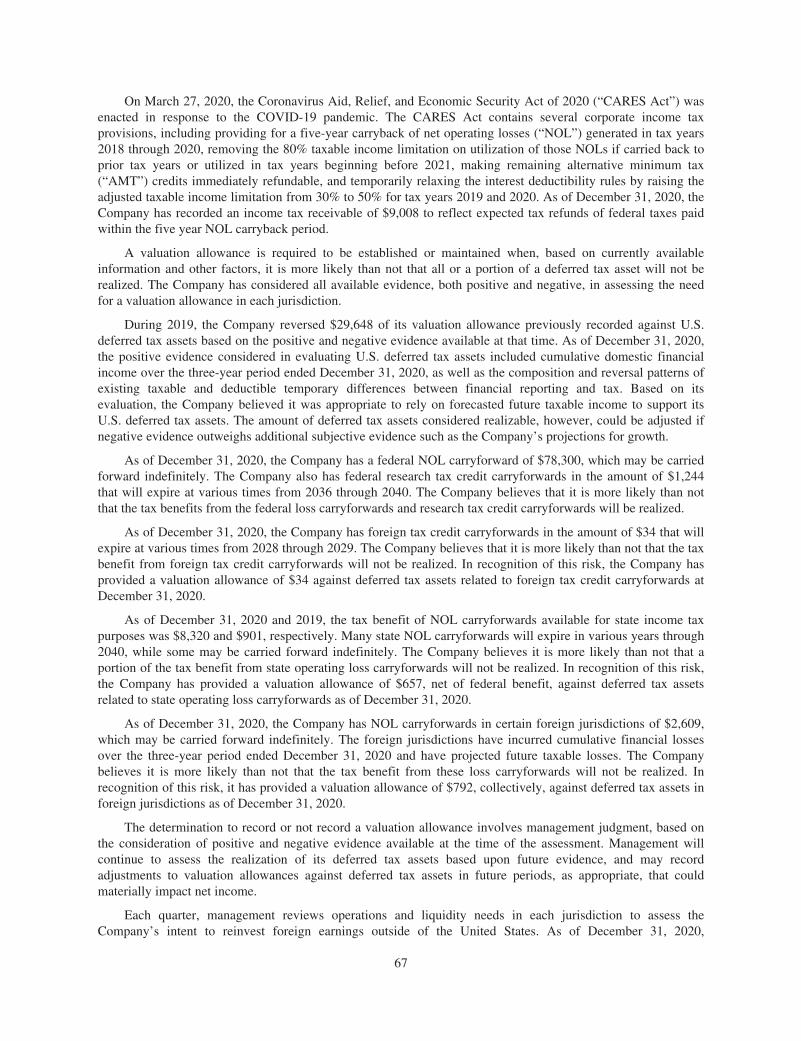
On March 27, 2020, the Coronavirus Aid, Relief, and Economic Security Act of 2020 (“CARES Act”) wasenacted in response to the COVID-19 pandemic. The CARES Act contains several corporate income taxprovisions, including providing for a five-year carryback of net operating losses (“NOL”) generated in tax years2018 through 2020, removing the 80% taxable income limitation on utilization of those NOLs if carried back toprior tax years or utilized in tax years beginning before 2021, making remaining alternative minimum tax(“AMT”) credits immediately refundable, and temporarily relaxing the interest deductibility rules by raising theadjusted taxable income limitation from 30% to 50% for tax years 2019 and 2020. As of December 31, 2020, theCompany has recorded an income tax receivable of $9,008 to reflect expected tax refunds of federal taxes paidwithin the five year NOL carryback period.
A valuation allowance is required to be established or maintained when, based on currently availableinformation and other factors, it is more likely than not that all or a portion of a deferred tax asset will not berealized. The Company has considered all available evidence, both positive and negative, in assessing the needfor a valuation allowance in each jurisdiction.
During 2019, the Company reversed $29,648 of its valuation allowance previously recorded against U.S.deferred tax assets based on the positive and negative evidence available at that time. As of December 31, 2020,the positive evidence considered in evaluating U.S. deferred tax assets included cumulative domestic financialincome over the three-year period ended December 31, 2020, as well as the composition and reversal patterns ofexisting taxable and deductible temporary differences between financial reporting and tax. Based on itsevaluation, the Company believed it was appropriate to rely on forecasted future taxable income to support itsU.S. deferred tax assets. The amount of deferred tax assets considered realizable, however, could be adjusted ifnegative evidence outweighs additional subjective evidence such as the Company’s projections for growth.
As of December 31, 2020, the Company has a federal NOL carryforward of $78,300, which may be carriedforward indefinitely. The Company also has federal research tax credit carryforwards in the amount of $1,244that will expire at various times from 2036 through 2040. The Company believes that it is more likely than notthat the tax benefits from the federal loss carryforwards and research tax credit carryforwards will be realized.
As of December 31, 2020, the Company has foreign tax credit carryforwards in the amount of $34 that willexpire at various times from 2028 through 2029. The Company believes that it is more likely than not that the taxbenefit from foreign tax credit carryforwards will not be realized. In recognition of this risk, the Company hasprovided a valuation allowance of $34 against deferred tax assets related to foreign tax credit carryforwards atDecember 31, 2020.
As of December 31, 2020 and 2019, the tax benefit of NOL carryforwards available for state income taxpurposes was $8,320 and $901, respectively. Many state NOL carryforwards will expire in various years through2040, while some may be carried forward indefinitely. The Company believes it is more likely than not that aportion of the tax benefit from state operating loss carryforwards will not be realized. In recognition of this risk,the Company has provided a valuation allowance of $657, net of federal benefit, against deferred tax assetsrelated to state operating loss carryforwards as of December 31, 2020.
As of December 31, 2020, the Company has NOL carryforwards in certain foreign jurisdictions of $2,609,which may be carried forward indefinitely. The foreign jurisdictions have incurred cumulative financial lossesover the three-year period ended December 31, 2020 and have projected future taxable losses. The Companybelieves it is more likely than not that the tax benefit from these loss carryforwards will not be realized. Inrecognition of this risk, it has provided a valuation allowance of $792, collectively, against deferred tax assets inforeign jurisdictions as of December 31, 2020.
The determination to record or not record a valuation allowance involves management judgment, based onthe consideration of positive and negative evidence available at the time of the assessment. Management willcontinue to assess the realization of its deferred tax assets based upon future evidence, and may recordadjustments to valuation allowances against deferred tax assets in future periods, as appropriate, that couldmaterially impact net income.
Each quarter, management reviews operations and liquidity needs in each jurisdiction to assess theCompany’s intent to reinvest foreign earnings outside of the United States. As of December 31, 2020,
67

management determined that cash balances of its Canadian and United Kingdom subsidiaries exceeded projectedcapital needs by $4,000. Management does not intend for such amounts to be permanently reinvested outside ofthe United States and has therefore accrued foreign withholding taxes of $200 as of December 31, 2020. It ismanagement’s intent and practice to indefinitely reinvest other undistributed earnings outside of the UnitedStates. Determination of the amount of any unrecognized deferred income tax liability associated with theseundistributed earnings is not practicable because of the complexities of the hypothetical calculation.
The following table provides a reconciliation of unrecognized tax benefits as of December 31, 2020 and2019:
December 31,2020 2019
Unrecognized tax benefits at beginning of period: . . . . . . . . . . . . . . . . . . . . . . . . . . . . . . $414 $481
Decreases based on tax positions for prior periods . . . . . . . . . . . . . . . . . . . . . . . . . . . . (5) (67)
Balance at end of period . . . . . . . . . . . . . . . . . . . . . . . . . . . . . . . . . . . . . . . . . . . . . . . . . . $409 $414
The total amount of unrecognized tax benefits that, if recognized, would affect the effective tax rate was$409 as of December 31, 2020. The Company accrues interest and penalties related to unrecognized tax benefitsin its provision for income taxes. As of December 31, 2020 and 2019, the Company had accrued interest andpenalties related to unrecognized tax benefits of $333 and $327, respectively. As of December 31, 2020, theCompany did not expect any material increases or decreases to its unrecognized tax benefits within the next12 months. Ultimate realization of these tax benefits is dependent upon the occurrence of certain events,including the completion of audits by tax authorities and expiration of statutes of limitations.
The Company files income tax returns in the United States and in various state, local, and foreignjurisdictions. The Company is subject to federal income tax examinations for the 2017 period and thereafter.With respect to the state, local, and foreign filings, certain entities of the Company are subject to income taxexaminations for the 2016 period and thereafter.
Note 15. Stock-based Compensation
The Company applies the provisions of ASC 718, “Compensation—Stock-based Compensation,” to accountfor the Company’s stock-based compensation. Stock-based compensation cost is measured at the grant date basedon the calculated fair value of the award and is recognized over the employees’ requisite service period. Stockforfeitures and cancellations are recognized as they occur. The Company recorded stock-based compensationexpense of $1,136, $3,155, and $3,836 for the years ended December 31, 2020, 2019, and 2018, respectively,related to fully-vested stock awards, restricted stock awards, and performance unit awards. As of December 31,2020, unrecognized compensation expense for awards that the Company expects to vest approximated $2,995.The Company will recognize this unrecognized compensation expense over approximately 3.2 years.
Shares issued as a result of vested stock-based compensation generally will be from previously issued sharesthat have been reacquired by the Company and held as treasury stock or authorized but previously unissuedcommon stock.
As of December 31, 2020, the Company had stock awards issued pursuant to the 2006 Omnibus IncentivePlan, as amended and restated in May 2018 (“Omnibus Plan”). The Omnibus Plan allows for the issuance of2,058,000 shares of common stock through the granting of stock options or stock awards (including performanceunits convertible into stock) to key employees and directors at no less than 100% of fair market value on the dateof the grant. The Omnibus Plan provides for the granting of “nonqualified options” with a duration of not morethan ten years from the date of grant. The Omnibus Plan also provides that, unless otherwise set forth in theoption agreement, stock options are exercisable in installments of up to 25% annually beginning one year fromthe date of grant. No stock options have been granted under the Omnibus Plan and, as such, there was no stock-based compensation expense related to stock options recorded in 2020, 2019, or 2018.
68

Non-Employee Director Fully-Vested and Restricted Stock Awards
Prior to May 2018, non-employee directors were awarded fully-vested shares of the Company’s commonstock on each date the non-employee directors were elected at the annual shareholders’ meeting to serve asdirectors. Since May 2018, such annual equity awards have been subject to a one-year vesting requirement.During the quarter ended June 30, 2017, the Nomination and Governance Committee and Board of Directorsjointly approved the Deferred Compensation Plan for Non-Employee Directors under the Omnibus Plan, whichpermits non-employee directors of the Company to defer receipt of earned cash and/or stock compensation forservice on the Board.
The non-employee directors were granted a total of 50,316, 21,532, and 24,427 restricted shares and fully-vested for the years ended December 31, 2020, 2019, and 2018, respectively. Compensation expense recorded bythe Company related to such awards to non-employee directors was approximately $576, $526, and $880 for theyears ended December 31, 2020, 2019, and 2018, respectively. During 2020, 12,058 deferred share units wereallotted to the accounts of the non-employee directors pursuant to the Deferred Compensation Plan forNon-Employee Directors.
The weighted average fair value of all the fully-vested and restricted stock grants awarded was $12.79,$24.38, and $23.64 per share for the years ended December 31, 2020, 2019, and 2018, respectively.
Restricted Stock Awards and Performance Unit Awards
Under the Omnibus Plan, the Company grants certain employees restricted stock and performance unitawards. The forfeitable restricted stock awards granted prior to March 2015 generally time-vest after a four-yearperiod, and those granted subsequent to March 2015 generally time-vest ratably over a three-year period, unlessindicated otherwise by the underlying restricted stock award agreement. Performance unit awards are offeredannually under separate three-year long-term incentive programs. Performance units are subject to forfeiture andwill be converted into common stock based upon the Company’s performance relative to performance measuresand conversion multiples as defined in the underlying program. If the Company’s estimate of the number ofperformance stock awards expected to vest changes in a subsequent accounting period, cumulative compensationexpense could increase or decrease. The change is recognized in the current period for the performance unitawards and would change future expense over the remaining service period.
The following table summarizes the restricted stock award, deferred stock units, and performance unitaward activity for the years ended December 31, 2020, 2019, and 2018:
RestrictedStock
DeferredStockUnits
PerformanceStockUnits
Weighted AverageAggregate Grant
DateFair Value
Outstanding as of January 1, 2018 . . . . . . . . . . 186,806 26,860 181,341 $16.53
Granted . . . . . . . . . . . . . . . . . . . . . . . . . . . . . 62,320 14,914 65,421 27.05
Vested . . . . . . . . . . . . . . . . . . . . . . . . . . . . . (36,876) — — 28.07
Adjustment for incentive awards . . . . . . . . . — — 65,491 26.93
Canceled and forfeited . . . . . . . . . . . . . . . . . (20,425) — (11,880) 16.38
Outstanding as of January 1, 2019 . . . . . . . . . . 191,825 41,774 300,373 $18.61
Granted . . . . . . . . . . . . . . . . . . . . . . . . . . . . . 62,125 12,304 89,092 18.63
Vested . . . . . . . . . . . . . . . . . . . . . . . . . . . . . (90,282) — — 19.61
Adjustment for incentive awards . . . . . . . . . — — (52,180) 24.30
Canceled and forfeited . . . . . . . . . . . . . . . . . (12,869) — (6,137) 20.79
Outstanding as of December 31, 2019 . . . . . . . 150,799 54,078 331,148 $18.50
Granted . . . . . . . . . . . . . . . . . . . . . . . . . . . . . 104,789 12,058 105,857 16.72
Vested . . . . . . . . . . . . . . . . . . . . . . . . . . . . . (73,260) — (163,224) 15.59
69
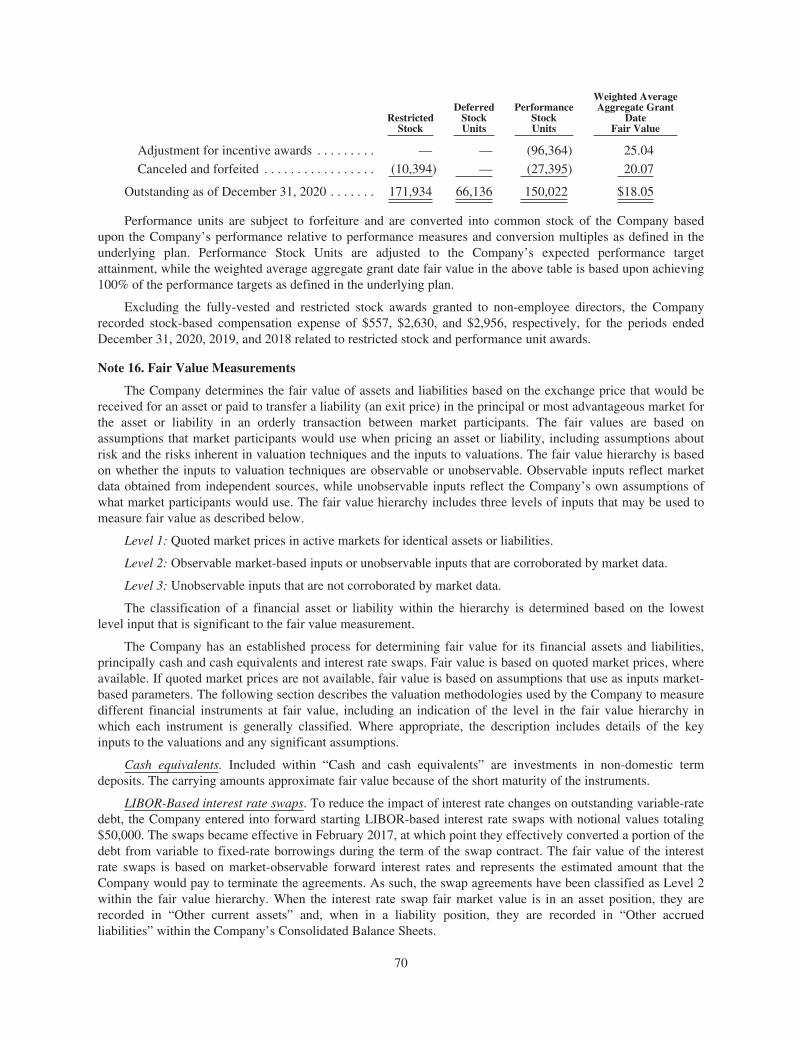
RestrictedStock
DeferredStockUnits
PerformanceStockUnits
Weighted AverageAggregate Grant
DateFair Value
Adjustment for incentive awards . . . . . . . . . — — (96,364) 25.04
Canceled and forfeited . . . . . . . . . . . . . . . . . (10,394) — (27,395) 20.07
Outstanding as of December 31, 2020 . . . . . . . 171,934 66,136 150,022 $18.05
Performance units are subject to forfeiture and are converted into common stock of the Company basedupon the Company’s performance relative to performance measures and conversion multiples as defined in theunderlying plan. Performance Stock Units are adjusted to the Company’s expected performance targetattainment, while the weighted average aggregate grant date fair value in the above table is based upon achieving100% of the performance targets as defined in the underlying plan.
Excluding the fully-vested and restricted stock awards granted to non-employee directors, the Companyrecorded stock-based compensation expense of $557, $2,630, and $2,956, respectively, for the periods endedDecember 31, 2020, 2019, and 2018 related to restricted stock and performance unit awards.
Note 16. Fair Value Measurements
The Company determines the fair value of assets and liabilities based on the exchange price that would bereceived for an asset or paid to transfer a liability (an exit price) in the principal or most advantageous market forthe asset or liability in an orderly transaction between market participants. The fair values are based onassumptions that market participants would use when pricing an asset or liability, including assumptions aboutrisk and the risks inherent in valuation techniques and the inputs to valuations. The fair value hierarchy is basedon whether the inputs to valuation techniques are observable or unobservable. Observable inputs reflect marketdata obtained from independent sources, while unobservable inputs reflect the Company’s own assumptions ofwhat market participants would use. The fair value hierarchy includes three levels of inputs that may be used tomeasure fair value as described below.
Level 1: Quoted market prices in active markets for identical assets or liabilities.
Level 2: Observable market-based inputs or unobservable inputs that are corroborated by market data.
Level 3: Unobservable inputs that are not corroborated by market data.
The classification of a financial asset or liability within the hierarchy is determined based on the lowestlevel input that is significant to the fair value measurement.
The Company has an established process for determining fair value for its financial assets and liabilities,principally cash and cash equivalents and interest rate swaps. Fair value is based on quoted market prices, whereavailable. If quoted market prices are not available, fair value is based on assumptions that use as inputs market-based parameters. The following section describes the valuation methodologies used by the Company to measuredifferent financial instruments at fair value, including an indication of the level in the fair value hierarchy inwhich each instrument is generally classified. Where appropriate, the description includes details of the keyinputs to the valuations and any significant assumptions.
Cash equivalents. Included within “Cash and cash equivalents” are investments in non-domestic termdeposits. The carrying amounts approximate fair value because of the short maturity of the instruments.
LIBOR-Based interest rate swaps. To reduce the impact of interest rate changes on outstanding variable-ratedebt, the Company entered into forward starting LIBOR-based interest rate swaps with notional values totaling$50,000. The swaps became effective in February 2017, at which point they effectively converted a portion of thedebt from variable to fixed-rate borrowings during the term of the swap contract. The fair value of the interestrate swaps is based on market-observable forward interest rates and represents the estimated amount that theCompany would pay to terminate the agreements. As such, the swap agreements have been classified as Level 2within the fair value hierarchy. When the interest rate swap fair market value is in an asset position, they arerecorded in “Other current assets” and, when in a liability position, they are recorded in “Other accruedliabilities” within the Company’s Consolidated Balance Sheets.
70

The following assets and liabilities of the Company were measured at fair value on a recurring basis subjectto the disclosure requirements of ASC 820, “Fair Value Measurement,” as of December 31, 2020 and 2019:
Fair Value Measurements as of December 31, 2020 Fair Value Measurements as of December 31, 2019
December 31,2020
QuotedPrices inActive
Marketsfor
IdenticalAssets
(Level 1)
SignificantOther
ObservableInputs
(Level 2)
SignificantUnobservable
Inputs(Level 3)
December 31,2019
QuotedPrices inActive
Marketsfor
IdenticalAssets
(Level 1)
SignificantOther
ObservableInputs
(Level 2)
SignificantUnobservable
Inputs(Level 3)
Term deposits . . . . . . . . . $ 18 $18 $ — $— $ 17 $17 $ — $—
Total assets . . . . . . . . . $ 18 $18 $ — $— $ 17 $17 $ — $—
Interest rate swaps . . . . . $1,097 $— $1,097 $— $480 $— $480 $—
Total liabilities . . . . . . $1,097 $— $1,097 $— $480 $— $480 $—
The Company had accounted for its interest rate swaps as cash flow hedges and the objective of thesehedges was to offset the expected interest variability on payments associated with the interest rate on its debt. Inthe third quarter of 2020, the Company de-designated its cash flow hedges and accounts for all existing andfuture interest rate swaps on a mark-to-market basis with changes in fair value recorded in current periodearnings. In connection with this de-designation, the Company froze the balances recorded in “Accumulatedother comprehensive loss” at June 30, 2020 and reclassifies balances to earnings as the underlying physicaltransactions occur, unless it is no longer probable that the physical transaction will occur, at which time therelated gains deferred in “Other Comprehensive Income” will be immediately recorded in earnings. The gainsand losses related to the interest rate swaps are reclassified from “Accumulated other comprehensive loss” in theConsolidated Balance Sheets and included in “Interest expense -net” in the Company’s Consolidated Statementsof Operations as the interest expense from its debt is recognized. For the year ended December 31, 2020, 2019,and 2018, the Company recognized interest expense from interest rate swaps of $289 and interest income frominterest rate swaps was $114, and $34, respectively.
As a result of the de-designation of the interest rate swaps, the Company recognized interest income of $470from the change in fair value of the interest rate swaps in “Interest expense — net” in the ConsolidatedStatements of Operations for the twelve months ended December 31, 2020.
The gross carrying value of the Company’s revolving credit facility approximates fair value for the periodspresented. Additional information regarding the revolving credit facility can be found in Note 10.
Information regarding the fair value disclosures associated with the assets of the Company’s defined benefitplans can be found in Note 17.
Note 17. Retirement Plans
The Company has three retirement plans that cover its hourly and salaried employees in the United States:one defined benefit plan, which is frozen, and two defined contribution plans. Employees are eligible toparticipate in the appropriate plan based on employment classification. The Company’s contributions to thedefined benefit and defined contribution plans are governed by the Employee Retirement Income Security Act of1974, as amended (“ERISA”) and the Company’s policy and investment guidelines of the applicable plan. TheCompany’s policy is to contribute at least the required minimum in accordance with the funding standards ofERISA.
The Company maintains two defined contribution plans for its employees in Canada, as well as a post-retirement benefit plan. In the United Kingdom, the Company maintains two defined contribution plans and adefined benefit plan, which is frozen. These plans are discussed in further detail below.
71

United States Defined Benefit Plan
The following tables present a reconciliation of the changes in the benefit obligation, the fair market valueof the assets, and the funded status of the plan, as of December 31, 2020 and 2019:
December 31,2020 2019
Changes in benefit obligation:
Benefit obligation at beginning of year . . . . . . . . . . . . . . . . . . . . . . . . . . . . . . . . $ 7,809 $16,717
Interest cost . . . . . . . . . . . . . . . . . . . . . . . . . . . . . . . . . . . . . . . . . . . . . . . . . . . . . 224 648
Actuarial loss . . . . . . . . . . . . . . . . . . . . . . . . . . . . . . . . . . . . . . . . . . . . . . . . . . . . 813 400
Benefits paid . . . . . . . . . . . . . . . . . . . . . . . . . . . . . . . . . . . . . . . . . . . . . . . . . . . . (398) (840)
Settlements . . . . . . . . . . . . . . . . . . . . . . . . . . . . . . . . . . . . . . . . . . . . . . . . . . . . . . — (9,116)
Benefit obligation at end of year . . . . . . . . . . . . . . . . . . . . . . . . . . . . . . . . . . . . . . . $ 8,448 $ 7,809
Change to plan assets:
Fair value of assets at beginning of year . . . . . . . . . . . . . . . . . . . . . . . . . . . . . . . $ 4,360 $12,468
Actual gain on plan assets . . . . . . . . . . . . . . . . . . . . . . . . . . . . . . . . . . . . . . . . . . 197 1,298
Employer contribution . . . . . . . . . . . . . . . . . . . . . . . . . . . . . . . . . . . . . . . . . . . . . 300 550
Benefits paid . . . . . . . . . . . . . . . . . . . . . . . . . . . . . . . . . . . . . . . . . . . . . . . . . . . . (398) (840)
Settlements . . . . . . . . . . . . . . . . . . . . . . . . . . . . . . . . . . . . . . . . . . . . . . . . . . . . . . — (9,116)
Fair value of assets at end of year . . . . . . . . . . . . . . . . . . . . . . . . . . . . . . . . . . . . . . 4,459 4,360
Funded status at end of year . . . . . . . . . . . . . . . . . . . . . . . . . . . . . . . . . . . . . . . . . . . $(3,989) $ (3,449)
Amounts recognized in the consolidated balance sheets consist of:
Other long-term liabilities . . . . . . . . . . . . . . . . . . . . . . . . . . . . . . . . . . . . . . . . . . $(3,989) $ (3,449)
Amounts recognized in accumulated other comprehensive loss consist of:
Net loss . . . . . . . . . . . . . . . . . . . . . . . . . . . . . . . . . . . . . . . . . . . . . . . . . . . . . . . . . $ 2,686 $ 1,893
The actuarial loss included in accumulated other comprehensive loss that will be recognized in net periodicpension cost during 2021 is $24, before taxes.
Net periodic pension costs for the years ended December 31, 2020, 2019, and 2018 were as follows:
Year Ended December 31,2020 2019 2018
Components of net periodic benefit cost:
Interest cost . . . . . . . . . . . . . . . . . . . . . . . . . . . . . . . . . . . . 224 648 622
Expected return on plan assets . . . . . . . . . . . . . . . . . . . . . (230) (719) (853)
Recognized net actuarial loss . . . . . . . . . . . . . . . . . . . . . . 53 125 96
Net periodic pension cost (income) . . . . . . . . . . . . . . . . . . . $ 47 $ 54 $(135)
Settlement charge . . . . . . . . . . . . . . . . . . . . . . . . . . . . . . . — 2,210 —
Total pension expense (income) . . . . . . . . . . . . . . . . . . . . . . $ 47 $2,264 $(135)
72

The weighted average assumptions in the following table represent the rates used to develop the actuarialpresent value of the projected benefit obligation for the year listed and also the net periodic benefit cost for thefollowing year.
Year Ended December 31,2020 2019 2018
Discount rate . . . . . . . . . . . . . . . . . . . . . . . . . . . . . . . . . . . . . 3.0% 4.0% 3.4%
Expected rate of return on plan assets . . . . . . . . . . . . . . . . . 5.3% 5.9% 5.9%
The expected long-term rate of return is based on numerous factors, including the target asset allocation forplan assets, historical rate of return, long-term inflation assumptions, and current and projected marketconditions.
Amounts applicable to the Company’s pension plan with accumulated benefit obligations in excess of planassets were as follows as of December 31, 2020 and 2019:
December 31,2020 2019
Projected benefit obligation . . . . . . . . . . . . . . . . . . . . . . . . . . . . . . . . . . . . . . . . . . . . $8,448 $7,809
Accumulated benefit obligation . . . . . . . . . . . . . . . . . . . . . . . . . . . . . . . . . . . . . . . . . 8,448 7,809
Fair value of plan assets . . . . . . . . . . . . . . . . . . . . . . . . . . . . . . . . . . . . . . . . . . . . . . . 4,459 4,360
Plan assets consist primarily of various fixed income and equity investments. The Company’s primaryinvestment objective is to provide long-term growth of capital while accepting a moderate level of risk. Theinvestments are limited to cash and cash equivalents, bonds, preferred stocks, and common stocks. The invest-ment target ranges and actual allocation of pension plan assets by major category as of December 31, 2020 and2019 were as follows:
TargetDecember 31,
2020 2019
Asset Category
Cash and cash equivalents . . . . . . . . . . . . . . . . . . . . . . . . . . . . . . . . . . . . . . . . . 0 - 20% 9% 19%
Total fixed income funds . . . . . . . . . . . . . . . . . . . . . . . . . . . . . . . . . . . . . . . . . . 25 - 50% 32 30
Total mutual funds and equities . . . . . . . . . . . . . . . . . . . . . . . . . . . . . . . . . . . . . 35 - 70% 59 51
Total . . . . . . . . . . . . . . . . . . . . . . . . . . . . . . . . . . . . . . . . . . . . . . . . . . . . . . . . . . . . 100% 100%
In accordance with the fair value disclosure requirements of ASC 820, “Fair Value Measurements andDisclosures,” the following assets were measured at fair value on a recurring basis as of December 31, 2020 and2019. Additional information regarding ASC 820 and the fair value hierarchy can be found in Note 16.
December 31,2020 2019
Asset Category
Cash and cash equivalents . . . . . . . . . . . . . . . . . . . . . . . . . . . . . . . . . . . . . . . . . . . . $ 399 $ 817
Fixed income funds
Corporate bonds . . . . . . . . . . . . . . . . . . . . . . . . . . . . . . . . . . . . . . . . . . . . . . . . . 1,440 1,336
Total fixed income funds . . . . . . . . . . . . . . . . . . . . . . . . . . . . . . . . . . . . . . . . . . . . . 1,440 1,336
Equity funds and equities
Mutual funds . . . . . . . . . . . . . . . . . . . . . . . . . . . . . . . . . . . . . . . . . . . . . . . . . . . . 713 694
Exchange-traded funds . . . . . . . . . . . . . . . . . . . . . . . . . . . . . . . . . . . . . . . . . . . . 1,907 1,513
Total mutual funds and equities . . . . . . . . . . . . . . . . . . . . . . . . . . . . . . . . . . . . . . . 2,620 2,207
Total . . . . . . . . . . . . . . . . . . . . . . . . . . . . . . . . . . . . . . . . . . . . . . . . . . . . . . . . . . . . . . $4,459 $4,360
73

Cash equivalents: The Company uses quoted market prices to determine the fair value of these investmentsin interest-bearing cash accounts and they are classified as Level 1 of the fair value hierarchy. The carryingamounts approximate fair value because of the short maturity of the instruments.
Fixed income funds: Investments within the fixed income funds category consist of fixed income corporatedebt. The Company uses quoted market prices to determine the fair values of these fixed income funds. Theseinstruments consist of exchange-traded government and corporate bonds and are classified as Level 1 of the fairvalue hierarchy.
Equity funds and equities: The valuation of investments in registered investment companies is based on theunderlying investments in securities. Securities traded on security exchanges are valued at the latest quoted salesprice. Securities traded in the over-the-counter market and listed securities for which no sale was reported on thatdate are valued at the average of the last reported bid and ask quotations. These investments are classified asLevel 1 of the fair value hierarchy.
The Company currently anticipates contributions of $1,000 to its United States defined benefit plan in 2021.
The following benefit payments are expected to be paid during the years indicated:
Year Ending December 31,
2021 . . . . . . . . . . . . . . . . . . . . . . . . . . . . . . . . . . . . . . . . . . . . . . . . . . . . . . . . . . . . . . . . . . . . . . . $ 468
2022 . . . . . . . . . . . . . . . . . . . . . . . . . . . . . . . . . . . . . . . . . . . . . . . . . . . . . . . . . . . . . . . . . . . . . . . 467
2023 . . . . . . . . . . . . . . . . . . . . . . . . . . . . . . . . . . . . . . . . . . . . . . . . . . . . . . . . . . . . . . . . . . . . . . . 491
2024 . . . . . . . . . . . . . . . . . . . . . . . . . . . . . . . . . . . . . . . . . . . . . . . . . . . . . . . . . . . . . . . . . . . . . . . 487
2025 . . . . . . . . . . . . . . . . . . . . . . . . . . . . . . . . . . . . . . . . . . . . . . . . . . . . . . . . . . . . . . . . . . . . . . . 478
Years 2026-2030 . . . . . . . . . . . . . . . . . . . . . . . . . . . . . . . . . . . . . . . . . . . . . . . . . . . . . . . . . . . . . 2,255
United Kingdom Defined Benefit Plan
The Company’s U.K. defined benefit plan covers certain current employees, former employees, and retirees.The plan has been frozen to new entrants since April 1, 1997 and also covers the former employees of a mergedplan after January 2002. Benefits under the plan were based on years of service and eligible compensation duringdefined periods of service. The Company’s funding policy for the plan is to make minimum annual contributionsrequired by applicable regulations.
The funded status of the United Kingdom defined benefit plan as of December 31, 2020 and 2019 was asfollows:
December 31,2020 2019
Changes in benefit obligation:
Benefit obligation at beginning of year . . . . . . . . . . . . . . . . . . . . . . . . . . . . . . $ 9,101 $ 7,750
Interest cost . . . . . . . . . . . . . . . . . . . . . . . . . . . . . . . . . . . . . . . . . . . . . . . . . . . 184 221
Actuarial loss (gain) . . . . . . . . . . . . . . . . . . . . . . . . . . . . . . . . . . . . . . . . . . . . . 996 1,142
Benefits paid . . . . . . . . . . . . . . . . . . . . . . . . . . . . . . . . . . . . . . . . . . . . . . . . . . (283) (326)
Foreign currency exchange rate changes . . . . . . . . . . . . . . . . . . . . . . . . . . . . . 267 314
Benefit obligation at end of year . . . . . . . . . . . . . . . . . . . . . . . . . . . . . . . . . . . . . $10,265 $ 9,101
Change to plan assets:
Fair value of assets at beginning of year . . . . . . . . . . . . . . . . . . . . . . . . . . . . . $ 7,290 $ 6,347
Actual gain (loss) on plan assets . . . . . . . . . . . . . . . . . . . . . . . . . . . . . . . . . . . 453 697
Employer contribution . . . . . . . . . . . . . . . . . . . . . . . . . . . . . . . . . . . . . . . . . . . 337 314
Benefits paid . . . . . . . . . . . . . . . . . . . . . . . . . . . . . . . . . . . . . . . . . . . . . . . . . . (319) (326)
Foreign currency exchange rate changes . . . . . . . . . . . . . . . . . . . . . . . . . . . . . 214 258
74
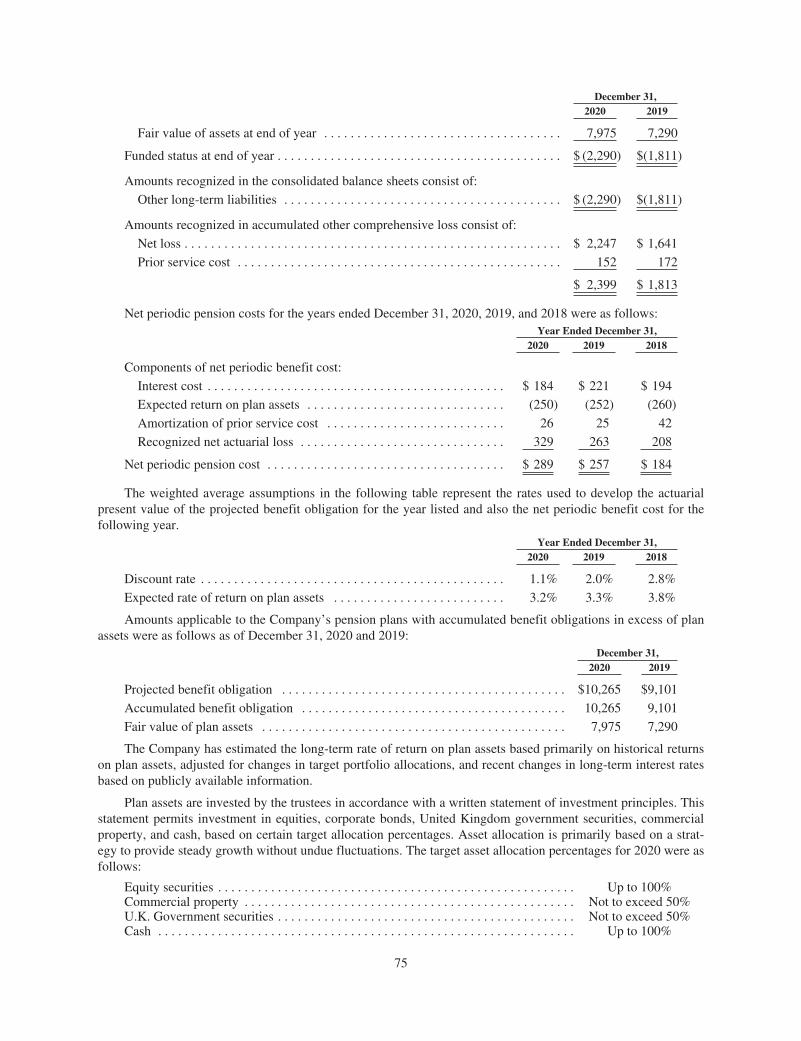
December 31,2020 2019
Fair value of assets at end of year . . . . . . . . . . . . . . . . . . . . . . . . . . . . . . . . . . . . 7,975 7,290
Funded status at end of year . . . . . . . . . . . . . . . . . . . . . . . . . . . . . . . . . . . . . . . . . . . $ (2,290) $(1,811)
Amounts recognized in the consolidated balance sheets consist of:
Other long-term liabilities . . . . . . . . . . . . . . . . . . . . . . . . . . . . . . . . . . . . . . . . . . $ (2,290) $(1,811)
Amounts recognized in accumulated other comprehensive loss consist of:
Net loss . . . . . . . . . . . . . . . . . . . . . . . . . . . . . . . . . . . . . . . . . . . . . . . . . . . . . . . . . $ 2,247 $ 1,641
Prior service cost . . . . . . . . . . . . . . . . . . . . . . . . . . . . . . . . . . . . . . . . . . . . . . . . . 152 172
$ 2,399 $ 1,813
Net periodic pension costs for the years ended December 31, 2020, 2019, and 2018 were as follows:Year Ended December 31,
2020 2019 2018
Components of net periodic benefit cost:
Interest cost . . . . . . . . . . . . . . . . . . . . . . . . . . . . . . . . . . . . . . . . . . . . . $ 184 $ 221 $ 194
Expected return on plan assets . . . . . . . . . . . . . . . . . . . . . . . . . . . . . . (250) (252) (260)
Amortization of prior service cost . . . . . . . . . . . . . . . . . . . . . . . . . . . 26 25 42
Recognized net actuarial loss . . . . . . . . . . . . . . . . . . . . . . . . . . . . . . . 329 263 208
Net periodic pension cost . . . . . . . . . . . . . . . . . . . . . . . . . . . . . . . . . . . . $ 289 $ 257 $ 184
The weighted average assumptions in the following table represent the rates used to develop the actuarialpresent value of the projected benefit obligation for the year listed and also the net periodic benefit cost for thefollowing year.
Year Ended December 31,2020 2019 2018
Discount rate . . . . . . . . . . . . . . . . . . . . . . . . . . . . . . . . . . . . . . . . . . . . . . 1.1% 2.0% 2.8%
Expected rate of return on plan assets . . . . . . . . . . . . . . . . . . . . . . . . . . 3.2% 3.3% 3.8%
Amounts applicable to the Company’s pension plans with accumulated benefit obligations in excess of planassets were as follows as of December 31, 2020 and 2019:
December 31,2020 2019
Projected benefit obligation . . . . . . . . . . . . . . . . . . . . . . . . . . . . . . . . . . . . . . . . . . . $10,265 $9,101
Accumulated benefit obligation . . . . . . . . . . . . . . . . . . . . . . . . . . . . . . . . . . . . . . . . 10,265 9,101
Fair value of plan assets . . . . . . . . . . . . . . . . . . . . . . . . . . . . . . . . . . . . . . . . . . . . . . 7,975 7,290
The Company has estimated the long-term rate of return on plan assets based primarily on historical returnson plan assets, adjusted for changes in target portfolio allocations, and recent changes in long-term interest ratesbased on publicly available information.
Plan assets are invested by the trustees in accordance with a written statement of investment principles. Thisstatement permits investment in equities, corporate bonds, United Kingdom government securities, commercialproperty, and cash, based on certain target allocation percentages. Asset allocation is primarily based on a strat-egy to provide steady growth without undue fluctuations. The target asset allocation percentages for 2020 were asfollows:
Equity securities . . . . . . . . . . . . . . . . . . . . . . . . . . . . . . . . . . . . . . . . . . . . . . . . . . . . . . Up to 100%Commercial property . . . . . . . . . . . . . . . . . . . . . . . . . . . . . . . . . . . . . . . . . . . . . . . . . . Not to exceed 50%U.K. Government securities . . . . . . . . . . . . . . . . . . . . . . . . . . . . . . . . . . . . . . . . . . . . . Not to exceed 50%Cash . . . . . . . . . . . . . . . . . . . . . . . . . . . . . . . . . . . . . . . . . . . . . . . . . . . . . . . . . . . . . . . Up to 100%
75

Plan assets held within the United Kingdom defined benefit plan consist of cash and equity securities thathave been classified as Level 1 of the fair value hierarchy. All other plan assets have been classified as Level 2 ofthe fair value hierarchy.
The plan assets by category for the years ended December 31, 2020 and 2019 were as follows:
December 31,2020 2019
Asset Category
Cash and cash equivalents . . . . . . . . . . . . . . . . . . . . . . . . . . . . . . . . . . . . . . . . . . . . $ 348 $ 516
Equity securities . . . . . . . . . . . . . . . . . . . . . . . . . . . . . . . . . . . . . . . . . . . . . . . . . . . 3,101 2,090
Bonds . . . . . . . . . . . . . . . . . . . . . . . . . . . . . . . . . . . . . . . . . . . . . . . . . . . . . . . . . . . . 3,410 3,735
Other . . . . . . . . . . . . . . . . . . . . . . . . . . . . . . . . . . . . . . . . . . . . . . . . . . . . . . . . . . . . 1,116 949
Total . . . . . . . . . . . . . . . . . . . . . . . . . . . . . . . . . . . . . . . . . . . . . . . . . . . . . . . . . . . . . . $7,975 $7,290
United Kingdom regulations require trustees to adopt a prudent approach to funding required contributionsto defined benefit pension plans. The Company anticipates making contributions of $337 to the United Kingdomdefined benefit plan during 2021.
The following estimated future benefits payments are expected to be paid under the United Kingdomdefined benefit plan:
Year Ending December 31,
2021 . . . . . . . . . . . . . . . . . . . . . . . . . . . . . . . . . . . . . . . . . . . . . . . . . . . . . . . . . . . . . . . . . . . . . . . $ 306
2022 . . . . . . . . . . . . . . . . . . . . . . . . . . . . . . . . . . . . . . . . . . . . . . . . . . . . . . . . . . . . . . . . . . . . . . . 318
2023 . . . . . . . . . . . . . . . . . . . . . . . . . . . . . . . . . . . . . . . . . . . . . . . . . . . . . . . . . . . . . . . . . . . . . . . 377
2024 . . . . . . . . . . . . . . . . . . . . . . . . . . . . . . . . . . . . . . . . . . . . . . . . . . . . . . . . . . . . . . . . . . . . . . . 404
2025 . . . . . . . . . . . . . . . . . . . . . . . . . . . . . . . . . . . . . . . . . . . . . . . . . . . . . . . . . . . . . . . . . . . . . . . 429
Years 2026-2030 . . . . . . . . . . . . . . . . . . . . . . . . . . . . . . . . . . . . . . . . . . . . . . . . . . . . . . . . . . . . . 1,844
Other Post-Retirement Benefit Plan
The Company’s operation near Montreal, Quebec, Canada, maintains a post-retirement benefit plan, whichprovides retiree life insurance, health care benefits, and, for a closed group of employees, dental care. Retiringemployees with a minimum of 10 years of service are eligible for the plan benefits. The plan is not funded. Costof benefits earned by employees is charged to expense as services are rendered. The expense related to this planwas not material for 2020 or 2019. The accrued benefit obligation was $932 and $840 as of December 31, 2020and 2019, respectively. This obligation is recognized within “Other long-term liabilities” on the ConsolidatedBalance Sheets. Benefit payments anticipated for 2021 are not material.
The weighted average assumptions in the following table represent the rates used to develop the actuarialpresent value of the projected benefit obligation for the year listed and also the net periodic benefit cost for thefollowing year.
Year Ended December 31,2020 2019
Discount rate . . . . . . . . . . . . . . . . . . . . . . . . . . . . . . . . . . . . . . . . . . . . . . . . . . . . 2.5% 3.1%
Weighted average health care trend rate . . . . . . . . . . . . . . . . . . . . . . . . . . . . . . . 4.8% 4.9%
The weighted average health care rate is assumed to trend downward to an ultimate rate of 4.0% in 2040.
76

Defined Contribution Plans
The Company sponsors six defined contribution plans for hourly and salaried employees across its domesticand international facilities. The following table summarizes the expense associated with the contributions madeto these plans.
Year EndedDecember 31,
2020 2019 2018
United States . . . . . . . . . . . . . . . . . . . . . . . . . . . . . . . . . . . . . . . . . . . . . . . . $ 866 $2,323 $2,762
Canada . . . . . . . . . . . . . . . . . . . . . . . . . . . . . . . . . . . . . . . . . . . . . . . . . . . . . 137 144 193
United Kingdom . . . . . . . . . . . . . . . . . . . . . . . . . . . . . . . . . . . . . . . . . . . . . . 437 442 451
$1,440 $2,909 $3,406
Note 18. Commitments and Contingent Liabilities
The Company is subject to product warranty claims that arise in the ordinary course of its business. Forcertain manufactured products, the Company maintains a product warranty accrual that is adjusted on a monthlybasis as a percentage of cost of sales. This product warranty accrual is periodically adjusted based on theidentification or resolution of known individual product warranty claims.
The following table sets forth the Company’s product warranty accrual:
Warranty Liability
Balance as of December 31, 2019 . . . . . . . . . . . . . . . . . . . . . . . . . . . . . . . . . . . . . . . . . $1,222
Additions to warranty liability . . . . . . . . . . . . . . . . . . . . . . . . . . . . . . . . . . . . . . . . . . . 801
Warranty liability utilized . . . . . . . . . . . . . . . . . . . . . . . . . . . . . . . . . . . . . . . . . . . . . . . (774)
Balance as of December 31, 2020 . . . . . . . . . . . . . . . . . . . . . . . . . . . . . . . . . . . . . . . . . $1,249
During the year ended December 31, 2018, the Company incurred a charge of $611 within “Cost of goodssold” in the Company’s Rail segment related to a commercial decision to support a customer concern related to aprevious project.
On March 13, 2019, the Company and its subsidiary, CXT Incorporated entered into a SettlementAgreement (the “Settlement Agreement”) with Union Pacific Railroad (“UPRR”) to resolve litigation in thematter of Union Pacific Railroad Company v. L.B. Foster Company and CXT Incorporated, Case No. CI 15-564,in the District Court for Douglas County, Nebraska.
Under the Settlement Agreement, the Company and CXT will pay UPRR the aggregate amount of $50,000without prejudgment interest, beginning with a $2,000 immediate payment, and with the remaining $48,000 paidin installments over a six-year period commencing on March 13, 2019 through December 2024 pursuant to aPromissory Note. Additionally, commencing in January 2019 and through December 2024, UPRR agreed topurchase from the Company and its subsidiaries and affiliates, a cumulative total amount of $48,000 of productsand services, targeting $8,000 of annual purchases per year beginning with 2019 per letters of intent under theSettlement Agreement. The Settlement Agreement also includes a mutual release of all claims and liabilityregarding or relating to all CXT pre-stressed concrete railroad ties with no admission of liability and dismissal ofthe litigation with prejudice.
77

The expected payments under the UPRR settlement agreement for the year ending December 31, 2021 andthereafter were as follows:
Year Ending December 31,
2021 . . . . . . . . . . . . . . . . . . . . . . . . . . . . . . . . . . . . . . . . . . . . . . . . . . . . . . . . . . . . . . . . . . . . . . $ 8,0002022 . . . . . . . . . . . . . . . . . . . . . . . . . . . . . . . . . . . . . . . . . . . . . . . . . . . . . . . . . . . . . . . . . . . . . . 8,0002023 . . . . . . . . . . . . . . . . . . . . . . . . . . . . . . . . . . . . . . . . . . . . . . . . . . . . . . . . . . . . . . . . . . . . . . 8,0002024 . . . . . . . . . . . . . . . . . . . . . . . . . . . . . . . . . . . . . . . . . . . . . . . . . . . . . . . . . . . . . . . . . . . . . . 8,000
Total . . . . . . . . . . . . . . . . . . . . . . . . . . . . . . . . . . . . . . . . . . . . . . . . . . . . . . . . . . . . . . . . . . . . . . $32,000
The Company reclassified $6,600 of the previously accrued warranty reserve related to the UPRR matterinto its aggregate accrued settlement liability of $50,000 as of December 31, 2018. Therefore, the Companyrecognized $43,400 in expense for the year ended December 31, 2018 for the remaining amount per theSettlement Agreement, which was recorded in “Concrete Tie Settlement expense” within its ConsolidatedStatements of Operations. As of December 31, 2020 and 2019, $8,000 and $8,000 was recorded within “Currentportion of accrued settlement,” respectively, and $24,000 and $32,000 was recorded within “Long-term portionof accrued settlement,” respectively, within its Consolidated Balance Sheets.
Other Legal Matters
The Company is also subject to other legal proceedings and claims that arise in the ordinary course of itsbusiness. Legal actions are subject to inherent uncertainties, and future events could change management’sassessment of the probability or estimated amount of potential losses from pending or threatened legal actions.Based on available information, it is the opinion of management that the ultimate resolution of pending orthreatened legal actions, both individually and in the aggregate, will not result in losses having a material adverseeffect on the Company’s financial position or liquidity as of December 31, 2020.
If management believes that, based on available information, it is at least reasonably possible that a materialloss (or additional material loss in excess of any accrual) will be incurred in connection with any legal actions,the Company discloses an estimate of the possible loss or range of loss, either individually or in the aggregate, asappropriate, if such an estimate can be made, or discloses that an estimate cannot be made. Based on theCompany’s assessment as of December 31, 2020, no such disclosures were considered necessary.
Environmental Matters
The Company is subject to national, state, foreign, provincial, and/or local laws and regulations relating tothe protection of the environment. The Company’s efforts to comply with environmental regulations may have anadverse effect on its future earnings. On June 5, 2017, a General Notice Letter was received from the UnitedStates Environmental Protection Agency (“EPA”) indicating that the Company may be a potentially responsibleparty (“PRP”) regarding the Portland Harbor Superfund Site cleanup along with numerous other companies.More than 140 other companies received such a notice. The Company and a predecessor owned and operated afacility near the harbor site for a period prior to 1982. The net present value and undiscounted costs of theselected remedy throughout the harbor site are estimated by the EPA to be approximately $1.1 billion and$1.7 billion, respectively, and the active remedial work is expected to take as long as 13 years to complete. TheCompany is reviewing the basis for its identification by the EPA and the nature of the historic operations of aCompany predecessor near the site. Additionally, the Company executed a PRP agreement to participate in aprivate allocation process among almost 100 PRPs in a working group whose work began in 2008 and whosework is ongoing. The Company cannot predict the ultimate impact of these proceedings because of the largenumber of PRPs involved throughout the harbor site, the degree of contamination of various wastes, varyingenvironmental impacts throughout the harbor site, the scarcity of data related to the facility once operated by theCompany and a predecessor, and the speculative nature of the remediation costs. Based upon informationcurrently available, management does not believe that the Company’s alleged PRP status regarding the PortlandHarbor Superfund Site or other compliance with the present environmental protection laws will have a materialadverse effect on the financial condition, results of operations, cash flows, competitive position, or capitalexpenditures of the Company.
78

The following table sets forth the Company’s undiscounted environmental obligation:
Environmental Liability
Balance as of December 31, 2019 . . . . . . . . . . . . . . . . . . . . . . . . . . . . . . . . . . . . . $2,608
Additions to environmental obligations . . . . . . . . . . . . . . . . . . . . . . . . . . . . . . . . . 8
Environmental obligations utilized . . . . . . . . . . . . . . . . . . . . . . . . . . . . . . . . . . . . (54)
Balance as of December 31, 2020 . . . . . . . . . . . . . . . . . . . . . . . . . . . . . . . . . . . . . $2,562
As a result of the September 4, 2020 sale of Test and Inspection Services, environmental obligations of$3,460 were removed from the Company’s liability.
Note 19. Other (Income) Expense
The following table summarizes the Company’s other (income) expense for the years ended December 31,2020, 2019, and 2018.
2020 2019 2018
Disbursement from an unconsolidated partnership (a) . . . . . . . . . . . . . $(1,874) $ — $ —
Loss on Infrastructure Solutions segment relocation and closureactivities (b) . . . . . . . . . . . . . . . . . . . . . . . . . . . . . . . . . . . . . . . . . . . . 673 1,768 —
Loss on U.S. pension settlement (c) . . . . . . . . . . . . . . . . . . . . . . . . . . . . — 2,210 —
Loss on Infrastructure Solutions segment asset sale (d) . . . . . . . . . . . . — — 269
Gain on prior Rail Technologies and Services segment warrantyclaim (e) . . . . . . . . . . . . . . . . . . . . . . . . . . . . . . . . . . . . . . . . . . . . . . . — — (525)
Foreign currency (gains) losses . . . . . . . . . . . . . . . . . . . . . . . . . . . . . . . (32) 202 (483)
Other . . . . . . . . . . . . . . . . . . . . . . . . . . . . . . . . . . . . . . . . . . . . . . . . . . . . (877) (1,261) (469)
Other (income) expense — net . . . . . . . . . . . . . . . . . . . . . . . . . . . . . . . $(2,110) $ 2,919 $(1,208)
a. In the second quarter of 2020, the Company received a non-recurring disbursement of $1,874 from anunconsolidated partnership.
b. During the fourth quarter of 2019, the Company announced and commenced the relocation and closure of theSpokane, WA concrete products facility and the subsequent relocation to Boise, ID, which was completedduring the first quarter of 2020. This activity resulted in expense of $673 and $1,768 in 2020 and 2019,respectively, within the Infrastructure Solutions segment.
c. In the fourth quarter of 2019, the Company recorded an expense of $2,210 resulting from settlements withinthe Company’s U.S. defined benefit pension plan.
d. On June 19, 2018, the Company sold 54.5 acres of land in Willis, TX for $2,047, resulting in a pretax loss of$269 within the Infrastructure Solutions segment.
e. In 2018, the Rail Technologies and Services segment received a reimbursement of $525 for a 2016 warrantyclaim on a transit project.
79
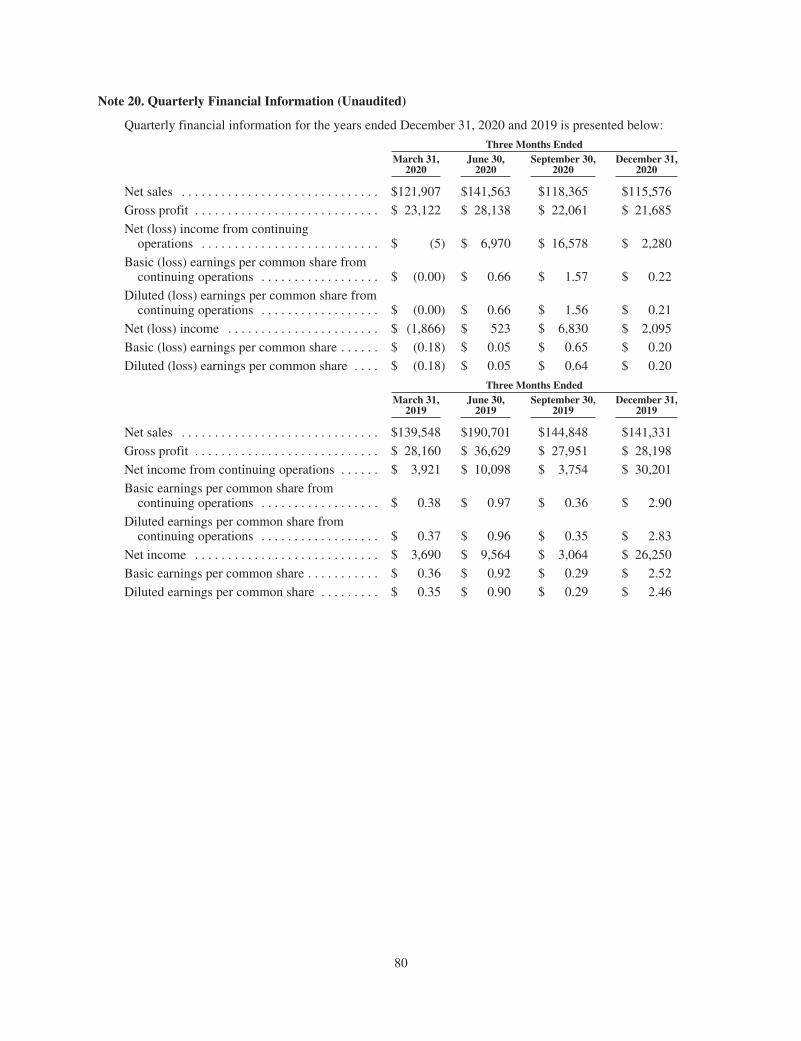
Note 20. Quarterly Financial Information (Unaudited)
Quarterly financial information for the years ended December 31, 2020 and 2019 is presented below:
Three Months EndedMarch 31,
2020June 30,
2020September 30,
2020December 31,
2020
Net sales . . . . . . . . . . . . . . . . . . . . . . . . . . . . . . $121,907 $141,563 $118,365 $115,576
Gross profit . . . . . . . . . . . . . . . . . . . . . . . . . . . . $ 23,122 $ 28,138 $ 22,061 $ 21,685
Net (loss) income from continuingoperations . . . . . . . . . . . . . . . . . . . . . . . . . . . $ (5) $ 6,970 $ 16,578 $ 2,280
Basic (loss) earnings per common share fromcontinuing operations . . . . . . . . . . . . . . . . . . $ (0.00) $ 0.66 $ 1.57 $ 0.22
Diluted (loss) earnings per common share fromcontinuing operations . . . . . . . . . . . . . . . . . . $ (0.00) $ 0.66 $ 1.56 $ 0.21
Net (loss) income . . . . . . . . . . . . . . . . . . . . . . . $ (1,866) $ 523 $ 6,830 $ 2,095
Basic (loss) earnings per common share . . . . . . $ (0.18) $ 0.05 $ 0.65 $ 0.20
Diluted (loss) earnings per common share . . . . $ (0.18) $ 0.05 $ 0.64 $ 0.20
Three Months EndedMarch 31,
2019June 30,
2019September 30,
2019December 31,
2019
Net sales . . . . . . . . . . . . . . . . . . . . . . . . . . . . . . $139,548 $190,701 $144,848 $141,331
Gross profit . . . . . . . . . . . . . . . . . . . . . . . . . . . . $ 28,160 $ 36,629 $ 27,951 $ 28,198
Net income from continuing operations . . . . . . $ 3,921 $ 10,098 $ 3,754 $ 30,201
Basic earnings per common share fromcontinuing operations . . . . . . . . . . . . . . . . . . $ 0.38 $ 0.97 $ 0.36 $ 2.90
Diluted earnings per common share fromcontinuing operations . . . . . . . . . . . . . . . . . . $ 0.37 $ 0.96 $ 0.35 $ 2.83
Net income . . . . . . . . . . . . . . . . . . . . . . . . . . . . $ 3,690 $ 9,564 $ 3,064 $ 26,250
Basic earnings per common share . . . . . . . . . . . $ 0.36 $ 0.92 $ 0.29 $ 2.52
Diluted earnings per common share . . . . . . . . . $ 0.35 $ 0.90 $ 0.29 $ 2.46
80

ITEM 9. CHANGES IN AND DISAGREEMENTS WITH ACCOUNTANTS ON ACCOUNTING ANDFINANCIAL DISCLOSURE
None.
ITEM 9A. CONTROLS AND PROCEDURES
Evaluation of Disclosure Controls and Procedures
L.B. Foster Company carried out an evaluation, under the supervision and with the participation of theCompany’s management, including the Chief Executive Officer and the Chief Financial Officer, of theeffectiveness of the design and operation of the Company’s disclosure controls and procedures (as defined inRule 13a–15(e) under the Securities Exchange Act of 1934, as amended (“the Exchange Act”)) as of the end ofthe period covered by this report. Based on that evaluation, the Chief Executive Officer and Principal AccountingOfficer concluded that the Company’s disclosure controls and procedures were effective at the end of the periodcovered by this report.
Managements’ Report on Internal Control Over Financial Reporting
The management of L.B. Foster Company is responsible for establishing and maintaining adequate internalcontrol over financial reporting, as such term is defined in Exchange Act Rule 13a-15(f). L.B. Foster Company’sinternal control system is designed to provide reasonable assurance to the Company’s management and Board ofDirectors regarding the reliability of financial reporting and the preparation of financial statements for externalpurposes in accordance with accounting principles generally accepted in the United States. All internal controlsystems, no matter how well designed, have inherent limitations. Accordingly, even effective controls canprovide only reasonable assurance with respect to financial statement preparation and presentation. There wereno significant changes in internal control over financial reporting (as defined in Rule 13a-15(f) under theExchange Act) that occurred during the fourth quarter of 2020 that have materially affected, or are reasonablylikely to materially affect, the Company’s internal control over financial reporting.
L.B. Foster Company’s management assessed the effectiveness of the Company’s internal control overfinancial reporting as of December 31, 2020. In making this assessment, management used criteria set forth bythe Committee of Sponsoring Organizations of the Treadway Commission (“COSO”) in Internal Control —Integrated Framework (2013 Framework). Based on this assessment, management concluded that the Companymaintained effective internal control over financial reporting as of December 31, 2020.
Ernst & Young LLP, the independent registered public accounting firm that also audited the Company’sconsolidated financial statements, has issued an attestation report on the Company’s internal control overfinancial reporting. Ernst & Young’s attestation report on the Company’s internal control over financial reportingappears in Part II, Item 8 of this Annual Report on Form 10-K and is incorporated herein by reference.
81

Report of Independent Registered Public Accounting Firm
To the Stockholders and the Board of Directors of L.B. Foster Company and Subsidiaries
Opinion on Internal Control over Financial Reporting
We have audited L.B. Foster Company and Subsidiaries’ internal control over financial reporting as ofDecember 31, 2020, based on criteria established in Internal Control — Integrated Framework issued by theCommittee of Sponsoring Organizations of the Treadway Commission (2013 framework) (the COSO criteria). Inour opinion, L.B. Foster Company and Subsidiaries (the Company) maintained, in all material respects, effectiveinternal control over financial reporting as of December 31, 2020, based on the COSO criteria.
We also have audited, in accordance with the standards of the Public Company Accounting Oversight Board(United States) (PCAOB), the consolidated balance sheets of the Company as of December 31, 2020 and 2019, therelated consolidated statements of operations, comprehensive income (loss), stockholders’ equity and cash flows foreach of the three years in the period ended December 31, 2020, and the related notes and the financial statementschedule listed in the index at Item 15(a) and our report dated March 3, 2021 expressed an unqualified opinion thereon.
Basis for Opinion
The Company’s management is responsible for maintaining effective internal control over financialreporting and for its assessment of the effectiveness of internal control over financial reporting included in theaccompanying Managements’ Report on Internal Control Over Financial Reporting. Our responsibility is toexpress an opinion on the Company’s internal control over financial reporting based on our audit. We are apublic accounting firm registered with the PCAOB and are required to be independent with respect to theCompany in accordance with the U.S. federal securities laws and the applicable rules and regulations of theSecurities and Exchange Commission and the PCAOB.
We conducted our audit in accordance with the standards of the PCAOB. Those standards require that weplan and perform the audit to obtain reasonable assurance about whether effective internal control over financialreporting was maintained in all material respects.
Our audit included obtaining an understanding of internal control over financial reporting, assessing the riskthat a material weakness exists, testing and evaluating the design and operating effectiveness of internal controlbased on the assessed risk, and performing such other procedures as we considered necessary in thecircumstances. We believe that our audit provides a reasonable basis for our opinion.
Definition and Limitations of Internal Control over Financial Reporting
A company’s internal control over financial reporting is a process designed to provide reasonable assuranceregarding the reliability of financial reporting and the preparation of financial statements for external purposes inaccordance with generally accepted accounting principles. A company’s internal control over financial reportingincludes those policies and procedures that (1) pertain to the maintenance of records that, in reasonable detail,accurately and fairly reflect the transactions and dispositions of the assets of the company; (2) provide reasonableassurance that transactions are recorded as necessary to permit preparation of financial statements in accordancewith generally accepted accounting principles, and that receipts and expenditures of the company are being madeonly in accordance with authorizations of management and directors of the company; and (3) provide reasonableassurance regarding prevention or timely detection of unauthorized acquisition, use, or disposition of thecompany’s assets that could have a material effect on the financial statements.
Because of its inherent limitations, internal control over financial reporting may not prevent or detectmisstatements. Also, projections of any evaluation of effectiveness to future periods are subject to the risk thatcontrols may become inadequate because of changes in conditions, or that the degree of compliance with thepolicies or procedures may deteriorate.
/s/ Ernst & Young LLP
Pittsburgh, PennsylvaniaMarch 3, 2021
82

ITEM 9B. OTHER INFORMATION
None.
PART III
ITEM 10. DIRECTORS, EXECUTIVE OFFICERS, AND CORPORATE GOVERNANCE
The information required by this Item regarding the directors of the Company is incorporated herein byreference to the information included in the Company’s definitive Proxy Statement for the 2021 Annual Meetingof Stockholders (the “Proxy Statement”) under the caption “Election of Directors.”
The information required by this Item regarding the executive officers of the Company is set forth in Part I ofthis Annual Report on Form 10-K under the caption “Executive Officers of the Registrant” and is incorporatedherein by reference.
The information required by this Item regarding compliance with Section 16(a) of the Exchange Act isincorporated herein by reference to the information included in the Proxy Statement under the caption“Section 16(a) Beneficial Reporting Compliance,” if applicable.
The information required by this Item regarding our Code of Ethics is set forth in Part I of this AnnualReport on Form 10-K under the caption “Code of Ethics” and is incorporated herein by reference.
The information required by this Item regarding our audit committee and the audit committee financialexpert(s) is incorporated herein by reference to the information included in the Proxy Statement under the caption“Corporate Governance — Board Committees — Audit Committee.”
ITEM 11. EXECUTIVE COMPENSATION
The information required by this Item regarding executive compensation is incorporated herein by referenceto the information included in the Proxy Statement under the captions “Director Compensation — 2020,”“Executive Compensation,” “Summary Compensation Table (2020, 2019, and 2018),” “Grants of Plan-BasedAwards in 2020,” “Outstanding Equity Awards At 2020 Fiscal Year-End,” “2020 Options Exercises and StockVested Table,” “2020 Nonqualified Deferred Compensation,” “Change-In-Control,” “Compensation CommitteeInterlocks and Insider Participation,” and “Compensation Committee Report.”
ITEM 12. SECURITY OWNERSHIP OF CERTAIN BENEFICIAL OWNERS AND MANAGEMENT ANDRELATED STOCKHOLDER MATTERS
The information required by this Item regarding the Company’s equity compensation plans is set forth inPart II, Item 5 of this Annual Report on Form 10-K under the caption “Securities Authorized for Issuance UnderEquity Compensation Plans” and is incorporated herein by reference.
The information required by this Item regarding the beneficial ownership of the Company is incorporatedherein by reference to the information included in the Proxy Statement under the caption “Stock Ownership.”
ITEM 13. CERTAIN RELATIONSHIPS AND RELATED TRANSACTIONS, AND DIRECTORINDEPENDENCE
The information required by this Item regarding transactions with related persons is incorporated herein byreference to the information included in the Proxy Statement under the caption “Corporate Governance —Transactions with Related Parties.”
The information required by this Item regarding director independence is incorporated herein by referenceto information included in the Proxy Statement under the caption “Corporate Governance — The Board, BoardMeetings, Independence, and Tenure.”
ITEM 14. PRINCIPAL ACCOUNTANT FEES AND SERVICES
The information required by this Item regarding principal accountant fees and services is incorporatedherein by reference to information included in the Proxy Statement under the caption “Independent RegisteredPublic Accounting Firm Fees.”
83

PART IV
ITEM 15. EXHIBITS AND FINANCIAL STATEMENT SCHEDULES
The following documents are filed as a part of this Report:
(a)(1). Financial Statements
The following Reports of Independent Registered Public Accounting Firm, consolidated financialstatements, and accompanying notes are included in Item 8 of this Report:
Reports of Independent Registered Public Accounting Firm.
Consolidated Balance Sheets as of December 31, 2020 and 2019.
Consolidated Statements of Operations for the Years Ended December 31, 2020, 2019, and 2018.
Consolidated Statements of Comprehensive Income (Loss) for the Years Ended December 31, 2020, 2019,and 2018.
Consolidated Statements of Cash Flows for the Years Ended December 31, 2020, 2019, and 2018.
Consolidated Statements of Stockholders’ Equity for the Years Ended December 31, 2020, 2019, and 2018.
Notes to Consolidated Financial Statements.
(a)(2). Financial Statement Schedule
Schedules for the Years Ended December 31, 2020, 2019, and 2018:
II – Valuation and Qualifying Accounts.
The remaining schedules are omitted because of the absence of conditions upon which they are required.
(a)(3). Exhibits
The Index to Exhibits immediately following Part IV, Item 16, Form 10-K Summary, filed as part of thisAnnual Report on Form 10-K and is incorporated by reference herein.
84

L.B. FOSTER COMPANY AND SUBSIDIARIES
SCHEDULE II VALUATION AND QUALIFYING ACCOUNTSFOR THE YEARS ENDED DECEMBER 31, 2020, 2019, AND 2018
Balance atBeginning
of Year
AdditionsCharged toCosts andExpenses Deductions (1)
Adjustment toadopt ASU
2016-16
Balanceat Endof Year
2020
Deducted from assets to which they apply:
Allowance for doubtful accounts . . . . . . . $ 1,073 $ 286 $ 415 $ — $ 944
Valuation allowance for deferred taxassets . . . . . . . . . . . . . . . . . . . . . . . . . . . $ 752 $ 731 $ — $ — $ 1,483
2019
Deducted from assets to which they apply:
Allowance for doubtful accounts . . . . . . . $ 835 $ 1,023 $ 785 $ — $ 1,073
Valuation allowance for deferred taxassets . . . . . . . . . . . . . . . . . . . . . . . . . . . $30,718 $(29,966) $ — $ — $ 752
2018
Deducted from assets to which they apply:
Allowance for doubtful accounts . . . . . . . $ 1,829 $ 1,267 $2,261 0 $ 835
Valuation allowance for deferred taxassets . . . . . . . . . . . . . . . . . . . . . . . . . . . $19,318 $ 10,472 $ — $928 $30,718
1. Notes and accounts receivable written off as uncollectible or allowance reversed.
ITEM 16. FORM 10-K SUMMARY
We may voluntarily include a summary of information required by the Annual Report on Form 10-K underthis Item 16. We have elected not to include such summary information.
85

INDEX TO EXHIBITS
All exhibits are incorporated herein by reference:ExhibitNumber Description
3.1 Restated Certificate of Incorporation of the Company, incorporated by reference to Exhibit 3.1 tothe Company’s Quarterly Report on Form 10-Q for the quarter ended March 31, 2003, FileNo. 0-10436, filed on May 13, 2003.
3.2 Bylaws of the Company, incorporated by reference to Exhibit 3.1 to the Company’s QuarterlyReport on Form 10-Q for the quarter ended September 30, 2012, File No. 0-10436, filed onNovember 8, 2012.
4.1 Description of Capital Stock of L.B. Foster Company.10.1 Third Amended and Restated Credit Agreement dated April 30, 2019, between Registrant and
PNC Bank, N.A., Bank of America, N.A., Wells Fargo Bank, N.A., Citizens Bank, N.A., andBMO Harris Bank, N.A. is incorporated herein by reference to Exhibit 10.1 to the Current Reporton Form 8-K, File No. 0-10436, filed on May 2, 2019.
10.2 First Amendment dated June 26, 2020 to the Third Amended and Restated Credit Agreementdated April 30, 2019 between Registrant and PNC Bank, N.A., Bank of America, N.A., WellsFargo Bank, National Association, Citizens Bank, N.A., and BMO Harris Bank, NationalAssociation is incorporated herein by reference to Exhibit 10.2 to the Current Report on Form8-K, File No. 0-10436, filed on July 1, 2020.
10.3 Second Amendment dated January 29, 2021 to the Third Amended and Restated CreditAgreement dated April 30, 2019 between Registrant and PNC Bank, N.A., Bank of America,N.A., Wells Fargo Bank, National Association, Citizens Bank, N.A., and BMO Harris Bank,National Association is incorporated herein by reference to Exhibit 10.3 to the Current Report onForm 8-K, File No. 0-10436, filed on February 4, 2021.
10.4 ** 2006 Omnibus Incentive Plan, as amended and restated on May 25, 2016, incorporated byreference to Exhibit 99.1 to the Company’s Current Report on Form 8-K, File No. 0-10436, filedon May 27, 2016.
10.5 ** Amended Form of Restricted Stock Agreement (for grants made on or after December 23, 2011),incorporated by reference to Exhibit 10.2 to the Company’s Current Report on Form 8-K, FileNo. 0-10436, filed on December 21, 2011.
10.6 ** Restated Supplemental Executive Retirement Plan, incorporated by reference to Exhibit 10.1 tothe Company’s Quarterly Report on Form 10-Q for the quarter ended June 30, 2012, FileNo. 0-10436, filed on August 9, 2012.
10.7 ** Leased Vehicle Plan as amended and restated on September 1, 2007, incorporated by reference toExhibit 10.46 to the Company’s Annual Report on Form 10-K for the year ended December 31,2010, File No. 0-10436, filed on March 16, 2011.
10.8 ** 2018 Executive Annual Incentive Compensation Plan, incorporated by reference to Exhibit 10.3to the Company’s Quarterly Report of Form 10-Q for the quarter ended March 31, 2018, File no.0-10436, filed on May 2, 2018.
10.9 ** Form of Restricted Stock Award Agreement (2018), incorporated by reference to Exhibit 10.4 tothe Company’s Quarterly Report of Form 10-Q for the quarter ended March 31, 2018, File no.0-10436, filed on May 2, 2018.
10.10 ** Long Term Incentive Performance Share Unit Program (2018-2020), incorporated by reference toExhibit 10.5 to the Company’s Quarterly Report of Form 10-Q for the quarter ended March 31,2018, File no. 0-10436, filed on May 2, 2018.
10.11 ** Form of Performance Share Unit Award Agreement (2018-2020), incorporated by reference toExhibit 10.6 to the Company’s Quarterly Report of Form 10-Q for the quarter ended March 31,2018, File no. 0-10436, filed on May 2, 2018.
86

ExhibitNumber Description
10.12 ** Executive Annual Incentive Compensation Plan (as Amended and Restated), incorporated byreference to Exhibit 10.7 to the Company’s Quarterly Report of Form 10-Q for the quarter endedMarch 31, 2018, File no. 0-10436, filed on May 2, 2018.
10.13 ** Amended and Restated Key Employee Separation Plan, incorporated by reference to Exhibit 10.8to the Company’s Quarterly Report of Form 10-Q for the quarter ended March 31, 2018, Fileno. 0-10436, filed on May 2, 2018.
10.14 ** Amended and Restated 2006 Omnibus Incentive Plan, effective as of May 24, 2018, incorporatedby reference to Exhibit 10.1 to the Company’s Quarterly Report of Form 10-Q for the quarterended June 30, 2018, File no. 0-10436, filed on July 31, 2018.
10.15 ** 2019 Executive Annual Incentive Compensation Plan, incorporated by reference to Exhibit 10.2to the Company’s Quarterly Report of Form 10-Q for the quarter ended March 31, 2019, Fileno. 0-10436, filed on May 10, 2019.
10.16 ** Form of Restricted Stock Award Agreement (2019), incorporated by reference to Exhibit 10.3 tothe Company’s Quarterly Report of Form 10-Q for the quarter ended March 31, 2019, Fileno. 0-10436, filed on May 10, 2019.
10.17 ** Long Term Incentive Performance Share Unit Program (2019-2021), incorporated by reference toExhibit 10.4 to the Company’s Quarterly Report of Form 10-Q for the quarter ended March 31,2019, File no. 0-10436, filed on May 10, 2019.
10.18 ** Form of Performance Share Unit Award Agreement (2019-2021), incorporated by reference toExhibit 10.5 to the Company’s Quarterly Report of Form 10-Q for the quarter ended March 31,2019, File no. 0-10436, filed on May 10, 2019.
10.19 ** 2020 Executive Annual Incentive Compensation Plan, incorporated by reference to Exhibit 10.1to the Company’s Quarterly Report of Form 10-Q for the quarter ended March 31, 2020, Fileno. 0-10436, filed on May 6, 2020.
10.20 ** Form of Restricted Stock Award Agreement (2020), incorporated by reference to Exhibit 10.2 tothe Company’s Quarterly Report of Form 10-Q for the quarter ended March 31, 2020, Fileno. 0-10436, filed on May 6, 2020.
10.21 ** Long Term Incentive Performance Share Unit Program (2020-2022), incorporated by reference toExhibit 10.3 to the Company’s Quarterly Report of Form 10-Q for the quarter ended March 31,2020, File no. 0-10436, filed on May 6, 2020.
10.22 ** Form of Performance Share Unit Award Agreement (2020-2022), incorporated by reference toExhibit 10.4 to the Company’s Quarterly Report of Form 10-Q for the quarter ended March 31,2020, File no. 0-10436, filed on May 6, 2020.
10.23 Agreement dated February 12, 2016, among L. B. Foster Company, Legion Partners, L.P. I,Legion Partners, L.P. II, Legion Partners Special Opportunities, L.P. II, Legion PartnersHoldings, LLC, Legion Partners Asset Management, LLC, Legion Partners Holdings, LLC,Bradley S. Vizi, Christopher S. Kiper, and Raymond White, incorporated by reference toExhibit 10.1 to the Company’s Current Report on Form 8-K, File No. 0-10436, filed onFebruary 17, 2016.
10.24 Confidentiality Agreement dated February 12, 2016, among L.B. Foster Company, LegionPartners, L.P. I, Legion Partners, L.P. II, Legion Partners Special Opportunities, L.P. II, LegionPartners Holdings, LLC, Legion Partners Asset Management, LLC, Legion Partners Holdings,LLC, Bradley S. Vizi, Christopher S. Kiper, Raymond White, David A. Katz, and Justin Albertincorporated by reference to Exhibit 10.2 to the Company’s Current Report on Form 8-K, FileNo. 0-10436, filed on February 17, 2016.
*21 List of Subsidiaries.*23 Consent of Independent Registered Public Accounting Firm.*31.1 Certification of Chief Executive Officer under Section 302 of the Sarbanes-Oxley Act of 2002.
87

ExhibitNumber Description
*31.2 Certification of Chief Financial Officer under Section 302 of the Sarbanes-Oxley Act of 2002.*32.0 Certification of Chief Executive Officer and Chief Financial Officer under Section 906 of the
Sarbanes-Oxley Act of 2002.*101.INS XBRL Instance Document.*101.SCH XBRL Taxonomy Extension Schema Document.*101.CAL XBRL Taxonomy Extension Calculation Linkbase Document.*101.DEF XBRL Taxonomy Extension Definition Linkbase Document.*101.LAB XBRL Taxonomy Extension Label Linkbase Document.*101.PRE XBRL Taxonomy Extension Presentation Linkbase Document.*104 Cover Page Interactive Data File (formatted as inline XBRL and contained in Exhibit 101)* Exhibits are filed herewith.** Exhibit represents a management contract or compensatory plan, contract or arrangement
required to be filed as Exhibits to this Annual Report on Form 10-K.
88

SIGNATURES
Pursuant to the requirements of Section 13 or 15(d) of the Securities Exchange Act of 1934, the Registranthas duly caused this report to be signed on its behalf by the undersigned, thereunto duly authorized.
L.B. FOSTER COMPANY
(Registrant)
Date: March 3, 2021 By: /s/ Robert P. Bauer
(Robert P. Bauer,President and Chief Executive Officer)
Pursuant to the requirements of the Securities Exchange Act of 1934, this report has been signed below bythe following persons on behalf of the Registrant and in the capacities and on the dates indicated.
Name Position Date
By: /s/ Lee B. Foster II Chairman of the Board and Director March 3, 2021(Lee B. Foster II)
By: /s/ Robert P. Bauer President, Chief Executive Officer, March 3, 2021(Robert P. Bauer) and Director
By: /s/ Raymond T. Betler Director March 3, 2021(Raymond T. Betler)
By: /s/ Dirk Jungé Director March 3, 2021(Dirk Jungé)
By: /s/ Diane B. Owen Director March 3, 2021(Diane B. Owen)
By: /s/ Robert S. Purgason Director March 3, 2021(Robert S. Purgason)
By: /s/ William H. Rackoff Director March 3, 2021(William H. Rackoff)
By: /s/ Suzanne B. Rowland Director March 3, 2021(Suzanne B. Rowland)
By: /s/ Bradley S. Vizi Director March 3, 2021(Bradley S. Vizi)
By: /s/ William M. Thalman Senior Vice President March 3, 2021(William M. Thalman) and Chief Financial Officer
By: /s/ James M. Kempton Corporate Controller March 3, 2021(James M. Kempton) and Principal Accounting Officer
89

Exhibit 4.1
DESCRIPTION OF THE REGISTRANT’S SECURITIESREGISTERED PURSUANT TO SECTION 12 OF THE
SECURITIES EXCHANGE ACT OF 1934
The following is a brief description of the common stock, par value $0.01 per share (“Common Stock”), of theL.B. Foster Company (the “Company”), which is the only security of the Company registered under Section 12of the Securities Exchange Act of 1934, as amended. The summary of the terms of the Common Stock is notcomplete and is subject to, and qualified in its entirety by reference to, the relevant provisions of the laws of theCommonwealth of Pennsylvania, including the Pennsylvania Business Corporation Law (“PBCL”), the Compa-ny’s Articles of Incorporation (“Articles of Incorporation”) and its Bylaws (the “Bylaws”). Copies of the Articlesof Incorporation and Bylaws have been filed with the Securities and Exchange Commission and are incorporatedby reference as an exhibit to the Annual Report on Form 10-K of which this Exhibit 4.1 is a part. We encourageyou to read our Articles of Incorporation and Bylaws for additional information.
Overview of Capital Stock
Authorized Capital Stock
Our authorized capital shares consist of 20,000,000 shares of Common Stock and 5,000,000 shares of preferredstock (“Preferred Stock”). The Board of Directors of the Company (the “Board of Directors”) may issue Pre-ferred Stock from time to time. Subject to the limits imposed by the PBCL, our Board of Directors is authorizedto divide the authorized and unissued shares of Preferred Stock into classes or series, or both, and to determinefor any such class or series its designation and the number of shares of the class or series and the voting rights,preferences, limitations and special rights, if any, of the class or series. As of December 31, 2020, no shares ofPreferred Stock were registered or outstanding.
Description of Common Stock
Voting Rights
Holders of Common Stock are entitled to one vote per share on all matters voted on by shareholders, includingthe election of directors. Our Common Stock does not have cumulative voting rights and our Board of Directorsis not classified. Except as otherwise provided in the PBCL, Articles of Incorporation or Bylaws, actions byshareholders shall be effective upon the affirmative vote of a majority of the votes cast by all shareholders enti-tled to vote thereon and, if any shareholders are entitled to vote thereon as a class, upon receiving the affirmativevote of a majority of the votes cast by the shareholders entitled to vote as a class. The Bylaws provide that, in thecase of director elections, candidates receiving the highest number of votes from each class or group of classesshall be elected (i.e., plurality vote standard).
Notwithstanding the foregoing, the affirmative vote of no less than two-thirds of the votes that all shareholdersare entitled to cast is required to amend certain provisions of the Bylaws regarding (i) advance notice of nomi-nations and proposals (Section 2.05) and (ii) amendment of Bylaws (Section 7.02).
Dividend Rights
Subject to the rights of any Preferred Stock then outstanding, holders of Common Stock are entitled to receivedividends for each outstanding share, if any, as may be declared from time to time by the Board of Directors inits discretion out of funds legally available for the payment of dividends.
Liquidation Rights
In the event of the Company’s liquidation, dissolution, or winding up, either voluntarily or involuntarily, holdersof Common Stock are entitled to receive, subject to any liquidation preference of any Preferred Stock then out-standing, the remaining assets of the Company available for distribution, if any, in proportion to the number ofshares held.

Other Rights and Preferences
The holders of Common Stock do not have any preemptive, redemption, sinking fund, or conversion rights andthe Common Stock is not subject to any restriction on alienability, except as required by law.
Certain Anti-Takeover Provisions
Governance Document Provisions
The Articles of Incorporation and Bylaws include certain provisions which may be considered to be “anti-takeover” in nature because they may have the effect of discouraging or making more difficult the acquisition ofcontrol by means of a hostile tender offer, exchange offer, proxy contest or similar transaction. The Companybelieves these provisions protect shareholders by providing a measure of assurance that shareholders will betreated fairly in the event of an unsolicited takeover bid and by preventing a successful takeover bidder fromexercising its voting control to the detriment of the other shareholders.
The provisions in the Articles of Incorporation and Bylaws (or lack thereof) which may be considered to be“anti-takeover” in nature include the following:
‰ Availability of authorized but unissued capital stock, including the ability to issue a class or series, orboth, of Preferred Stock whose rights and privileges may be determined by the Board of Directors;
‰ A provision that does not permit shareholders to cumulate their votes for the election of directors;
‰ A provision that limits the permissible number of directors;
‰ A provision that requires, in certain circumstances, a greater than majority shareholder vote in order toamend the Bylaws and advance notice provisions set forth therein;
‰ A provision requiring that advance notice be delivered to the Company of any business to be brought byan eligible shareholder before a meeting of shareholders and requiring certain procedures to be followedby shareholders in nominating candidates for election as directors;
‰ No provision for shareholders to call special meetings of shareholders; and
‰ No provision for shareholders to act by partial written consent.
Pennsylvania Business Corporation Law Provisions
The PBCL contains a number of statutory “anti-takeover” provisions, including Subchapters E, F, G and H ofChapter 25 and Sections 2521, 2524 and 2538 of the PBCL, which apply automatically to Pennsylvania regis-tered corporations unless the corporation elects to opt-out of those provisions. The Company is a Pennsylvaniaregistered corporation, and has elected to opt-out of certain provisions as described below. Descriptions of theanti-takeover provisions that the Company opted out of are qualified in their entirety by reference to the PBCL:
‰ Section 1715 (relating to exercise of powers generally) provides that the board of directors, when consider-ing the best interests of the corporation generally, may consider the effects of an action upon any or allgroups affected by the action, the short- and long-term interests of the corporation, and the resources,intent, and conduct of any person seeking to acquire control of the corporation. In considering the bestinterests of the corporation and the effect of an action, the board of directors shall not be required toregard the corporate interest or interest of any particular group as the dominant or controlling interest, andthe act of the board of directors, absent any breach of fiduciary duty, shall be presumed to be in the bestinterest of the corporation.
‰ Section 2538 of the PBCL generally establishes certain shareholder approval requirements with respect tospecified transactions with “interested shareholders.”
‰ Subchapter E (relating to control transactions) generally provides that if any person or group acquires 20%or more of the Company’s voting power, the remaining holders of voting shares may demand from suchperson or group the fair value of their voting shares, including a proportionate amount of any controlpremium.

‰ Subchapter F (relating to business combinations) imposes conditions upon “business combinations,”including a five-year moratorium on certain “business combinations” unless certain conditions are met,between an “interested shareholder” and the Company. The term “business combination” is definedbroadly to include various transactions between a corporation and an interested shareholder includingmergers, sales or leases of specified amounts of assets, liquidations, reclassifications and issuances ofspecified amounts of additional shares of stock of the corporation. An “interested shareholder” is definedgenerally as the beneficial owner of at least 20% of a corporation’s voting shares.
‰ Subchapter G (relating to control share acquisitions) generally requires a shareholder vote to reinstatevoting rights to control shares acquired by a 20% shareholder in a control-share acquisition.
‰ Subchapter H (relating to disgorgement of profits) generally requires a person or group that owns 20% ormore of a company’s equity securities, or that publicly announces an intention to acquire control of acompany, to disgorge within 24 months prior to, or within 18 months after, acquiring control status anyprofits received from a sale of the company’s shares.

Exhibit 21
SUBSIDIARIES OF L.B. FOSTER COMPANY(as of December 31, 2020)
Name of Corporation Jurisdiction of Incorporation
Chemtec Energy Services, L.L.C. Texas
CXT Incorporated Delaware
IOS Holdings, LLC Delaware
L.B. Foster GmbH Germany
L.B. Foster India Holdings Company Delaware
L.B. Foster International Holdings Company Delaware
L.B. Foster Latin America Holdings Company Delaware
L.B. Foster Produtos Ferroviários do Brasil Ltda. Brazil
L.B. Foster Rail Technologies Canada Ltd. Quebec, Canada
L.B. Foster Rail Technologies, Corp. British Columbia, Canada
L.B. Foster Rail Technologies, Inc. West Virginia
L.B. Foster Rail Technologies (UK) Limited United Kingdom
L.B. Foster Technologies (Beijing), Ltd. China
Netpractise Limited United Kingdom
Portec Rail Nova Scotia Company Nova Scotia, Canada
Salient Systems, Inc. Ohio
TEW Holdings (2012) Limited United Kingdom
TEW Holdings 2008 Limited United Kingdom
TEW Engineering Limited United Kingdom
TEW Plus Limited United Kingdom

Exhibit 23Consent of Independent Registered Public Accounting Firm
We consent to the incorporation by reference in the following Registration Statements on Form S-8 (FileNo. 333-226502, File No. 333-226501, File No. 333-222213, File No. 333-211749, File No. 333-208812, FileNo. 333-180118, File No. 333-159470, File No. 333-135002, File No. 333-60488, File No. 333-81535, FileNo. 333-65885, and File No. 033-79450) of L.B. Foster Company and Subsidiaries; of our reports dated March 3,2021, with respect to the consolidated financial statements and schedule of L.B. Foster Company and Sub-sidiaries and the effectiveness of internal control over financial reporting of L.B. Foster Company and Sub-sidiaries included in this Annual Report (Form 10-K) of L.B. Foster Company and Subsidiaries for the yearended December 31, 2020.
/s/ Ernst & Young LLP
Pittsburgh, PennsylvaniaMarch 3, 2021
Exhibit 31.1
Certification under Section 302 of theSarbanes-Oxley Act of 2002
I, Robert P. Bauer, certify that:
1 I have reviewed this Annual Report on Form 10-K of L. B. Foster Company;
2 Based on my knowledge, this report does not contain any untrue statement of a material fact or omit to statea material fact necessary to make the statements made, in light of the circumstances under which such state-ments were made, not misleading with respect to the period covered by this report;
3 Based on my knowledge, the financial statements, and other financial information included in this report,fairly present in all material respects the financial condition, results of operations and cash flows of the regis-trant as of, and for, the periods presented in this report;
4 The registrant’s other certifying officer(s) and I are responsible for establishing and maintaining disclosurecontrols and procedures (as defined in Exchange Act Rules 13a-15(e) and 15d–15(e)) and internal controlover financial reporting (as defined in Exchange Act Rules 13a-15(f) and 15d-15(f)) for the registrant andhave:
(a) Designed such disclosure controls and procedures, or caused such disclosure controls and procedures tobe designed under our supervision, to ensure that material information relating to the registrant, including itsconsolidated subsidiaries, is made known to us by others within those entities, particularly during the periodin which this report is being prepared;
(b) Designed such internal control over financial reporting, or caused such internal control over financialreporting to be designed under our supervision, to provide reasonable assurance regarding the reliability offinancial reporting and the preparation of financial statements for external purposes in accordance withgenerally accepted accounting principles;
(c) Evaluated the effectiveness of the registrant’s disclosure controls and procedures and presented in thisreport our conclusions about the effectiveness of the disclosure controls and procedures, as of the end of theperiod covered by this report based on such evaluation; and
(d) Disclosed in this report any change in the registrant’s internal control over financial reporting thatoccurred during the registrant’s most recent fiscal quarter (the registrant’s fourth fiscal quarter in the case ofan annual report) that has materially affected, or is reasonably likely to materially affect, the registrant’sinternal control over financial reporting; and
5 The registrant’s other certifying officer(s) and I have disclosed, based on our most recent evaluation ofinternal control over financial reporting, to the registrant’s auditors and the audit committee of the regis-trant’s board of directors (or persons performing the equivalent functions):
(a) All significant deficiencies and material weaknesses in the design or operation of internal control overfinancial reporting which are reasonably likely to adversely affect the registrant’s ability to record, process,summarize and report financial information; and
(b) Any fraud, whether or not material, that involves management or other employees who have asignificant role in the registrant’s internal control over financial reporting.
Date: March 3, 2021 /s/ Robert P. Bauer
Name: Robert P. BauerTitle: President and Chief Executive Officer

Exhibit 31.2
Certification under Section 302 of theSarbanes-Oxley Act of 2002
I, William M. Thalman, certify that:
1 I have reviewed this Annual Report on Form 10-K of L. B. Foster Company;
2 Based on my knowledge, this report does not contain any untrue statement of a material fact or omit to statea material fact necessary to make the statements made, in light of the circumstances under which such state-ments were made, not misleading with respect to the period covered by this report;
3 Based on my knowledge, the financial statements, and other financial information included in this report,fairly present in all material respects the financial condition, results of operations and cash flows of the regis-trant as of, and for, the periods presented in this report;
4 The registrant’s other certifying officer(s) and I are responsible for establishing and maintaining disclosurecontrols and procedures (as defined in Exchange Act Rules 13a-15(e) and 15d–15(e)) and internal controlover financial reporting (as defined in Exchange Act Rules 13a-15(f) and 15d-15(f)) for the registrant andhave:
(a) Designed such disclosure controls and procedures, or caused such disclosure controls and procedures tobe designed under our supervision, to ensure that material information relating to the registrant, including itsconsolidated subsidiaries, is made known to us by others within those entities, particularly during the periodin which this report is being prepared;
(b) Designed such internal control over financial reporting, or caused such internal control over financialreporting to be designed under our supervision, to provide reasonable assurance regarding the reliability offinancial reporting and the preparation of financial statements for external purposes in accordance withgenerally accepted accounting principles;
(c) Evaluated the effectiveness of the registrant’s disclosure controls and procedures and presented in thisreport our conclusions about the effectiveness of the disclosure controls and procedures, as of the end of theperiod covered by this report based on such evaluation; and
(d) Disclosed in this report any change in the registrant’s internal control over financial reporting thatoccurred during the registrant’s most recent fiscal quarter (the registrant’s fourth fiscal quarter in the case ofan annual report) that has materially affected, or is reasonably likely to materially affect, the registrant’sinternal control over financial reporting; and
5 The registrant’s other certifying officer(s) and I have disclosed, based on our most recent evaluation ofinternal control over financial reporting, to the registrant’s auditors and the audit committee of the regis-trant’s board of directors (or persons performing the equivalent functions):
(a) All significant deficiencies and material weaknesses in the design or operation of internal control overfinancial reporting which are reasonably likely to adversely affect the registrant’s ability to record, process,summarize and report financial information; and
(b) Any fraud, whether or not material, that involves management or other employees who have asignificant role in the registrant’s internal control over financial reporting.
Date: March 3, 2021 /s/ William M. ThalmanName: William M. ThalmanTitle: Senior Vice President and Chief FinancialOfficer

Exhibit 32.0
CERTIFICATE PURSUANT TO 18 U.S.C. SECTION 1350, AS ADOPTED PURSUANT TO SECTION906 OF THE SARBANES-OXLEY ACT OF 2002
In connection with the Annual Report of L. B. Foster Company (the “Company”) on Form 10-K for the periodended December 31, 2020, as filed with the Securities and Exchange Commission on the date hereof (the“Report”), the undersigned certify pursuant to Section 906 of the Sarbanes-Oxley Act of 2002 that:
1. The Report fully complies with the requirements of Section 13(a) or 15(d) of the SecuritiesExchange Act of 1934; and
2. The information contained in this Report fairly presents, in all material respects, the financial con-dition and results of operations of the Company.
Date: March 3, 2021 /s/ Robert P. Bauer
Name: Robert P. BauerTitle: President and Chief Executive Officer
Date: March 3, 2021 /s/ William M. Thalman
Name: William M. ThalmanTitle: Senior Vice President and Chief FinancialOfficer

[THIS PAGE INTENTIONALLY LEFT BLANK]

[THIS PAGE INTENTIONALLY LEFT BLANK]

[THIS PAGE INTENTIONALLY LEFT BLANK]

EXECUTIVE OFFICERS
ROBERT P. BAUERPresident and Chief Executive Offi cer
PATRICK J. GUINEESenior Vice President, General Counsel, and Secretary
JOHN F. KASELSenior Vice President and Chief Operating Offi cer
BRIAN H. KELLYSenior Vice President, Human Resources and Administration
JAMES M. KEMPTON Controller and Principal Accounting Offi cer
GREGORY W. LIPPARDSenior Vice President, Rail Technologies & Services
WILLIAM F. TREACYSenior Vice President, Infrastructure Solutions
WILLIAM M. THALMAN*Senior Vice President and Chief Financial Offi cer
*Started March 1, 2021
BOARD OF DIRECTORS
LEE B. FOSTER IIChairman of the BoardL.B. Foster Company
ROBERT P. BAUERPresident and Chief Executive Offi cerL.B. Foster Company
RAYMOND T. BETLERFormer President and CEO Wabtec Corporation
DIRK JUNGÉFormer ChairmanPitcairn Company
DIANE B. OWENFormer Senior Vice President – Corporate AuditH.J. Heinz Company
ROBERT S. PURGASONDirector Altus Midstream
WILLIAM H. RACKOFFFormer PresidentANDRITZ ASKO, Inc.
SUZANNE B. ROWLANDFormer Group Vice President,Industrial Specialties,Ashland Global Holdings, Inc.
BRADLEY S. VIZIExecutive ChairmanRCM Technologies, Inc.
SHAREHOLDER INFORMATION
Form 10-KA copy of the Company’s Annual Report on Form 10-K to the Securities and Exchange Commission is available upon request from L.B. Foster’s Investor Relations Department or from the Company website at www.lbfoster.com.
Stock ExchangeL.B. Foster’s common stock is traded on NASDAQ. Ticker symbol: FSTR
Transfer Agent Broadridge Corporate Issuer Solutions, Inc.1.866.321.8022
CORPORATE HEADQUARTERS
415 Holiday DriveSuite 100Pittsburgh, Pennsylvania USA 15220
1.412.928.34171.800.255.4500
www.lbfoster.com
7490_NARc1_Sngs.indd 11 4/7/21 3:58 PM

Executive Offi ces415 Holiday Drive, Suite 100
Pittsburgh, PA USA 15220
412.928.3400www.lbfoster.com
TRANSPORTATION AND INFRASTRUCTURE SOLUTIONS
7490_NARc1_Sngs.indd 12 4/7/21 3:58 PM