kbc group 3q 2016 key takeaways for kbc group strong business performance in 3q16 good net result of...
TRANSCRIPT

1
KBC Group 3Q and 9M 2016 results
Press presentationJohan Thijs, CEO KBC GroupLuc Popelier, CFO KBC Group
More detailed analyst presentation available at www.kbc.com
2
This presentation is provided for information purposes only. It does not constitute an offer to sell or the solicitation to buy anysecurity issued by the KBC Group.
KBC believes that this presentation is reliable, although some information is condensed and therefore incomplete. KBC cannot beheld liable for any loss or damage resulting from the use of the information.
This presentation contains non-IFRS information and forward-looking statements with respect to the strategy, earnings and capitaltrends of KBC, involving numerous assumptions and uncertainties. There is a risk that these statements may not be fulfilled andthat future developments differ materially. Moreover, KBC does not undertake any obligation to update the presentation in linewith new developments.
By reading this presentation, each investor is deemed to represent that it possesses sufficient expertise to understand the risksinvolved.
Important information for investors

3
3Q 2016 key takeaways for KBC Group
STRONG BUSINESS PERFORMANCE IN 3Q16Good net result of 629m EUR in 3Q16 (and 1.74bn EUR in 9M16)o Good commercial bank-insurance franchises in our core markets and core activitieso Slight q-o-q increase in customer loan volumes in most of our core countrieso Slightly lower net interest income and net interest margin q-o-qo Higher net fee and commission income q-o-q, despite net asset management outflowso Lower net gains from financial instruments at fair value, lower realised AFS gains and higher net other income o Combined ratio of 94% YTD. Excellent sales of non-life products, but decline in sales of life insurance productso Good cost management resulted in a cost/income ratio of 57% YTD adjusted for specific items o Excellent, but unsustainably low level of impairment charges. Net loan provision release of 28m EUR in 3Q16 in Ireland.
The impairment guidance for Ireland is updated towards a release of a 10m-50m EUR range for FY16
SOLID CAPITAL AND ROBUST LIQUIDITY POSITIONSo Common equity ratio (B3 phased-in) of 15.1% based on the Danish Compromise at end 9M16, which clearly exceeds
the minimum capital requirements set by the ECB (9.75%) and the NBB (0.5%), i.e. an aggregate 10.25% for 2016. The B3fully loaded common equity ratio stood at 15.3% based on the Danish Compromise at end 9M16
o Fully loaded B3 leverage ratio, based on current CRR legislation, amounted to 6.2% at KBC Groupo Continued strong liquidity position (NSFR at 123% and LCR at 137%) at end 9M16o An interim dividend of 1 EUR per share (an advance payment on the total 2016 dividend) will be paid on 18 November
2016

4
KBC GroupConsolidated results3Q 2016 performance
5
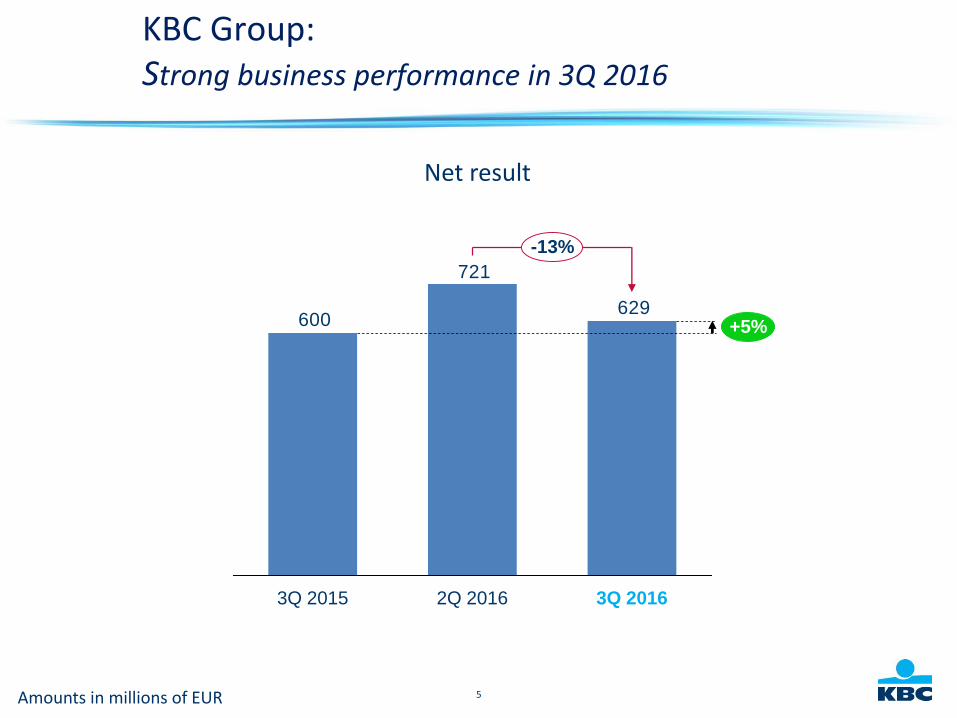
KBC Group: Strong business performance in 3Q 2016
Net result
629
721
600 +5%
-13%
3Q 20162Q 20163Q 2015
Amounts in millions of EUR

6
Ireland clearly achievedprofitablity
1 216
9M 2015 9M 2016
993
9M 2015
423
9M 2016
465
9M 2015
184
9M 2016
289
Amounts in millions of EUR
BE BU CZ BU IM BU*
Net result per business unit:All business units contributed to the positive result
* International Markets (IM) BU includes Hungary, Slovakia, Bulgaria and Ireland
9M16 net result breakdown forInternational Markets:• 106m EUR for Hungary• 76m EUR for Slovakia• 89m EUR for Ireland• 16m EUR for Bulgaria
37
30
89
23
1Q16 2Q16 9M163Q16

7
Q-o-q decrease of NIM is dueto lower reinvestment yields,pressure on commercial loanmargins in most core countriesand hedging losses onpreviously refinancedmortgages partly offset bylower funding costs
Net interest income: Slightly lower Net Interest Income (NII) and Net Interest Margin (NIM)
NII down 1% q-o-q (and slightly up y-o-y):(+) lower funding costs, continued volume growth in currentaccounts and loans, further positive effect of enhanced ALMmanagement and 7m EUR increase of NII in the dealing room(-) lower reinvestment yields, hedging losses on previouslyrefinanced mortgages, pressure on commercial loan marginsin most core countries and slightly lower upfront prepaymentfees
Amounts in millions of EUR
1 064+
-1%
3Q 20162Q 2016
1 070
3Q 2015
1 062
3Q15 2Q16 3Q16
1.99% 1.94% 1.90%
Net Interest Margin
8
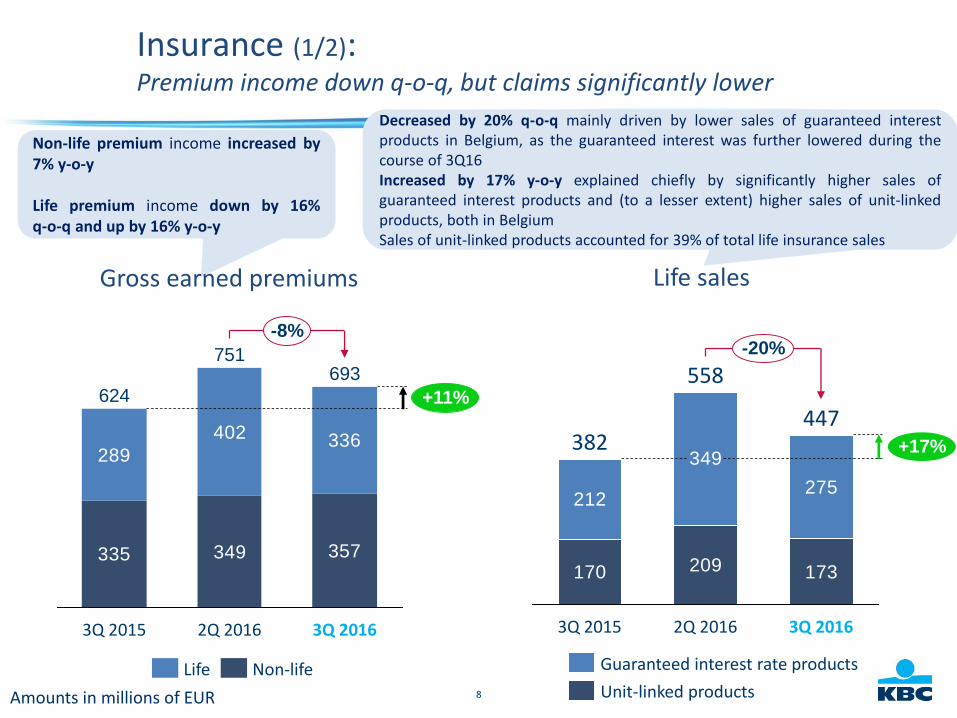
Decreased by 20% q-o-q mainly driven by lower sales of guaranteed interestproducts in Belgium, as the guaranteed interest was further lowered during thecourse of 3Q16Increased by 17% y-o-y explained chiefly by significantly higher sales ofguaranteed interest products and (to a lesser extent) higher sales of unit-linkedproducts, both in BelgiumSales of unit-linked products accounted for 39% of total life insurance sales
Non-life premium income increased by7% y-o-y
Life premium income down by 16%q-o-q and up by 16% y-o-y
Insurance (1/2): Premium income down q-o-q, but claims significantly lower
Gross earned premiums
335 349 357
289
402 336
693
+11%
-8%
3Q 20162Q 2016
751
3Q 2015
624
Amounts in millions of EUR
Non-lifeLife
170 209 173
212
349
275
447+17%
-20%
3Q 20162Q 2016
558
3Q 2015
382
Guaranteed interest rate products
Unit-linked products
Life sales
9
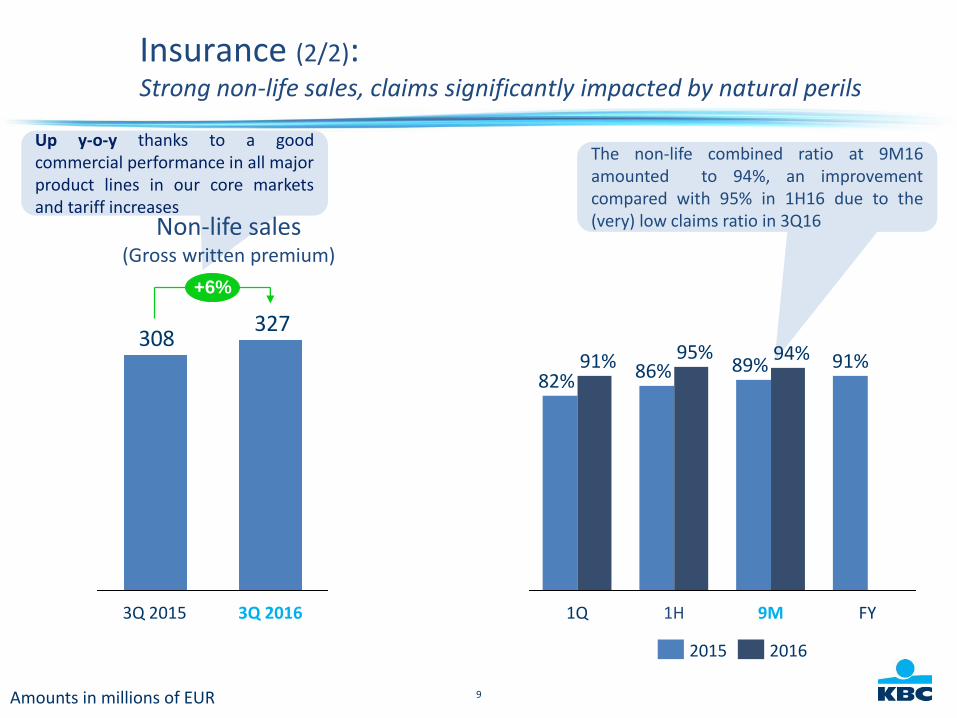
Insurance (2/2):Strong non-life sales, claims significantly impacted by natural perils
Amounts in millions of EUR
327308
+6%
3Q 20163Q 2015
Up y-o-y thanks to a goodcommercial performance in all majorproduct lines in our core marketsand tariff increases
Non-life sales (Gross written premium)
The non-life combined ratio at 9M16amounted to 94%, an improvementcompared with 95% in 1H16 due to the(very) low claims ratio in 3Q16
91%
9M
89%
1H
95%86%
FY1Q
91%82%
94%
20162015

10
Net fee and commission income:Higher fee and commission income
Net fee and commission income Assets under management (AUM)
• Q-o-q increase was the result chiefly of:- higher management fees from mutual funds & unit-linked life insurance products
(thanks to reset date CPPI)- higher fees from payment services in Belgium, Slovakia and Hungary- slightly higher entry fees from mutual fundspartly offset by:- lower fees from credit files and bank guarantees (due mainly to less mortgage
refinancings in BE)- lower securities-related fees in Belgium- higher commissions paid on insurance sales
Up q-o-q as a result of net outflows (-1%)and a positive price effect (+2%)Increased y-o-y owing to net inflows(+1%) and a positive price effect (+3%)
Amounts in millions of EUR (left chart) Amounts in billions of EUR (right chart)
368360383
-4%
+2%
3Q 20162Q 20163Q 2015
209207200+4%
+1%
3Q 20162Q 20163Q 2015

11
Net gains on financial instruments at fair value:Lower fair value gains q-o-q
Q-o-q decrease attributable to:- a negative change in market, credit and fair value adjustments (mainly as a result
of model changes, despite tightening spreads)- a negative change in ALM derivatives (-4m EUR in 3Q16 compared with 13m EUR in
2Q16) due to a further decrease q-o-q in IRS ratespartly offset by:- slightly better dealing room income
69
154
47 +47%
-55%
3Q 20162Q 20163Q 2015
Amounts in millions of EUR

12
Q-o-q, lower gains realised on AFS assets (shares only),due mainly to realised gains on Visa Europe Limited in2Q16 (99m EUR pre-tax and 84m EUR post-tax)
The other net income drivers:Lower gains realised on AFS assets and higher other net income
Gains realised on AFS assets
26
128
44
3Q 20162Q 20163Q 2015
Amounts in millions of EUR
5947
96
3Q 20162Q 20163Q 2015
Other net income

13
Operating expenses excluding bank tax:- increased by 2% q-o-q as higher professional fees, timing differences
and higher staff expenses were only partly offset by lower ICT expenses- increased by 4% y-o-y due mainly to higher ICT expenses, higher
professional fees and general administrative expenses (partly timingdifferences), despite lower staff expenses
Operating expenses:Expenses down q-o-q, due entirely to lower bank taxes
841 853 871
8954%
-1%
3Q 2016
24
2Q 2016
904
3Q 2015
86221 51
Operating expenses
Special bank taxes
* adjusted for specific items: MtM ALM derivatives, equally spread special bank taxes, etc.
Amounts in millions of EUR
3Q15 2Q16 3Q16
58% 56% 57%
Quarterly C/I ratio*

14
Total bank taxes (including ESRF contribution) are expected toincrease from 417m EUR in FY15 to 441m EUR in FY16
2016
273
2015
222
209
13
2016
27
2015
35
27
7
2016
107
2015
154
126
28
417
49
20162015
410368
Amounts in millions of EUR
Special bank taxes1:Represent 11.1% of operational expenses of 9M 2016 (pro rata)
1 This refers solely to the bank taxes recognised in opex, and as such it does not take account of income tax expenses, non-recoverable VAT, etc.
2 International Markets (IM) BU includes Hungary, Slovakia, Bulgaria and Ireland3 KBC Group also includes Group Centre
BE BU CZ BU IM2 BUKBC Group3
10.9% of opex9M16 (pro rata)
4.4% of opex9M16 (pro rata)
18.6% of opex9M16 (pro rata)
In 2Q16, the Belgian government replaced the 4 existing taxesby 1, which led to 38m EUR additional bank taxes in Belgium,partly offset by the ability to book 6m EUR of the ESRFcontribution as a non-P&L item
9M 4Q

15
The q-o-q decrease in loan loss provisions was attributable mainly to:- net loan loss provision releases of 28m EUR in Ireland and 11m EUR
in Hungary- a 25m EUR increase due to IBNR parameter changes in 2Q16
Loan impairments guidance for Ireland updated towards a release of a10m-50m EUR range for FY16
Asset impairments:Unsustainably low asset impairments and excellent credit cost ratio (historic average ’99-’15 of 0.52%)
Impairments on loans and receivables
Amounts in millions of EUR
18
50
34
-64%
-47%
2Q 20163Q 2015 3Q 2016
3Q15 2Q16 3Q16
0.23% 0.07% 0.07%
Credit cost ratio (YTD)
16
KBC GroupBalance sheet, capital and liquidity

17
Balance sheet (1/2):Loans and deposits continue to grow in most core countries
Deposits***
3%
4% 4%
MortgagesLoans**
* Volume growth making abstraction of Fx effects and divestments/acquisitions** Loans to customers, excluding reverse repos (and bonds)*** Customer deposits, including debt certificates but excluding repos. Please be aware of the significant impact of calling most of the hybrid tier-1 instruments and maturing wholesale debt
Y-O-Y ORGANIC* VOLUME GROWTH FOR KBC GROUP

18
Balance sheet (2/2):Loans and deposits continue to grow in most core countries
Loans**
3%
Deposits***
4%
Mortgages
3%
Loans**
9%
Deposits***
8%
Mortgages
12%
Loans**
-5%
Deposits***
2%
Mortgages
-3%
Loans**
13%
Deposits***
14%
Mortgages
26%
Loans** Mortgages Deposits***
10%
3%
4%
10%
-3%
Loans**
13%
Mortgages Deposits**** Volume growth making abstraction of Fx effects and divestments/acquisitions** Loans to customers including reverse repos (and not including bonds) *** Customer deposits, including debt certificates and including repos
BECZ
Y-O-Y ORGANIC* VOLUME GROWTH FOR MAIN ENTITIES

19
Capital and liquidity ratios (1/2):Capital ratio resides comfortably above regulatory minimum
KBC Group Basel 3 CET1 ratio (Danish Compromise)
10.25% regulatoryminimum*
9M161H16
14.9%
1Q16
14.6%
FY15
15.2%
9M15
17.2%
13.7%
2.4%
1.2%
1H15
16.9%
13.3%
2.4%
1.2%
1Q15
14.7%
11.4%
2.2%
1.1%
15.1%
11.25% pro forma regulatory minimum*
9M161H16
14.9%
1Q16
14.6%
FY15
14.9%
9M15
17.4%
14.0%
2.3%
1.2%
1H15
16.7%
13.2%
2.3%
1.2%
1Q15
14.9%
11.7%
2.2%
1.1%
15.3%
Phased-in
Fully loaded
* Minimum capital requirements set by the ECB (9.75%) and the NBB (0.5%), i.e. an aggregate 10.25% for 2016. As announced by the NBB, the systemic buffer (CET1 phased-in of 0.5% in2016 under the Danish Compromise) will gradually increase over a 3-year period, reaching 1.5% in 2018
State aid
Penalty on State aid

20
Capital and liquidity ratios (2/2):Liquidity continues to be strong
KBC Group’s liquidity ratios*
* Liquidity coverage ratio (LCR) and net stable funding ratio (NSFR) are calculated based on KBC’s interpretation of the current Basel Committee guidance, which may change inthe future. The LCR can be relatively volatile in future due to its calculation method, as month-to-month changes in the difference between inflows and outflows can causeimportant swings in the ratio even if liquid assets remain stable
3Q 20162Q 2016
123%
end 2015
121% 123%
NSFR
end 2015
127% 132%
3Q 20162Q 2016
137%
LCR
Target ≥ 105%

21
KBC Group 3Q & 9M 2016 wrap up

22
Wrap up
More detailed analyst presentation available at www.kbc.com.
Strong commercial bank-insurance results in our core countries
Successful underlying earnings track record
Solid capital and robust liquidity position

23
Looking forward
KBC Group is the bank-insurer that puts its clients centre stage, even in demandingeconomic circumstances
We expect the remainder of 2016 to be a year of sustained economic growth in boththe euro area and the US
Management guides for:• continued stable and solid returns for all Business Units• loan impairments for Ireland towards a release of a 10m-50m EUR range for FY16

24
We put our clients centre stage and they keep counting on us to help them realise and protect their dreams. We do this proactively and work together
to help build society and create sustainable growth. We are genuinely grateful for the confidence they put in us.
Johan Thijs, CEO KBC Group