katalyst’s monitoring and results measurement system
TRANSCRIPT

Katalyst’s Monitoring and Results
Measurement System Markus Kupper and Hasan Shahriar
DCED Seminar on Trends and Results in PSD
Session 4, Tuesday 17 January 2012

Contents
1. Katalyst: the project
2. Overview of the MRM System
3. Research and Measurements
2
1. Katalyst: the project

Katalyst: the project
4
Phase I Phase II
Donors
DFID
SDC
SIDA CIDA
The Netherlands
Implementers Swisscontact, GTZ-IS Swisscontact, GIZ-IS
Duration Oct ’02 –15 Mar ’08 16 Mar ’08 – 15 Mar ’13
Budget CHF 26 million (USD 29m) CHF 51 million (USD 58m)
Line Ministry Ministry of Commerce Ministry of Commerce

Katalyst: the project
5
Phase II
Approach Facilitative market development (M4P)
Geographic orientation National
Current sectors
(14 sectors already exited)
Maize Fertiliser Packaging
Potato Seed Rural distribution
Vegetables Irrigation Rural supply chains
Jute Local government services
Fish ICT
Prawn Media
Furniture
Goal USD 280m additional net income for 2.3m farmers and MSME
www http://www.katalyst.com.bd

Logframe
6
Narrative Summary Primary Indicators
Goal
To contribute to increased income for poor men and women in rural and urban areas.
By end of 2013, Katalyst has contributed to an accumulated net income increase of USD 280 million for 2.3 million farmers and small businesses, providing full time labour equivalents in employment for 450,000 poor people.
Purpose
To increase the competitiveness of low income farmers and small businesses in key urban and rural sectors
2.3 million farmers and small businesses exhibit changes in production, productivity or price of their products.
Outcome
Pro-poor, systemic improvements in business service markets for farmers and small businesses are stimulated
4.1 million farmers and small businesses show changes in business practices (skills, efficiency, technology, environment protection. social responsibility). 2/3 of the 15,000 service providers addressed directly or indirectly by Katalyst show a significant and sustainable change in performance, innovation, capacity, relationships and/or investments.
Outputs
Value adding business services for farmers and small businesses are identified and promoted
At least 70% of the 80 relevant services promoted by Katalyst will continue to be delivered to farmers and small businesses 1 year after terminating project support.

Pro-poor potential? High numbers of poor or
disadvantaged groups
(poor close to markets:
producers, workers
consumers )
Pro-poor growth
potential? “Stepping up” (productivity/
market share)
“Stepping out” (new
markets, jobs,
opportunities)
Pro-poor
intervention
potential?
Feasibility of
stimulating systemic
market change
Defining pro-poor market focus
7

Challenges: size
8
> 200 interventions (~ 80 active)
~ 70 intervention areas
~ 30 sectors
1
portfolio
Intervention
Register
8

2. Overview of the MRM System

GOAL
PURPOSE
OUTCOME
OUTPUT
ACTIVITIES
The Monitoring and Results Measurement System
Employment,
Income
Productivity
Market system impact
Systemic Changes
Interventions
Enterprise Income
Costs, Quality,
Volume
Access to Services
Use of Practices
Log frame Sector logics Intervention
logics
PROVE IMPROVE
EXTERNAL INTERNAL
Frequent Periodic
Regular
reports Case
study Comprehensive
Sector Strategy
Impact assessment
Intervention
report
Interim assessment
Sector
review
meetings
Intervention
plan
Concept
note
Net income
increase
Competitive- ness
System change
Services, Rules Partners Capacities
SMEs Awareness
Aggregation
Facilitation
10

What it needs – the costs of good management
11
1 Director, 2 Group Managers, 8 staff
External inputs
Approximately 6-8% of financial resources
Estimated 15% of human resources
June 2010-11:
39 impact assessments, 16 studies
11

MRM Processes & Documents
CSS
• Sector study + constraint analysis
• Sector logic
CN
• Intervention ideas
• Proposal
IP
• Partner identification
• Planning
SRM
• Implementation
• Monitoring
IIR
• Field study
• Early sign of impact
IA
• Impact Study after 1 year
• Impact study after 2 years
IR
• Review experiences and data
• Case studies
Raising data of target groups
First projections
Detail projections per intervention
Baseline study *)
Revise projections *)
Precise projections *)
Impact data *)
Comprehensive Sector
Strategy
Concept Note
Intervention Plan
Sector Review
Meetings
Interim Intervention
Report
Impact Assessment
Intervention Report
*) aggregating data considering
overlaps
12

3. Research and Measurements Impact and Outreach
Poverty Profiles
Program Costs
Employment
Gender
Systemic Changes
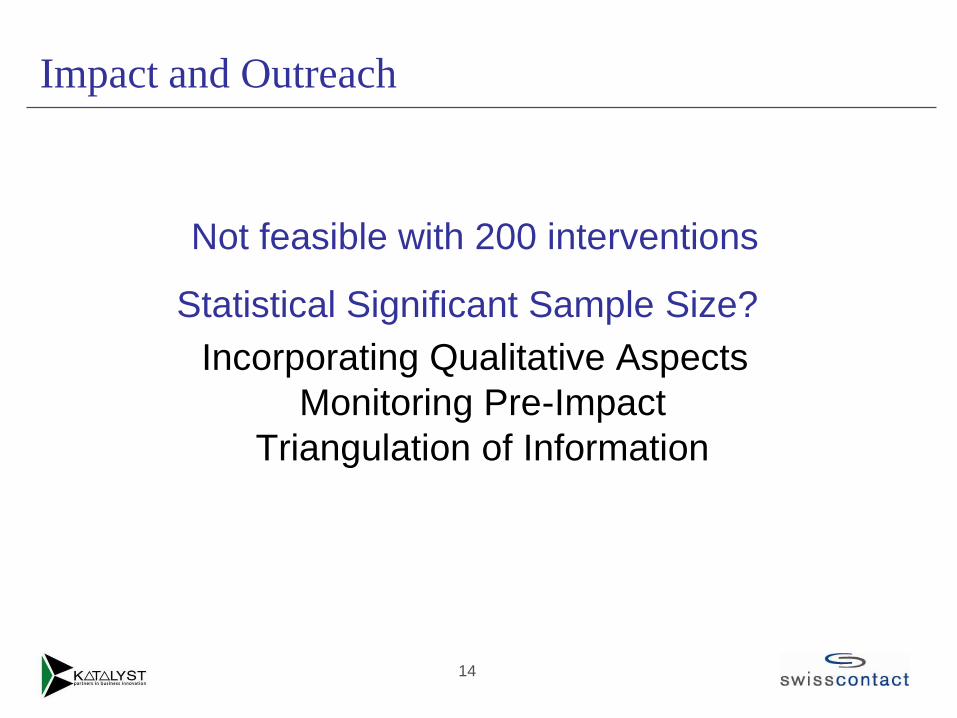
Impact and Outreach
Statistical Significant Sample Size?
Not feasible with 200 interventions
Incorporating Qualitative Aspects
Monitoring Pre-Impact
Triangulation of Information
14

Impact and Outreach
• Quantitative & Qualitative Information
• Questionnaire Pretesting
• Sampling:
Locations
• Stratified
• Proportionate
• Disproportionate
Respondents within a Location
• Service Providers: Purposive & Snowball
• Farmers & mSMEs’: Snowball
15

Impact and Outreach
Sector Locations Sample Size Type of Study
Rural Distribution 9 Sub-districts 108 Treatment
80 Control
Intervention
Baseline
Seed 18 Sub-districts 150 Treatment
150 Control
Intervention
Baseline
ICT 20 Sub-districts 800 Treatment
200 Control
Intervention Impact
Assessment
Packaging 10 Sub-districts 500 Samples Intervention Impact
Assessment
There are around 500 Sub-districts in Bangladesh 16

Research Methodology: Difference in Difference
Before After
Income
Treatment
Control
17

Research Methodology: Difference in Difference
Difference
Observed after
intervention Difference Observed before Intervention
Difference-in-Difference IMPACT of
PROJECT
18

Pota
to
Maiz
e
Overlaps
1. A maize farmer benefits from 2
different interventions
2. A potato farmer also cultivates maize
3. A potato farmer benefits from a potato
and a seed intervention
4. A farmer outside Katalyst’s core
sectors (eg potato, maize) benefits
from interventions in the seed and
fertilizer sectors
• All overlaps documented with
assumptions and considerations
• Different calculation for income
and outreach
Seeds
Fertilizer
2
4
3
1
19

Outreach Contribution of the fertilizer sector
Katalyst Impact Aggregation File

Aggregation in practice: results
21
Farmers and MSME
Phase projection (unadjusted total) 2,397,000
Phase projection (adjusted for overlap) 1,827,000
Achieved June 2011 (aggregated) 1,033,000
USD
Phase projection 255m – 320m
Achieved June 2011 (aggregated) 133m

PPI
National
Survey
All indicators on the national household survey
are ranked according to how strongly they
predict poverty levels.
The full list of 400-1000 indicators is narrowed
to the 100 most powerful ones.
100 indicators
Using both statistics and expert judgment, a 10
indicator scorecard is constructed.
10 indicators
Each possible response is assigned point value
based on the original national survey
responses. The total score (summing from 0 to
100) is then linked to probabilities of falling
above or below the poverty lines.
Credits: Grameen Foundation
Poverty Profiling
Program Costs
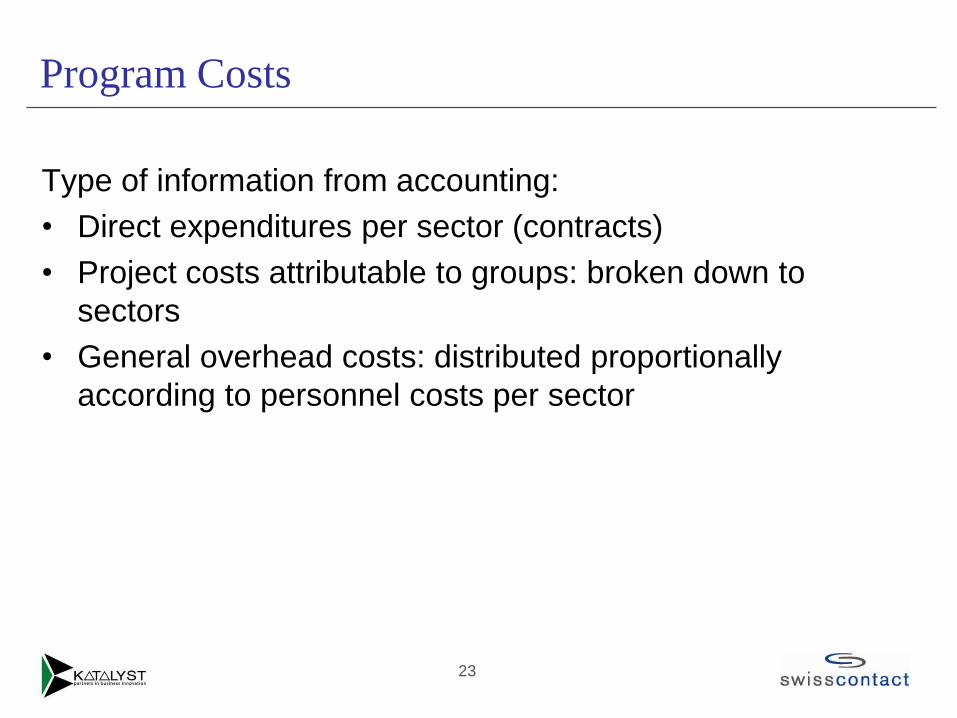
Type of information from accounting:
• Direct expenditures per sector (contracts)
• Project costs attributable to groups: broken down to
sectors
• General overhead costs: distributed proportionally
according to personnel costs per sector
23

Rural Suply Chain 1.7% 4 0.9% 1
Rural Distribution 1.0% 2 1.9% 3
Jute 2.5% 5 2.5% 4
Pvt. Healthcare 1.2% 3 3.5% 6
Tourism 5.4% 11 3.8% 7
Irrigation 3.9% 8 4.0% 8
Packaging 5.3% 10 4.3% 9
Maize 6.7% 15 5.4% 10
Furniture 7.0% 16 5.5% 11
Seed 3.6% 7 6.1% 12
Highest Highest
Lowest Lowest
Sector cost
as % of total
cost
Incremental for
Period XY: 'X' to 'Y'
SectorsRanking
according costs
Cumulative Till Time
Point 'Y'
Sector cost
as % of
total cost
Ranking
according
costs
Program Costs
24

Employment Effects
• Along the value
chains
• In the wider economy
• Selection of value
chain part
• Breakdown in specific
tasks
• Multiplier study
25

Gender
26
For measuring impact pertaining to gender, Katalyst categorizes
interventions in 3 different categories:
• Category 1: Interventions where the primary outreach is male, how
female household members benefit as a result of their male
counterpart’s benefit.
• Category 2: Interventions where there is female participation,
because of their traditional role in the sector.
• Category 3: Interventions which are piloted to include female
participation in non-traditional roles.

Systemic Change
At the heart of M4P!
Crucial to achieve scale and
sustainability!
27
Poverty
reduction
Market system
change
Improved growth
& access
Intervention
Systemic
Market sys
Systemic
changes
Intervention Interventions

SCALE
SU
STA
INA
BIL
ITY
Assessing progress to systemic change
ADOPT
ADAPT
EXPAND
RESPOND
independent
tailoring,
investment
initial ‘innovation’
buy-in, viability
functions, rules
and interconnected
markets crowd in
(depth)
other players, areas
or sectors crowd in
(breadth) 28


Questions-Feedback-Comments
Thank you
30