kashani, m. m., ahmadi, e. , gonzalez-buelga, a., zhang, d ...€¦ · layered composite entangled...
TRANSCRIPT

Kashani, M. M., Ahmadi, E., Gonzalez-Buelga, A., Zhang, D., & Scarpa, F.(2019). Layered composite entangled wire materials blocks as pre-tensionedvertebral rocking columns. Composite Structures, 214, 153-163.https://doi.org/10.1016/j.compstruct.2019.02.021
Peer reviewed version
License (if available):CC BY-NC-ND
Link to published version (if available):10.1016/j.compstruct.2019.02.021
Link to publication record in Explore Bristol ResearchPDF-document
This is the author accepted manuscript (AAM). The final published version (version of record) is available onlinevia Elsevier at https://www.sciencedirect.com/science/article/pii/S0263822318332690 . Please refer to anyapplicable terms of use of the publisher.
University of Bristol - Explore Bristol ResearchGeneral rights
This document is made available in accordance with publisher policies. Please cite only the publishedversion using the reference above. Full terms of use are available:http://www.bristol.ac.uk/pure/about/ebr-terms

Layered Composite Entangled Wire Materials Blocks as Pre-
Tensioned Vertebral Rocking Columns
Mohammad M Kashani1, Ehsan Ahmadi2, Alicia Gonzalez-Buelga3, Dayi Zhang4, Fabrizio
Scarpa5
Abstract
This work focuses on entangled wire materials as an option for use between segments of a
novel self-centring bridge pier inspired from the human spine mechanism to increase energy
dissipation capability of the pier in rocking. A comprehensive set of free-decay vibration tests
was conducted on small-scale columns with and without entangled wire materials. Wooden
blocks are used as vertebrae with entangled wire materials as intervertebral disks. The whole
system is tied together using a pre-tensioned tendon. Dynamic properties of columns (i.e.
frequency and damping ratio) were then identified and compared. It is found that the use of
entangled wire materials significantly increases the energy dissipation capacity of the system
during rocking. This finding is very encouraging for future use of entangled wire materials
composite systems in large-scale testing of the proposed rocking column, while their shear and
axial stiffness needs be improved to reduce large shear and axial deformations.
Keywords: Rocking column; entangled wire material (EWM) layers; vertebral bridge pier;
accelerated bridge construction
1 Associate Professor, University of Southampton, Faculty of Engineering and the Environment, Southampton, SO17 1BJ, UK (corresponding author), Email: [email protected] 2 Postdoctoral Research Associate, University of Southampton, Faculty of Engineering and the Environment,
Southampton, SO17 1BJ, UK 3 Senior Research Associate, University of Bristol, Dept. of Mechanical Engineering University of Bristol,
Bristol, BS8 1TR, United Kingdom 4 Associate Professor, School of Energy and Power Engineering, Beihang University, Beijng, China 5 Professor, Bristol Composites Institute (ACCIS), University of Bristol, Bristol, BS8 1TR, United Kingdom
1. Introduction
1.1 Background
Bridges are critical nodes in any transport network [1]. In seismic regions, post-earthquake
functionality of bridges plays a crucial role in expediting rescue services and mitigating
casualties. Malfunction of bridges will interrupt the whole transport network, and create
enormous economic losses after seismic events ([2],[3]). With growing urban population and
rapid development of economics, reliable seismic design of bridges becomes even more
important. Furthermore, there are many bridges all over the world which suffer from material
ageing and deterioration, and are located in high-seismicity regions ([4],[5],[6]). Material
deterioration (for instance reinforcement corrosion in concrete structures) reduces structural
safety margin, and thus residual capacity of structures becomes far smaller than the capacity of
newly-built structures. Such a pronounced reduction in structural strength requires costly
regular maintenance and rehabilitation works [7].
In conventional construction of concrete bridges, piers are cast in place monolithically to the
foundation. For integral concrete bridges, piers are monolithically connected to both foundation
and deck. As a result, piers crack under lateral movements of the deck, and accelerated
deterioration (e.g. chloride-induced corrosion) occurs ([7],[8],[9]). Moreover, when bridges are
subjected to dynamic earthquake loading, plastic hinges occur in bridge piers due to structural
system of bridges. Therefore, piers are designed to sustain large plastic deformations which
provide high energy dissipation during seismic loadings ([10],[11]). However, very large
residual post-earthquake displacements are induced in bridge piers, and accordingly, bridges
will not be functional after seismic events ([12],[13],[14]). Furthermore, if bridges are ageing,
material deterioration significantly reduces their plastic deformation capacity. Therefore, in the
past two decades, many studies have been conducted to develop precast structural systems that

are seismically resilient. The precast structural systems are constructed using more durable
materials, and can be used in accelerated bridge construction (ABC) ([15],[16],[17],[18]).
1.2 Self-centring rocking bridge piers
From previous studies, it is found that pre-tensioned self-centring rocking segmental bridge
piers are an excellent alternative to the conventional bridge construction
([19],[20],[21],[22],[23]). The pier segments providing rocking mechanism not only allow for
offsite manufacturing which speeds up construction time (i.e. ABC), but also minimise the
residual displacement of the pier under lateral dynamic loading (i.e. seismically resilient) [24].
However, there are two main drawbacks: (1) the rocking mechanism does not provide sufficient
damping under seismic loading, and consequently additional energy-dissipating components
are required to be added to the bridge pier ([25],[20],[26]). These additional elements provide
energy dissipation through large plastic deformations, and thus need be replaced after seismic
events. (2) Sever damages to concrete can also be observed in contact areas due to high contact
stress on the rocking surfaces. More recently, a new pre-tensioned segmental bridge pier with
hybrid sliding-rocking joints was developed ([27],[28],[29],[30],[31]) to address these two
main issues, but they still use plastic deformations to provide damping and energy dissipation
in the system. Nikoukalam et al. [32] used polyurethane segments at the column ends to
accommodate large rotations. However, this column exhibited residual deformations despite
using external replaceable energy-dissipating links.
To avoid permanent structural damage from high irreversible plastic deformations, a
biologically-inspired bridge pier was introduced by Kashani and Gonzalez-Buelga [33]. The
research presented in this paper is building on the initial idea reported in [33]. Figure 1
illustrates the proposed small-scale pre-tensioned segmental bridge pier considered for a proof
of concept study in this paper. The idea was motivated by the mechanics of the human spine.
Small square wooden blocks were used to imitate the ‘vertebral body’ in the system, and thin

rubber layers were used to simulate the ‘intervertebral discs’ (see Figure 1). The whole system
then tied together using a stainless still pre-tensioned tendon. The sliding mechanism was
negligible due to increased friction between rubber layers and wooden blocks. The significant
rocking mechanism in the proposed system was provided by the whole system (blocks as well
as tendon) and rubber layers (see Figure 1). It was found that the proposed vertebral system
provides desired rocking behaviour under dynamic base excitation. However, rubber layers did
not provide sufficient energy dissipation. Clearly then, the proposed novel system lacks an
efficient material as the intervertebral disks to improve damping level of the system.
Figure 1. The biologically-inspired bridge pier concept [33].
1.3 Entangled wire material
Entangled wire materials (EWMs – also called metal rubber) are widely used in the aerospace
industry as dampers in pipes and gas turbine engines. Theoretically, EWMs have almost zero
Poisson’s ratio which allows the material to retain its shape with no lateral expansion during

compression [34]. Furthermore, EWMs are also considered as a good shock-absorbent material
due to its favourable fatigue life and high damping. These properties make EWMs a potential
alternative for use in the biologically-inspired bridge pier as intervertebral disks.
Damping effects of EWMs are highly dependent on internal frictions and contact/slip-stick
states within the material [35]. Zhang et al. ([36],[34]) investigated dynamic behaviour of
nickel-based EWMs subjected to compressive loading. The results demonstrated high potential
of nickel-based EWMs for vibration damping and energy dissipations. Dynamic shear
behaviour of nickel-based EWMs was also investigated [37], and considerable energy
dissipation under dynamic shear forces were observed too. Zhang et al. [36] classified
interaction between metal wires into three phases: non-contact, slip, and stick. At small
vibrational amplitudes, wires remain in the stick phase, where static friction is dominant over
sliding friction [36]. This has a significant effect on the material loss factor which indicates the
energy dissipation through internal friction [38]. At higher vibrational amplitudes, wires begin
to change from the stick phase to the slip phase, and the loss factor may decrease as dynamic
friction coefficient is lower than static friction coefficient [35]. Therefore, dynamic
performance of EWMs under large deformations needs be investigated for their potential use
in the novel biologically-inspired bridge pier. Entangled metal wires have multifunctional
applications, and have been also recently proposed as energy dissipating units in tensegrity
prisms systems ([39],[40]). It is worth noticing that tensegrity prism does possess mechanical
behaviours similar to the human spine [41], and also offers interesting static and dynamics
performance in a lightweight design in civil constructions [42],[43],[44]. The significant
hysteresis effect and modal damping ratio shown by the use of EVMs also in these tensegrity
spine-mimicking structures indicate a potential beneficial use of metal rubbers in other
composite designs for structural applications.

1.4 Innovation and contribution
Although the proof of concept study on the rocking behaviour of the novel biologically-inspired
bridge pier showed promising results, an alternative material to the rubber layers is needed to
increase energy dissipation capacity in the system. Therefore, this study addresses this
knowledge gap and employs entangled wire materials (EWMs) as an alternative material for
use as intervertebral discs. To assess dynamic performance of the system, free-decay vibration
tests are conducted on a small-scale simplified vertebral column (with varying EWM
arrangements and post-tension force of the tendon) to characterise nonlinear dynamic
properties of the system. This work is a preliminary study to lay the scientific foundation for
further development of this novel system to be tested at large scales for potential use in
engineering practice.
2. Experimental Programme
Free-decay vibration gives useful insight into overall nonlinear behaviour of systems and their
frequency and damping variations [45]. Backbone curves and damping skeletons
([46],[47],[48]) can be estimated from free-decay vibration tests particularly for lightly damped
systems [45], which are very beneficial to identifying nonlinear dynamics of a system. Cheng
[24] used free-decay vibration tests to examine energy dissipation capability of rocking precast
bridge piers. Therefore, the experimental programme in this study mainly comprises an
ensemble of free-decay vibration experiments on the proposed self-centring segmental column
(see Figure 1) with different arrangements of EWM layers. Prior to main free-decay vibration
tests, some quasi-static displacement control pullover tests were also conducted to get an
insight into force-displacement behaviour of each column.
2.1 Description of small-scale composite columns
The small-scale self-centring segmental columns tested in this study are shown in Figure 2. It
consists of a base, a column, a tendon, and a mass on the top. Ten number of 60 mm square

wooden blocks were used to model the ‘intervertebral bones’ and nickel-based EWM layers
(see Figure 3) were used to simulate ‘intervertebral discs’. A 35 N mass on the top of the
column was used to represent the deck of bridges, which generates the inertia forces. A 3 mm
hole was drilled through the centre of each block and each EWM layer to allow for a 1.5 mm
high-strength stainless pre-tensioned tendon. The tendon provides structural integrity and self-
centring capability of the whole system. The tendon was connected to a load cell through a
clamp at the top of the column. A bottom clamp was also used to connect the column to the
base. The initial pre-tensioning force of the tendon could be adjusted using an adjustable screw,
which was connected to the tendon. The initial post-tension force of the tendon was provided
by hanging weights (15-52 kg) on a knot at the bottom clamp and spinning the knot. Four
counterbores were drilled to bolt the base to a stable underneath table.
Figure 2. (a) Image of an entangled metal wire (EVM) sample used in the composite intervertebral disk, and (b)
Example of small-scale self-centring vertebral columns with six intervertebral discs.

Figure 3. (a) 3D image of the internal volume of a MR sample (10mm*10mm*10mm) from a μ-CT scan (b)
Detail of one slide of the internal volume [34].
51.5 × 51.5 × 5.3 mm nickel-based EWM layers with porosity, mass, and shear force of 80%,
21.5 gr, and 67 kN were used. The height is defined along the moulding direction during the
manufacturing. The same direction represents also the one related to the length direction in
Figure 3b. The relative density is defined as the ratio between the EWM’s and the wire’s
densities, i.e. the density of the 0Cr18Ni9 material, equivalent to 7.93g/cm3. The EWM layers
are placed between bottom wooden blocks as rocking moments and deformations are higher at
the base. Four different EWM layer arrangements were used to investigate the influence of
EWM layers on the dynamic behaviour of the column: (1) no EWM layers, (2) two EWM
layers, (3) four EWM layers, and (4) six EWM layers between wooden blocks (see Figure 4).
These columns are respectively referred to as C0, C2, C4, and C6 hereafter where the numbers
indicate number of EWM layers.

Figure 4. Different arrangements of EWM layers: (a) no EWM layers (i.e. C0), (b) two EWM layers (i.e. C2),
(c) four EWM layers (i.e. C4), and (d) six EWM layers (i.e. C6).
2.2 Free-decay vibration test
To conduct a free-decay vibration test on each of the columns (see Figure 4), the tension force
of the tendon was first set to an initial value, Ti. Then, the column was laterally pulled, and the
increase in the tendon force was monitored until it reached a target tension force, Tt.
Afterwards, the column was released to vibrate and the acceleration on top of the column, ac,
as well as the tendon tension force, Tc, were measured.
There different types of free-decay vibration tests were conducted on the columns:
• Test 1: To see how initial tension force of the tendon affects dynamic behaviour of the
column, C0, the Ti was incrementally increased from 150 N to 300 N by 20 N. For each
initial tension force, the column was pulled ten times with a constant target tension
force, Tt = 400 N. The range of target tension force was chosen based on results of a
Legend Load cell
Wooden blocks Accelerometer
Top mass (bridge deck) EWM layers
(b)

number of pullover tests conducted on each column. Results of pullover tests will be
discussed in Section 3.1.
• Test 2: To see how target tension force of the tendon influences dynamic behaviour of
the column C0, for the same initial tension force as the Test 1, the target tension force
was incrementally increased ten times up to 400 N.
• Test 3: To investigate dynamic behaviour of C2, C4, and C6 columns, the initial tension
force of the tendon was set to a constant value. The same initial tension force as the
maximum for the C0 column, Ti = 300 N, was first used. The columns were stayed at
where it was pulled to because the EWM layers deformed, and the tension force of the
tendon reached an equilibrium point. Therefore, the initial tension force of the tendon
was increased to a tension force of 500 N, and the columns were able to move back to
their initial position. The target tension force was increased from 520 N to 600 N by
20 N.
2.3 Instrumentation, calibration and data collection
A 2.5 kN tension/compression load cell (Model MCL, Universal Load Cell from RDP [49])
and a PBC accelerometer (model 333M07 [50]) with measurement range of ±10g and
sensitivity of 99 mV/g were accurately calibrated and used to record the post-tension force in
the tendon and in-plane lateral acceleration of the columns respectively. The load cell was
calibrated by incrementally increasing the weight on the hanger and recording the
corresponding value. Figure 5 shows the original weight-voltage values and a line fitted to the
data. The gain (i.e. slope of fitted line) and offset (i.e. voltage axis intersect) are 254 N/V and
0.007 V.

Figure 5. Load cell calibration, weight versus output voltage.
The accelerometer was calibrated by a Type 4294 Brüel & Kjær calibration exciter. It is driven
by a crystal oscillator and constantly sends steady sinusoidal signal. The calibration process
was then to offset the signal and calculate the gain to reach a gravity acceleration. The
accelerometer was connected to a signal conditioner with a gain 100. The offset was 0 and the
gain was 103 m𝑠−2 /V.
The load cell was connected to a Modular 600 Multi-Channel Signal Conditioning System and
then to a dSPACE controller [49]. The accelerometer was connected to a 4 Channel
Piezoelectric Sensor Power Supply & Signal Conditioner and then to the dSpace controller.
The dSPACE Control Desk was programmed in MATLAB Simulink [51] to collect tension
force and acceleration signals shown in Figure 6. Each signal was recorded for 10 seconds with
sampling frequency of 103 Hz.
0 0.2 0.4 0.6 0.8 1-50
0
50
100
150
200
250
Voltage (V)
Weig
ht
(N)
Original data
Fitted line

Figure 6. Diagram of the data acquisition model: (a) tension force of the tendon, and (b) acceleration of the
column (ADC and DC respectively stand for analogue to digital convertor and dSpace controller).
3. Experimental results
In this section, displacement control tests results as well as original measured tension force and
acceleration signals from free-decay vibration tests are presented, and processed for further
analysis in Section 4 of this paper. It should be noted that free-decay tests for C0 with Ti =
150 N and Tt = 390 N as well as C2 with Ti = 500 N and Tt = 580 N are used as examples to
demonstrate the data analysis procedure and experimental results throughout the paper, and
hereafter they are referred to as “exemplar tests”.
3.1 Displacement control tests on all columns
Prior to main experimental tests (i.e. free-decay vibration tests), displacement control tests were
carried out to capture overall tendon tension force versus column’s tip displacement (i.e. Tc -
Dc curves) behaviour for each specimen. These curves provide good insight into the ranges of
initial and target tension force of the tendon taken for the main free-decay vibration tests. For
the column C0, the initial tension force of the tendon was increased from 150 N to 300 N by
20 N. For columns C2, C4, and C6, the initial tension of the tendon was set 500 N.

The displacement is normalized by column height and referred to as drift ratio (Dc/hc). The
tension force of the tendon is normalised by its initial tension force, and named here as tension
force ratio (Tc/Ti). Figure 7 shows the tension force ratio versus drift ratio curves for all types
of columns. All columns, either with or without EWM layers, exhibit a dynamic softening,
meaning that columns become less stiff as they displace further ([47],[52]). The nonlinearity
in the stiffness (i.e. slope of each force-displacement curve) at small drift ratios is clearly seen.
In general, the columns behave linearly until the first joint opens (the first base block), and then
show a strength hardening behaviour with reduced stiffness due to joint opening. As seen in
Figure 7a, increasing initial tension force of the tendon delays the joint opening and increases
the strength hardening. However, it does not affect the stiffness of the system (i.e. constant
slopes, 0.52 N/mm). This is in good agreement with the analytical solution of a single tied
rocking block derived by Alexander et al. [53]. As evident from Figure 7b, adding EWM layers
significantly changes tension force ratio-drift ratio behaviour of the column. Comparing to C0
column, columns with EWM layers show a much lower stiffness, respectively 0.18 N/mm,
0.11 N/mm, and 0.07 N/mm for post-joint opening branch (i.e. at large displacement drift
ratios).

Figure 7. Tendon force ratio-column drift ratio curves: (a) C0 column, and (b) C2, C4, and C6 columns.
3.2 Free-decay vibration test on column C0
Figure 8a shows auto-spectral density (ASD) of the accelerometer for the exemplar C0 test.
The ASD can be seen to have high amplitudes around the first rocking mode frequency of the
column (2.8 Hz-shown by vertical red dashed line in Figure 8a). The side frequency peaks near
the main resonance peak demonstrate the nonlinearity of the system due to friction between
blocks before joint opening (e.g. small vibration amplitudes). This will be investigated further
in Section 4 using backbone curves. The ASD also shows that most of the column vibration
energy is distributed in the frequency range 2-6 Hz and originates from the first rocking mode
0 0.02 0.04 0.06 0.08 0.1 0.12 0.141
1.1
1.2
1.3
Tc/T
i
Dc/h
c
(a)
Ti (N)
180 200 220 240 260 280
0 0.02 0.04 0.06 0.08 0.1 0.12 0.141
1.01
1.02
1.03
1.04
Tc/T
i
Dc/h
c
(b)
C2C4C6

of the column. Thus, the low-magnitude high-frequency components of the acceleration
response are removed for all C0 tests using a zero-phase 4th order low-pass Butterworth filter
[54] (see Figure 8b) with cut-off frequency, 15 Hz. Zero-phase filtering avoids any time shift
in the filtered signal.
Figure 8c shows ASD of the tendon force signal for the exemplar C0 test. The ASD exhibits a
maximum at the tendon tension frequency, (0.1 Hz-shown by vertical red dashed line in Figure
8c). The ASD shows that most of the tendon vibration energy is concentrated in the frequency
range 0-1 Hz. Thus, the higher-frequency components of the tendon force are removed for all
tests using a zero-phase 4th order low-pass Butterworth filter (see Figure 7d) with cut-off
frequency, 5 Hz. It should be noted that both acceleration and force signals clearly demonstrate
that all C0 columns exhibit a typical oscillatory and underdamped free-decay vibration
behaviour.
0 2 4 6 8 10-5
0
5
t (s)
ac (
m/s
2)
(b)
Original measured signalFiltered signal
0 2 4 6 8 100
0.5
1
1.5
2x 10
7
AS
D (
m2s
-4H
z-1
)
f (Hz)
(a)
0 2 4 6 8 10100
150
200
250
300
350
400
t (s)
Tc (
N)
(d)
Original measured signal
Filtered signal
0 1 2 3 4 50
1
2
3
4
5
6x 10
10
AS
D (
N2H
z-1
)
f (Hz)
(c)

Figure 8. For the exemplar C0 test: (a) frequency content of the acceleration response, (b) acceleration response
at the top of the column, (c) frequency content of the tendon force, and (d) tendon force signal.
3.3 Free-decay vibration test on column C2
Figure 9a illustrates ASD of the accelerometer for the exemplar C2 test. In contrast to C0 tests
(see Figure 8a), the ASD here has two different maximum values: (1) at a low frequency,
0.1 Hz, and (2) at a higher frequency, around 1.7 Hz (shown by vertical red dashed lines in
Figure 9a). The same Butterworth filter with cut-off frequency of 4 Hz is used here to remove
very high-frequency vibrations. The vibration amplitude has a significant drop at the beginning
of the free-decay vibration, which implies high damping level of the systems due to EWM
layers (see Figure 9b). The free-decay vibration behaviour is similar to overdamped systems
with a few vibration cycles, and is completely different to the free vibration of typical
underdamped systems.

0 2 4 6 8 10-3
-2
-1
0
1
2
3
t (s)
ac (
m/s
2)
(b)
Original measured signalFiltered signal
0 1 2 3 40
0.5
1
1.5
2
2.5x 10
6
AS
D (
m2s
-4H
z-1
)
f (Hz)
(a)
0 2 4 6 8 10500
520
540
560
580
600
t (s)
Tc (
N)
(d)
Original measured signal
Filtered signal
0 0.5 1 1.5 20
2
4
6
8
10
12
14x 10
9
AS
D (
N2H
z-1
)
f (Hz)
(c)
Figure 9. For the exemplar C2 test: (a) frequency content of the acceleration response, and (b) acceleration
response at the top of the column, (c) frequency content of the tendon force, and (d) tendon force signal.
As expected, the tendon has the same frequency content as the C0 tests (see Figure 8c). As
opposed to the C0 tests where the tendon force drops from the target tension force (390 N-blue
dashed line in Figure 8d) to its initial tension force (150 N-green dashed line) in around 5
seconds (see Figure 8d), for the C2 test, however, the tendon force experiences a sudden drop
from the target tension force to the initial tension force in less than a second. This fast drop
implies the flexibility and highly damped nature of columns with EWM layers compared to
those without any material between blocks.
4. Data Analysis
In this section, dynamic properties of the columns (i.e. frequency and damping ratio) are
determined from free-decay vibration responses for all tests. As the wooden blocks-to-lump
mass ratio is very low (less than 0.0001), the column be idealised with a classical low-order

single degree of freedom (SDOF) system as shown in Figure 10. The rotational spring
represents the rocking stiffness of the columns which varies during the motion. The equation
of motion for the free vibration of the column can be given by:
22 0c c n c n cx x x + + = (1)
where cx , cx , and cx are acceleration, velocity, and displacement of the mass respectively;
ωn = 2πfn is circular frequency of the system; fn and ξc are natural frequency and damping ratio
of the system.
Figure 10. Equivalent SDOF model of the column.
It should be noted that equation (1) holds true for both linear and nonlinear systems. For
nonlinear systems, natural frequency and damping ratio of the system are amplitude-dependent
and varies between cycles of vibration. The acceleration solution to equation (1) for
underdamped systems (ξc<1) only for one cycle of vibration is:
( ) ( )( )1 2cos sinn ct
c d dx e c t c t −
= + (2)
and for overdamped systems (ξc>1):
( ) ( )( )3 4cosh sinhn ct
c d dx e c t c t −
= + (3)

where ωd is damped frequency, 21d n c = − ; c1 to c4 are coefficients depending on initial
time conditions of the system. The overdamped solution (i.e. equation (3)) can be represented
as the summation of two exponential terms:
5 6l ht t
cx c e c e − −
= + (4)
where again c5 and c6 are initial condition-dependent coefficients; ωl and ωh are named as lower
and higher circular frequencies:
( )2 1l n c c = − − (5a)
( )2 1h n c c = + − (5b)
As it is clear from equations (5a) and (5b), response of overdamped systems contains two
highly distinctive frequencies (i.e. ωl and ωh - see Figure 9a) while response of underdamped
systems comprises a discernible frequency (i.e. ωd - see Figure 8a). It should be noted that the
damping and frequency of the column without EWMs are determined from the exponential
term for each cycle of vibration. This allows for instantaneous frequency and damping to
change with vibration amplitude as would happen in a nonlinear system. As will be discussed
in the following section, the damping and frequency are significantly amplitude dependent,
which shows the system’s nonlinearity. However, for damping model of the column with EWM
layers, it will be seen that the system is highly overdamped and viscous damping model is very
appropriate.
4.1 Column with no EWM layer
As seen in Section 3.2, experimental results of C0 columns exhibited an oscillatory vibration
(i.e. underdamped free-decay vibration). For the underdamped column, the analytical
envelopes of the free-decay response are given by ([55], [47]) (see equation (2)):

( ) n ct
cA t A e −
= (6)
where Ac is the free-decay vibration amplitude at a specific time instant. Following procedure
is used herein to determine instantaneous frequency and damping of C0 columns for a specific
free-decay vibration response:
1. Trim start and end of the free vibration response and remove its zero-frequency
component (static component).
2. Filter the free-decay vibration response using a 4th order low-pass Butterworth filter
with cut-off frequency of 10 Hz (see Section 3.2).
3. Identify each vibration amplitude and its corresponding time instant, respectively
denoted as Ac,i and ti for the ith vibration amplitude.
4. Determine frequency at time instant, ti, as fn,i =1/ (ti+1- ti).
5. To determine damping, ξc,i at ti, fit an exponential curve to amplitudes, Ac,i and Ac,i+1,
respectively at ti and ti+1.
Figure 11 shows instantaneous frequency, fn, damping, ξc, and amplitude, Ac, for the
exemplar C0 column using steps 1-5 described above. A seen in Figures 11b and 11c, both
frequency and damping ratio of the column increase with time. At high vibration
amplitudes (4.5 m/s2 for the exemplar C0 column, see Figure 11d), the column’s frequency
is 2.7 Hz, and the damping ratio is relatively light, 0.0125. Thus, the free-decay vibration
results can be used to estimate backbone curves [45]. To achieve this, displacement
amplitudes are determined from acceleration amplitudes at the ith vibration frequency, ωn,i
[45]:
,
, 2
,
c i
c i
n i
AD
= (7)

Figure 11. For the exemplar no-EWM layer column test: (a) filtered and trimmed acceleration response, (b)
instantaneous frequency, (c) instantaneous damping, and (d) vibration envelope.
The amplitude-dependent frequencies of the column, fn, is normalised by the column’s
frequency, fc, at very small vibration amplitudes, where the column frequency is independent
on the initial tension force of the tendon. Therefore, the backbone curve is described in terms
of drift ratio versus frequency ratio. Figure 12 shows non-dimensional backbone and damping
ratio skeleton data for all C0 column tests with different initial post-tension force and constant
target tension force (i.e. Test 1). The column frequency decreases with vibration amplitude
which is typical in lightly-damped structures [56]. However, the damping ratio decreases with
vibration amplitude for the column while for typical structures, the damping ratio increases for
0 1 2 3 4 5-5
0
5
t (s)
ac (
m/s
2)
(a) Original signal
Filtered signal
0 1 2 3 4 52
4
6
t (s)
f n (
Hz)
(b)
0 1 2 3 4 50
0.05
0.1
t (s)
c
(c)
0 1 2 3 4 50
5
t (s)
Ac (
m/s
2)
(d)

higher vibration amplitudes due to nonlinear damping effects involved. The main reason of this
behaviour lies within the tendon’s contribution to the integrity of wooden blocks. At high
vibration amplitudes, despite the compression force acting on wooden blocks being larger
because of higher tensions in the tendon, the friction damping between blocks are insignificant
due to the joint opening and rocking. As the column gets closer to its stationary position, the
wooden blocks contact area increases, and friction damping increases accordingly.
Figure 12. For all C0 column tests with different initial tension force and constant target tension force, Tt =
400 N: (a) backbone estimation data, and (b) damping ratio skeleton data.
The normalised backbone data follows similar trend regardless of initial tension force, and this
well shows that initial tension force of the tendon does not influence the stiffness of the column
(see Figure 12a). However, as the initial tension force increases, the damping ratio skeleton
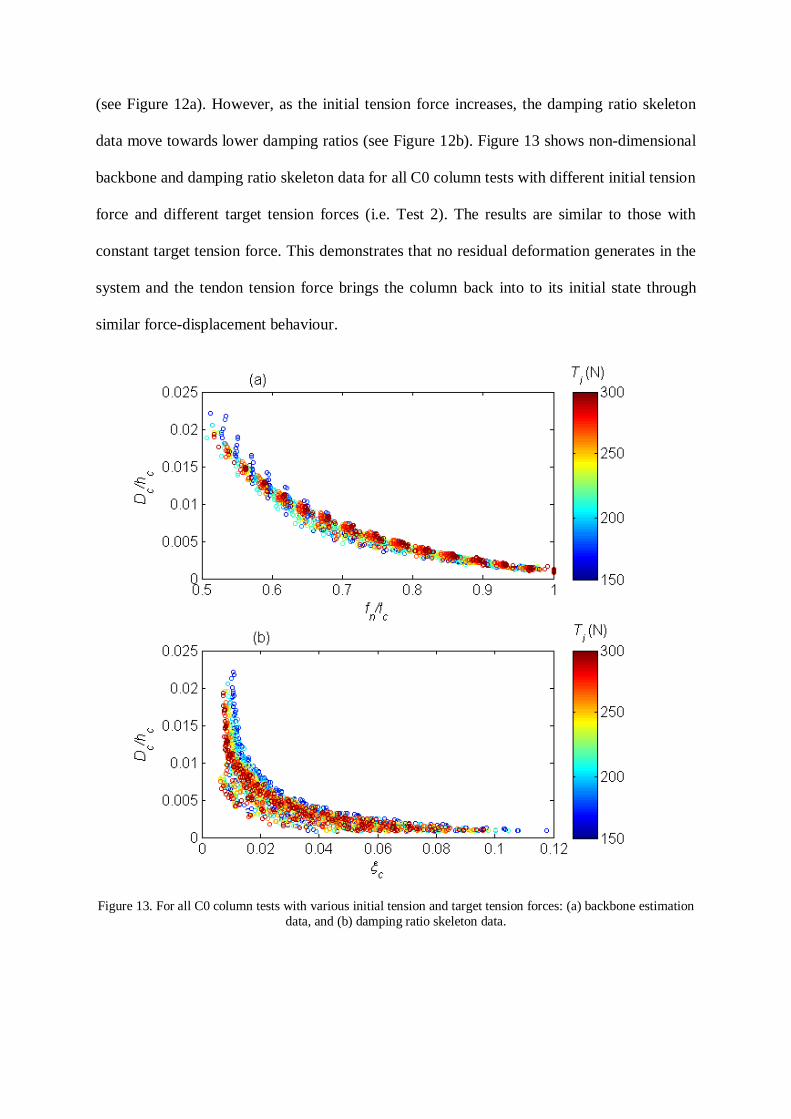
data move towards lower damping ratios (see Figure 12b). Figure 13 shows non-dimensional
backbone and damping ratio skeleton data for all C0 column tests with different initial tension
force and different target tension forces (i.e. Test 2). The results are similar to those with
constant target tension force. This demonstrates that no residual deformation generates in the
system and the tendon tension force brings the column back into to its initial state through
similar force-displacement behaviour.
Figure 13. For all C0 column tests with various initial tension and target tension forces: (a) backbone estimation
data, and (b) damping ratio skeleton data.

4.2 Columns with EWM layers
As experimental results of Section 3.3 showed, the free-decay vibration response of the C2
exemplar tests are very close to behaviour of overdamped free-decay systems. Therefore, as
the behaviour is non-oscillatory, the backbone and skeleton data cannot be obtained for
columns with EWM layers. For the overdamped columns, the total response is the sum of two
responses: a lower-frequency response, ( ) 5lt
lx t c e−
= , and a higher-frequency responses,
( ) 5lt
lx t c e−
= (see equation (4)-Section 4). As ASD of acceleration response of the exemplar
C2 column test showed (see Figure 8a, Section 3.3), lower frequency of the acceleration
response, fl, is 0.1 Hz, and higher frequency of the acceleration response, fh, is spread in a
frequency band with central frequency of around 1.7 Hz.
To determine the lower-frequency component of the response, lx , a low-pass 4th order
Butterworth filter with cut-off frequency of 0.4 Hz is used (see blue dotted line in Figure 14a).
Subtracting the lower-frequency response component from the total response then gives the
higher-frequency response component, hx (see red dotted line in Figure 14a).

Figure 14. For the exemplar two-EWM layer column test: (a) total acceleration response and its higher- and
lower-frequency components, and (b) higher frequency.
It is seen that the higher-frequency response component exhibits an oscillatory vibration with
a few cycles of vibration (Figure 14a):
( ) htc
h hx t A e−
= (8)
Therefore, the same procedure as in Section 4.1 is used here to determine the higher frequency
at different vibration amplitudes (see Figure 14b). Figure 14b shows the frequency of the
higher-frequency response component from free-decay method as well as from the ASD. As it
1.5 2 2.5 3 3.5 4 4.5 5-1
0
1
2
3
t (s)
ac (
m/s
2)
(a)
Total responseLower-frequency responseHigher-frequency response
1.5 2 2.5 3 3.5 4 4.5 51
2
3
4
5
6
7
t (s)
f h (
Hz)
(b)
Free-decay methodASD method

is clear, the higher frequency from the free-decay method at large vibration amplitudes is very
close to that obtained from ASD method (see Figure 14b, blue dashed line, fh = 1.7 Hz).
To determine the damping and frequency of the column at large amplitudes, equations (5a) and
(5b) are combined:
2l h n c + = (9a)
2
l h n = (9b)
fl and fh are used in equations (9a) and (9b), which gives ξc = 1.9 and fn = 0.41 Hz. Figure 15
shows the natural frequency and damping for all columns with EWM layers versus different
target tension forces. First, the natural frequencies of the columns are far lower compared to
the column C0 meaning the columns are more flexible (see Figure 15a). As the number of
layers increases, the natural frequency reduces further. Also, the damping of columns with
EWM layers is significantly higher than the column without EWM layers (see Figure 15b).
This shows high energy dissipation of these columns which dampen the vibration within a few
cycles of vibration. Comparing damping ratios of the columns C2, C4, and C6 demonstrate
higher capability of the columns with higher EWM layers to dissipate vibration energy as
expected.

Figure 15. For all columns with EWM layers: (a) natural frequency, and (b) damping ratio.
5. Conclusions
In this study, the potential application of entangled wire materials in a novel composite bridge
pier inspired by human spine was investigated. To achieve this goal, a number of displacement
control tests and free-decay vibration tests were conducted on a small-scale column made from
wooden blocks as vertebrae and entangled wire material layers as intervertebral discs, tied
together by a stainless tendon. The in-plane rocking acceleration at the top of the column and
tension force of the tendon were then collected for different arrangements of entangled wire
material layers.
520 530 540 550 560 570 580 590 6000.3
0.35
0.4
0.45
0.5
(a)
Tt (N)
f n (
Hz)
C2C4C6
520 530 540 550 560 570 580 590 6001.8
1.9
2
2.1
2.2
2.3
(b)
Tt (N)
c
C2C4C6

It is found that the column without any material between blocks is an oscillatory underdamped
system while adding entangled wire material layers makes the column highly overdamped.
Furthermore, it is found from the displacement control and free-decay vibration test results that
the use of entangled wire materials significantly reduces the column’s dynamic stiffness or
frequency, and the column moves back to its initial state within a few cycles of vibration.
While the energy-dissipation capacity of entangled wire materials was found to be very
promising for their potential use in future large-scale tests of the column, large shear
deformations of the EWM layers were observed during testing which created significant drift
ratios. Therefore, a material with optimal energy dissipation capacity and shear stiffness is fit
for purpose as it dissipates rocking motion with causing less drift ratios.
Acknowledgement
The authors acknowledge support received by the UK Engineering and Physical Sciences
Research Council (EPSRC) for a Prosperous Nation [grant number EP/R039178/1: SPINE:
Resilience-Based Design of Biologically Inspired Columns for Next-Generation Accelerated
Bridge Construction].
REFERENCES
[1] Guo A, Liu Z, Li S, Li H. Seismic performance assessment of highway bridge networks
considering post-disaster traffic demand of a transportation system in emergency conditions.
Structure and Infrastructure Engineering 2017;13:1523–37.
doi:10.1080/15732479.2017.1299770.
[2] Rokneddin K, Ghosh J. The Effects of Deteriorating Bridges on Bridges on the Bridge
Network Connectivity. In 2011 Structures Congress., 2011. doi:10.1061/41171(401)260.
[3] Liu M, Frangopol DM. Balancing connectivity of deteriorating bridge networks and
long-term maintenance cost through optimization. Journal of Bridge Engineering
2005;10:468–81. doi:10.1061/(ASCE)1084-0702(2005)10:4(468).
[4] ASCE. ASCE: Infrastructure Fact Sheet,. 2009.
[5] Kashani MM, Lowes LN, Crewe AJ, Alexander NA. Computational modelling
strategies for nonlinear response prediction of corroded circular RC bridge piers. Advances in
Materials Science and Engineering 2016;2016. doi:10.1155/2016/2738265.

[6] Kashani MM, Crewe AJ, Alexander NA. Structural capacity assessment of corroded
RC bridge piers. Proceedings of the Institution of Civil Engineers - Bridge Engineering
2017;170:28–41. doi:10.1680/jbren.15.00023.
[7] Ni Choine M, Kashani MM, Lowes LN, O’Connor A, Crewe AJ, Alexander NA.
Nonlinear dynamic analysis and seismic fragility assessment of a corrosion damaged integral
bridge. International Journal of Structural Integrity 2016;7:227–39. doi:10.1108/IJSI-09-2014-
0045.
[8] Dizaj EA, Madandoust R, Kashani MM. Probabilistic seismic vulnerability analysis of
corroded reinforced concrete frames including spatial variability of pitting corrosion. Soil
Dynamics and Earthquake Engineering 2018;114: 97-112.doi: 10.1016/j.soildyn.2018.07.013.
[9] Kashani MM, Alagheband P, Khan R, Davis S. Impact of corrosion on low-cycle
fatigue degradation of reinforcing bars with the effect of inelastic buckling. International
Journal of Fatigue 2015;77:174–85. doi:10.1016/j.ijfatigue.2015.03.013.
[10] Jara M, Jara JM, Olmos BA. Seismic energy dissipation and local concentration of
damage in bridge bents. Structure and Infrastructure Engineering 2013;9:794–805.
doi:10.1080/15732479.2011.615330.
[11] Faecke A, Baur M, Schlueter FH, Thoma K. Assessment of Bridge Performance -
Seismic Isolation versus Ductility. BAUINGENIEUR 2009;84:S7–12.
[12] Dazio A. Residual Displacements in Capacity Designed Reinforced Concrete
Structures. Proceedings of the 13th World Conference on Earthquake Engineering, 2004.
[13] Qinghua AI, Dongsheng W, Hongnan LI, Zhiguo SUN. Evaluation of the Seismic
Performance of Reinforced Concrete Bridge Columns Based on Plastic Hinge Model. 14th
World Conference of Earthquake Engineering 2008:1–8.
[14] Kim TH, Lee KM, Chung YS, Shin HM. Seismic damage assessment of reinforced
concrete bridge columns. Engineering Structures 2005;27:576–92.
doi:10.1016/j.engstruct.2004.11.016.
[15] Khan MA. Accelerated Bridge Construction. Accelerated Bridge Construction
2015:257–308. doi:10.1016/B978-0-12-407224-4.00006-X.
[16] Tazarv M, Saiid Saiidi M. Low-Damage Precast Columns for Accelerated Bridge
Construction in High Seismic Zones. Journal of Bridge Engineering 2016;21:4015056.
doi:10.1061/(ASCE)BE.1943-5592.0000806.
[17] Khaleghi B. Highways for Life Projects and Accelerated Bridge Construction in
Washington State. Trb 2011;7181:1–12.
[18] Haber ZB. Precast Column-Footing Connections for Accelerated Bridge Construction
in Seismic Zones. ProQuest Dissertations and Theses 2013:661.
[19] Shim CS, Chung CH, Kim HH. Experimental evaluation of seismic performance of
precast segmental bridge piers with a circular solid section. Engineering Structures
2008;30:3782–92. doi:10.1016/j.engstruct.2008.07.005.
[20] Roh H, Reinhorn AM. Hysteretic behavior of precast segmental bridge piers with
superelastic shape memory alloy bars. Engineering Structures 2010;32:3394–403.
doi:10.1016/j.engstruct.2010.07.013.
[21] Dawood H, ElGawady M, Hewes J. Behavior of Segmental Precast Posttensioned
Bridge Piers under Lateral Loads. Journal of Bridge Engineering 2012;17:735–46.
doi:10.1061/(ASCE)BE.1943-5592.0000252.

[22] Jia J-F, Zhao J-Y, Zhang Q, Han Q, Du X-L, Qi L-K. Cyclic Testing on Seismic
Behavior of Precast Segmental CFST Bridge Piers with Bolted Connections. Zhongguo Gonglu
Xuebao/China Journal of Highway and Transport 2017;30.
[23] Billington SL, Barnes RW, Breen JE. Alternate Substructure Systems for Standard
Highway Bridges. Journal of Bridge Engineering 2001;6:87–94.
doi:doi:10.1061/(ASCE)1084-0702(2001)6:2(87).
[24] Cheng C. Energy dissipation in rocking bridge piers under free vibration tests.
Earthquake Engineering & Structural Dynamics 2007;36:503–18. doi:10.1002/eqe.640.
[25] Motaref S, Saiidi MS, Sanders D. Shake Table Studies of Energy-Dissipating
Segmental Bridge Columns. Journal of Bridge Engineering 2014;19:186–99.
doi:10.1061/(ASCE)BE.1943-5592.0000518.
[26] Nikbakht E, Rashid K, Hejazi F, Osman SA. Application of shape memory alloy bars
in self-centring precast segmental columns as seismic resistance. Structure and Infrastructure
Engineering 2015;11:297–309. doi:10.1080/15732479.2013.876056.
[27] Sideris P. Nonlinear quasi-static analysis of hybrid sliding-rocking bridge columns
subjected to lateral loading. Engineering Structures 2015;101:125–37.
doi:10.1016/j.engstruct.2015.06.053.
[28] Sideris P, Aref AJ, Filiatrault A. Quasi-Static Cyclic Testing of a Large-Scale Hybrid
Sliding-Rocking Segmental Column with Slip-Dominant Joints. Journal of Bridge Engineering
2014;19:4014036. doi:10.1061/(ASCE)BE.1943-5592.0000605.
[29] Sideris P, Aref AJ, Filiatrault A. Experimental seismic performance of a hybrid sliding
– rocking bridge for various specimen configurations and seismic loading conditions. Journal
of Bridge Engineering 2015;20:1–15. doi:10.1061/(ASCE)BE.1943-5592.0000742.
[30] Sideris P, Aref AJ, Filiatrault A. Large-Scale Seismic Testing of a Hybrid Sliding-
Rocking Posttensioned Segmental Bridge System. Journal of Structural Engineering
2014;140:4014025. doi:10.1061/(ASCE)ST.1943-541X.0000961.
[31] Salehi M, Sideris P, Liel AB. Numerical Simulation of Hybrid Sliding-Rocking ( HSR
) Columns subjected to Earthquake Excitation. Journal of Structural Engineering 2017;143:1–
14. doi:10.1061/(ASCE)ST.1943-541X.0001878.
[32] Nikoukalam MT, Sideris P. Resilient Bridge Rocking Columns with Polyurethane
Damage-Resistant End Segments and Replaceable Energy-Dissipating Links. Journal of
Bridge Engineering 2017;22:4017064. doi:10.1061/(ASCE)BE.1943-5592.0001069.
[33] Kashani MM, Gonzalez-Buelga A. Nonlinear dynamics of self-centring segmental
composite rocking column. Procedia Engineering 2017;199:441–6.
doi:10.1016/j.proeng.2017.09.176.
[34] Zhang D, Scarpa F, Ma Y, Boba K, Hong J, Lu H. Compression mechanics of nickel-
based superalloy metal rubber. Materials Science and Engineering A 2013;580:305–12.
doi:10.1016/j.msea.2013.05.064.
[35] Hong J, Chen LL, Ma Y, Tomlinson GR, Rongong JA. Hysteretic properties of metal
rubber particles. Proceedings of the Institution of Mechanical Engineers, Part C: Journal of
Mechanical Engineering Science 2013;227:693–702. doi:10.1177/0954406212452380.
[36] Zhang D, Scarpa F, Ma Y, Hong J, Mahadik Y. Dynamic mechanical behavior of
nickel-based superalloy metal rubber. Materials and Design 2014;56:69–77.
doi:10.1016/j.matdes.2013.10.088.

[37] Chung T, Scarpa F. Shear dynamic behaviour of metal rubber as the core of artificial
intervebral disc, AENGM0032 Research Project, Bristol University, Department of Aerospace
Engineering. 2015.
[38] Carfagni M, Lenzi E, Pierini M. The loss factor as a measure of mechanical damping.
SPIE Proceedings Series 1998:580–4.
[39] Zhang Q, Zhang D, Dobah Y, Scarpa F, Fraternali F, Skelton RE. Tensegrity cell
mechanical metamaterial with metal rubber. Applied Physics Letter 2018;31906.
doi:https://doi.org/10.1063/1.5040850.
[40] Ma Y, Zhang Q, Dobah Y, Scarpa F, Fraternali F, Skelton RE, et al. Meta-tensegrity:
Design of a tensegrity prism with metal rubber. Composite Structures 2018;206.
doi:https://doi.org/10.1016/j.compstruct.2018.08.067.
[41] Levin SM. The tensegrity-truss as a model for spine mechanics. Journal of Mechanics
in Medicine and Biology 2002;2:375–88. doi:10.1142/S0219519402000472.
[42] Fabbrocino F, Carpentieri G. Three-dimensional modeling of the wave dynamics of
tensegrity lattices. Composite Structures 2017;173:9–16.
doi:10.1016/j.compstruct.2017.03.102.
[43] Amendola A, Carpentieri G, de Oliveira M, Skelton RE, Fraternali F. Experimental
investigation of the softening-stiffening response of tensegrity prisms under compressive
loading. Composite Structures 2014;117:234–43. doi:10.1016/j.compstruct.2014.06.022.
[44] Fraternali F, Carpentieri G, Modano M, Fabbrocino F, Skelton RE. A tensegrity
approach to the optimal reinforcement of masonry domes and vaults through fiber-reinforced
composite materials. Composite Structures 2015;134:247–54.
doi:10.1016/j.compstruct.2015.08.087.
[45] Londoño JM, Neild SA, Cooper JE. Identification of backbone curves of nonlinear
systems from resonance decay responses. Journal of Sound and Vibration 2015;348:224–38.
doi:10.1016/j.jsv.2015.03.015.
[46] Renson L, Gonzalez-Buelga A, Barton DAW, Neild SA. Robust identification of
backbone curves using control-based continuation. Journal of Sound and Vibration
2016;367:145–58. doi:10.1016/j.jsv.2015.12.035.
[47] Wagg D, Neild S, To CWS, Lau SK. Nonlinear Vibration with Control: For Flexible
and Adaptive Structures. Springer Cham Heidelberg New York Dordrecht London; 2010.
doi:10.3397/1.3455047.
[48] Worden K, Tomlinson G. Nonlinearity in Structural Dynamics: Detection ,
Identification and Modelling. Institute of Physics Publishing Bristol and Philadelphia; 2001.
[49] RDP group, http://www.rdpe.com n.d.
[50] PCB Piezotronics, http://www.pcb.com n.d.
[51] Simulink, MATLAB, Design, Simulation and Model‑Based,
Https://au.mathworks.com/products/simulink.html 2014.
[52] Touzé C, Thomas O, Chaigne A. Hardening/softening behaviour in non-linear
oscillations of structural systems using non-linear normal modes. Journal of Sound and
Vibration 2004;273:77–101. doi:10.1016/j.jsv.2003.04.005.
[53] Alexander NA, Oddbjornsson O, Taylor CA, Osinga HM, Kelly DE. Exploring the
dynamics of a class of post-tensioned, moment resisting frames. Journal of Sound and

Vibration 2011;330:3710–28. doi:10.1016/j.jsv.2011.02.016.
[54] Yu B, Gabriel D, Noble L, An KN. Estimate of the optimum cutoff frequency for the
Butterworth low-pass digital filter. Journal of Applied Biomechanics 1999;15:318–29.
doi:10.1123/jab.15.3.318.
[55] Inman DJ. Vibration with control. John Wiley & Sons; 2017. doi:10.1037/023990.
[56] Ahmadi E, Živanović S, Caprani C, Evans N, Heirdapour A. A framework for
quantification of human-structure interaction in vertical direction. Journal of Sound and
Vibration 2018;432. doi:10.1016/j.jsv.2018.06.054.