kalibre/genesis manager of managersgenesisworld.com/assets/uploads/pdf/mom_ppt_051115.pdf ·...
TRANSCRIPT

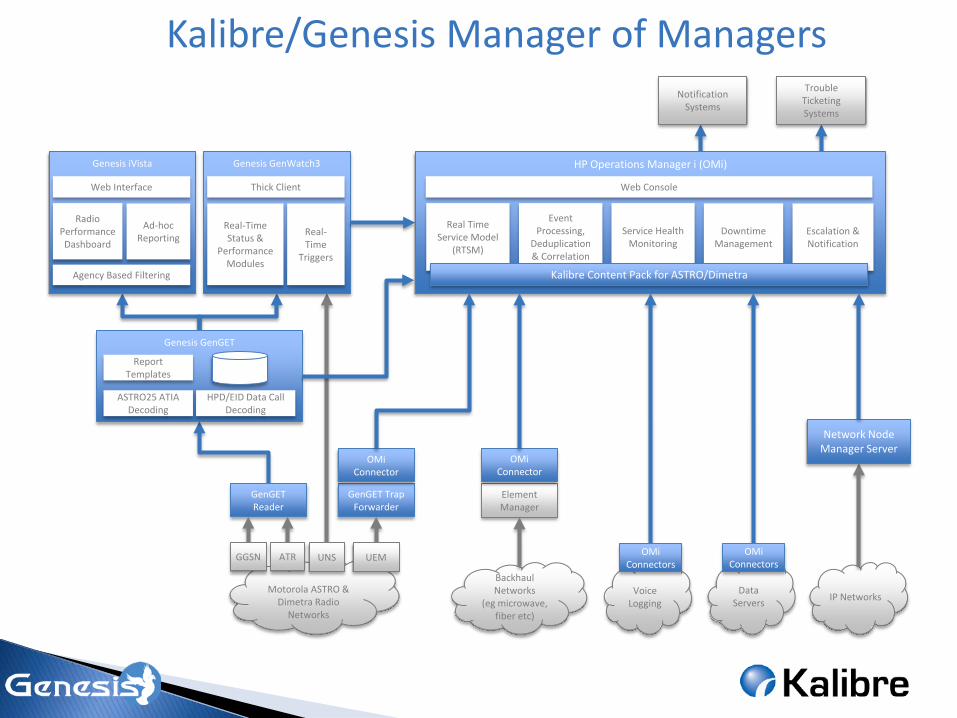
Kalibre/Genesis Manager of Managers
Integrated Fault & Performance Monitoring for Public Safety Communications Networks
Backhaul Networks
(eg microwave, fiber etc)
Motorola ASTRO &
Dimetra Radio Networks
Data Servers
Voice Logging IP Networks
Kalibre/Genesis Manager of Managers Trouble
Ticketing Systems
Notification Systems
Element Manager
OMi Connector
Network Node Manager Server
GenGET Trap Forwarder
OMi Connector
Genesis iVista
Agency Based Filtering
Web Interface
Radio Performance Dashboard
Ad-hoc Reporting
Genesis GenWatch3
Thick Client
Real-Time Status &
Performance Modules
Real-Time
Triggers
Genesis GenGET
Report Templates
HPD/EID Data Call Decoding
ASTRO25 ATIA Decoding
GenGET Reader
UEM GGSN ATR UNS
HP Operations Manager i (OMi)
Service Health Monitoring
Downtime Management
Escalation & Notification
Event Processing,
Deduplication & Correlation
Real Time Service Model
(RTSM)
Web Console
Kalibre Content Pack for ASTRO/Dimetra
OMi Connectors
OMi Connectors

Solution Components – Collection Layer
• Genesis GenGET Reader – Collects Motorola ASTRO25/Dimetra ATIA and GTP call data
• Genesis GenGET Trap Forwarder – Collects, filters and forwards Motorola ASTRO25/Dimetra UEM SNMP
traps
• HP BSM Connector – Provides fault, performance and topology integration with element
managers
• HP Operations Manager & Agents – Provides agent-based monitoring of server hardware, OS and
applications
• HP Network Node Manager – Provides SNMP based monitoring of IP network devices

Solution Components – Management Layer
• Genesis GenGET – Provides collection, decoding and storage of Motorola ASTRO25/Dimetra
voice, HPD/IV&D/EID data calls, and GPS updates – Provides report templates for radio network activity and performance
• Genesis GenWatch3 – Provides real-time views of radio network status and performance – Collects GPS updates from the MUPS server
• Genesis iVista – Filters Genesis data by agency – Provides web-based ad-hoc reporting interface
• HP Business Service Management – Provides single-pane-of-glass fault monitoring across the network – Provides service health and SLA monitoring and reporting – Integrates with trouble-ticketing, notification and GIS systems

Solution Components – Management Layer
• Kalibre BSM Content Pack for ASTRO/Dimetra – Provides out-of-the-box content for BSM for monitoring Motorola
ASTRO and Dimetra networks – Automatically discovers and builds the radio network topology in the
RTSM – Provides extensive event filtering, normalization and event correlation
to provide human-readable events in the BSM browser – Provides service health views to show the actual impact of faults on
the radio services, such as loss of redundancy or reduction in call processing capability
– Integrates performance data and events from Genesis applications

Operations Management
• Web browser based interface – Operator functions – All administrative functions
• Comprehensive fault management functionality • Fully integrated network topology • Role based access with granular permissions model

Ops Mgmt – Single Pane of Glass
All network infrastructure combined in a single consolidated view: - ASTRO radio network - Dispatch - Voice Logging - Transmission - IP networks - Servers and applications

Ops Mgmt – Single Pane of Glass
Drill down all the way from the network to the individual modules on each device

Ops Mgmt – Single Pane of Glass
Alarms translated into plain English. Allows NOCC operators to quickly understand what equipment has faults and where

Ops Mgmt – Single Pane of Glass
Clicking anywhere in the View Explorer instantly filters to just the events from that infrastructure

Ops Mgmt – Single Pane of Glass
Quickly filter events by related device or title

Ops Mgmt – Single Pane of Glass
Define, save and share filters with other users.
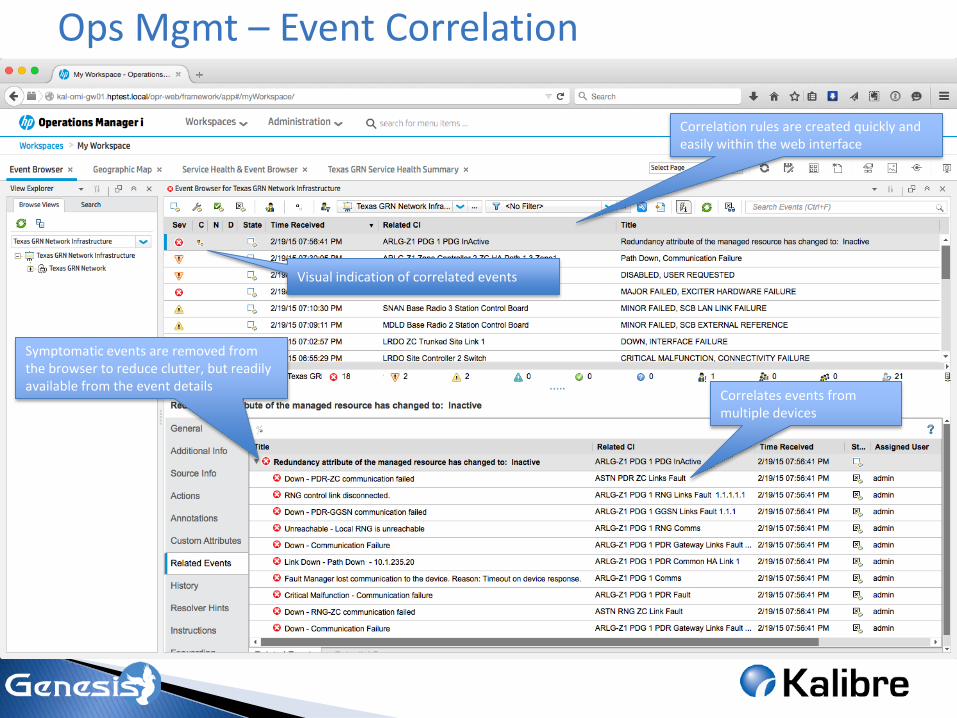
Ops Mgmt – Event Correlation
Visual indication of correlated events
Symptomatic events are removed from the browser to reduce clutter, but readily available from the event details
Correlation rules are created quickly and easily within the web interface
Correlates events from multiple devices

Ops Mgmt – Genesis Triggers
Events detected by Genesis applications are forwarded into the event browser
Triggers can be based on events in the network (eg use of a particular talkgroup) or based on performance statistics (eg Grade of Service threshold breaches)

Service Health monitoring
• Maps infrastructure events to service impact • Allows operators to more quickly identify service
impacting faults • Multiple visualizations available
– Tile-based watch-lists – Hierarchical tree views with traffic light status – Geographic maps – KPI dashboards

Service Health - Watchlist
At a glance visibility of key services and sites Configure and group
services to fit the way the business wants to see it

Service Health - Watchlist
Flip the tiles to see which services are impacted Flip the tiles to see which services are impacted

Service Health - Watchlist
Add an event browser to the bottom of the view, then select a tile to instantly filter the events to the ones impacting that service.

Service Health – Hierarchy View
Provides a quick summary of key statuses for each site
Can be combined with an event browser for quick filtering of service impacting events

Service Health – Geographic Views
BSM provides URLs for integration with Google Earth clients
Can be used in conjunction with other Google Earth layers

Service Health – Geographic Views
Popups show key statuses for selected site

Service Health – Geographic Views
Virtual Earth (Bing Maps) with basic overlays

Service Health – Geographic Views
If an Internet connection is not available from the operator’s machine then BSM provides a basic map interface

Service Health – KPI Dashboard
Heat charts provide a breakdown of KPIs over time, configurable for periods including hours, days and weeks
Headline availability and downtime figures at a glance
Quickly select different time scales and periods

Fault Scenario – Loss of wide trunking at a site
The Dallas site has lost wide trunking due to a backhaul network issue

Fault Scenario – Loss of wide trunking at a site
As a result of the site losing wide trunking, a number of additional events are also received regarding channel trunking status and from the site controller – these are automatically correlated to keep the event browser uncluttered

Fault Scenario – Loss of wide trunking at a site
On the service health view attention is immediately drawn to the service-impacting fault at Dallas

Fault Scenario – Loss of wide trunking at a site
The fault is automatically escalated to the Service Manager system, which responds and provides an incident number back to OMi

Fault Scenario – Loss of wide trunking at a site
The fault is resolved, and the events are automatically closed in OMi

Fault Scenario – Loss of wide trunking at a site
The KPI dashboard reflects the outage, showing the total downtime and the availability percentage, as well as showing the KPIs impacted by the fault