k.2 preliminary design of technical systemopen_jicareport.jica.go.jp/pdf/11712825_14.pdf · source...
TRANSCRIPT

The Study on Solid Waste Management Plan for JICA Municipality of Panama in the Republic of Panama KOKUSAI KOGYO CO., LTD.
K-4
K.2 Preliminary Design of Technical System
K.2.1 Final Disposal Project
a. Examination of Design Conditions
a.1 Target Waste
Target wastes are all municipal solid wastes except hazardous wastes.
a.2 Related Laws and Regulations
At present, MINSA is formulating technical standards on construction of landfills. However,
it is unknown when the standards will enact. Meanwhile, ANAM has established standards
on effluent to public water body. This will control the effluent from leachate treatment
facilities in this plan. Table K-3 shows the effluent standards set by ANAM.
Table K-3: Effluent Standards set by ANAM
Item Unit Discharge limit Oil and grease mg/liter 20 Aluminum Al mg/liter 5 Arsenic As mg/liter 0.50 Boron Br mg/liter 0.75 Cadmium Cd mg/liter 0.01 Calcium Ca mg/liter 1,000 Total cyanide CN mg/liter 0.2 Residual chlorine Cl mg/liter 1.5 Chlorine Cl2 mg/liter 400 Copper Cu mg/liter 1 Total coliform NMP/100 ml 1,000 Phenol compound mg/liter 0.5 Hexavalent chromium Cr+6 mg/liter 0.05 Total chromium Cr mg/liter 5 Biochemical oxygen demand BOD mg/liter 35 Chemical oxygen demand COD mg/liter 100 Detergent mg/liter 1 Foaming PE mm 7 Fluorine F mg/liter 5 Total phosphorus T-P mg/liter 5 Total hydrocarbon mg/liter 5 Iron Fe mg/liter 5 Manganese Mn mg/liter 0.3 Mercaptan mg/liter 0.02 Mercury Hg mg/liter 0.001 Molybdenum Mo mg/liter 2.5 Nickel Ni mg/liter 0.2 Nitrite NO3 mg/liter 6 Total organic nitrogen N mg/liter 10
The Study on Solid Waste Management Plan for JICA Municipality of Panama in the Republic of Panama KOKUSAI KOGYO CO., LTD.
K-5
Item Unit Discharge limit Ammonium-nitrogen NH3-N mg/liter 3 Smell - No perceptible Organic chlorine mg/liter 1.5 Penta chlorine phenol C6OHCl5 mg/liter 0.009 pH mg/liter 5.5. to 9.0 Lead Pb mg/liter 0.050 Selenium Se mg/liter 0.01 Sodium % Na % 35 Sedimentable solid S. SED mg/liter 15 Suspended solid SS mg/liter 35 Total dissolved solid TDS mg/liter 500 Sulphide SO4
-2 mg/liter 1,000 Temperature °C +,- 3 N.T Toluene C6H5CH3 mg/liter 0.7 Trichloro-etane HC2Cl3 mg/liter 0.04 Trichlorometan CHCl3 mg/liter 0.02 Turbidity NTU 30 Xylene C6H4C2H6 0.05 Zinc Zn mg/liter 3 source : Normas para Aguas Residuakes ANAM /DGNTI-COPANIT 35-2000
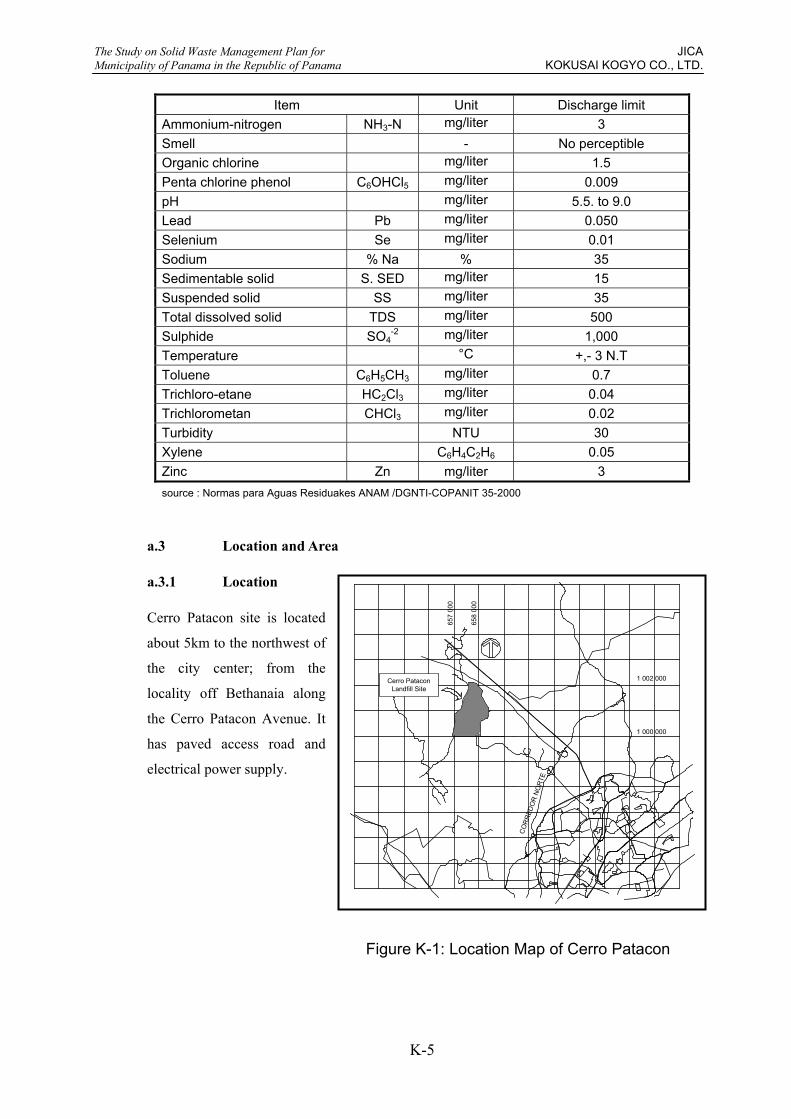
a.3 Location and Area
a.3.1 Location
Cerro Patacon site is located
about 5km to the northwest of
the city center; from the
locality off Bethanaia along
the Cerro Patacon Avenue. It
has paved access road and
electrical power supply.
Figure K-1: Location Map of Cerro Patacon
1 000 000
1 002 000
657
000
658
000
CO
RR
EDO
R N
OR
TE
Cerro PataconLandfill Site

The Study on Solid Waste Management Plan for JICA Municipality of Panama in the Republic of Panama KOKUSAI KOGYO CO., LTD.
K-6
a.3.2 Project Site
The project site is in the Cerro Patacon Landfill that has an area of 130 ha. Besides, 9 ha will
be added with the new landfill development, Etapa 3. Profile of the project site is as follows.
• The maximum height: 106 masl • The minimum height: 43 masl • Area: about 28ha There is a small hill at the north and a shallow valley at the south in the project site. Around
the project site, there is a hill at the north, the existing landfill (Etapa I) at the south, a river at
the east and other existing landfill (Etapa II) at the west.
Figure K-2: Project Site
Etapa 1(11ha)
Chatarra(5.0ha
Etapa 2(16.2 ha)Present leachate
treatment lagoon
Present border linePresent Cerro PataconSite (130 ha)
Expand area (9ha)
New border line
Rio Mocambo(river)
Etapa 3(for F/S, 28 ha)
The Study on Solid Waste Management Plan for JICA Municipality of Panama in the Republic of Panama KOKUSAI KOGYO CO., LTD.
K-7
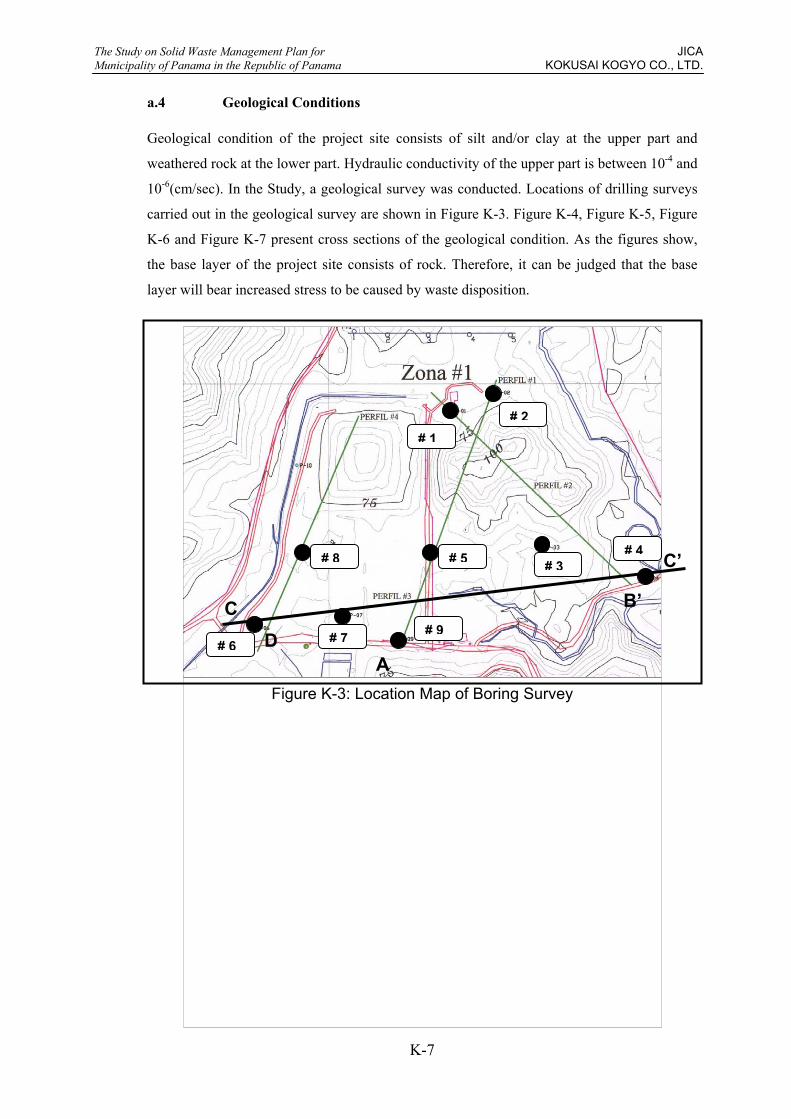
a.4 Geological Conditions
Geological condition of the project site consists of silt and/or clay at the upper part and
weathered rock at the lower part. Hydraulic conductivity of the upper part is between 10-4 and
10-6(cm/sec). In the Study, a geological survey was conducted. Locations of drilling surveys
carried out in the geological survey are shown in Figure K-3. Figure K-4, Figure K-5, Figure
K-6 and Figure K-7 present cross sections of the geological condition. As the figures show,
the base layer of the project site consists of rock. Therefore, it can be judged that the base
layer will bear increased stress to be caused by waste disposition.
Figure K-3: Location Map of Boring Survey
B’
C’
CD
# 8
# 6
# 5
# 7 # 9
# 3# 4
A
# 1# 2

The Study on Solid Waste Management Plan for JICA Municipality of Panama in the Republic of Panama KOKUSAI KOGYO CO., LTD.
K-8
Figure K-4: Section A-A’
Figure K-5: Section B-B’
40
50
60
70
80
90
100
110
ROCKHole #9 Hole #5Hole #2
A’A
Fault
Ground Water Level Soil
30
50
70
90
110
0 100 200 300 400 500 600 700
Ground Water Level
ROCKSoil Hole #1
Hole #4
B B’

The Study on Solid Waste Management Plan for JICA Municipality of Panama in the Republic of Panama KOKUSAI KOGYO CO., LTD.
K-9
Figure K-6: Section C-C’
Figure K-7: Section D-D’
30
40
50
60
70
80
0 100 200 300 400 500 600 700 800 900 1000 1100
ROCK
Hole #7
Hole #4
C C’
Hole #6
Soil
Ground Water Level
Fault
30
50
70
90
110
0 100 200 300 400 500 600 700
ROCK
Waste Hole #6 Hole #8
Fault
Ground Water Level
D D’
Soil
The Study on Solid Waste Management Plan for JICA Municipality of Panama in the Republic of Panama KOKUSAI KOGYO CO., LTD.
K-10
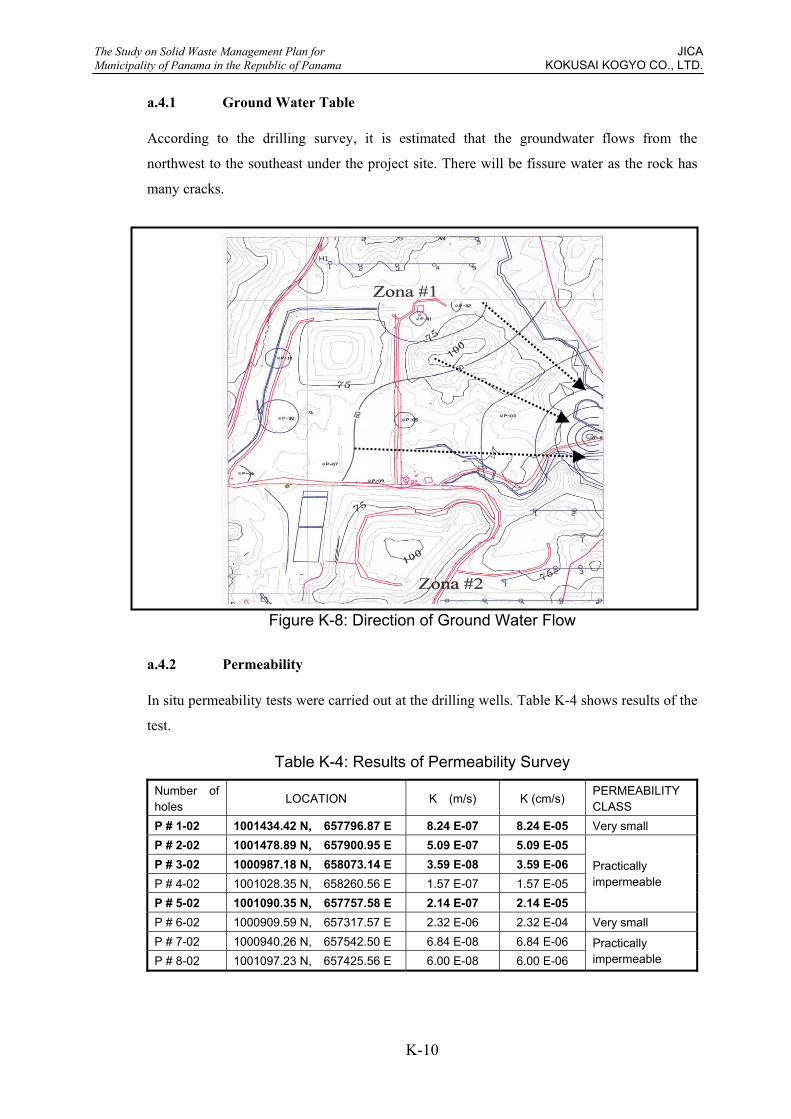
a.4.1 Ground Water Table
According to the drilling survey, it is estimated that the groundwater flows from the
northwest to the southeast under the project site. There will be fissure water as the rock has
many cracks.
Figure K-8: Direction of Ground Water Flow a.4.2 Permeability
In situ permeability tests were carried out at the drilling wells. Table K-4 shows results of the
test.
Table K-4: Results of Permeability Survey
Number of holes LOCATION K (m/s) K (cm/s) PERMEABILITY
CLASS P # 1-02 1001434.42 N, 657796.87 E 8.24 E-07 8.24 E-05 Very small P # 2-02 1001478.89 N, 657900.95 E 5.09 E-07 5.09 E-05 P # 3-02 1000987.18 N, 658073.14 E 3.59 E-08 3.59 E-06 P # 4-02 1001028.35 N, 658260.56 E 1.57 E-07 1.57 E-05 P # 5-02 1001090.35 N, 657757.58 E 2.14 E-07 2.14 E-05
Practically impermeable
P # 6-02 1000909.59 N, 657317.57 E 2.32 E-06 2.32 E-04 Very small P # 7-02 1000940.26 N, 657542.50 E 6.84 E-08 6.84 E-06 P # 8-02 1001097.23 N, 657425.56 E 6.00 E-08 6.00 E-06
Practically impermeable
The Study on Solid Waste Management Plan for JICA Municipality of Panama in the Republic of Panama KOKUSAI KOGYO CO., LTD.
K-11
No. 1, 2, 3, and 5 are in the project site. All of them indicate considerably lower permeability,
i.e., between 10-5 and 10-6 cm/sec. The values imply that the site might need synthetic liner at
the bottom of a landfill. Meanwhile, the base layer consists of the weathered rock and fissure
water exists. Therefore, it can be concluded that the bottom of the landfill will require a
synthetic liner, although the upper part show the low permeability.
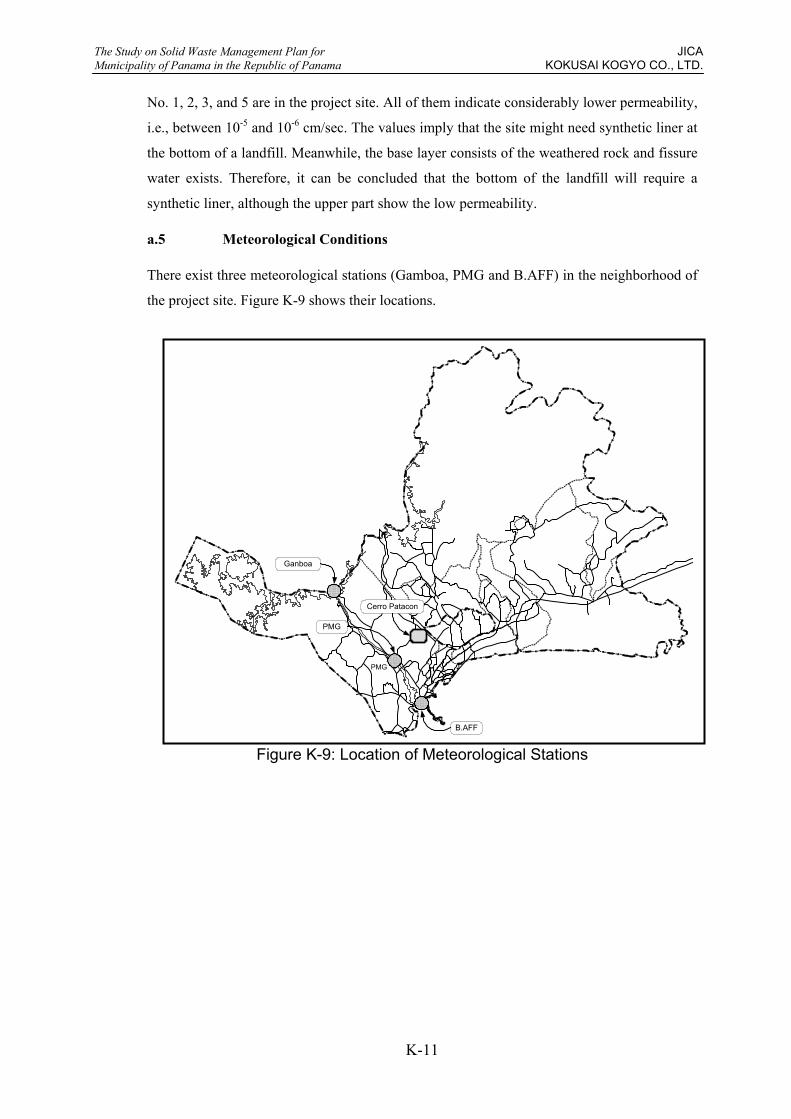
a.5 Meteorological Conditions
There exist three meteorological stations (Gamboa, PMG and B.AFF) in the neighborhood of
the project site. Figure K-9 shows their locations.
Figure K-9: Location of Meteorological Stations
PMG
Cerro Patacon
Ganboa
B.AFF
PMG
The Study on Solid Waste Management Plan for JICA Municipality of Panama in the Republic of Panama KOKUSAI KOGYO CO., LTD.
K-12
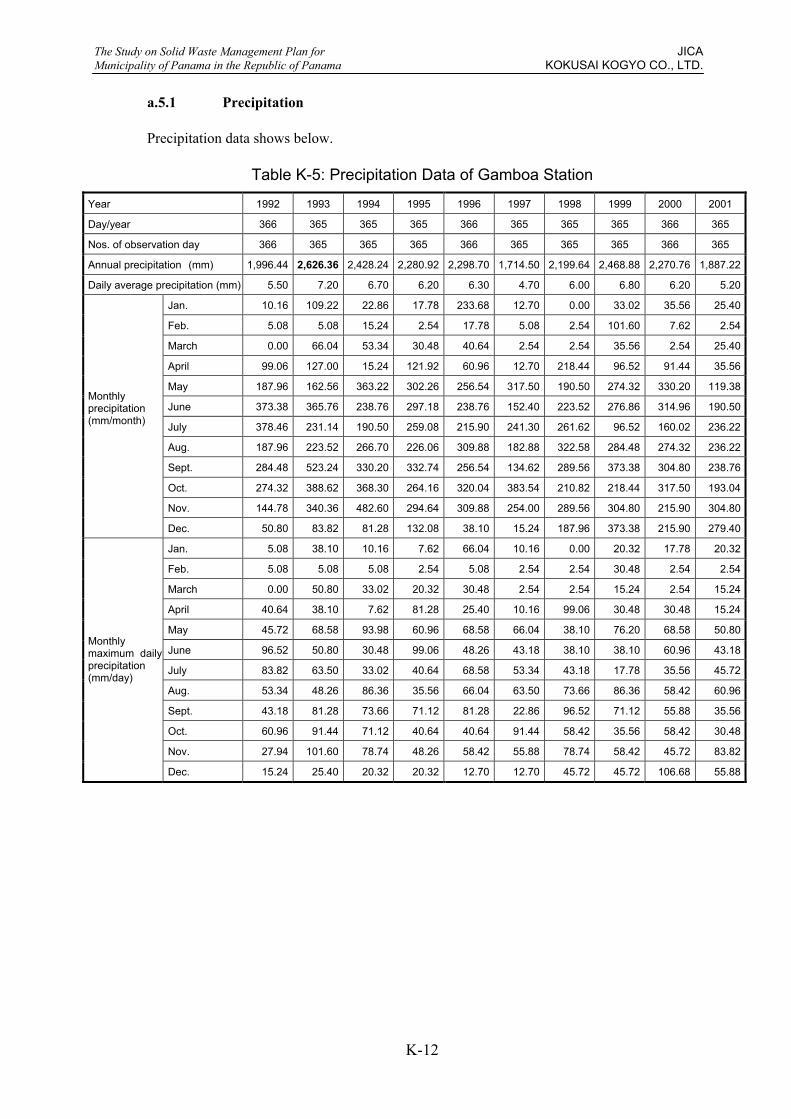
a.5.1 Precipitation
Precipitation data shows below.
Table K-5: Precipitation Data of Gamboa Station
Year 1992 1993 1994 1995 1996 1997 1998 1999 2000 2001
Day/year 366 365 365 365 366 365 365 365 366 365
Nos. of observation day 366 365 365 365 366 365 365 365 366 365
Annual precipitation (mm) 1,996.44 2,626.36 2,428.24 2,280.92 2,298.70 1,714.50 2,199.64 2,468.88 2,270.76 1,887.22
Daily average precipitation (mm) 5.50 7.20 6.70 6.20 6.30 4.70 6.00 6.80 6.20 5.20
Jan. 10.16 109.22 22.86 17.78 233.68 12.70 0.00 33.02 35.56 25.40
Feb. 5.08 5.08 15.24 2.54 17.78 5.08 2.54 101.60 7.62 2.54
March 0.00 66.04 53.34 30.48 40.64 2.54 2.54 35.56 2.54 25.40
April 99.06 127.00 15.24 121.92 60.96 12.70 218.44 96.52 91.44 35.56
May 187.96 162.56 363.22 302.26 256.54 317.50 190.50 274.32 330.20 119.38
June 373.38 365.76 238.76 297.18 238.76 152.40 223.52 276.86 314.96 190.50
July 378.46 231.14 190.50 259.08 215.90 241.30 261.62 96.52 160.02 236.22
Aug. 187.96 223.52 266.70 226.06 309.88 182.88 322.58 284.48 274.32 236.22
Sept. 284.48 523.24 330.20 332.74 256.54 134.62 289.56 373.38 304.80 238.76
Oct. 274.32 388.62 368.30 264.16 320.04 383.54 210.82 218.44 317.50 193.04
Nov. 144.78 340.36 482.60 294.64 309.88 254.00 289.56 304.80 215.90 304.80
Monthly precipitation (mm/month)
Dec. 50.80 83.82 81.28 132.08 38.10 15.24 187.96 373.38 215.90 279.40
Jan. 5.08 38.10 10.16 7.62 66.04 10.16 0.00 20.32 17.78 20.32
Feb. 5.08 5.08 5.08 2.54 5.08 2.54 2.54 30.48 2.54 2.54
March 0.00 50.80 33.02 20.32 30.48 2.54 2.54 15.24 2.54 15.24
April 40.64 38.10 7.62 81.28 25.40 10.16 99.06 30.48 30.48 15.24
May 45.72 68.58 93.98 60.96 68.58 66.04 38.10 76.20 68.58 50.80
June 96.52 50.80 30.48 99.06 48.26 43.18 38.10 38.10 60.96 43.18
July 83.82 63.50 33.02 40.64 68.58 53.34 43.18 17.78 35.56 45.72
Aug. 53.34 48.26 86.36 35.56 66.04 63.50 73.66 86.36 58.42 60.96
Sept. 43.18 81.28 73.66 71.12 81.28 22.86 96.52 71.12 55.88 35.56
Oct. 60.96 91.44 71.12 40.64 40.64 91.44 58.42 35.56 58.42 30.48
Nov. 27.94 101.60 78.74 48.26 58.42 55.88 78.74 58.42 45.72 83.82
Monthly maximum daily precipitation (mm/day)
Dec. 15.24 25.40 20.32 20.32 12.70 12.70 45.72 45.72 106.68 55.88

The Study on Solid Waste Management Plan for JICA Municipality of Panama in the Republic of Panama KOKUSAI KOGYO CO., LTD.
K-13
Table K-6: Precipitation Data of PMG Station
Year 1990 1991 1992 1993 1994 1995 1996 1997 1998 1999 2000 2001
Day/year 365 365 366 365 365 365 366 365 365 365 366 365
Nos. of observation day 365 365 366 365 365 365 366 365 365 365 366 365
Annual precipitation (mm) 1,922.78 2,311.40 2,044.70 2,197.10 1,968.50 1,971.04 2,367.28 1,668.78 2,189.48 2,270.76 2,138.68 1,963.42
Daily average precipitation (mm) 5.30 6.30 5.60 6.00 5.40 5.40 6.50 4.60 6.00 6.20 5.80 5.40
Jan. 22.86 5.08 0.00 93.98 10.16 5.08 144.78 38.10 2.54 81.28 45.72 12.70
Feb. 0.00 0.00 2.54 0.00 0.00 2.54 55.88 12.70 0.00 81.28 7.62 0.00
March 0.00 5.08 2.54 17.78 142.24 20.32 73.66 0.00 0.00 27.94 0.00 2.54
April 106.68 228.60 45.72 83.82 45.72 149.86 88.90 17.78 33.02 63.50 144.78 40.64
May 213.36 350.52 220.98 218.44 347.98 215.90 381.00 154.94 314.96 220.98 200.66 172.72
June 177.80 266.70 345.44 459.74 170.18 330.20 208.28 121.92 243.84 360.68 302.26 132.08
July 335.28 274.32 266.70 292.10 142.24 266.70 119.38 279.40 299.72 127.00 236.22 261.62
Aug. 294.64 276.86 251.46 200.66 233.68 177.80 342.90 149.86 337.82 220.98 271.78 142.24
Sept. 193.04 325.12 309.88 279.40 236.22 149.86 177.80 185.42 215.90 337.82 236.22 266.70
Oct. 327.66 228.60 353.06 218.44 279.40 256.54 332.74 347.98 279.40 297.18 347.98 340.36
Nov. 137.16 317.50 190.50 238.76 355.60 347.98 347.98 332.74 274.32 208.28 167.64 332.74
Monthly precipitation (mm/month)
Dec. 114.30 33.02 55.88 93.98 5.08 48.26 93.98 27.94 187.96 243.84 177.80 259.08
Jan. 15.24 2.54 0.00 50.80 7.62 5.08 60.96 27.94 2.54 40.64 15.24 7.62
Feb. 0.00 0.00 2.54 0.00 0.00 2.54 17.78 10.16 0.00 73.66 5.08 0.00
March 0.00 5.08 2.54 10.16 101.60 12.70 53.34 0.00 0.00 12.70 0.00 2.54
April 81.28 111.76 17.78 40.64 17.78 71.12 35.56 12.70 17.78 22.86 71.12 40.64
May 33.02 91.44 60.96 35.56 66.04 45.72 93.98 48.26 81.28 45.72 30.48 45.72
June 30.48 43.18 96.52 121.92 38.10 86.36 60.96 53.34 83.82 76.20 50.80 27.94
July 104.14 68.58 45.72 68.58 25.40 88.90 50.80 55.88 60.96 35.56 50.80 50.80
Aug. 73.66 83.82 86.36 53.34 68.58 27.94 88.90 45.72 68.58 30.48 48.26 38.10
Sept. 76.20 68.58 73.66 48.26 58.42 43.18 33.02 45.72 35.56 60.96 38.10 78.74
Oct. 48.26 71.12 172.72 40.64 76.20 55.88 48.26 78.74 66.04 91.44 71.12 66.04
Nov. 25.40 71.12 45.72 38.10 91.44 53.34 48.26 73.66 66.04 43.18 30.48 45.72
Monthly maximum daily precipitation (mm/day)
Dec. 58.42 17.78 25.40 17.78 2.54 17.78 20.32 22.86 60.96 38.10 55.88 40.64

The Study on Solid Waste Management Plan for JICA Municipality of Panama in the Republic of Panama KOKUSAI KOGYO CO., LTD.
K-14
Table K-7: Precipitation Data of B.AFF Station
Year 1992 1993 1994 1995 1996 1997 1998 1999 2000 2001 Day/year 366 365 365 365 366 365 365 365 366 365 Nos. of observation day 366 365 365 365 366 365 365 365 366 365 Annual precipitation (mm) 2,207.26 2,443.48 2,100.58 2,875.28 2,451.10 1,905.00 1,953.26 1,940.56 1,927.86 1,684.02Daily average precipitation (mm) 6.00 6.70 5.80 7.90 6.70 5.20 5.40 5.30 5.30 4.60
Jan. 0.00 68.58 0.00 0.00 154.94 170.18 0.00 43.18 53.34 17.78
Feb. 5.08 0.00 33.02 0.00 99.06 15.24 15.24 17.78 81.28 0.00
March 0.00 91.44 55.88 63.50 76.20 0.00 0.00 86.36 22.86 0.00
April 22.86 76.20 40.64 81.28 91.44 0.00 73.66 68.58 76.20 50.80
May 269.24 487.68 314.96 393.70 337.82 144.78 373.38 223.52 180.34 203.20
June 213.36 205.74 248.92 566.42 254.00 215.90 279.40 241.30 287.02 254.00
July 256.54 462.28 129.54 304.80 200.66 134.62 198.12 165.10 195.58 119.38
Aug. 299.72 215.90 266.70 215.90 167.64 147.32 172.72 132.08 149.86 71.12
Sept. 271.78 292.10 182.88 490.22 142.24 360.68 254.00 172.72 256.54 266.70
Oct. 431.80 172.72 320.04 401.32 317.50 358.14 167.64 203.20 292.10 223.52
Nov. 299.72 254.00 411.48 157.48 408.94 347.98 218.44 335.28 200.66 241.30
Monthly precipitation (mm/month)
Dec. 137.16 116.84 96.52 200.66 200.66 10.16 200.66 251.46 132.08 236.22
Jan. 0.00 35.56 0.00 0.00 35.56 71.12 0.00 17.78 27.94 15.24
Feb. 5.08 0.00 33.02 0.00 27.94 7.62 7.62 7.62 30.48 0.00
March 0.00 45.72 30.48 33.02 45.72 0.00 0.00 43.18 12.70 0.00
April 10.16 38.10 20.32 40.64 38.10 0.00 48.26 35.56 45.72 40.64
May 81.28 104.14 83.82 152.40 78.74 27.94 134.62 55.88 63.50 83.82
June 53.34 76.20 73.66 190.50 93.98 71.12 93.98 50.80 83.82 50.80
July 60.96 152.40 43.18 55.88 55.88 35.56 68.58 63.50 35.56 43.18
Aug. 58.42 68.58 48.26 53.34 27.94 78.74 38.10 35.56 20.32 17.78
Sept. 66.04 50.80 60.96 162.56 38.10 134.62 60.96 50.80 53.34 55.88
Oct. 83.82 35.56 73.66 88.90 66.04 91.44 71.12 58.42 63.50 40.64
Nov. 48.26 40.64 152.40 35.56 73.66 101.60 45.72 76.20 27.94 58.42
Monthly maximum daily precipitation (mm/day)
Dec. 27.94 35.56 63.50 38.10 40.64 10.16 27.94 53.34 43.18 91.44
The Study on Solid Waste Management Plan for JICA Municipality of Panama in the Republic of Panama KOKUSAI KOGYO CO., LTD.
K-15
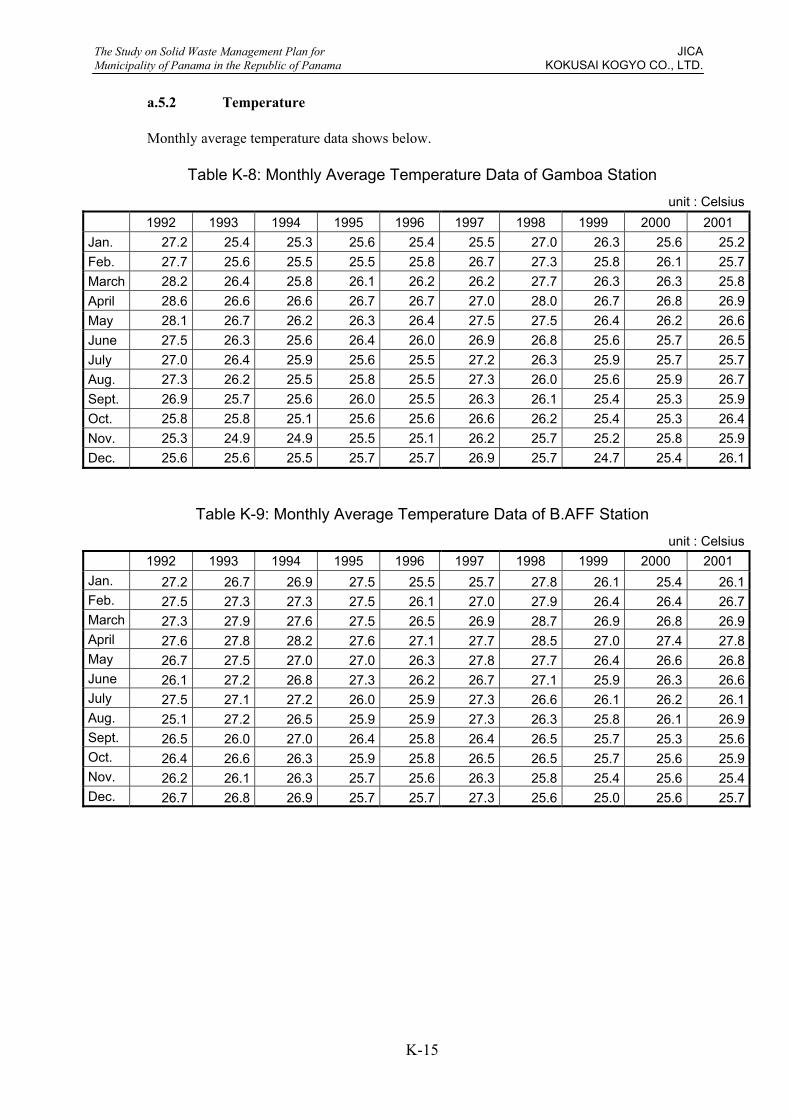
a.5.2 Temperature
Monthly average temperature data shows below.
Table K-8: Monthly Average Temperature Data of Gamboa Station unit : Celsius
1992 1993 1994 1995 1996 1997 1998 1999 2000 2001 Jan. 27.2 25.4 25.3 25.6 25.4 25.5 27.0 26.3 25.6 25.2Feb. 27.7 25.6 25.5 25.5 25.8 26.7 27.3 25.8 26.1 25.7March 28.2 26.4 25.8 26.1 26.2 26.2 27.7 26.3 26.3 25.8April 28.6 26.6 26.6 26.7 26.7 27.0 28.0 26.7 26.8 26.9May 28.1 26.7 26.2 26.3 26.4 27.5 27.5 26.4 26.2 26.6June 27.5 26.3 25.6 26.4 26.0 26.9 26.8 25.6 25.7 26.5July 27.0 26.4 25.9 25.6 25.5 27.2 26.3 25.9 25.7 25.7Aug. 27.3 26.2 25.5 25.8 25.5 27.3 26.0 25.6 25.9 26.7Sept. 26.9 25.7 25.6 26.0 25.5 26.3 26.1 25.4 25.3 25.9Oct. 25.8 25.8 25.1 25.6 25.6 26.6 26.2 25.4 25.3 26.4Nov. 25.3 24.9 24.9 25.5 25.1 26.2 25.7 25.2 25.8 25.9Dec. 25.6 25.6 25.5 25.7 25.7 26.9 25.7 24.7 25.4 26.1
Table K-9: Monthly Average Temperature Data of B.AFF Station unit : Celsius
1992 1993 1994 1995 1996 1997 1998 1999 2000 2001 Jan. 27.2 26.7 26.9 27.5 25.5 25.7 27.8 26.1 25.4 26.1Feb. 27.5 27.3 27.3 27.5 26.1 27.0 27.9 26.4 26.4 26.7March 27.3 27.9 27.6 27.5 26.5 26.9 28.7 26.9 26.8 26.9April 27.6 27.8 28.2 27.6 27.1 27.7 28.5 27.0 27.4 27.8May 26.7 27.5 27.0 27.0 26.3 27.8 27.7 26.4 26.6 26.8June 26.1 27.2 26.8 27.3 26.2 26.7 27.1 25.9 26.3 26.6July 27.5 27.1 27.2 26.0 25.9 27.3 26.6 26.1 26.2 26.1Aug. 25.1 27.2 26.5 25.9 25.9 27.3 26.3 25.8 26.1 26.9Sept. 26.5 26.0 27.0 26.4 25.8 26.4 26.5 25.7 25.3 25.6Oct. 26.4 26.6 26.3 25.9 25.8 26.5 26.5 25.7 25.6 25.9Nov. 26.2 26.1 26.3 25.7 25.6 26.3 25.8 25.4 25.6 25.4Dec. 26.7 26.8 26.9 25.7 25.7 27.3 25.6 25.0 25.6 25.7
The Study on Solid Waste Management Plan for JICA Municipality of Panama in the Republic of Panama KOKUSAI KOGYO CO., LTD.
K-16
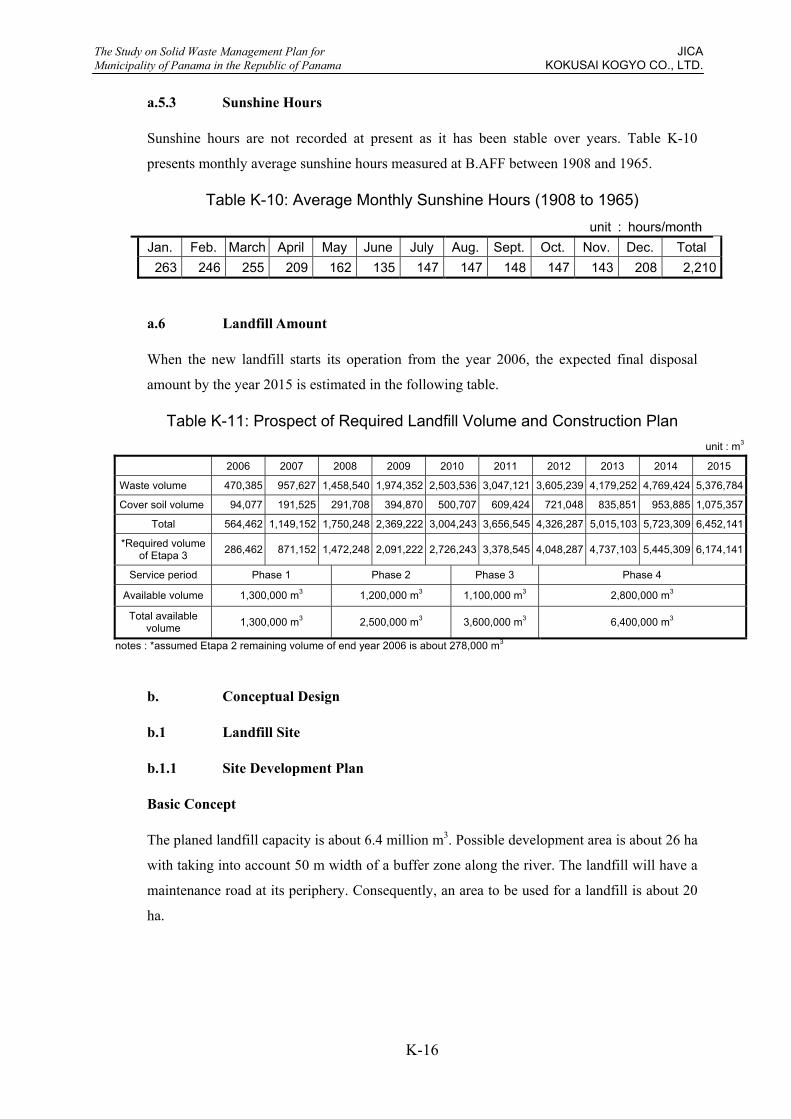
a.5.3 Sunshine Hours
Sunshine hours are not recorded at present as it has been stable over years. Table K-10
presents monthly average sunshine hours measured at B.AFF between 1908 and 1965.
Table K-10: Average Monthly Sunshine Hours (1908 to 1965) unit : hours/month
Jan. Feb. March April May June July Aug. Sept. Oct. Nov. Dec. Total 263 246 255 209 162 135 147 147 148 147 143 208 2,210
a.6 Landfill Amount
When the new landfill starts its operation from the year 2006, the expected final disposal
amount by the year 2015 is estimated in the following table.
Table K-11: Prospect of Required Landfill Volume and Construction Plan unit : m3
2006 2007 2008 2009 2010 2011 2012 2013 2014 2015
Waste volume 470,385 957,627 1,458,540 1,974,352 2,503,536 3,047,121 3,605,239 4,179,252 4,769,424 5,376,784
Cover soil volume 94,077 191,525 291,708 394,870 500,707 609,424 721,048 835,851 953,885 1,075,357
Total 564,462 1,149,152 1,750,248 2,369,222 3,004,243 3,656,545 4,326,287 5,015,103 5,723,309 6,452,141
*Required volume of Etapa 3 286,462 871,152 1,472,248 2,091,222 2,726,243 3,378,545 4,048,287 4,737,103 5,445,309 6,174,141
Service period Phase 1 Phase 2 Phase 3 Phase 4
Available volume 1,300,000 m3 1,200,000 m3 1,100,000 m3 2,800,000 m3
Total available volume 1,300,000 m3 2,500,000 m3 3,600,000 m3 6,400,000 m3
notes : *assumed Etapa 2 remaining volume of end year 2006 is about 278,000 m3
b. Conceptual Design
b.1 Landfill Site
b.1.1 Site Development Plan
Basic Concept
The planed landfill capacity is about 6.4 million m3. Possible development area is about 26 ha
with taking into account 50 m width of a buffer zone along the river. The landfill will have a
maintenance road at its periphery. Consequently, an area to be used for a landfill is about 20
ha.

The Study on Solid Waste Management Plan for JICA Municipality of Panama in the Republic of Panama KOKUSAI KOGYO CO., LTD.
K-17
A layout plan and a land reclamation plan are formulated based on the basic concept shown
in Table K-12 with taking into account of examples in Japan and safety. Due to the land
features of the site, there are some points where 50 m of buffer zone from the river cannot be
achieved. In such points, it is aimed at securing 30m at least.
Table K-12: Basic Concept of Site Development Plan
Item Descriptions Internal road width :10.0m Access road width : 10.0 m, maximum vertical slope : 8.000% Access road for leachate treatment facilities
width : 6.0 m, maximum vertical slope : 8.000%
Cut slope grade 1:2 Bank slope grade 1:3 Slope grade in the landfill site 1:2, width of scarcement : 2.0m Landfill slope grade 1:3, width of scarcement : 2.5m Elongation from river norm :50 m, minimum : 30 m
Site Development Plan
The landfill construction is divided in three phases as shown in Figure K-10. Phase 1 is the
southern part, Phase 2 is the northwestern part and Phase 3 is the northeastern part. The depth
of the landfill is set at 10 m. Waste will be raised up to 80 masl at each phase. Then, the three
areas will be combined and the height will reach at 110 masl as Phase 4. Capacities of
respective those phases are shown Table K-13, which are estimated based on a map of 1 in
2,500.
Table K-13: Prospective Landfill Amount
Phase Landfill amount (m3) Phase 1 1,300,000 Phase 2 1,200,000 Phase 3 1,100,000 Phase 4 2,800,000
Total 6,400,000

The Study on Solid Waste Management Plan for JICA Municipality of Panama in the Republic of Panama KOKUSAI KOGYO CO., LTD.
K-18
Figure K-10: Zoning Plan for Site Development
Phase 1
Phase 2 Phase 3
Leachatetreatment
River short cut

The Study on Solid Waste Management Plan for JICA Municipality of Panama in the Republic of Panama KOKUSAI KOGYO CO., LTD.
K-19
Earth Wok Plan
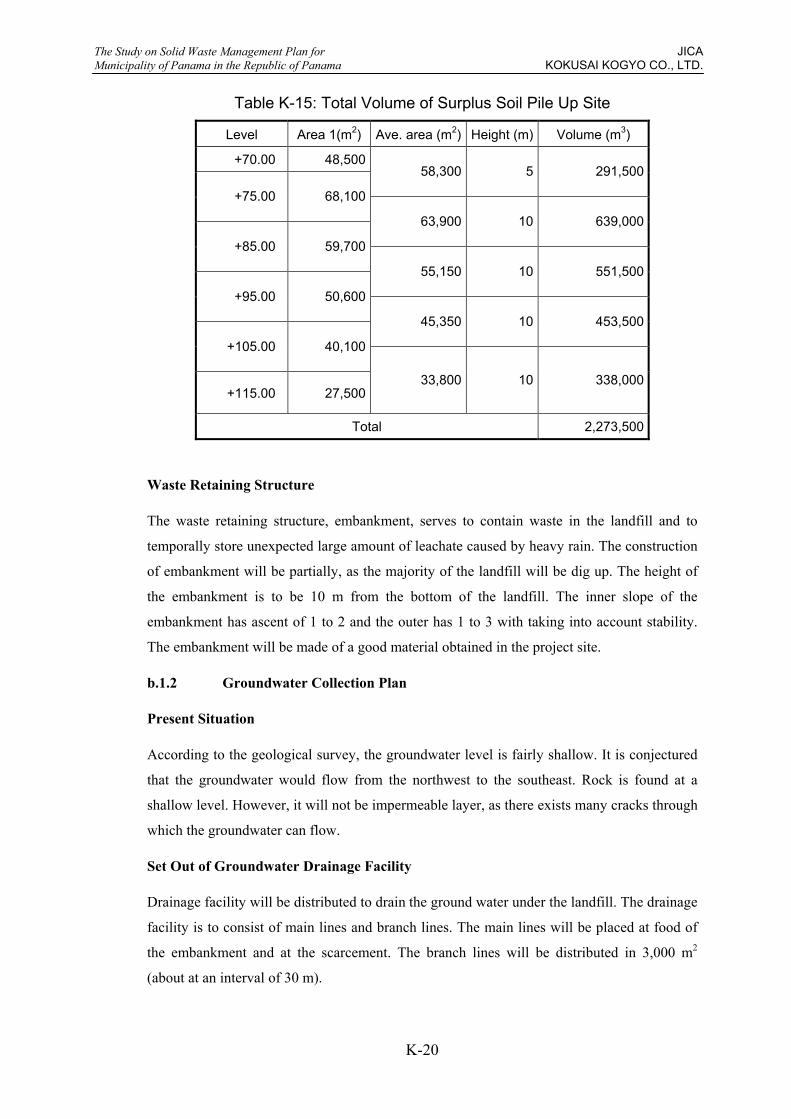
Table K-14 shows required earthwork. The huge earthwork in Phase 2 and 3 will be
unavoidable in order to obtain enough capacity of landfill. If the excess soil will be used for
about 1.4 million of cover material, the remains will be about 2.1 million. The northern area
next to the project site has capacity to receive 2.2 million of soil (See Figure K-11).
Table K-14: Earth Work Volume
Cut volume (m3) Embankment volume (m3) Balance (m3) (cut – embankment)
Phase 1 406,000 15,000 391,000Phase 2 1,973,000 4,000 1,969,000Phase 3 1,192,000 26,000 1,166,000Phase 4 0 1,000 -1,000
Total 3,571,000 46,000 3,525,000
Figure K-11: Surplus Soil Pile Up Site
658
000
1 002 000
+70.00+115.00
Surplus soil pile up site(12 ha, 2,200,000 m3)
The Study on Solid Waste Management Plan for JICA Municipality of Panama in the Republic of Panama KOKUSAI KOGYO CO., LTD.
K-20
Table K-15: Total Volume of Surplus Soil Pile Up Site
Level Area 1(m2) Ave. area (m2) Height (m) Volume (m3)
+70.00 48,50058,300 5 291,500
+75.00 68,100
63,900 10 639,000
+85.00 59,700
55,150 10 551,500
+95.00 50,600
45,350 10 453,500
+105.00 40,100
+115.00 27,50033,800 10 338,000
Total 2,273,500
Waste Retaining Structure
The waste retaining structure, embankment, serves to contain waste in the landfill and to
temporally store unexpected large amount of leachate caused by heavy rain. The construction
of embankment will be partially, as the majority of the landfill will be dig up. The height of
the embankment is to be 10 m from the bottom of the landfill. The inner slope of the
embankment has ascent of 1 to 2 and the outer has 1 to 3 with taking into account stability.
The embankment will be made of a good material obtained in the project site.
b.1.2 Groundwater Collection Plan
Present Situation
According to the geological survey, the groundwater level is fairly shallow. It is conjectured
that the groundwater would flow from the northwest to the southeast. Rock is found at a
shallow level. However, it will not be impermeable layer, as there exists many cracks through
which the groundwater can flow.
Set Out of Groundwater Drainage Facility
Drainage facility will be distributed to drain the ground water under the landfill. The drainage
facility is to consist of main lines and branch lines. The main lines will be placed at food of
the embankment and at the scarcement. The branch lines will be distributed in 3,000 m2
(about at an interval of 30 m).

The Study on Solid Waste Management Plan for JICA Municipality of Panama in the Republic of Panama KOKUSAI KOGYO CO., LTD.
K-21
Structure of Groundwater Drainage Facility
Structure of the groundwater drainage facility is shown in Figure K-12. The structure is
designed based on case examples in Japan. Perforated polymer pipes are to be surrounded by
crushed stones. The main line has a diameter of 300 mm. The branch line is 200 mm, which
can avoid to block up with soil.
Figure K-12: Cross Section of Ground Water Drainage
b.1.3 Leachate Management Plan
b.1.3.1 Seepage Control Plan
The basic layer at the project site is rock. The rock has many cracks and it is conjectured that
the groundwater will flow through the cracks as aforementioned. Even though the rock itself
has high impermeability, the layer as a whole should be regarded as permeable. Therefore,
seepage control is to be planned in order to avoid contamination of groundwater with
leachate.
There are two type of seepage control. One is construction of vertical impervious wall, which
can be applied when an impermeable layer exists clearly. The other is surface lining, which
covers whole surface of bottom of landfill with impermeable material. According to the
geological condition, the surface lining is recommendable.
900100
600
1600
1000
Main line
Crushed rock
500
500
Branch line
Crushed rock
Holed syntheticresin pipe200 mm
Holedsynthetic resin
pipe300 mm

The Study on Solid Waste Management Plan for JICA Municipality of Panama in the Republic of Panama KOKUSAI KOGYO CO., LTD.
K-22
Synthetic liner is commonly used as impermeable liner. The liner is not thick, then, it could
be damaged by improper manner. Major causes that possibly damage the liner are
summarized in Table K-16.
Table K-16: Major Causes of Synthetic Liner Damage
Item Trigger Ground salience, round settlement, ground depression, etc. Ground water up lifting, etc. Landfill work scratching of landfill equipment, etc. Waste keen-edged waste, live load of waste Climate ultraviolet degradation, thermal stress, stress cracking, etc. Installation scratching of construction equipment, joint defects, etc.
Major causes to damage the liner are physical stress from above. In order to avoid that the
liner is damaged, the liner is to be protected enough thickness of soil and geotextile.
Consequently, a surface lining system presented in Figure K-13 is designed.
Figure K-13: Seepage Control Lining System
Protection soil (500 mm)
Upper protector (10 mm geotextilewith reinforcing material)
Bottom Geotextile (10mm)
Synthetic liner (HDPE 1.5 mm)Sand layer
Natural ground
Waste
The Study on Solid Waste Management Plan for JICA Municipality of Panama in the Republic of Panama KOKUSAI KOGYO CO., LTD.
K-23
b.1.3.2 Leachate Collection
Leachate Runoff Amount
Leachate has to be drained immediately so as not to hamper landfill operation. Meanwhile,
leachate will not seep from the damaged part of the lining system, if there is no leachate
stored in the landfill. Therefore, the leachate collection system should have enough capacity
to drain the leachate immediately. Design leachate runoff amount is computed by the rational
formula, where the same amount of leachate as rainfall will be drained immediately.
Q=1/360×c×r×A where ;
Q : leachate runoff amount (m3/sec) c : runoff rate r : rainfall intensity (mm/hour) A : catchments area (hectare)
Runoff rate
Between 0.6 and 0.7 is commonly used as runoff rate, “c.” In order to shorten retention time
of leachate in the landfill, 0.7 is applied for “c.”
Rainfall intensity
The probability precipitation in two years of 65 mm/hr is to be used, which was obtained
from Panama Canal Authority.
Catchment area
Landfill areas of respective phases are regarded as catchment areas.
Arrangement of collection pipe
Collection pipes consist of main lines and branch lines. Main lines are to be placed at centers
of landfills and branch lines are distributed in every 3,000 m2 (about an interval of 30 m).
Size of collection pipe
Perforated polymer pipes will be used as collection pipes. Size of pipes is to be decided based
on computation by means of Manning Formula. It is assumed that whole cross section area is
to be used in the computation.
The Study on Solid Waste Management Plan for JICA Municipality of Panama in the Republic of Panama KOKUSAI KOGYO CO., LTD.
K-24
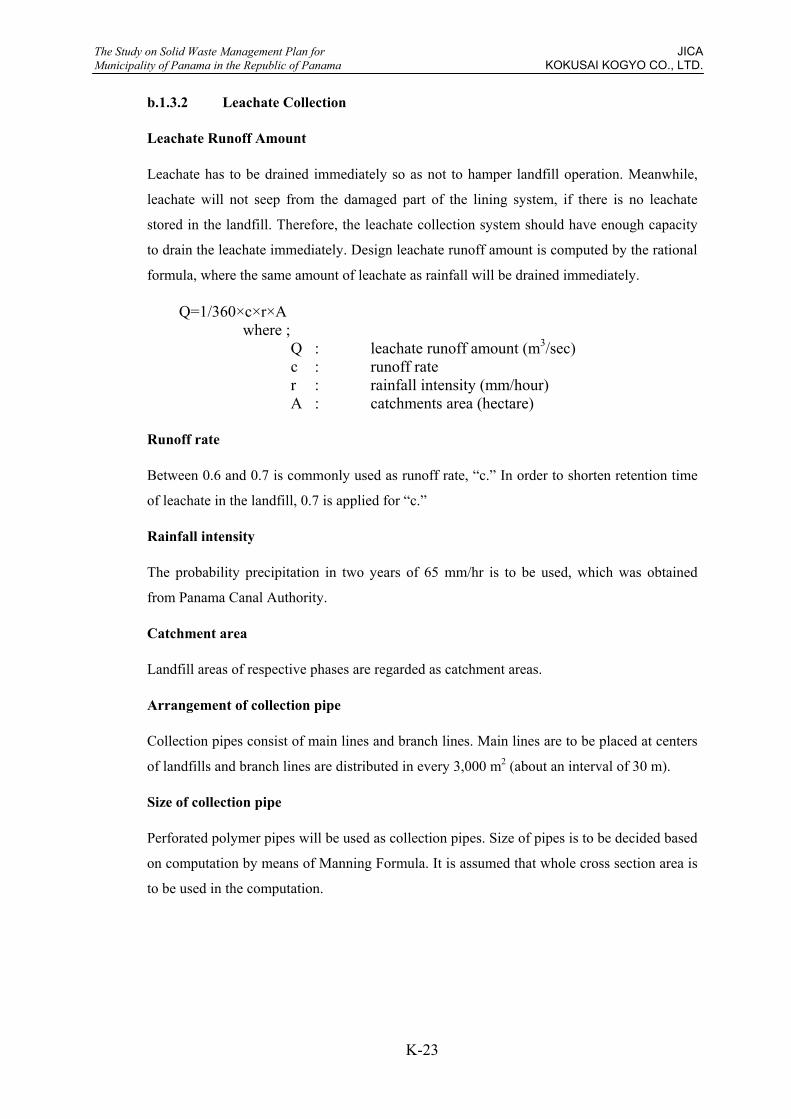
Table K-17: Flow Calculation Table for Leachate Collection System
b.1.4 Rainwater Drainage Plan
Rainwater Runoff Amount
The rational formula is also applied to obtain design rainwater runoff amount.
Q=1/360×f×r×A
where ; Q : rainwater runoff amount (m3/sec) f : runoff rate r : rainfall intensity (mm/hour) A : catchments area (hectare) Runoff rate
Runoff rate, “f,” is depending on surface conditions of catchment area. Characteristics of the
rainwater catchment area are hilly and vegetated. Therefore, 0.6 is applied for “f” according
to Table K-18.
Table K-18: Runoff Ratio for Peak Flow
Topographic features fp Precipitous terrain 0.75~0.90 Rolling hill and/or forest 0.50~0.75 Agricultural land 0.45~0.60 source: Japan Society of Civil Engineers,1999
Catchments area
Runoff rate
rainfall intensity
Leachate amount
Size of pipe
Inclination Roughness Velocity Allowable flow Network
number (ha) - (mm/hr) (m3/sec) (mm) (%) - (m/sec) (m3/sec)
Remarks
Main line
Phase 1
1 6.87 0.7 65 0.868 φ700 0.811 0.012 2.348 0.904
Phase 2
2 6.47 0.7 65 0.818 φ700 1.304 0.012 2.977 1.146
Phase 3
3 6.30 0.7 65 0.796 φ700 1.200 0.012 2.856 1.099
Phase 4
4 7.36 0.7 65 0.930 φ800 0.627 0.012 2.257 1.134 to No. 6
5 2.69 0.7 65 0.340 φ500 0.748 0.012 1.802 0.354 to No. 6
6 13.08 0.7 65 1.653 φ900 0.748 0.012 2.666 1.696
Branch line
Common 0.30 0.7 65 0.038 φ200 1.200 0.012 1.239 0.039
The Study on Solid Waste Management Plan for JICA Municipality of Panama in the Republic of Panama KOKUSAI KOGYO CO., LTD.
K-25
Rainfall intensity
The probability precipitation in two years of 65 mm/hr is to be used, which was obtained
from Panama Canal Authority.
Catchments area
Catchment area will change according to progress of landfilling, e.g., the area will be the
largest at completion of Phase 4. Drainage ditches are designed based on the largest
catchment area.
Drainage system
Trapezoid drainage ditch with concrete pavement will be employed. Size of drainage ditches
is computed by means of Manning Formula with 20% of depth of freeboard.
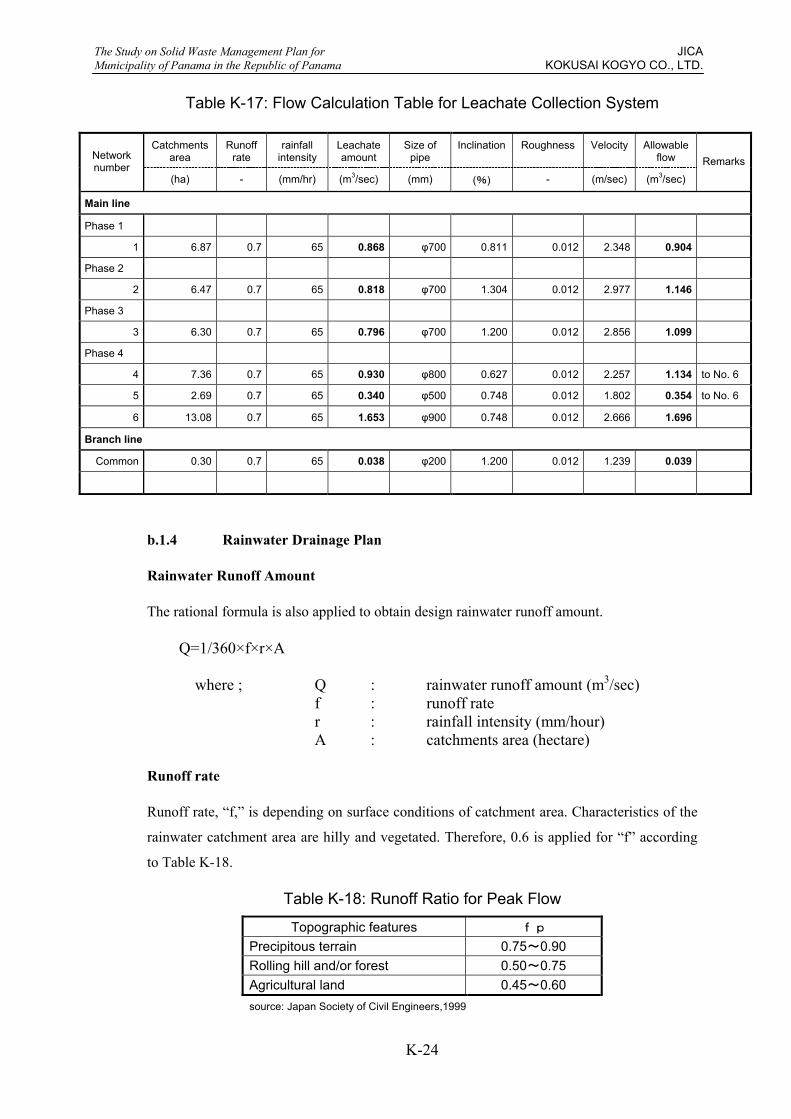
Table K-19: Flow Calculation Table for Rainwater Drainage System Catchments
area Runoff
rate rainfall
intensity Discharge
amount Channel section Inclination Roughness Velocity Allowable flow
Network number
(ha) - (mm/hr) (m3/sec) Top width(mm)
Bottom width
(mm)
Depth(mm) (%) - (m/sec) (m3/sec)
Remarks
Phase 1 1 17.0 0.6 65 1.842 1700 500 1200 0.483 0.015 1.795 0.379 2 23.5 0.6 65 2.546 1700 500 1200 1.953 0.015 2.419 1.269 3 2.4 0.6 65 0.260 900 500 400 0.748 0.015 2.500 1.548 4 9.8 0.6 65 1.062 1300 500 800 0.748 0.015 4.731 3.909 5 11.5 0.6 65 1.246 1400 500 900 0.721 0.015 3.485 2.217
6 35.3 0.6 65 3.824 1700 500 1200 2.000 0.015 2.416 1.537
discharge to river, energy absorbed by stairs structure
Cross over structure 1 17.0 0.6 65 1.842 φ900 1.500 0.013 1.795 0.379 Inlet
Cross over structure 2 11.5 0.6 65 1.246 φ900 0.721 0.013 2.419 1.269
Internal road of leachate treatment facility
Phase 2 7 9.6 0.6 65 1.040 1200 500 700 1.053 0.015 2.710 1.184 8 2 0.6 65 0.217 800 500 300 1.622 0.015 2.328 0.346 9 5.6 0.6 65 0.607 1100 500 600 0.627 0.015 1.957 0.695
Cross over structure 3 2.4 0.6 65 0.260 φ500 0.748 0.013
1.663 0.327connect to No.3 of Phase 1
Phase 3
10 3.4 0.6 65 0.368 900 500 400 1.163 0.015 2.239 0.473 discharge to river
11 4.2 0.6 65 0.455 1000 500 500 0.699 0.015 1.911 0.535
12 4.3 0.6 65 0.466 1000 500 500 2.000 0.015 3.233 0.905
discharge to river, energy absorbed by stairs structure
13 2.2 0.6 65 0.238 900 500 400 0.769 0.015 1.820 0.384 Cross over structure 4 9.8 0.6 65 1.062 φ800 0.700 0.013 2.201 1.106 connect to No.4
of Phase 1
The Study on Solid Waste Management Plan for JICA Municipality of Panama in the Republic of Panama KOKUSAI KOGYO CO., LTD.
K-26
b.2 Leachate Treatment System
b.2.1 Treatment Amount
Leachate amount will change depending on precipitation and evaporation. Rain season is
distinctly different from dry season in the study area, where the most of rainfalls happen in
the rain season. In this case, it is not economical to design leachate treatment facilities based
on the maximum rainfall. In order to avoid this uneconomical case, there is a manner to
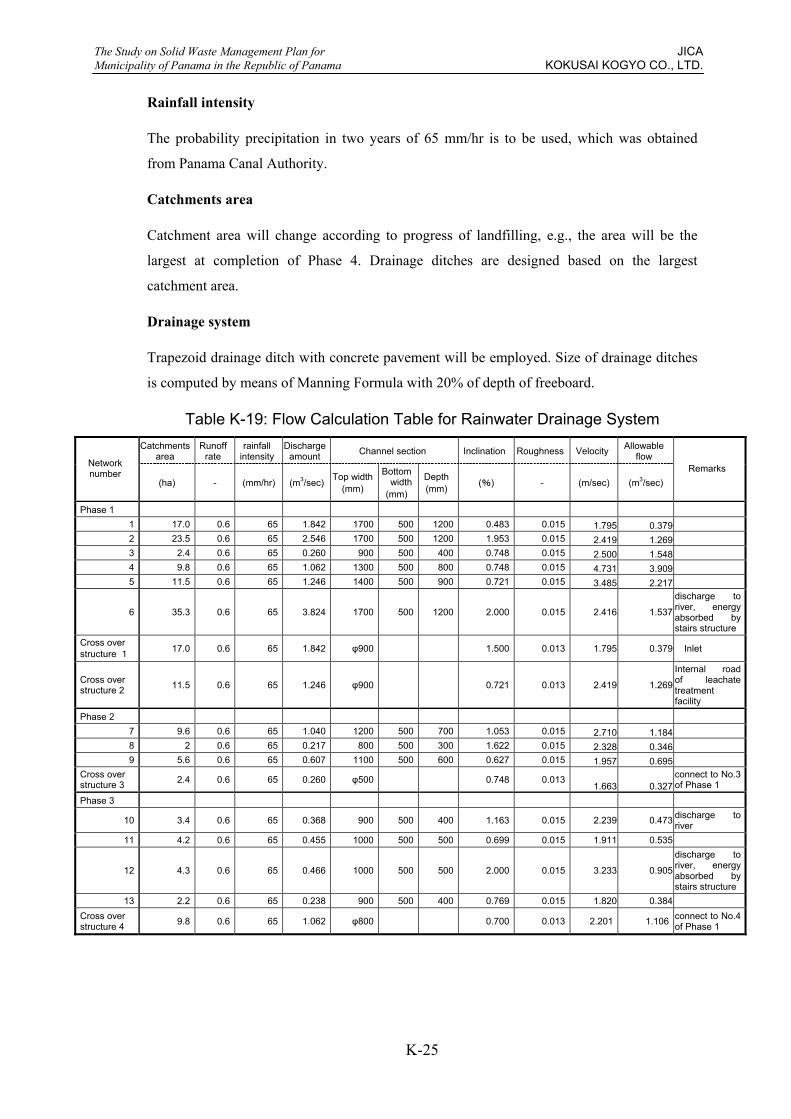
construct a regulation pond to average the leachate amount to be treated. Figure K-14 shows
concept of the manner. This manner lowers the design capacity of the facilities and reduces
costs, but also makes operation easy as the leachate amount will be stable.
Figure K-14: Concept of Maximum and Average Leachate Generation Amount
Required Leachate Regulation and Treatment Amount
Leachate amount is depending on precipitation and evaporation. Required capacity of
leachate treatment facilities is subject to capacity of a regulation pond. Figure K-15 shows
this concept.
Leac
hate
am
ount
Jan.MayFeb.
Rain seasonDry season
Leachate generation amount
Max
imum
leac
hate
am
ount
Aver
age
leac
hate
amou
nt

The Study on Solid Waste Management Plan for JICA Municipality of Panama in the Republic of Panama KOKUSAI KOGYO CO., LTD.
K-27
Figure K-15: Concept of Leachate Regulation and Treatment Amount
Leachate amount is computed by means of the following formula.
( )000,1
2211 ACACIQ ×+×=
where ;
I : Rainfall intensity (mm/day) Q : Leachate generation amount (m3/day) C1 : Infiltration coefficient for landfill operation area A1 : Landfill operation area (m2) C2 : Infiltration coefficient for closed landfill area A2 : Closed landfill area (m2)
IMETC /11 −=
where; ET : Monthly possible evaporation amount (mm) (ET=0.7Et) Et : Monthly evaporation amount (mm)
tjCjKEt ×××= 245.0 ∑ ×
=100dj
djCj
where; dj : Monthly sunshine hour (hour) tj : Monthly average air temperature (Fahrenheit)
Landfill site
Regulation pond Leachate treatmentfacility
Constant flow
Q1
Q2 Q2
Discharge to river
Rainfall
Evaporation
Not constant flow (dependedon rainfall / evaporation, etc.)

The Study on Solid Waste Management Plan for JICA Municipality of Panama in the Republic of Panama KOKUSAI KOGYO CO., LTD.
K-28
Infiltration coefficient
Table K-20, Table K-21 and Table K-22 present infiltration coefficients, c1 and c2, obtained
based on meteorological data at respective stations.
Table K-20: Infiltration Coefficient at Gamboa tj (F) dj (hr) Cj (%) Et (mm) ET (mm) I (mm/month) C1 C2
Jan. 78.6 252 10.6 127.0 88.9 50.0 -0.78 -0.47Feb. 79.2 240 10.1 121.9 85.3 16.5 -4.17 -2.5March 79.7 269 11.3 137.3 96.1 25.9 -2.71 -1.63April 80.8 243 10.2 125.6 87.9 87.9 0 0May 80.2 189 8.0 97.8 68.5 250.4 0.73 0.44June 79.3 157 6.6 79.8 55.9 267.2 0.79 0.47July 79.0 160 6.7 80.7 56.5 227.1 0.75 0.45Aug. 79.2 159 6.7 80.9 56.6 251.5 0.77 0.46Sept. 78.6 174 7.3 87.4 61.2 306.8 0.8 0.48Oct. 78.4 167 7.0 83.6 58.5 293.9 0.8 0.48Nov. 77.9 151 6.4 76.0 53.2 294.1 0.82 0.49Dec. 78.3 210 8.9 106.2 74.3 145.8 0.49 0.29Average 79.1 197.583 8.317 100.35 70.242 184.8 -0.14 -0.09
Table K-21: Infiltration Coefficient at PMG tj (F) dj (hr) Cj (%) Et (mm) ET (mm) I (mm/month) C1 C2
Jan. 79.7 263 11.9 144.5 101.2 38.5 -1.63 -0.98Feb. 80.6 246 11.1 136.3 95.4 13.5 -6.07 -3.64March 81.1 255 11.5 142.1 99.5 24.3 -3.09 -1.85April 81.9 209 9.5 118.6 83.0 87.4 0.05 0.03May 80.6 162 7.3 89.7 62.8 251.0 0.75 0.45June 79.9 135 6.1 74.3 52.0 259.9 0.80 0.48July 79.9 147 6.7 81.6 57.1 241.7 0.76 0.46Aug. 79.3 147 6.7 81.0 56.7 241.7 0.77 0.46Sept. 79.0 148 6.7 80.7 56.5 242.8 0.77 0.46Oct. 79.0 147 6.7 80.7 56.5 300.8 0.81 0.49Nov. 78.4 143 6.5 77.7 54.4 270.9 0.80 0.48Dec. 79.0 208 9.4 113.2 79.2 111.8 0.29 0.17Average 79.9 184.167 8.342 101.7 71.192 173.7 -0.42 -0.25
Table K-22: Infiltration Coefficient at B AFF tj (F) dj (hr) Cj (%) Et (mm) ET (mm) I (mm/month) C1 C2
Jan. 79.7 263 11.9 144.5 101.2 50.8 -0.99 -0.59Feb. 80.6 246 11.1 136.3 95.4 26.7 -2.57 -1.54March 81.1 255 11.5 142.1 99.5 39.6 -1.51 -0.91April 81.9 209 9.5 118.6 83 58.2 -0.43 -0.26May 80.6 162 7.3 89.7 62.8 292.9 0.79 0.47June 79.9 135 6.1 74.3 52.0 276.6 0.81 0.49July 79.9 147 6.7 81.6 57.1 216.7 0.74 0.44Aug. 79.3 147 6.7 81.0 56.7 183.9 0.69 0.41Sept. 79.0 148 6.7 80.7 56.5 269.0 0.79 0.47Oct. 79.0 147 6.7 80.7 56.5 288.8 0.80 0.48Nov. 78.4 143 6.5 77.7 54.4 287.5 0.81 0.49Dec. 79.0 208 9.4 113.2 79.2 158.2 0.50 0.30Average 79.9 184.167 8.342 101.7 71.192 179.1 0.04 0.02
The Study on Solid Waste Management Plan for JICA Municipality of Panama in the Republic of Panama KOKUSAI KOGYO CO., LTD.
K-29
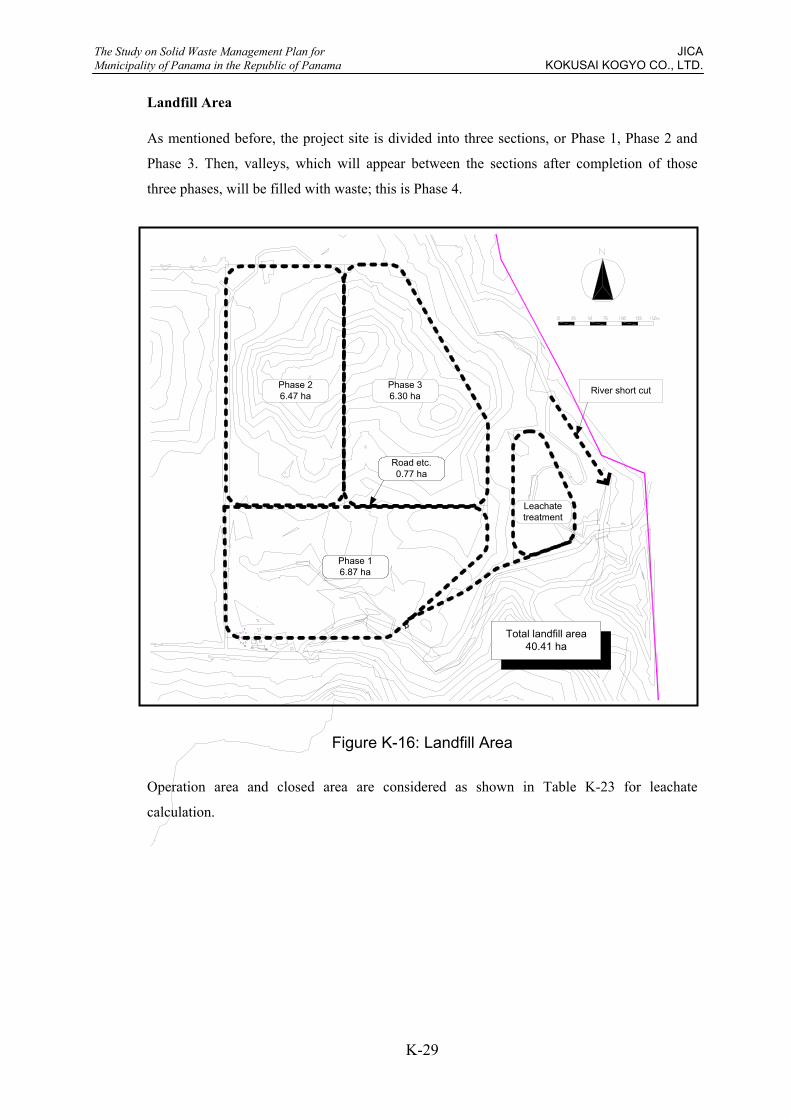
Landfill Area
As mentioned before, the project site is divided into three sections, or Phase 1, Phase 2 and
Phase 3. Then, valleys, which will appear between the sections after completion of those
three phases, will be filled with waste; this is Phase 4.
Figure K-16: Landfill Area Operation area and closed area are considered as shown in Table K-23 for leachate
calculation.
Phase 16.87 ha
Phase 26.47 ha
Phase 36.30 ha
Leachatetreatment
River short cut
Road etc.0.77 ha
Total landfill area40.41 ha
The Study on Solid Waste Management Plan for JICA Municipality of Panama in the Republic of Panama KOKUSAI KOGYO CO., LTD.
K-30
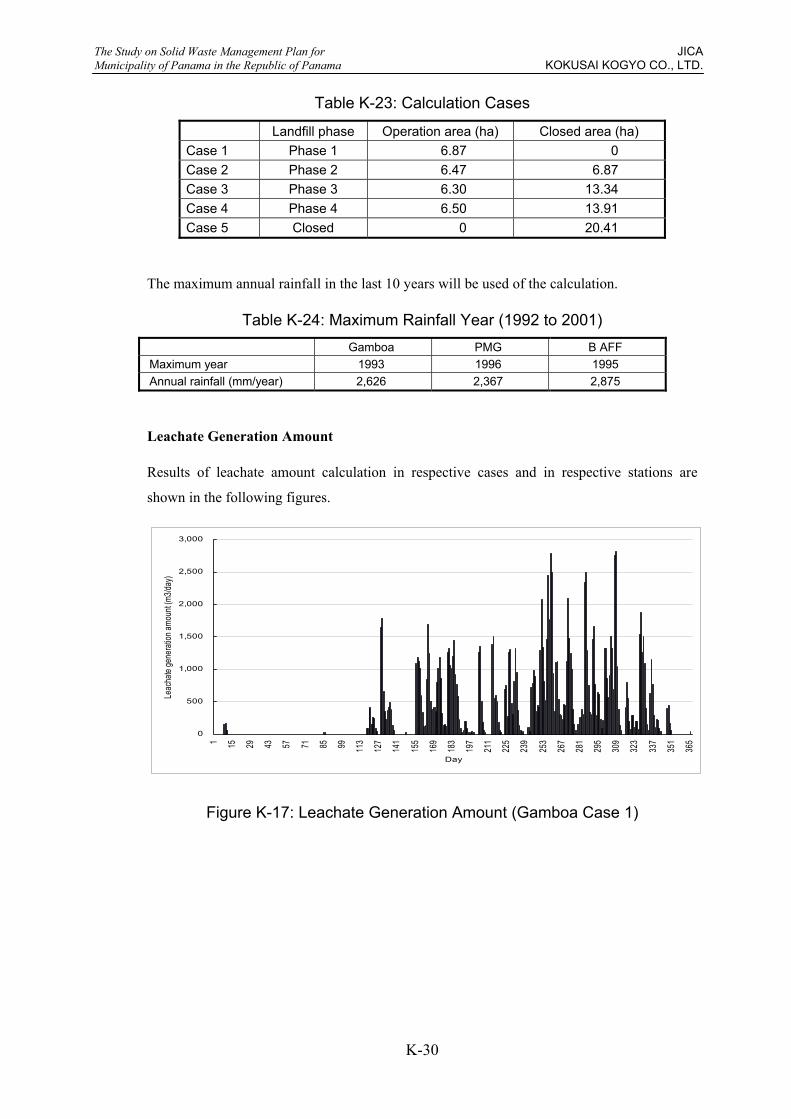
Table K-23: Calculation Cases
Landfill phase Operation area (ha) Closed area (ha) Case 1 Phase 1 6.87 0 Case 2 Phase 2 6.47 6.87 Case 3 Phase 3 6.30 13.34 Case 4 Phase 4 6.50 13.91 Case 5 Closed 0 20.41
The maximum annual rainfall in the last 10 years will be used of the calculation.
Table K-24: Maximum Rainfall Year (1992 to 2001) Gamboa PMG B AFF Maximum year 1993 1996 1995 Annual rainfall (mm/year) 2,626 2,367 2,875
Leachate Generation Amount
Results of leachate amount calculation in respective cases and in respective stations are
shown in the following figures.
0
500
1,000
1,500
2,000
2,500
3,000
1 15 29 43 57 71 85 99 113
127
141
155
169
183
197
211
225
239
253
267
281
295
309
323
337
351
365
Day
Leac
hate
gene
ratio
n amo
unt (m
3/day
)
Figure K-17: Leachate Generation Amount (Gamboa Case 1)

The Study on Solid Waste Management Plan for JICA Municipality of Panama in the Republic of Panama KOKUSAI KOGYO CO., LTD.
K-31
0
500
1,000
1,500
2,000
2,500
3,000
3,500
1 15 29 43 57 71 85 99 113
127
141
155
169
183
197
211
225
239
253
267
281
295
309
323
337
351
365
Day
Leac
hate
gene
ratio
n amo
unt (m
3/day
)
Figure K-18: Leachate Generation Amount (Gamboa Case 2)
0
500
1,000
1,500
2,000
2,500
3,000
3,500
1 15 29 43 57 71 85 99 113
127
141
155
169
183
197
211
225
239
253
267
281
295
309
323
337
351
365
Day
Leac
hate
gene
ratio
n amo
unt (m
3/day
)
Figure K-19: Leachate Generation Amount (Gamboa Case3)

The Study on Solid Waste Management Plan for JICA Municipality of Panama in the Republic of Panama KOKUSAI KOGYO CO., LTD.
K-32
0
500
1,000
1,500
2,000
2,500
3,000
3,500
4,000
1 15 29 43 57 71 85 99 113
127
141
155
169
183
197
211
225
239
253
267
281
295
309
323
337
351
365
Day
Leac
hate
gene
ration
amou
nt (m
3/day
)
Figure K-20: Leachate Generation Amount (Gamboa Case 4)
0
200
400
600
800
1,000
1,200
1,400
1 15 29 43 57 71 85 99 113
127
141
155
169
183
197
211
225
239
253
267
281
295
309
323
337
351
365Day
Leac
hate
gene
ration
amou
nt (m
3/day
)
Figure K-21: : Leachate Generation Amount (Gamboa Case 5)
The Study on Solid Waste Management Plan for JICA Municipality of Panama in the Republic of Panama KOKUSAI KOGYO CO., LTD.
K-33
0
500
1,000
1,500
2,000
2,500
3,000
3,500
1 15 29 43 57 71 85 99 113
127
141
155
169
183
197
211
225
239
253
267
281
295
309
323
337
351
365
Day
Leac
hate
gene
ration
amou
nt (m
3/day
)
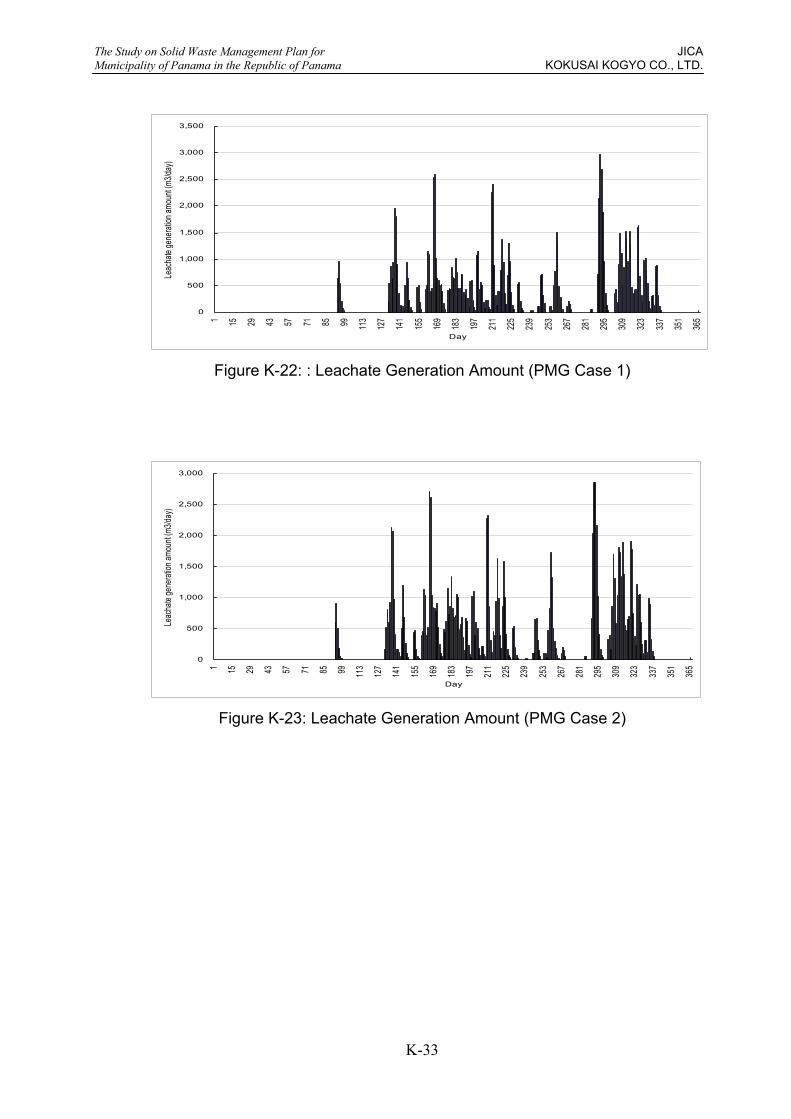
Figure K-22: : Leachate Generation Amount (PMG Case 1)
0
500
1,000
1,500
2,000
2,500
3,000
1 15 29 43 57 71 85 99 113
127
141
155
169
183
197
211
225
239
253
267
281
295
309
323
337
351
365
Day
Leac
hate
gene
ration
amou
nt (m
3/day
)
Figure K-23: Leachate Generation Amount (PMG Case 2)
The Study on Solid Waste Management Plan for JICA Municipality of Panama in the Republic of Panama KOKUSAI KOGYO CO., LTD.
K-34
0
500
1,000
1,500
2,000
2,500
3,000
3,500
1 15 29 43 57 71 85 99 113
127
141
155
169
183
197
211
225
239
253
267
281
295
309
323
337
351
365
Day
Leac
hate
gene
ration
amou
nt (m
3/day
)
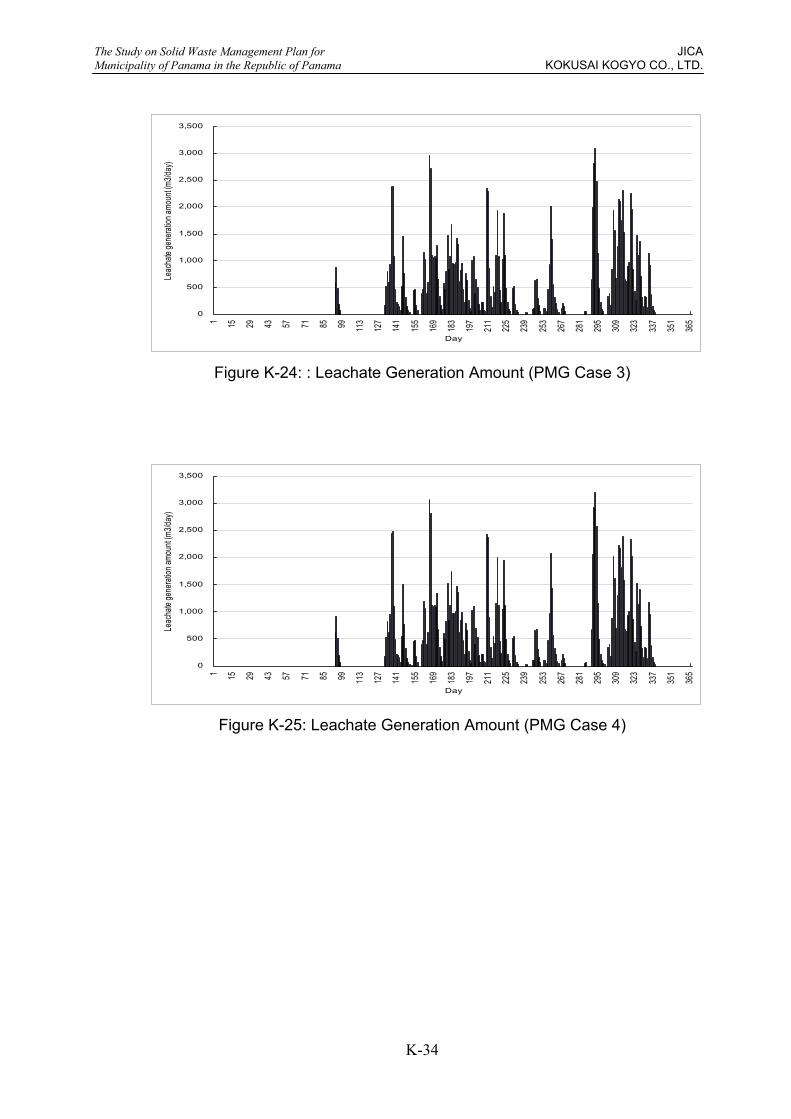
Figure K-24: : Leachate Generation Amount (PMG Case 3)
0
500
1,000
1,500
2,000
2,500
3,000
3,500
1 15 29 43 57 71 85 99 113
127
141
155
169
183
197
211
225
239
253
267
281
295
309
323
337
351
365Day
Leac
hate
gene
ration
amou
nt (m
3/day
)
Figure K-25: Leachate Generation Amount (PMG Case 4)

The Study on Solid Waste Management Plan for JICA Municipality of Panama in the Republic of Panama KOKUSAI KOGYO CO., LTD.
K-35
0
200
400
600
800
1,000
1,200
1,400
1,600
1 15 29 43 57 71 85 99 113
127
141
155
169
183
197
211
225
239
253
267
281
295
309
323
337
351
365
Day
Leac
hate
gene
ration
amou
nt (m
3/day
)
Figure K-26: : Leachate Generation Amount (PMG Case 5)
0
1,000
2,000
3,000
4,000
5,000
6,000
7,000
8,000
1 15 29 43 57 71 85 99 113
127
141
155
169
183
197
211
225
239
253
267
281
295
309
323
337
351
365
Day
Leac
hate
gene
ration
amou
nt (m
3/day
)
Figure K-27: Leachate Generation Amount (B AFF Case 1)
The Study on Solid Waste Management Plan for JICA Municipality of Panama in the Republic of Panama KOKUSAI KOGYO CO., LTD.
K-36
0
1,000
2,000
3,000
4,000
5,000
6,000
7,000
1 15 29 43 57 71 85 99 113
127
141
155
169
183
197
211
225
239
253
267
281
295
309
323
337
351
365
Day
Leac
hate
gene
ration
amou
nt (m
3/day
)
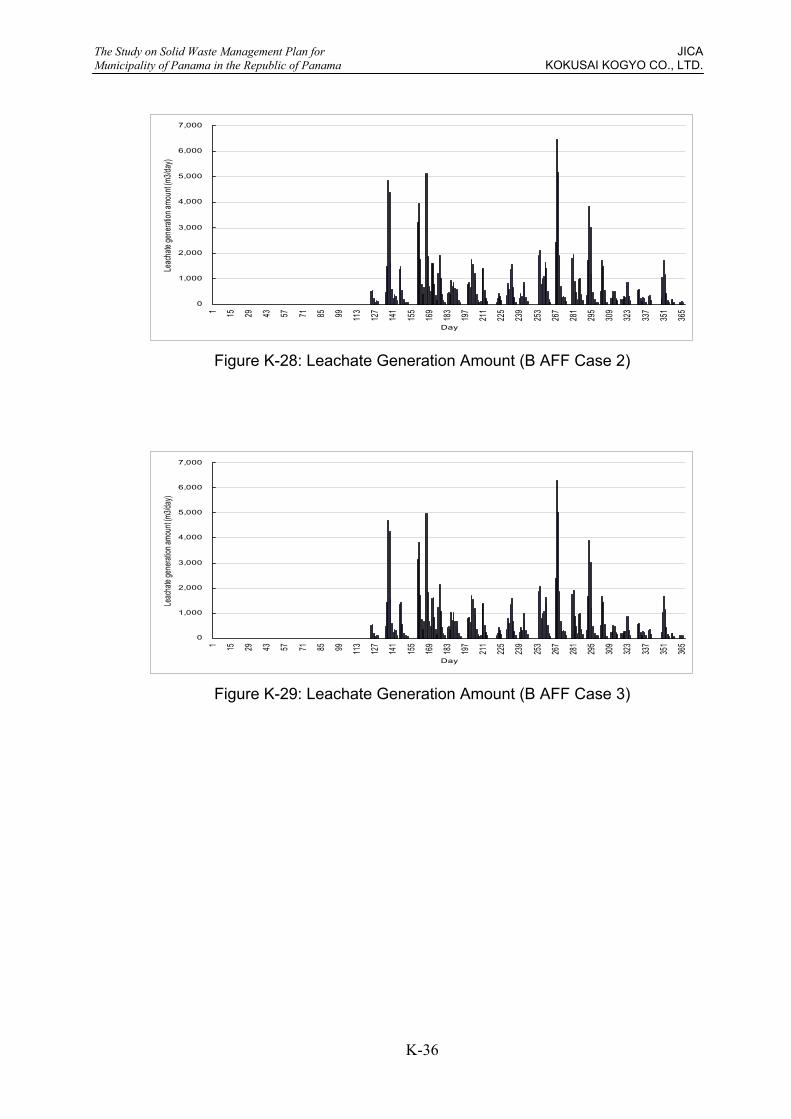
Figure K-28: Leachate Generation Amount (B AFF Case 2)
0
1,000
2,000
3,000
4,000
5,000
6,000
7,000
1 15 29 43 57 71 85 99 113
127
141
155
169
183
197
211
225
239
253
267
281
295
309
323
337
351
365
Day
Leac
hate
gene
ration
amou
nt (m
3/day
)
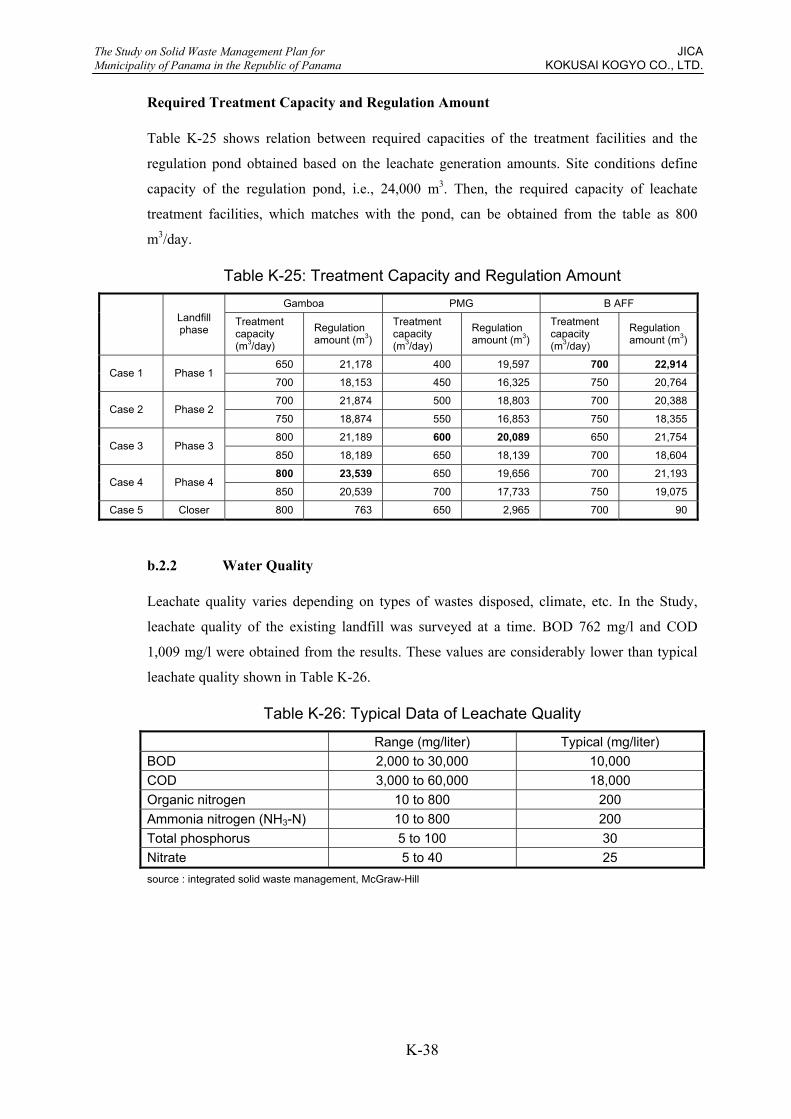
Figure K-29: Leachate Generation Amount (B AFF Case 3)

The Study on Solid Waste Management Plan for JICA Municipality of Panama in the Republic of Panama KOKUSAI KOGYO CO., LTD.
K-37
0
1,000
2,000
3,000
4,000
5,000
6,000
7,000
1 15 29 43 57 71 85 99 113
127
141
155
169
183
197
211
225
239
253
267
281
295
309
323
337
351
365
Day
Leac
hate
gene
ration
amou
nt (m
3/day
)
Figure K-30: Leachate Generation Amount (B AFF Case 4)
0
100
200
300
400
500
600
700
800
900
1 15 29 43 57 71 85 99 113
127
141
155
169
183
197
211
225
239
253
267
281
295
309
323
337
351
365
Day
Leac
hate
gene
ration
amou
nt (m
3/day
)
Figure K-31: Leachate Generation Amount (B AFF Case 5)
The Study on Solid Waste Management Plan for JICA Municipality of Panama in the Republic of Panama KOKUSAI KOGYO CO., LTD.
K-38
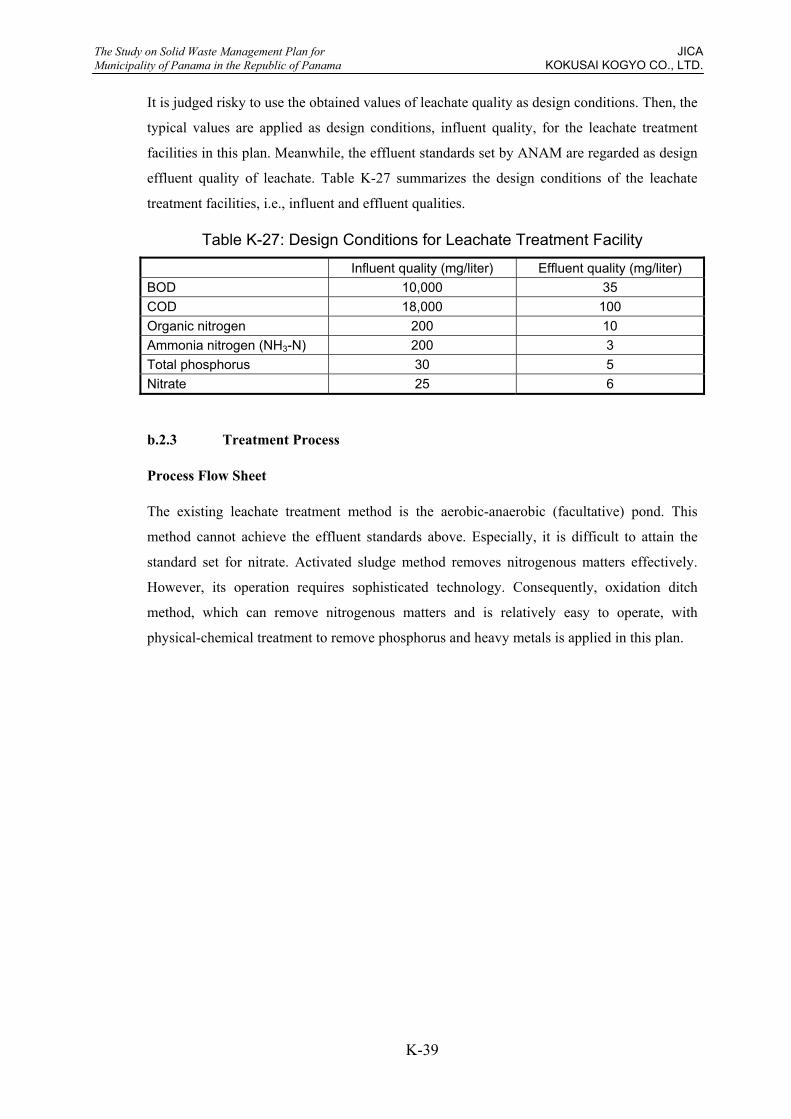
Required Treatment Capacity and Regulation Amount
Table K-25 shows relation between required capacities of the treatment facilities and the
regulation pond obtained based on the leachate generation amounts. Site conditions define
capacity of the regulation pond, i.e., 24,000 m3. Then, the required capacity of leachate
treatment facilities, which matches with the pond, can be obtained from the table as 800
m3/day.
Table K-25: Treatment Capacity and Regulation Amount Gamboa PMG B AFF
Landfill phase
Treatment capacity (m3/day)
Regulation amount (m3)
Treatment capacity (m3/day)
Regulation amount (m3)
Treatment capacity (m3/day)
Regulation amount (m3)
650 21,178 400 19,597 700 22,914Case 1 Phase 1
700 18,153 450 16,325 750 20,764
700 21,874 500 18,803 700 20,388Case 2 Phase 2
750 18,874 550 16,853 750 18,355
800 21,189 600 20,089 650 21,754Case 3 Phase 3
850 18,189 650 18,139 700 18,604
800 23,539 650 19,656 700 21,193Case 4 Phase 4
850 20,539 700 17,733 750 19,075
Case 5 Closer 800 763 650 2,965 700 90
b.2.2 Water Quality
Leachate quality varies depending on types of wastes disposed, climate, etc. In the Study,
leachate quality of the existing landfill was surveyed at a time. BOD 762 mg/l and COD
1,009 mg/l were obtained from the results. These values are considerably lower than typical
leachate quality shown in Table K-26.
Table K-26: Typical Data of Leachate Quality
Range (mg/liter) Typical (mg/liter) BOD 2,000 to 30,000 10,000 COD 3,000 to 60,000 18,000 Organic nitrogen 10 to 800 200 Ammonia nitrogen (NH3-N) 10 to 800 200 Total phosphorus 5 to 100 30 Nitrate 5 to 40 25 source : integrated solid waste management, McGraw-Hill
The Study on Solid Waste Management Plan for JICA Municipality of Panama in the Republic of Panama KOKUSAI KOGYO CO., LTD.
K-39
It is judged risky to use the obtained values of leachate quality as design conditions. Then, the
typical values are applied as design conditions, influent quality, for the leachate treatment
facilities in this plan. Meanwhile, the effluent standards set by ANAM are regarded as design
effluent quality of leachate. Table K-27 summarizes the design conditions of the leachate
treatment facilities, i.e., influent and effluent qualities.
Table K-27: Design Conditions for Leachate Treatment Facility
Influent quality (mg/liter) Effluent quality (mg/liter) BOD 10,000 35 COD 18,000 100 Organic nitrogen 200 10 Ammonia nitrogen (NH3-N) 200 3 Total phosphorus 30 5 Nitrate 25 6
b.2.3 Treatment Process
Process Flow Sheet
The existing leachate treatment method is the aerobic-anaerobic (facultative) pond. This
method cannot achieve the effluent standards above. Especially, it is difficult to attain the
standard set for nitrate. Activated sludge method removes nitrogenous matters effectively.
However, its operation requires sophisticated technology. Consequently, oxidation ditch
method, which can remove nitrogenous matters and is relatively easy to operate, with
physical-chemical treatment to remove phosphorus and heavy metals is applied in this plan.

The Study on Solid Waste Management Plan for JICA Municipality of Panama in the Republic of Panama KOKUSAI KOGYO CO., LTD.
K-40
Figure K-32: Leachate Treatment Process Flow Sheet Process Calculation
Volume of Oxidation Ditch
Total recycle ratio
8.311
63200
1)(
)()(
3
33
=−−
=
−−
−−−= −
R
NNONNHNNH
Rout
outin
Overall sludge age
daysVaerobic
cc 5.12
71.09.8' ===
θθ
Detention time for BOD removal
fvss=MLVSS/MLSS = 0.7
[ ]( )
[ ] daysfkX
SSY
cvssda
hca 30.20
)5.1270.004.0(1500,25.1235000,1055.0
1)(
'0
'
=××+×−×
=+
−=
θθ
θ
Regulation pond
Leachate intake
Oxidation ditch
Chemicals feeding system
Surplus sludge(to landfill site)
Effluence
Remove BOD & nitrogenRemove phosphorous& some heavy metals
Removesuspended solid
Remove COD &some heavy metals
Chemical sedimentation tankSedimentation tank Transfer tank
Grit chamberLeachate receive tank
Sand filter
Activated carbon absorber
Disinfections tank
Chlorine
The Study on Solid Waste Management Plan for JICA Municipality of Panama in the Republic of Panama KOKUSAI KOGYO CO., LTD.
K-41
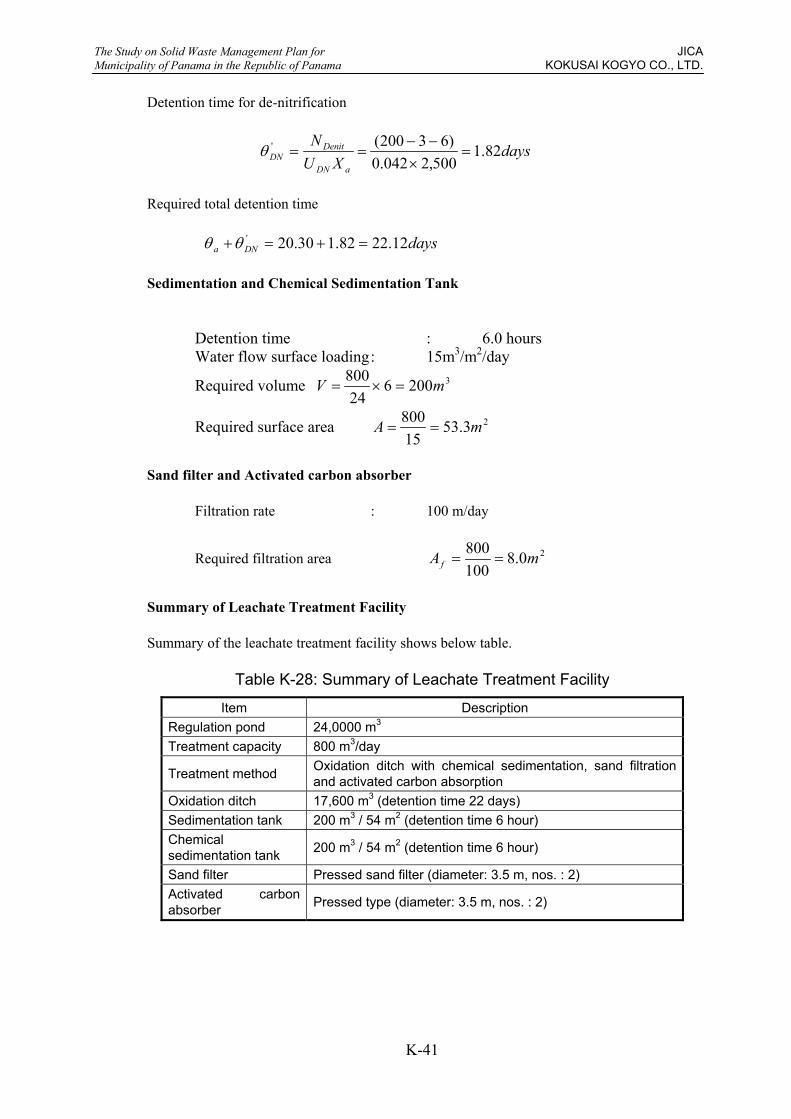
Detention time for de-nitrification
daysXU
N
aDN
DenitDN 82.1
500,2042.0)63200(' =
×−−
==θ
Required total detention time
daysDNa 12.2282.130.20' =+=+θθ Sedimentation and Chemical Sedimentation Tank
Detention time : 6.0 hours Water flow surface loading : 15m3/m2/day
Required volume 3200624
800 mV =×=
Required surface area 23.5315800 mA ==
Sand filter and Activated carbon absorber
Filtration rate : 100 m/day
Required filtration area 20.8100800 mAf ==
Summary of Leachate Treatment Facility
Summary of the leachate treatment facility shows below table.
Table K-28: Summary of Leachate Treatment Facility
Item Description Regulation pond 24,0000 m3 Treatment capacity 800 m3/day
Treatment method Oxidation ditch with chemical sedimentation, sand filtration and activated carbon absorption
Oxidation ditch 17,600 m3 (detention time 22 days) Sedimentation tank 200 m3 / 54 m2 (detention time 6 hour) Chemical sedimentation tank 200 m3 / 54 m2 (detention time 6 hour)
Sand filter Pressed sand filter (diameter: 3.5 m, nos. : 2) Activated carbon absorber Pressed type (diameter: 3.5 m, nos. : 2)

The Study on Solid Waste Management Plan for JICA Municipality of Panama in the Republic of Panama KOKUSAI KOGYO CO., LTD.
K-42
c. Cost Estimation
c.1 Investment Cost
c.1.1 Civil Works
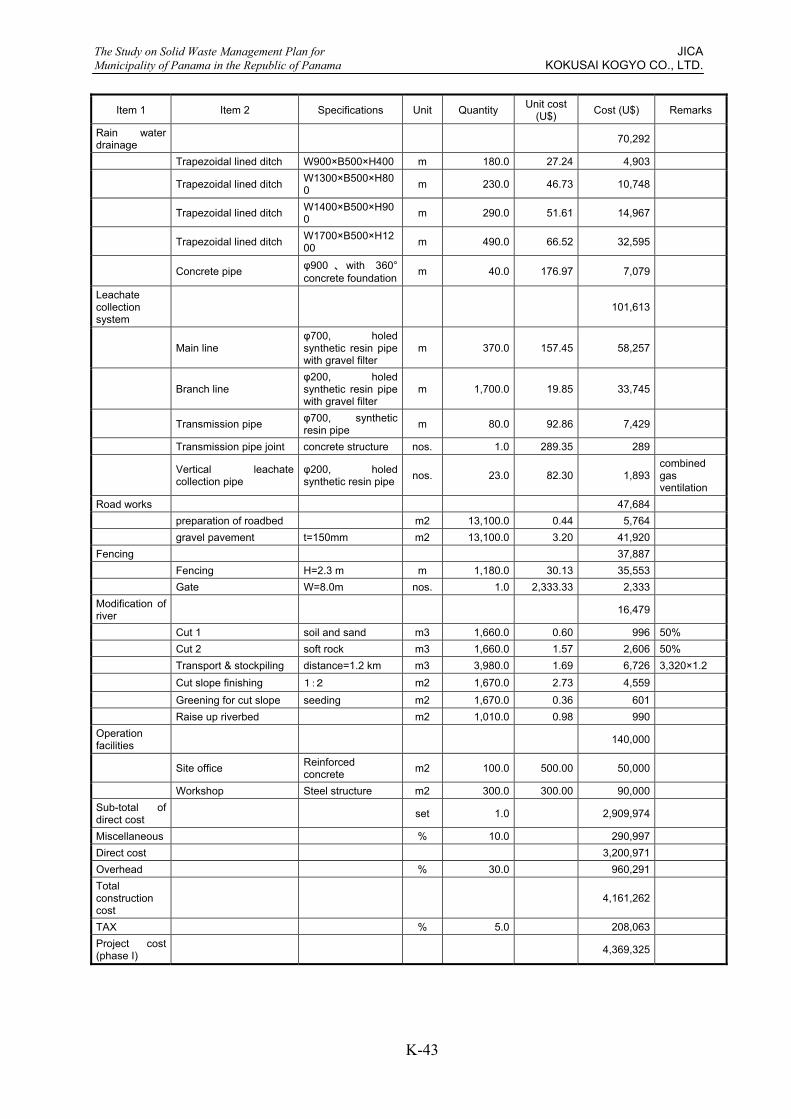
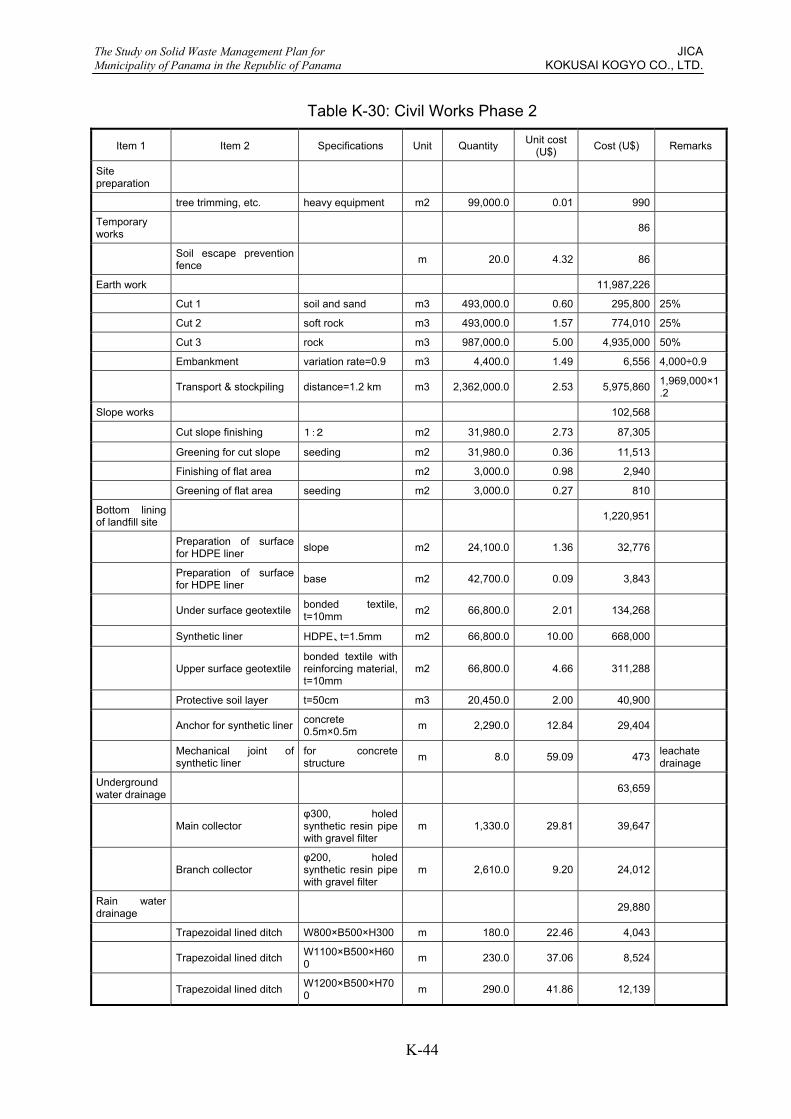
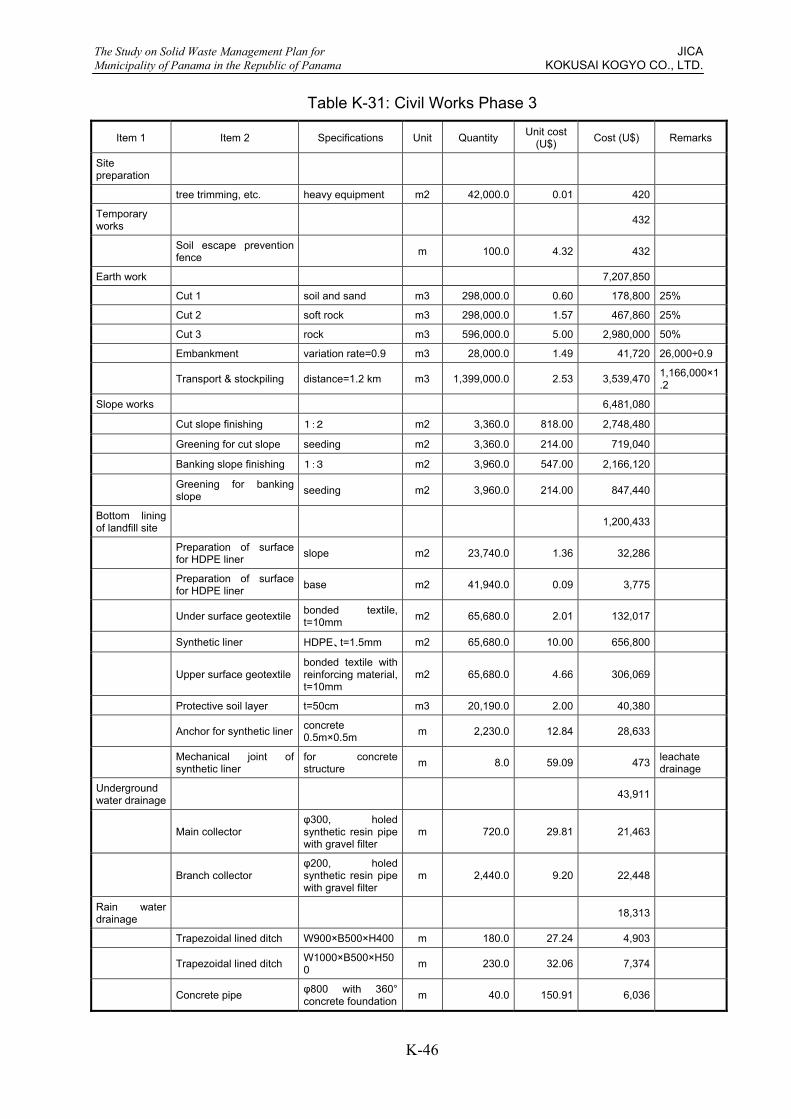
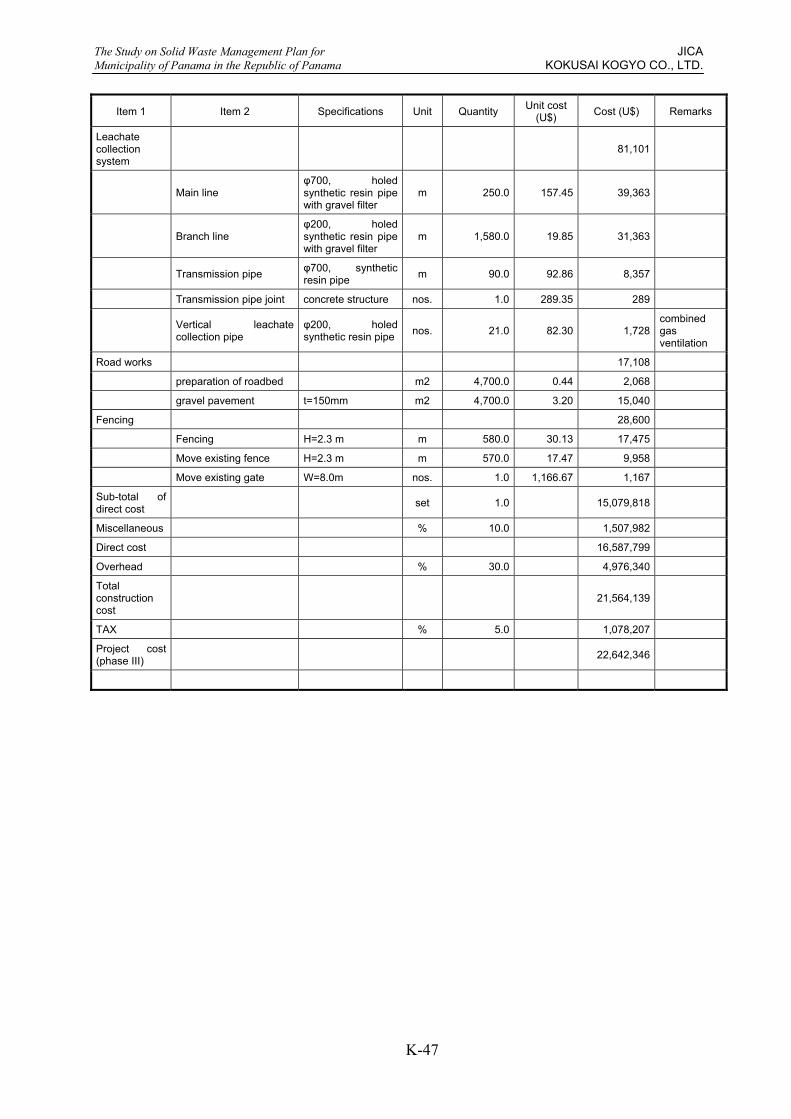
Results of cost estimation are shown in tables below.
Table K-29: Civil Work Phase 1
Item 1 Item 2 Specifications Unit Quantity Unit cost (U$) Cost (U$) Remarks
Site preparation
Tree trimming, etc. heavy equipment m2 112,000.0 0.01 1,120 Temporary works 3,495
Temporary sedimentation pond for earth works
nos. 1.0 2,198.63 2,199
Soil escape prevention fence m 300.0 4.32 1,296
Earth works 1,258,003 Cut 1 soil and sand m3 203,000.0 0.60 121,800 50% Cut 2 soft rock m3 203,000.0 1.57 318,710 50% Embankment variation rate=0.9 m3 16,700.0 1.49 24,883 15,000÷0.9 Transport & stockpiling distance=1.2 km m3 469,000.0 1.69 792,610 391,000×1.2Slope works 30,659 Cut slope finishing 1:2 m2 4,190.0 2.73 11,439 Greening for cut slope seeding m2 4,190.0 0.36 1,508 Banking slope finishing 1:3 m2 3,740.0 1.82 6,807
Greening for banking slope seeding m2 3,740.0 0.36 1,346
Finishing of flat area m2 6,330.0 0.98 6,203 Greening of flat area seeding m2 6,330.0 0.53 3,355 Bottom lining of landfill site 1,147,818
Preparation of surface for HDPE liner slope m2 22,650.0 1.36 30,804
Preparation of surface for HDPE liner base m2 48,020.0 0.09 4,322
Under surface geotextile bonded textile, t=10mm m2 70,670.0 0.00 0
Synthetic liner HDPE、t=1.5mm m2 70,670.0 10.00 706,700
Upper surface geotextile bonded textile with reinforcing material, t=10mm
m2 70,670.0 4.66 329,322
Protective soil layer t=50cm m3 23,140.0 2.00 46,280
Anchor for synthetic liner concrete 0.5m×0.5m m 2,330.0 12.84 29,917
Mechanical joint of synthetic liner
for concrete structure m 8.0 59.09 473 leachate
drainage Underground water drainage 54,926
Main collector φ300, holed synthetic resin pipe with gravel filter
m 1,000.0 29.81 29,810
Branch collector φ200, holed synthetic resin pipe with gravel filter
m 2,730.0 9.20 25,116
The Study on Solid Waste Management Plan for JICA Municipality of Panama in the Republic of Panama KOKUSAI KOGYO CO., LTD.
K-43
Item 1 Item 2 Specifications Unit Quantity Unit cost (U$) Cost (U$) Remarks
Rain water drainage 70,292
Trapezoidal lined ditch W900×B500×H400 m 180.0 27.24 4,903
Trapezoidal lined ditch W1300×B500×H800 m 230.0 46.73 10,748
Trapezoidal lined ditch W1400×B500×H900 m 290.0 51.61 14,967
Trapezoidal lined ditch W1700×B500×H1200 m 490.0 66.52 32,595
Concrete pipe φ900 、 with 360° concrete foundation m 40.0 176.97 7,079
Leachate collection system
101,613
Main line φ700, holed synthetic resin pipe with gravel filter
m 370.0 157.45 58,257
Branch line φ200, holed synthetic resin pipe with gravel filter
m 1,700.0 19.85 33,745
Transmission pipe φ700, synthetic resin pipe m 80.0 92.86 7,429
Transmission pipe joint concrete structure nos. 1.0 289.35 289
Vertical leachate collection pipe
φ200, holed synthetic resin pipe nos. 23.0 82.30 1,893
combined gas ventilation
Road works 47,684 preparation of roadbed m2 13,100.0 0.44 5,764 gravel pavement t=150mm m2 13,100.0 3.20 41,920 Fencing 37,887 Fencing H=2.3 m m 1,180.0 30.13 35,553 Gate W=8.0m nos. 1.0 2,333.33 2,333 Modification of river 16,479
Cut 1 soil and sand m3 1,660.0 0.60 996 50% Cut 2 soft rock m3 1,660.0 1.57 2,606 50% Transport & stockpiling distance=1.2 km m3 3,980.0 1.69 6,726 3,320×1.2 Cut slope finishing 1:2 m2 1,670.0 2.73 4,559 Greening for cut slope seeding m2 1,670.0 0.36 601 Raise up riverbed m2 1,010.0 0.98 990 Operation facilities 140,000
Site office Reinforced concrete m2 100.0 500.00 50,000
Workshop Steel structure m2 300.0 300.00 90,000 Sub-total of direct cost set 1.0 2,909,974
Miscellaneous % 10.0 290,997 Direct cost 3,200,971 Overhead % 30.0 960,291 Total construction cost
4,161,262
TAX % 5.0 208,063 Project cost (phase I) 4,369,325
The Study on Solid Waste Management Plan for JICA Municipality of Panama in the Republic of Panama KOKUSAI KOGYO CO., LTD.
K-44
Table K-30: Civil Works Phase 2
Item 1 Item 2 Specifications Unit Quantity Unit cost (U$) Cost (U$) Remarks
Site preparation
tree trimming, etc. heavy equipment m2 99,000.0 0.01 990
Temporary works 86
Soil escape prevention fence m 20.0 4.32 86
Earth work 11,987,226
Cut 1 soil and sand m3 493,000.0 0.60 295,800 25%
Cut 2 soft rock m3 493,000.0 1.57 774,010 25%
Cut 3 rock m3 987,000.0 5.00 4,935,000 50%
Embankment variation rate=0.9 m3 4,400.0 1.49 6,556 4,000÷0.9
Transport & stockpiling distance=1.2 km m3 2,362,000.0 2.53 5,975,860 1,969,000×1.2
Slope works 102,568
Cut slope finishing 1:2 m2 31,980.0 2.73 87,305
Greening for cut slope seeding m2 31,980.0 0.36 11,513
Finishing of flat area m2 3,000.0 0.98 2,940
Greening of flat area seeding m2 3,000.0 0.27 810
Bottom lining of landfill site 1,220,951
Preparation of surface for HDPE liner slope m2 24,100.0 1.36 32,776
Preparation of surface for HDPE liner base m2 42,700.0 0.09 3,843
Under surface geotextile bonded textile, t=10mm m2 66,800.0 2.01 134,268
Synthetic liner HDPE、t=1.5mm m2 66,800.0 10.00 668,000
Upper surface geotextile bonded textile with reinforcing material, t=10mm
m2 66,800.0 4.66 311,288
Protective soil layer t=50cm m3 20,450.0 2.00 40,900
Anchor for synthetic liner concrete 0.5m×0.5m m 2,290.0 12.84 29,404
Mechanical joint of synthetic liner
for concrete structure m 8.0 59.09 473 leachate
drainage
Underground water drainage 63,659
Main collector φ300, holed synthetic resin pipe with gravel filter
m 1,330.0 29.81 39,647
Branch collector φ200, holed synthetic resin pipe with gravel filter
m 2,610.0 9.20 24,012
Rain water drainage 29,880
Trapezoidal lined ditch W800×B500×H300 m 180.0 22.46 4,043
Trapezoidal lined ditch W1100×B500×H600 m 230.0 37.06 8,524
Trapezoidal lined ditch W1200×B500×H700 m 290.0 41.86 12,139

The Study on Solid Waste Management Plan for JICA Municipality of Panama in the Republic of Panama KOKUSAI KOGYO CO., LTD.
K-45
Item 1 Item 2 Specifications Unit Quantity Unit cost (U$) Cost (U$) Remarks
Concrete pipe φ500, with 360° concrete foundation m 10.0 95.17 952
Scarcement drainage m 2,080.0 2.03 4,222
Leachate collection system
119,144
Main line φ700, holed synthetic resin pipe with gravel filter
m 350.0 157.45 55,108
Branch line φ200, holed synthetic resin pipe with gravel filter
m 1,670.0 19.85 33,150
Transmission pipe φ700, synthetic resin pipe m 310.0 92.86 28,787
Transmission pipe joint concrete structure nos. 1.0 289.35 289
Vertical leachate collection pipe
φ200, holed synthetic resin pipe nos. 22.0 82.30 1,811
combined gas ventilation
Road works 29,047
preparation of roadbed m2 7,980.0 0.44 3,511
gravel pavement t=150mm m2 7,980.0 3.20 25,536
Fencing 30,800
Fencing H=2.3 m m 740.0 30.13 22,296
Move existing fence H=2.3 m m 420.0 17.47 7,337
Move existing gate W=8.0m nos. 1.0 1,166.67 1,167
Sub-total of direct cost set 1.0 13,584,352
Miscellaneous % 10.0 1,358,435
Direct cost 14,942,788
Overhead % 30.0 4,482,836
Total construction cost
19,425,624
TAX % 5.0 971,281
Project cost (phase II) 20,396,905
The Study on Solid Waste Management Plan for JICA Municipality of Panama in the Republic of Panama KOKUSAI KOGYO CO., LTD.
K-46
Table K-31: Civil Works Phase 3
Item 1 Item 2 Specifications Unit Quantity Unit cost (U$) Cost (U$) Remarks
Site preparation
tree trimming, etc. heavy equipment m2 42,000.0 0.01 420
Temporary works 432
Soil escape prevention fence m 100.0 4.32 432
Earth work 7,207,850
Cut 1 soil and sand m3 298,000.0 0.60 178,800 25%
Cut 2 soft rock m3 298,000.0 1.57 467,860 25%
Cut 3 rock m3 596,000.0 5.00 2,980,000 50%
Embankment variation rate=0.9 m3 28,000.0 1.49 41,720 26,000÷0.9
Transport & stockpiling distance=1.2 km m3 1,399,000.0 2.53 3,539,470 1,166,000×1.2
Slope works 6,481,080
Cut slope finishing 1:2 m2 3,360.0 818.00 2,748,480
Greening for cut slope seeding m2 3,360.0 214.00 719,040
Banking slope finishing 1:3 m2 3,960.0 547.00 2,166,120
Greening for banking slope seeding m2 3,960.0 214.00 847,440
Bottom lining of landfill site 1,200,433
Preparation of surface for HDPE liner slope m2 23,740.0 1.36 32,286
Preparation of surface for HDPE liner base m2 41,940.0 0.09 3,775
Under surface geotextile bonded textile, t=10mm m2 65,680.0 2.01 132,017
Synthetic liner HDPE、t=1.5mm m2 65,680.0 10.00 656,800
Upper surface geotextile bonded textile with reinforcing material, t=10mm
m2 65,680.0 4.66 306,069
Protective soil layer t=50cm m3 20,190.0 2.00 40,380
Anchor for synthetic liner concrete 0.5m×0.5m m 2,230.0 12.84 28,633
Mechanical joint of synthetic liner
for concrete structure m 8.0 59.09 473 leachate
drainage
Underground water drainage 43,911
Main collector φ300, holed synthetic resin pipe with gravel filter
m 720.0 29.81 21,463
Branch collector φ200, holed synthetic resin pipe with gravel filter
m 2,440.0 9.20 22,448
Rain water drainage 18,313
Trapezoidal lined ditch W900×B500×H400 m 180.0 27.24 4,903
Trapezoidal lined ditch W1000×B500×H500 m 230.0 32.06 7,374
Concrete pipe φ800 with 360° concrete foundation m 40.0 150.91 6,036
The Study on Solid Waste Management Plan for JICA Municipality of Panama in the Republic of Panama KOKUSAI KOGYO CO., LTD.
K-47
Item 1 Item 2 Specifications Unit Quantity Unit cost (U$) Cost (U$) Remarks
Leachate collection system
81,101
Main line φ700, holed synthetic resin pipe with gravel filter
m 250.0 157.45 39,363
Branch line φ200, holed synthetic resin pipe with gravel filter
m 1,580.0 19.85 31,363
Transmission pipe φ700, synthetic resin pipe m 90.0 92.86 8,357
Transmission pipe joint concrete structure nos. 1.0 289.35 289
Vertical leachate collection pipe
φ200, holed synthetic resin pipe nos. 21.0 82.30 1,728
combined gas ventilation
Road works 17,108
preparation of roadbed m2 4,700.0 0.44 2,068
gravel pavement t=150mm m2 4,700.0 3.20 15,040
Fencing 28,600
Fencing H=2.3 m m 580.0 30.13 17,475
Move existing fence H=2.3 m m 570.0 17.47 9,958
Move existing gate W=8.0m nos. 1.0 1,166.67 1,167
Sub-total of direct cost set 1.0 15,079,818
Miscellaneous % 10.0 1,507,982
Direct cost 16,587,799
Overhead % 30.0 4,976,340
Total construction cost
21,564,139
TAX % 5.0 1,078,207
Project cost (phase III) 22,642,346

The Study on Solid Waste Management Plan for JICA Municipality of Panama in the Republic of Panama KOKUSAI KOGYO CO., LTD.
K-48
Table K-32: Civil Works Phase 4
Item 1 Item 2 Specifications Unit Quantity Unit cost (U$) Cost (U$) Remarks
Earth work 2,088
Embankment m3 800.0 2.61 2,088 700÷0.9
Bottom lining of landfill site 137,412
Preparation of surface for HDPE liner base m2 7,710.0 0.09 694
Under surface geotextile bonded textile, t=10mm m2 7,710.0 2.01 15,497
Synthetic liner HDPE、t=1.5mm m2 7,710.0 10.00 77,100
Upper surface geotextile bonded textile with reinforcing material, t=10mm
m2 7,710.0 4.66 35,929
Protective soil layer t=50cm m3 3,860.0 2.00 7,720
Mechanical joint of synthetic liner
for concrete structure m 8.0 59.09 473 leachate
drainage
Leachate collection system
136,677
Main line φ500 holed synthetic resin pipe with gravel filter
m 180.0 140.12 25,222
Main line φ800 holed synthetic resin pipe with gravel filter
m 370.0 163.86 60,628
Main line φ900 holed synthetic resin pipe with gravel filter
m 220.0 176.47 38,823
Transmission pipe φ900 synthetic resin pipe m 70.0 135.40 9,478
Transmission pipe joint concrete structure nos. 1.0 385.80 386
Vertical leachate collection pipe
φ200, holed synthetic resin pipe nos. 26.0 82.30 2,140
combined gas ventilation
Fencing 12,173
Move existing fence H=2.3 m m 630.0 17.47 11,006
Move existing gate W=8.0m nos. 1.0 1,166.67 1,167
Sub-total of direct cost set 1.0 288,350
Miscellaneous % 10.0 28,835
Direct cost 317,185
Overhead % 30.0 95,155
Total construction cost
412,340
TAX % 5.0 20,617
Project cost (phase IV) 432,957

The Study on Solid Waste Management Plan for JICA Municipality of Panama in the Republic of Panama KOKUSAI KOGYO CO., LTD.
K-49
Table K-33: Overall Cost for Civil Works
Item 1 Item 2 Specifications Unit Quantity Unit cost (U$) Cost (U$) Remarks
Overall cost of Civil Works
Adjustment
Phase I 4,369,325 4,400,000
Phase 2 20,396,905 20,400,000
Phase 3 22,642,346 22,700,000
Phase 4 432,957 500,000
Total 47,841,534 48,000,000
c.1.2 Leachate Treatment Facility
Results of cost estimation are shown in tables below.
Table K-34: Leachate Treatment Facility
Item 1 Item 2 Specifications Unit Quantity Unit cost (U$) Cost (U$) Remarks
Civil works 1,540,848
Retaining wall H=5.0 m 450.0 678.72 305,424
Retaining wall H=1.0 to 5.0 m 80.0 475.10 38,008
Ditch W=15, H=4 m 450.0 1,847.88 831,546
Synthetic liner HDPE 1.5mm m2 8,600.0 10.00 86,000
Pavement t=0.1 m2 6,850.0 12.00 82,200
Sedimentation tank Am3 450.0 166.67 75,002
Reaction tank Am3 150.0 166.67 25,001
Chemical sedimentation tank Am3 450.0 166.67 75,002
Foundations SF, AC set 1.0 1,666.67 1,667
Control house m2 70.0 300.00 21,000
Equipment 1,315,000
Grit chamber set 1.0 20,000.00 20,000
Flow control system control tank and pump set 1.0 20,000.00 20,000
Aerator set 2.0 166,666.67 333,333
Sedimentation tank clarifier D=10m set 1.0 53,333.33 53,333
Chemical pumps set 3.0 13,333.33 40,000
Mixer set 3.0 2,000.00 6,000
Sand filter dia 3.5m set 2.0 65,000.00 130,000
Pumps for SF set 2.0 2,666.67 5,333
Activated carbon absorber dia 3.5m set 2.0 130,000.00 260,000
Pumps for AC set 2.0 2,666.67 5,333
Chlorinator set 1.0 3,333.33 3,333
Installation and piping % 50.0 438,333
Electric facility and installation set 1.0 438,333 50%of equipment

The Study on Solid Waste Management Plan for JICA Municipality of Panama in the Republic of Panama KOKUSAI KOGYO CO., LTD.
K-50
Item 1 Item 2 Specifications Unit Quantity Unit cost (U$) Cost (U$) Remarks
Civil works set 1.0 1,540,848
Equipment set 1.0 1,315,000 E&E
Electric facility and installation set 1.0 438,333
total 3,294,182 1,753,333
Miscellaneous % 10.0 329,418 175,333
Direct cost 3,623,600 1,928,666
Overhead % 30.0 1,087,080 578,600
Total construction cost 4,710,680 2,507,266
TAX % 5.0 235,534 125,363
Total 4,946,214 2,632,629Project cost (leachate treatment)
Adjustment 5,000,000 2,700,000
c.2 Operation and Maintenance Cost
c.2.1 Landfill
Annual landfill operation costs are shown in the table below.
Table K-35: Annual Operation Cost for Landfill (2004 to 2011)
Item Specifications Unit Quantity Unit cost (U$) Cost (U$) Remarks
Heavy equipment
Bulldozer CAT D8 class (inc. operator, fuel, maintenances, etc.) nos. 4 438,000 1,752,000 lease U$50/hour
365 days/year
Excavator CASE 580 class (inc. operator, fuel, maintenances, etc.) nos. 1 120,450 120.450 lease U$27.5/hour
182.5 days/year Total 1,872,450
Miscellaneous % 10 187,245 Direct cost 2,059,695
Overhead % 30 617,909 Total 2,677,604 TAX % 5 133,880
Annual operation cost 2,811,484 U$/year
The Study on Solid Waste Management Plan for JICA Municipality of Panama in the Republic of Panama KOKUSAI KOGYO CO., LTD.
K-51
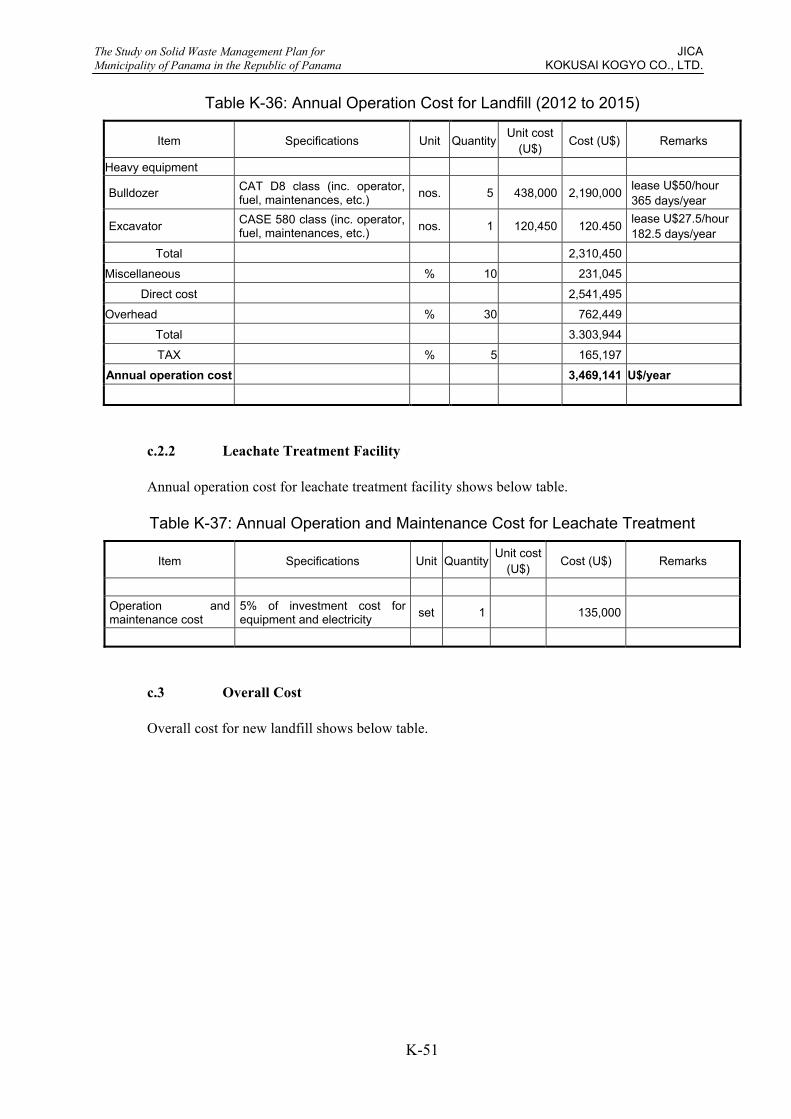
Table K-36: Annual Operation Cost for Landfill (2012 to 2015)
Item Specifications Unit Quantity Unit cost (U$) Cost (U$) Remarks
Heavy equipment
Bulldozer CAT D8 class (inc. operator, fuel, maintenances, etc.) nos. 5 438,000 2,190,000 lease U$50/hour
365 days/year
Excavator CASE 580 class (inc. operator, fuel, maintenances, etc.) nos. 1 120,450 120.450 lease U$27.5/hour
182.5 days/year Total 2,310,450
Miscellaneous % 10 231,045 Direct cost 2,541,495
Overhead % 30 762,449 Total 3.303,944 TAX % 5 165,197
Annual operation cost 3,469,141 U$/year
c.2.2 Leachate Treatment Facility
Annual operation cost for leachate treatment facility shows below table.
Table K-37: Annual Operation and Maintenance Cost for Leachate Treatment
Item Specifications Unit Quantity Unit cost (U$) Cost (U$) Remarks
Operation and maintenance cost
5% of investment cost for equipment and electricity set 1 135,000
c.3 Overall Cost
Overall cost for new landfill shows below table.
The Study on Solid Waste Management Plan for JICA Municipality of Panama in the Republic of Panama KOKUSAI KOGYO CO., LTD.
K-52
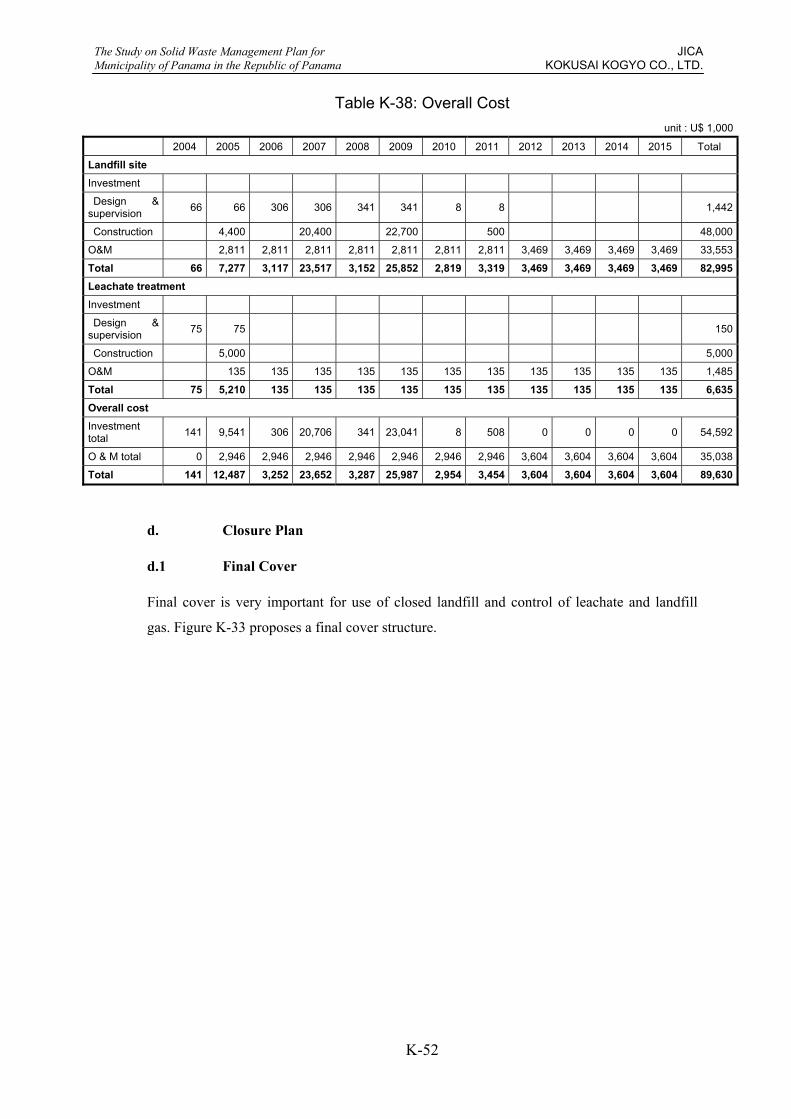
Table K-38: Overall Cost unit : U$ 1,000
2004 2005 2006 2007 2008 2009 2010 2011 2012 2013 2014 2015 Total
Landfill site
Investment
Design & supervision 66 66 306 306 341 341 8 8 1,442
Construction 4,400 20,400 22,700 500 48,000
O&M 2,811 2,811 2,811 2,811 2,811 2,811 2,811 3,469 3,469 3,469 3,469 33,553
Total 66 7,277 3,117 23,517 3,152 25,852 2,819 3,319 3,469 3,469 3,469 3,469 82,995Leachate treatment Investment Design & supervision 75 75 150
Construction 5,000 5,000
O&M 135 135 135 135 135 135 135 135 135 135 135 1,485
Total 75 5,210 135 135 135 135 135 135 135 135 135 135 6,635Overall cost Investment total 141 9,541 306 20,706 341 23,041 8 508 0 0 0 0 54,592
O & M total 0 2,946 2,946 2,946 2,946 2,946 2,946 2,946 3,604 3,604 3,604 3,604 35,038
Total 141 12,487 3,252 23,652 3,287 25,987 2,954 3,454 3,604 3,604 3,604 3,604 89,630
d. Closure Plan
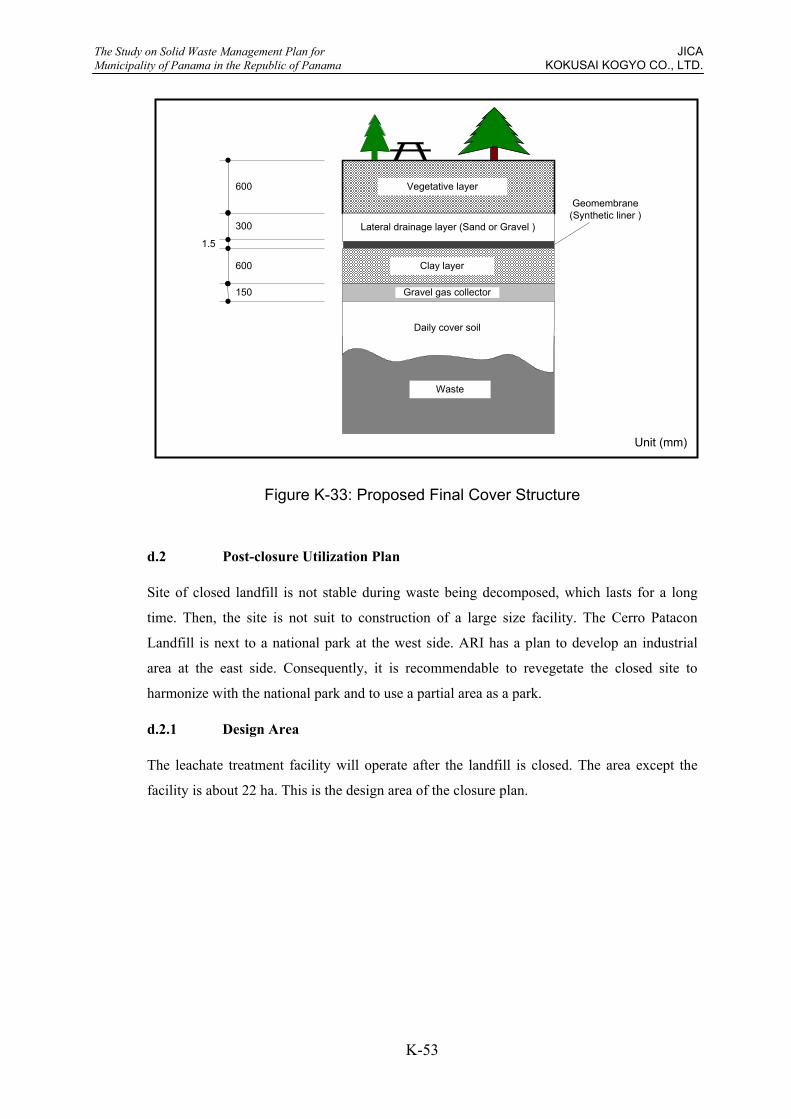
d.1 Final Cover
Final cover is very important for use of closed landfill and control of leachate and landfill
gas. Figure K-33 proposes a final cover structure.
The Study on Solid Waste Management Plan for JICA Municipality of Panama in the Republic of Panama KOKUSAI KOGYO CO., LTD.
K-53
Figure K-33: Proposed Final Cover Structure
d.2 Post-closure Utilization Plan
Site of closed landfill is not stable during waste being decomposed, which lasts for a long
time. Then, the site is not suit to construction of a large size facility. The Cerro Patacon
Landfill is next to a national park at the west side. ARI has a plan to develop an industrial
area at the east side. Consequently, it is recommendable to revegetate the closed site to
harmonize with the national park and to use a partial area as a park.
d.2.1 Design Area
The leachate treatment facility will operate after the landfill is closed. The area except the
facility is about 22 ha. This is the design area of the closure plan.
1.5
Geomembrane(Synthetic liner )
Waste
Daily cover soil
Gravel gas collector
Clay layer
Lateral drainage layer (Sand or Gravel )
Vegetative layer600
300
600
150
Unit (mm)

The Study on Solid Waste Management Plan for JICA Municipality of Panama in the Republic of Panama KOKUSAI KOGYO CO., LTD.
K-54
d.2.2 Zoning
Zoning plan is as presented in Figure K-34.
Figure K-34: Zoning Plan
Buffer Zone
Green Zone
Park Zone
D
D
D
D
D
D
D