k—2 - houghton mifflin harcourt · regarding permission, write to scholastic inc., 557 broadway,...
TRANSCRIPT

Screener Technical GuideVersion 1.0
NEW!
For K—2

Screener Technical GuideVersion 1.0
by Dr. Richard K. Wagner
In partnership with Scholastic Inc.

No part of this publication may be reproduced in whole or in part, or stored in a retrieval system, or transmitted in any form or by any means, electronic, mechanical, photocopying,
recording, or otherwise, without written permission of the publisher. For information regarding permission, write to Scholastic Inc., 557 Broadway, New York, NY 10012.
Copyright © 2014 by Scholastic Inc.
All rights reserved. Published by Scholastic Inc.
SCHOLASTIC, IREAD, and associated logos are trademarks and/or registered trademarks of Scholastic Inc. Other company names, brand names, and product names are the property
and/or trademarks of their respective owners.

3Technical Guide
TABLE OF CONTENTSIntroduction
Overview of the iRead Screener ........................................................................................................ 5Uses of the iRead Screener ................................................................................................................ 6Rationale for the iRead Screener ....................................................................................................... 6
Administration and ScoringAdministration ................................................................................................................................... 7Scoring ............................................................................................................................................... 7
Score Reporting and InterpretationiRead Screener Analytic ..................................................................................................................... 8Instructional Placement ...................................................................................................................... 9DIBELS Next Equivalent Percentiles ................................................................................................ 9
Development of the iRead ScreenerThe iRead Screener Strands ............................................................................................................. 14Development of the iRead Screener Item Bank ............................................................................... 14iRead Development and Evaluation Sample .................................................................................... 15iRead Scoring Algorithm ................................................................................................................. 15
Reliability of iRead Screener ScoresInternal Consistency Reliability Coefficients ................................................................................... 18Standard Error of Measurement ....................................................................................................... 19
Validity of iRead Screener ScoresContent-Description Validity ........................................................................................................... 20Criterion-Prediction Validity ............................................................................................................ 20Construct-Identification Validity ...................................................................................................... 24
References ..................................................................................................................................... 32

4 iRead Screener
LIST OF TABLES
Table 1: Placement Score Recommendations Based on iRead Screener Score Performance ............ 9Table 2: iRead Screener Total Fluency Scores and the Corresponding DIBELS Next
Beginning of Year (BOY) Percentile Scores ...................................................................10Table 3: Percentages of Students Falling in Three DIBELS Next Composite Score Benchmark Classifications .............................................................................................. 15Table 4: Combining Accuracy and Latency Into Fluency Scores: Four Possible Response Patterns ..................................................................................................................... 15Table 5: Internal Consistency Reliability Coefficients (Coefficient Alpha) for iRead Screener Scores Overall and by Grade ........................................................................... 18Table 6: Standard Errors of Measurement (SEM) for Selected iRead Screener Scores by Grade ........................................................................................................................ 19Table 7: Kindergarten Predictive Validity Coefficients for iRead Screener Scores as Predictors of DIBELS Next Criterion Scores by Grade ............................................ 21Table 8: First-Grade Predictive Validity Coefficients for iRead Screener Scores as Predictors of DIBELS Next Criterion Scores by Grade ........................................................ 22Table 9: Second-Grade Predictive Validity Coefficients for iRead Screener Scores as Predictors of DIBELS Next Criterion Scores by Grade ............................................ 23Table 10: Model Fit Statistics for iRead Screener Scores by Grade ................................................ 24
Figure 1: Screener Analytic .............................................................................................................. 8Figure 2: Kindergarten Confirmatory Factor Analysis for Accuracy Scores ................................... 25Figure 3: First-Grade Confirmatory Factor Analysis for Accuracy Scores ...................................... 26Figure 4: Second-Grade Confirmatory Factor Analysis for Accuracy Scores ................................. 27Figure 5: Kindergarten Confirmatory Factor Analysis for Fluency Scores ..................................... 28Figure 6: First-Grade Confirmatory Factor Analysis for Fluency Scores ........................................ 29Figure 7: Second-Grade Confirmatory Factor Analysis for Fluency Scores .................................... 30
LIST OF FIGURES

5Technical Guide
INTRODUCTION
The iRead Screener Technical Guide was developed by Dr. Richard K. Wagner in collaboration with Scholastic Inc. This Technical Guide (Version 1.0) describes the purpose and development of the iRead Screener, and documents its reliability and validity. The iRead Screener Technical Guide will be updated as its research corpus expands.
Overview of the iRead Screener The iRead Screener, developed by Scholastic Inc, was designed to screen for students in kindergarten through second grade to determine if they are fluent in four foundational reading skills: phonological awareness, letter knowledge, sight word reading, and phonological decoding. The Screener can be administered individually via a computer to students in kindergarten, first grade, and second grade. The Screener can be used for two purposes: (1) to screen for fluency in foundational reading skills and (2) to place students into the appropriate instructional level within the iRead software scope and sequence.
Phonological awareness refers to an awareness of and access to the sound structure of one’s oral language. The sound structure of an oral language refers to the fact that of the nearly infinite number of possible combinations of phonemes or basic speech sounds that are available to be used in an oral language, only a relatively small number of these combinations actually occur, and they occur repeatedly in multiple words. For alphabetic written languages such as English, phonological awareness is especially important because of the correspondence between phonemes and printed letters. For example, the spoken words “cat,” “rat,” and “hat” have different initial phonemes but identical medial and final phonemes. These similarities and differences are reflected in their spellings: they have different first letters and identical middle and final letters. To a beginning reader who is aware of the similarities and differences among the sounds of the spoken words “cat,” “rat,” and “hat,” the English writing system will be viewed as a sensible system for representing speech in print. To a beginning reader who lacks such awareness, the spellings of these three words will seem to be arbitrary and much more difficult to learn. The iRead Screener includes phonological awareness items that assess accuracy and speed at identifying spoken words that match in rhyme, first sound, final sound, and middle sound.
Letter knowledge is a second important foundational reading skill. In alphabetic scripts such as English, all printed words are created by combining a relatively small set of possible letters. The iRead Screener assesses knowledge of both letter names and sounds. Letter name knowledge is assessed by measuring the accuracy and speed with which a sample of both uppercase and lowercase letters are identified. Because letter name knowledge is a precursor or rudimentary form of word reading, letter name knowledge items are commonly combined with sight word items on measures of sight word reading. Letter sound knowledge is assessed by measuring the accuracy and speed with which spoken letter sounds are matched with their corresponding printed letters. Because letter sound knowledge is a rudimentary form of phonological decoding, letter sound knowledge items are sometimes combined with items that require decoding nonwords.
Sight word reading is a third important foundational reading skill because it is required for fluent reading of connected text for meaning. If too many words in a text are not known by sight and must be sounded out, fluent reading is not possible, and understanding of meaning suffers. Sight word fluency is assessed by measuring the speed and accuracy with which high-frequency words are read.
Phonological decoding, which refers to the ability to use knowledge of correspondences between sounds and letters to help in decoding unfamiliar words, is a fourth important foundational skill for

6 iRead Screener
reading. Until words become so well known that they become sight words, phonological decoding is an important way to decode words. Phonological decoding is assessed by measuring the speed and accuracy with which phonologically regular nonwords are read.
Uses of the iRead Screener The iRead Screener was developed to screen for children in kindergarten through second grade to determine if they are fluent in phonological awareness, sight word reading and its precursor skill of letter name knowledge, and phonological decoding and its precursor skill of letter sound knowledge. Performance on the Screener is also used to provide optimal placement in the iRead software.
Rationale for the iRead Screener Phonological awareness has been shown to be an effective tool for beginning to map the sounds of spoken language onto graphemes. For alphabetic languages such as English, there is a rough correspondence between phonemes, which are the speech sounds that make a difference in meaning, and letters. English is referred to as an opaque rather than a transparent orthography because of irregularities in the mapping of sounds to letters. This mapping is further complicated by the fact that English is a morphophonemic system of writing in which spellings are determined jointly by meaning and pronunciation (Adams, 2011). Nevertheless, being able to identify sounds in spoken words helps to sound out written words, even if it is not fully sufficient to decode irregular words completely. Phonological awareness is an oral language skill, but when combined with letter knowledge, it serves as a key component of phonics knowledge.
Phonological decoding at the word level is a building block upon which fluent single-word reading and fluent reading of connected text for comprehension are based, and an important predictor of reading comprehension. The iRead Screener uses nonword decoding fluency as an effective measure for evaluating phonological decoding. When presented with a phonologically regular nonword, readers must break it into parts, retrieve sounds associated with the parts, and string them together to pronounce the unfamiliar word.
A related element that contributes to reading fluency is sight word knowledge. Skilled readers have a large vocabulary of sight words that can be recognized automatically. However, developing a large vocabulary of sight words is largely dependent on the reader’s ability to decode efficiently. Skilled readers analyze unfamiliar words or nonwords more fully than poor readers do. For example, some poor readers tend to use initial consonant cues to guess at the rest of the word. A full analysis of unfamiliar words contributes to their becoming sight words over time. With repeated, accurate reading of the same word, the word eventually becomes stored in memory as a sight word—one that is identified automatically and without conscious thought.
The more accurate and automatic readers become with these word-level reading processes, the more cognitive resources become available for comprehending meaningful strings of text. In fact, for elementary-age students, word-level reading has been found to be a major determinant of reading comprehension (Jenkins et al., 2003; Stanovich, 1991).
Difficulties with word-level reading become increasingly problematic as students get older. Problems with phonological decoding and sight word fluency result in poor comprehension and lower motivation (National Research Council, 1998), and as texts become increasingly advanced with each grade, poor readers fall further and further behind. Research has found that “very early in the reading process poor readers, who experience greater difficulty in breaking the spelling-to-sound code, begin to be exposed to much less text than their more skilled peers” and that “lack of exposure and practice on the part of less-skilled readers delays the development of automaticity and speed at the word recognition level” (Cunningham & Stanovich, 1998, p. 8).

7Technical Guide
ADMINISTRATION AND SCORING
Administration The iRead Screener is administered individually via a computer. The Screener typically takes approximately 20 to 25 minutes to complete. The Screener must be completed before students begin to use the iRead Software. To begin, students log in by entering their username and password on the iRead login screen and then clicking the Arrow button. After a brief welcome from their iRead on-screen teachers, students are taken to the Screener where they follow audio directions and begin each section with guided practice items. Throughout the Screener, students can access the Pause/Play button. In some sections, they can also hear audio prompts replayed by clicking on the Speaker button and Replay button. If the student is unable to complete the Screener in one session, he or she will begin where he or she left off when logging in again. If a section was not fully completed in the prior session, the student will start back at the beginning of that section. Once the student has answered the last question, he or she will be asked to click the Go On button to complete the test. After completing the Screener, the student is automatically placed in the appropriate series of the iRead software. See page 9 for additional information related to instructional placement.
Scoring The scoring system has been designed to assess fluency, which refers to the combination of accurate and efficient or speedy responding. Fluency is important because it frees the reader to attend to comprehension. If a student is accurate but slow, it is likely that reinforcement of basic skills along with ongoing practice and corrective feedback will increase word-level fluency. If a student is fluent with nonwords but not fluent with sight words, a plausible explanation is good phonological decoding skills but limited knowledge of the English vocabulary being assessed. On the other hand, if a student is fluent with sight words but not fluent or inaccurate with nonwords, the explanation may be an extensive sight word vocabulary along with lack of basic decoding skills.
Fluency is assessed for all items on the iRead Screener by giving credit only for items that are responded to correctly and prior to an item-specific time limit, also known as an empirically derived fluency threshold.

8 iRead Screener
SCORE REPORTING AND INTERPRETATION
iRead Screener Analytic The iRead Screener generates a screener analytic in Scholastic Central (see Figure 1) for each class. The screener analytic includes the following information:
• Administration Date
• Total Fluent Score
• Instructional Placement (Level and Series)
• DIBELS Next Equivalent Percentile
Figure 1. Screener Analytic

9Technical Guide
Instructional Placement Performance on the iRead Screener generates two kinds of information that is relevant to instructional placement. The first kind of placement information is information useful to teachers about how students are performing and which students are likely to need additional support. Students who need similar levels and kinds of support are often grouped together for instruction.
The second kind of placement information is specific to the iRead program. Alternative placement points in the program are available for first and second grade students, and iRead Screener Scores are used to optimally place students into the program. The recommended placement points in the iRead program for corresponding iRead Screener Scores are presented in Table 1.
Table 1. Placement Score Recommendations Based on iRead Screener Score Performance
iRead Screener Score: Total Fluent
Instructional Placement: Entry Point
Entry Point Available to Students
0–15 Series 1 (Level A/Grade K) Grades K, 1, 2
16–30 Series 7 Grades 1 & 2
31–35 Series 13 Grades 1 & 2
36–48 Series 19 (Level B/Grade 1) Grades 1 & 2
49–58 Series 28 Grade 2
59–82 Series 37 (Level C/Grade 2) Grade 2
DIBELS Next Equivalent Percentiles
In addition to taking the iRead Screener, participants in the iRead Screener Development Study were also administered DIBELS Next (Dynamic Indicators of Basic Early Literacy Skills, Next) (Good & Kaminski, 2001). See page 15 for study participant information. DIBELS Next produces a Composite Score and corresponding benchmark level (At or Above Benchmark, Below Benchmark, or Well Below Benchmark). DIBELS Next Composite Scores are associated with nationally normed percentile rank scores (Cummings, Kennedy, Otterstedt, Baker & Kame’enui, 2011). Equipercentile equating was used to link iRead Screener Fluency Scores to DIBELS Next Beginning of Year (BOY) Composite Scores. Subsequently, the iRead Screener Scores were also linked to the DIBELS Next percentile rank scores. See page 14 for additional information on the development of the iRead Screener.
Linking iRead Screener Fluency performance to DIBELS Next benchmark levels and percentile rank scores provides educators insight as to whether a student’s iRead Screener fluency performance is consistent with his or her DIBELS Next performance. An iRead Screener Score that corresponds to a DIBELS Next benchmark level of At or Above indicates that the odds of a student achieving subsequent early literacy goals are from 80% to 90%, and the student is likely to continue to make sufficient progress through exposure to the core reading program. An iRead Screener Score that corresponds to a DIBELS Next benchmark level of Below indicates that the odds of a student achieving subsequent early literacy goals are from 40% to 60%, and the student is likely to need

10 iRead Screener
additional support beyond mere exposure to the student’s regular reading program. An iRead Screener Score that corresponds to a DIBELS Next benchmark of Well Below indicates that the odds of a student achieving subsequent early literacy goals are from 10% to 20%, and the student is likely to continue to require intensive literacy support. See Table 2 for iRead Screener Total Fluency Scores and their corresponding DIBELS Next Composite Score Percentiles.
Score Kindergarten First Grade Second Grade
0 1 1 1
1 2 1 1
2 3 1 1
3 4 1 1
4 5 1 1
5 6 2 1
6 7 2 1
7 9 2 1
8 13 2 2
9 14 2 2
10 20 2 2
11 24 3 2
12 29 3 2
13 35 4 2
14 41 4 2
15 46 5 2
16 51 5 2
17 53 6 2
18 58 6 2
19 59 7 2
DIBELS NEXT BOY COMPOSITE SCORE PERCENTILES
iREAD SCREENER TOTAL FLUENCY
Table 2. iRead Screener Total Fluency Scores and the Corresponding DIBELS Next Beginning of Year (BOY) Composite Score Percentiles

11Technical Guide
Score Kindergarten First Grade Second Grade
20 63 8 2
21 68 11 2
22 72 14 2
23 75 15 2
24 79 17 3
25 82 18 3
26 84 19 3
27 87 20 3
28 89 21 3
29 89 24 3
30 90 28 3
31 91 30 4
32 92 32 4
33 93 37 4
34 94 40 5
35 95 42 5
36 95 46 5
37 96 48 5
38 96 55 6
39 97 57 6
40 97 60 6
41 97 61 6
42 97 65 6
43 97 68 7
44 98 71 7
45 98 74 7
DIBELS NEXT BOY COMPOSITE SCORE PERCENTILES
iREAD SCREENER TOTAL FLUENCY

12 iRead Screener
Score Kindergarten First Grade Second Grade
46 98 75 7
47 98 78 7
48 99 79 8
49 99 80 8
50 >99 81 8
51 >99 82 8
52 >99 84 9
53 >99 86 10
54 >99 87 11
55 >99 89 16
56 >99 90 19
57 >99 91 23
58 >99 91 29
59 >99 91 34
60 >99 92 37
61 >99 92 42
62 >99 92 45
63 >99 93 51
64 >99 93 55
65 >99 94 59
66 >99 94 64
67 >99 95 67
68 >99 96 68
69 >99 96 72
70 >99 97 81
71 >99 98 84
DIBELS NEXT BOY COMPOSITE SCORE PERCENTILES
iREAD SCREENER TOTAL FLUENCY

13Technical Guide
Score Kindergarten First Grade Second Grade
72 >99 98 85
73 >99 98 87
74 >99 99 89
75 >99 99 93
76 >99 99 94
77 >99 99 95
78 >99 99 96
79 >99 99 97
80 >99 99 98
81 >99 99 99
82 >99 99 99
DIBELS NEXT BOY COMPOSITE SCORE PERCENTILES
iREAD SCREENER TOTAL FLUENCY

14 iRead Screener
DEVELOPMENT OF THE iREAD SCREENER
The iRead Screener Strands The iRead Screener includes a total of 82 possible items, divided into three strands: Phonological Awareness, Letter-Word Identification, and Word Attack.
• The Phonological Awareness Strand includes 12 total items, specifically three items designed to measure students’ rhyme identification skills and nine items designed to measure students’ ability to identify initial, final, and medial sounds.
• The Letter-Word Identification Strand includes 30 total items, specifically 10 items designed to measure students’ knowledge of uppercase and lowercase letter names and 20 items designed to measure students’ sight word knowledge.
• The Word Attack Strand includes 40 total items, specifically 10 items designed to measure students’ ability to identify letter sounds and 30 nonword items designed to measure students’ decoding skills.
Development of the iRead Screener Item Bank Phonological Awareness Items. Four phonological awareness item types were created. Rhyme items require identifying a response alternative that shares a rhyme with a target real-word stimulus. Initial sound items require identifying a response alternative that shares an initial sound with a target real-word stimulus. Final sound items require identifying a response alternative that shares a final sound with a target real-word stimulus. Medial sound items require identifying a response alternative that shares a medial sound with a target real-word stimulus.
Five items were initially generated for each item type, and item discrimination and difficulty values were used to select the best three items for each of the four item types to be included in the final version of the iRead Screener, resulting in a total of 12 phonological awareness items.
Letter Name and Letter Sound Knowledge Items. Ten items assessing lowercase letter name knowledge and ten items assessing uppercase letter name knowledge were initially developed. Item discrimination and difficulty values were used to select the best five uppercase and five lowercase items, for a total of 10 letter name knowledge items. Ten letter sound knowledge items were developed, and item discrimination and difficulty values indicated that all 10 letter sound items should be included in the iRead Screener.
Sight Word Reading Items. A total of 20 sight word items were developed using the 100 most frequent words from Fry’s 1000 Instant Words (2000). The distractor items were other high frequency sight words or common decodable words. Item discrimination and difficulty values indicated that all 20 sight word items should be included on the iRead Screener.
Nonword Items. A total of 30 nonword items were developed, representing the full range of commonly taught phonics skills. All targets and distractors were nonwords or obscure English words that are

15Technical Guide
unlikely to be known. In addition, all targets and distractors follow conventions of English spelling, and care was taken to avoid Spanish words, slang, and nonwords that sound like real words. Item discrimination and difficulty values indicated that all 30 nonword items should be included on the iRead Screener.
iRead Development and Evaluation Sample The iRead development and evaluation sample consisted of 1,390 students from 75 classrooms, representing four school districts in geographically dispersed regions of the United States. The sample included 457 kindergarten students, 498 first-grade students, and 425 second-grade students. Nearly a third (31%) of the students in the sample were Caucasian, 29% were Hispanic, 18% were African American, 16% were Asian, and 6% of the students were comprised of other ethnicities. The sample consisted of 51% male and 49% female students. Over half (52%) the sample received free or reduced- price lunch, and 18% were English language learners (ELLs).
The representativeness of the sample with respect to reading skills is evidenced by the percentages of students who fell in the various categories of performance based on their DIBELS Next Beginning of Year Composite Scores (administered September and October, 2012). These results are presented in Table 3.
Table 3. Percentages of Students Falling in Three DIBELS Next Composite Score Benchmark Classifications
Kindergarten First Grade Second Grade
At or Above Benchmark 60% 55% 49%
Below Benchmark 17% 14% 5%
Well Below Benchmark 23% 31% 56%
DIBELS NEXT COMPOSITE SCORE
These results indicate that the sample included considerable numbers of students who performed either At or Above Benchmark or Well Below Benchmark in reading as measured by DIBELS Next. The trend across grades was for fewer students to be At or Above Benchmark and more to be Below or Well Below Benchmark with increasing grade level.
iRead Scoring Algorithm Item-Level Fluency Thresholds. Fluency thresholds were determined empirically for each item. Alternative procedures for setting fluency thresholds were evaluated on the basis of the resultant item and scale properties. The procedure was adopted to set the item fluency threshold at the 25th percentile of response times for the first-grade sample, after response times were ordered from fastest to slowest.

16 iRead Screener
Combining Accuracy and Latency Into Fluency Scores. A fluent response must be accurate as well as sufficiently fast. To get credit for a fluent response to an item, the response had to be correct and the total response time (latency) could not exceed the threshold time. This method of scoring is represented in Table 4.
There are a number of advantages to this kind of scoring. First, this method of scoring produces “hybrid” scores that combine accuracy and speed of responding. Hybrid scores have proven to be effective on other reading measures such as the Test of Word Reading Efficiency, Second Edition (TOWRE-2) (Torgesen, Wagner, & Rashotte, 2012) and the Test of Silent Reading Efficiency and Comprehension (TOSREC) (Wagner, Torgesen, Rashotte, & Pearson, 2010). One reason that hybrid scores are effective is that individual and developmental differences in underlying reading skill affect both accuracy and speed of response. Therefore, a score that incorporates both speed and accuracy is better than one that is based on only speed or accuracy.
A second advantage of this method of scoring is that outlying response times are handled implicitly. If performance on an assessment is measured in terms of average response time, a practical problem that must be dealt with is what to do about outlying response times. For example, an outlying response time of 20 seconds will have a large impact on the average response time for a set of responses that typically fall in the range of 1 to 2 seconds. The scoring method used on the iRead Screener handles this potential problem in that a response that exceeds the threshold value gets an item fluency score of 0 regardless of how slow it is.
A third advantage of this method of scoring is that it handles a practical problem that arises in the iRead Screener. Because the cursor must be moved to select the correct response in a list of distractors, the amount of cursor movement required varies across items depending on the position of the target item in the list of distractors. This presumably affects response times. This potential unwanted source of variability is handled implicitly by the fact that item thresholds are determined empirically for each individual item. Differences in response time associated with differences in amount of cursor movement required are reflected in the empirical distribution of response times that are the basis of the analyses used to identify the optimal item threshold.
Table 4. Combining Accuracy and Latency Into Fluency Scores: Four Possible Response Patterns
Pattern Response Accurate? Latency Below Threshold? Fluency Score
1 No No 0
2 No Yes 0
3 Yes No 0
4 Yes Yes 1

17Technical Guide
A final advantage of this method of scoring is that it facilitates maximal use of the information gained from responses to all items, ranging from easier sight word items to more difficult nonword items. When only accuracy of responses are considered, ceiling effects can be common for easy items (e.g., cat) with nearly all children getting the item correct. But by considering fluency, thereby requiring that the response be made prior to the item threshold response time, the ceiling effect on accuracy can be minimized and the item becomes more informative about a child’s level of performance.
Summary of the Development of the iRead Screener Scores. The iRead Screener Fluency Scores are based on both the accuracy and speed of responses. Response thresholds were established individually for each item.
18 iRead Screener
RELIABILITY OF iREAD SCREENER SCORES
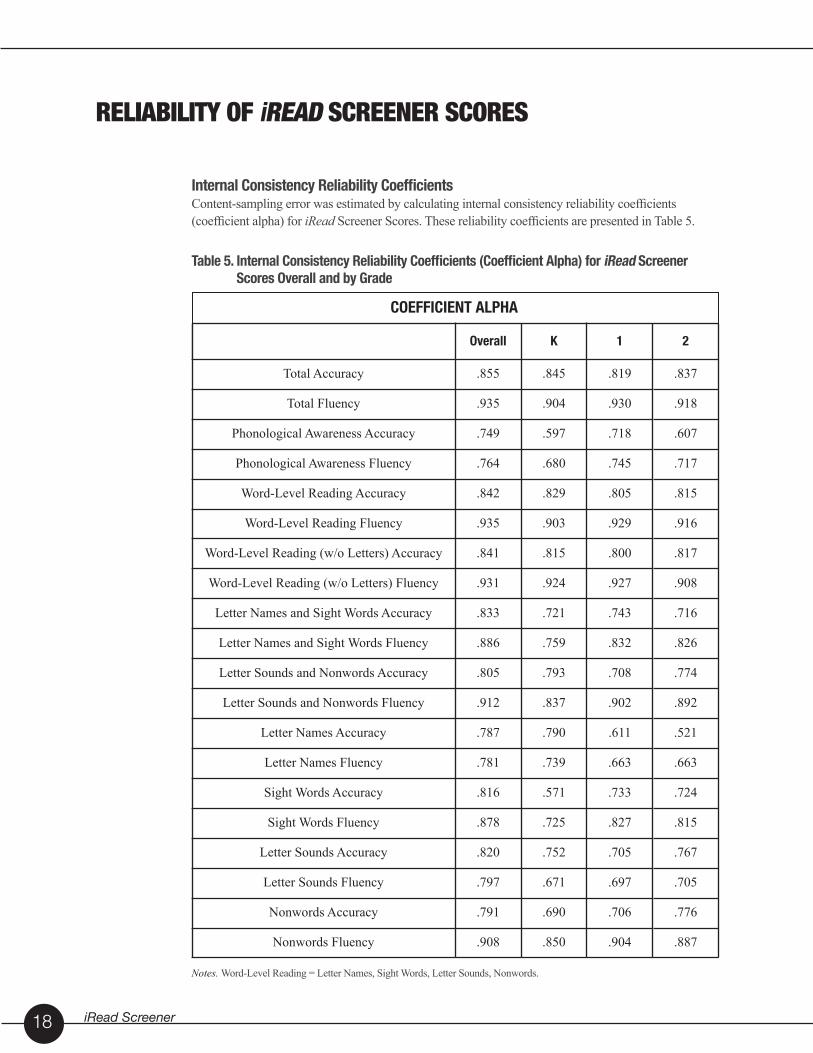
Internal Consistency Reliability Coefficients Content-sampling error was estimated by calculating internal consistency reliability coefficients (coefficient alpha) for iRead Screener Scores. These reliability coefficients are presented in Table 5.
Table 5. Internal Consistency Reliability Coefficients (Coefficient Alpha) for iRead Screener Scores Overall and by Grade
Overall K 1 2
Total Accuracy .855 .845 .819 .837
Total Fluency .935 .904 .930 .918
Phonological Awareness Accuracy .749 .597 .718 .607
Phonological Awareness Fluency .764 .680 .745 .717
Word-Level Reading Accuracy .842 .829 .805 .815
Word-Level Reading Fluency .935 .903 .929 .916
Word-Level Reading (w/o Letters) Accuracy .841 .815 .800 .817
Word-Level Reading (w/o Letters) Fluency .931 .924 .927 .908
Letter Names and Sight Words Accuracy .833 .721 .743 .716
Letter Names and Sight Words Fluency .886 .759 .832 .826
Letter Sounds and Nonwords Accuracy .805 .793 .708 .774
Letter Sounds and Nonwords Fluency .912 .837 .902 .892
Letter Names Accuracy .787 .790 .611 .521
Letter Names Fluency .781 .739 .663 .663
Sight Words Accuracy .816 .571 .733 .724
Sight Words Fluency .878 .725 .827 .815
Letter Sounds Accuracy .820 .752 .705 .767
Letter Sounds Fluency .797 .671 .697 .705
Nonwords Accuracy .791 .690 .706 .776
Nonwords Fluency .908 .850 .904 .887
Notes. Word-Level Reading = Letter Names, Sight Words, Letter Sounds, Nonwords.
COEFFICIENT ALPHA

19Technical Guide
The reliability results indicate that fluency scores are more reliable than accuracy scores. Ideally, scores used for making decisions should have reliabilities equal to or greater than .9. For the iRead Screener, Total Fluency and Word-Level Reading Fluency (with and without letters) met this criterion and are the scores that should be used for making decisions about students who take the Screener.
Standard Error of Measurement The standard error of measurement (SEM) is a measure of the amount of measurement error associated with iRead Screener Scores. The SEM is calculated by multiplying the standard deviation of a test score by the square root of 1 minus the reliability of the test score. SEMs for iRead Screener Scores with sufficient reliability for making decisions are presented in Table 6.
Table 6. Standard Errors of Measurement (SEM) for Selected iRead Screener Scores by Grade
iRead Screener Score Kindergarten First Grade Second Grade
Total Fluency 3 4 4
Word-Level Reading Fluency 3 4 4
Word-Level Reading (w/o Letters) Fluency 2 3 3
SEM
SEM values allow us to put confidence intervals around iRead Screener Scores. The 95% confidence interval is twice the SEM above and below the score. This means that the 95% confidence interval for a Total Fluency score of 20 obtained by a student in kindergarten, for example, is 14 to 26.
Summary of the Reliability Analyses. The reliability analyses indicate that the iRead Screener Scores of Total Fluency, Word-Level Reading Fluency, and Word-Level Reading Fluency Without Letters meet the highest standard of reliability. The standard error of measurement (SEM) for iRead Screener Scores ranges from 2 to 4. This corresponds to 95% confidence intervals of plus or minus 4 to plus or minus 8.

20 iRead Screener
VALIDITY OF iREAD SCREENER SCORES
Content-Descriptive Validity Content-descriptive validity refers to the examination of the content of the test to determine whether it is a representative sample of the behavioral domain that is being assessed (Anastasi & Urbina, 1997). The traditional term for this kind of validity is content validity.
The same domains that are assessed by the iRead Screener are phonological awareness, letter name knowledge, letter sound knowledge, and decoding of sight words and nonwords. The phonological awareness items included rhyming and identification of first, last, and medial sounds. The letter items include both uppercase and lowercase letters. The sight word items were sampled from the first 100 of Fry’s 1000 Instant Words (2000). The nonword items were constructed to sample commonly taught phonics skills, which also are the skills addressed in iRead. These include letter sounds, CVC patterns, blends, and VCe patterns. All items were reviewed by an expert panel for content validity and bias.
Criterion-Predictive Validity Criterion-predictive validity refers to the extent to which a test predicts the performance that the test is intended to predict (Anastasi & Urbina, 1997). The traditional term for this kind of validity is criterion-related validity.
Criteria available to be predicted came from the DIBELS Next, which was administered to the sample along with the iRead Screener. Predictive validity coefficients were calculated by using the iRead Screener Scores as predictors of DIBELS Next criterion scores. The resultant validity coefficients are presented in Tables 7, 8, and 9 for kindergarten, first grade, and second grade.
Substantial validity coefficients were found at the kindergarten, first-grade, and second-grade levels between DIBELS Next Composite Scores and iRead Total, Word-Level Reading, Word-Level Reading Without Letters, Letter Names and Sight Words, and Letter Sounds and Nonwords accuracy and fluency scores. Validity coefficients tended to be higher for fluency than for accuracy scores. At the kindergarten level, substantial validity coefficients were found for the Letter Name and Letter Sound tasks. In contrast, second-grade students’ Letter Name and Letter Sound task performance was not related to DIBELS Next performance. Conversely, Nonword Reading was substantially related to DIBELS Next performance for first- and second-grade students, but not for kindergarten students who presumably could not decode many nonwords.

21Technical Guide
First Sound
Fluency
Letter Naming Fluency
Composite
iRead Correct Scores
Total .56** .66** .70**
Word-Level Reading .52** .66** .67**
Word-Level Reading (w/o Letters) .48** .52** .57**
Phonological Awareness .60** .51** .62**
Letter Names and Sight Words .51** .63** .66**
Letter Sounds and Nonwords .44** .53** .55**
Letter Names .40** .59** .57**
Sight Words .48** .52** .58**
Letter Sounds .45** .63** .61**
Nonwords .32* .36** .39**
iRead Fluency Scores
Total .44** .57** .58**
Word-Level Reading .33** .51** .49**
Word-Level Reading (w/o Letters) .25** .37** .35**
Phonological Awareness .58** .49** .61**
Letter Names and Sight Words .34** .49** .48**
Letter Sounds and Nonwords .21** .37** .34**
Letter Names .30** .45** .43**
Sight Words .48** .52** .58**
Letter Sounds .45** .63** .61**
Nonwords .32* .36** .39**
First Sound
Fluency
Letter Naming Fluency
Composite
iRead Accuracy Scores
Total .56** .66** .70**
Word-Level Reading .52** .66** .67**
Word-Level Reading (w/o Letters) .48** .52** .57**
Phonological Awareness .60** .51** .62**
Letter Names and Sight Words .51** .63** .66**
Letter Sounds and Nonwords .44** .53** .55**
Letter Names .40** .59** .57**
Sight Words .48** .52** .58**
Letter Sounds .45** .63** .61**
Nonwords .32* .36** .39**
iRead Fluency Scores
Total .44** .57** .58**
Word-Level Reading .33** .51** .49**
Word-Level Reading (w/o Letters) .25** .37** .35**
Phonological Awareness .58** .49** .61**
Letter Names and Sight Words .34** .49** .48**
Letter Sounds and Nonwords .21** .37** .34**
Letter Names .30** .45** .43**
Sight Words .48** .52** .58**
Letter Sounds .45** .63** .61**
Nonwords .32* .36** .39**
Table 7. Kindergarten Predictive Validity Coefficients for iRead Screener Scores as Predictors of DIBELS Next Criterion Scores by Grade
DIBELS NEXT CRITERION SCORESiREAD SCREENER SCORE
Notes. * = p < .05. ** = p < .01.

22 iRead Screener
Table 8. First-Grade Predictive Validity Coefficients for iRead Screener Scores as Predictors of DIBELS Next Criterion Scores by Grade
Letter Naming Fluency
Phoneme Segmentation
Fluency
Nonsense Word
FluencyComposite
iRead Correct Scores
Total .63** .38** .63** .71**
Word-Level Reading .62** .35** .62** .70**
Word-Level Reading (w/o Letters) .62** .37** .65** .71**
Phonological Awareness .56** .39** .47** .60**
Letter Names and Sight Words .61** .30** .52** .60**
Letter Sounds and Nonwords .57** .36** .63** .69**
Letter Names .27** .17** .14** .23**
Sight Words .62** .31** .54** .61**
Letter Sounds .30** .14** .20** .29**
Nonwords .57** .36** .64** .69**
iRead Fluency Scores
Total .70** .36** .68** .73**
Word-Level Reading .68** .33** .68** .70**
Word-Level Reading (w/o Letters) .67** .31** .72** .70**
Phonological Awareness .56** .35** .45** .58**
Letter Names and Sight Words .63** .33** .53** .61**
Letter Sounds and Nonwords .62** .29** .71** .68**
Letter Names .31** .22** .21** .37**
Sight Words .65** .34** .57** .54**
Letter Sounds .40** .24** .31** .40**
Nonwords .59* .25** .73** .66**
Letter Naming Fluency
Phoneme Segmentation
Fluency
Nonsense Word
FluencyComposite
iRead Accuracy Scores
Total .63** .38** .63** .71**
Word-Level Reading .62** .35** .62** .70**
Word-Level Reading (w/o Letters) .62** .37** .65** .71**
Phonological Awareness .56** .39** .47** .60**
Letter Names and Sight Words .61** .30** .52** .60**
Letter Sounds and Nonwords .57** .36** .63** .69**
Letter Names .27** .17** .14** .23**
Sight Words .62** .31** .54** .61**
Letter Sounds .30** .14** .20** .29**
Nonwords .57** .36** .64** .69**
iRead Fluency Scores
Total .70** .36** .68** .73**
Word-Level Reading .68** .33** .68** .70**
Word-Level Reading (w/o Letters) .67** .31** .72** .70**
Phonological Awareness .56** .35** .45** .58**
Letter Names and Sight Words .63** .33** .53** .61**
Letter Sounds and Nonwords .62** .29** .71** .68**
Letter Names .31** .22** .21** .37**
Sight Words .65** .34** .57** .54**
Letter Sounds .40** .24** .31** .40**
Nonwords .59* .25** .73** .66**
DIBELS NEXT CRITERION SCORESiREAD SCREENER SCORE
Notes. * = p < .05. ** = p < .01.

23Technical Guide
Table 9. Second-Grade Predictive Validity Coefficients for iRead Screener Scores as Predictors of DIBELS Next Criterion Scores by Grade
Nonsense Word
Fluency
Oral Reading Fluency
Composite
iRead Accuracy Scores
Total .53** .60** .50**
Word-Level Reading .60** .70** .57**
Word-Level Reading (w/o Letters) .63** .70** .58**
Phonological Awareness .33** .44** .42**
Letter Names and Sight Words .40** .49** .39**
Letter Sounds and Nonwords .62** .68** .59**
Letter Names .00 .04 .09
Sight Words .43** .52** .39**
Letter Sounds .11 .09 .12*
Nonwords .63* .69** .59**
iRead Fluency Scores
Total .56** .71** .62**
Word-Level Reading .59** .72** .64**
Word-Level Reading (w/o Letters) .64** .78** .67**
Phonological Awareness .33** .47** .45**
Letter Names and Sight Words .36** .49** .43**
Letter Sounds and Nonwords .63** .75** .67**
Letter Names .07 .12* .12*
Sight Words .43** .57** .49**
Letter Sounds .23** .29** .34**
Nonwords .67* .79** .68**
DIBELS NEXT CRITERION SCORESiREAD SCREENER SCORE
Notes. * = p < .05. ** = p < .01.

24 iRead Screener
Construct-Identification Validity Construct-identification validity refers to the extent to which a test measures the target theoretical construct or trait (Anastasi & Urbina, 1997). The traditional term for this type of validity is construct validity. Construct-identification validity is a global form of validity that encompasses evidence provided about the content-descriptive validity and criterion-predictive validity of a test, but includes other evidence as well. For the iRead Screener, one test of construct-identification validity is whether the factor structure of the measure conforms to predictions based on theories of early reading.
Confirmatory factor analyses were carried out on both accuracy scores and fluency scores separately by grade. Model fit statistics are presented in Table 10 and the results are presented in Figures 2 through 7.
Summary of Confirmatory Factor Analysis. The confirmatory factor analysis results support the construct-identification validity of the iRead Screener model. At all three grades, the underlying factor structure of the Screener was characterized by two factors: a Phonological Awareness Factor that consisted of Rhyme, Initial-Sound Identification, Final-Sound Identification, and Medial-Sound Identification; and a Word-Level Reading Factor that consisted of Sight Word Reading and Nonword Decoding at all grade levels, and that also included Letter Name knowledge and Letter Sound knowledge at the kindergarten and first-grade levels but not at the second-grade level.
Summary of the Validity Analyses. The content-description validity of the iRead Screener was demonstrated by examining the extent to which the items represented the target domains of Phonological Awareness, Sight Word, and Nonword Decoding. Criterion-prediction validity was demonstrated by the magnitudes of the predictive validity coefficients generated when iRead Screener Scores were used to predict DIBELS Next criterion reference scores. The construct-identification validity of the iRead Screener was supported by the results of confirmatory factor analyses of both accuracy and fluency scores.
X 2 df p TLI CFI RMSEA (90CI) p-close
Kindergarten (accuracy scores) 39.4 17 .002 .952 .971 .05
(.32–.76) .359
First Grade (accuracy scores) 47.8 17 < .001 .957 .980 .06
(.04–.08) .182
Second Grade (accuracy scores) 32.3 8 < .001 .896 .960 .095
(.06–.12) .027
Kindergarten (fluency scores) 41.6 18 .001 .962 .981 .05
(.03–.07) .424
First Grade (fluency scores) 41.3 17 .001 .959 .981 .05
(.03–.08) .359
Second Grade (fluency scores) 29.8 8 < .001 .904 .964 .08
(.05–.11) .046
FIT STATISTICSMODEL
Table 10. Model Fit Statistics for iRead Screener Scores by Grade
Notes. Χ2 = Chi Square. df = degrees of freedom. p = probability value. TLI = Tucker-Lewis Index. CFI = Comparative Fit Index. RMSEA = Root Mean Squared Error of Approximation. p-close = probability of a close-fitting model

25Technical Guide
The model fit statistics support the fit of the models in that all models met criteria for either an adequate or a good fit.
Figure 2. Kindergarten Confirmatory Factor Analysis for Accuracy Scores
Phonological Awareness Accuracy
initial sound
rhyme
final sound
medial sound
letter names
sight words
letter sounds
nonwords
LettersSight WordsNonwordsAccuracy
e1
e2
e3
e4
e5
e6
e7
e8
.56
.74
.65
.55
.57
.70
.68
.48
.17
.50
.91

26 iRead Screener
Figure 3. First-Grade Confirmatory Factor Analysis for Accuracy Scores
Phonological Awareness Accuracy
initial sound
rhyme
final sound
medial sound
letter names
sight words
letter sounds
nonwords
Letters Sight WordsNonwordsAccuracy
e1
e2
e3
e4
e5
e6
e7
e8
.63
.62
.78
.77
.47
.87
.89
.53
.82
-.02
.34

27Technical Guide
Figure 4. Second-Grade Confirmatory Factor Analysis for Accuracy Scores
Phonological Awareness Accuracy
initial sound
rhyme
final sound
medial sound
sight words
nonwords
Sight WordsNonwordsAccuracy
e1
e2
e3
e4
e5
e6
.40
.39
.67
.69
.78
.72
.90

28 iRead Screener
Figure 5. Kindergarten Confirmatory Factor Analysis for Fluency Scores
Phonological Awareness
Fluency
initial sound
rhyme
final sound
medial sound
letter names
sight words
letter sounds
nonwords
LettersSight WordsNonwordsFluency
e1
e2
e3
e4
e5
e6
e7
e8
.57
.62
.73
.69
.47
.71
.94
.56
.72
.37

29Technical Guide
Figure 6. First-Grade Confirmatory Factor Analysis for Fluency Scores
Phonological Awareness
Fluency
initial sound
rhyme
final sound
medial sound
letter names
sight words
letter sounds
nonwords
LettersSight WordsNonwordsFluency
e1
e2
e3
e4
e5
e6
e7
e8
.57
.62
.73
.69
.49
.72
.92
.57
.70
.13
.36

30 iRead Screener
Figure 7. Second-Grade Confirmatory Factor Analysis for Fluency Scores
Phonological Awareness
Fluency
initial sound
rhyme
final sound
medial sound
sight words
nonwords
Sight WordsNonwordsFluency
e1
e2
e3
e4
e5
e6
.56
.52
.63
.62
.68
.71
.91

31Technical Guide
Adams, M. J. (2011). The relation between alphabetic basics, word recognition, and reading. In S. Samuels & A. Farstrup (Eds.), What research has to say about reading instruction (pp. 4–24). Newark, DE: International Reading Association.
Anastasi, A., & Urbina, S. (1997). Psychological testing (7th ed.). Upper Saddle River, NJ: Prentice Hall.
Cummings, K. D., Kennedy, P. C., Otterstedt, J., Baker, S. K., & Kame’enui, E. J. (2011). DIBELS data system: 2010–2011 percentile ranks for DIBELS next benchmark assessments (Technical Report 1101). Eugene, OR: University of Oregon.
Cunningham, A. E. , & Stanovich, K. E. (1998, Spring/Summer). What reading does for the mind. American Educator, 22(4), 8–15.
Fry, E. (2000). 1000 instant words. Westminster, CA: Teacher Created Resources.
Good, R. H. & Kaminski, R. A. (2011). DIBELS Next (Dynamic Indicators of Basic Early Literacy Skills, Next), Benchmark Assessment. Dynamic Measurement Group. [Available for download at www.dibels.org]
Hock, M. F., Brasseur, I. F., Deshler, D. D., Catts, H. W., Marquis, J. G., Mark, C. A., & Stribling, J. W., (2009). What is the reading component skill profile of adolescent struggling readers in urban schools? Learning Disability Quarterly, 32(1), 21–38.
Jenkins, J. R., Fuchs, L. S., van den Broek, P., Espin, C., & Deno, S. L. (2003). Sources of individual differences in reading comprehension and reading fluency. Journal of Educational Psychology, 95, 719–729.
National Research Council (NRC). (1998). Preventing reading difficulties in young children. Snow, C. E., Burns, M. S., & Griffin, P. (Eds.) Washington, DC: National Academy Press.
Stanovich, K. E. (1991). Word recognition: Changing perspectives. In R. Barr, M. L. Kamil, P. Mosenthal, & P. D. Pearson (Eds.), Handbook of reading research (Vol. 2, pp. 418–452). New York, NY: Longman.
Torgesen, J. K., Wagner, R. K., & Rashotte, C. A. (2012). Test of Word Reading Efficiency, (2nd ed.). Austin, TX: PRO-Ed.
Wagner, R. K., Torgesen, J. K., Rashotte, C. A., & Pearson, N. A. (2010). Test of Silent Reading Efficiency and Comprehension. Austin, TX: PRO-Ed.
REFERENCES

Job #6887 06/14Not in JC
TM ® & © 2014 by Scholastic Inc. All rights reserved. Other company names, brand names, and product names are the property and/or trademarks of their respective owners.
Screener Technical GuideVersion 1.0