,k -atpase at 11-Å resolution: comparison with ca2 and e ... · large extracellular domain, which...
TRANSCRIPT
Structure of Na1,K1-ATPase at 11-Å Resolution: Comparison withCa21-ATPase in E1 and E2 States
William J. Rice,* Howard S. Young,* Dwight W. Martin,† John R. Sachs,† and David L. Stokes**Skirball Institute of Biomolecular Medicine and Department of Cell Biology, New York University Medical Center, New York,New York 10016, and †Division of Hematology, Department of Medicine, State University of New York at Stony Brook,Stony Brook, New York 11794 USA
ABSTRACT Na1,K1-ATPase is a heterodimer of a and b subunits and a member of the P-type ATPase family of ion pumps.Here we present an 11-Å structure of the heterodimer determined from electron micrographs of unstained frozen-hydratedtubular crystals. For this reconstruction, the enzyme was isolated from supraorbital glands of salt-adapted ducks and wascrystallized within the native membranes. Crystallization conditions fixed Na1,K1-ATPase in the vanadate-inhibited E2
conformation, and the crystals had p1 symmetry. A large number of helical symmetries were observed, so a three-dimensional structure was calculated by averaging both Fourier-Bessel coefficients and real-space structures of data fromthe different symmetries. The resulting structure clearly reveals cytoplasmic, transmembrane, and extracellular regions of themolecule with densities separately attributable to a and b subunits. The overall shape bears a remarkable resemblance to theE2 structure of rabbit sarcoplasmic reticulum Ca21-ATPase. After aligning these two structures, atomic coordinates forCa21-ATPase were fit to Na1,K1-ATPase, and several flexible surface loops, which fit the map poorly, were associated withsequences that differ in the two pumps. Nevertheless, cytoplasmic domains were very similarly arranged, suggesting that theE2-to-E1 conformational change postulated for Ca21-ATPase probably applies to Na1,K1-ATPase as well as other P-typeATPases.
INTRODUCTION
The Na1,K1-ATPase generates Na1 and K1 gradientsacross the plasma membrane in virtually all animal cells andis a member of the P-type ATPase family of ion pumps (seeMoller et al., 1996, for a recent review of P-type ATPases).During one enzymatic cycle, Na1,K1-ATPase transportsthree Na1 ions out of the cell and two K1 ions into the cellwhile hydrolyzing one molecule of ATP. This cycle alsoincludes transient formation of a phosphoenzyme, whichgives rise to the designation P type. Unlike other membersof this family, Na1,K1-ATPase, along with the highlyhomologous H1,K1-ATPase, is a heterodimer composed ofa andb subunits (Glynn, 1985). Thea subunit consists of;1020 amino acids and contains the sequence motifs thatdefine the P-type family. Analysis of cDNA sequences ofthea subunit shows that there are 10 transmembrane helices(M1–M10) that contain the cation binding sites. There aretwo cytoplasmic loops: a major loop between helices M4and M5 that contains the nucleotide binding and phosphor-ylation sites and a minor loop between M2 and M3. On theextracellular side of the membrane, a small extracellulardomain is composed of short loops between various trans-membrane helices and contains the binding site for ouabain.The N-terminus of theb subunit forms a small intracellulardomain followed by a short transmembrane helix and a
large extracellular domain, which is composed of 250 res-idues with three sites of glycosylation. Theb subunit isclearly required for proper folding and targeting ofNa1,K1-ATPase to the plasma membrane, and may alsoinfluence enzymatic properties of thea subunit (Hasler etal., 1998; Abriel et al., 1999).
Early studies (Glynn, 1985) showed that Asp369 ofNa1,K1-ATPase is phosphorylated from ATP when Na1 ispresent. This phosphoenzyme cannot be hydrolyzed by wa-ter, but retains sufficient chemical energy to be able totransfer the phosphate to ADP, thus making ATP. Underdifferent conditions, the enzyme can also be phosphorylatedby Pi; the relatively low energy of this phosphoenzyme issuggested by its unreactivity with ADP, though it can behydrolyzed by water in the presence of K1. Because thesame residue has been phosphorylated in both cases, thedifference in reactivity has been explained by a structuraldifference in the protein. The high-energy phosphoenzymewas designated E1;P and the low energy phosphoenzymeE2-P. Two analogous unphosphorylated species (E1 and E2)were subsequently identified, and a reaction cycle was pro-posed to define the causalities between ligand binding andconformational change:
E1zATP 1 Nai 7 E1 , PzNa1 ADP
7 E2 2 P1 Nao 1 Ko
7 E2zK 1 Pi 1 ATP7 E1zATP 1 Ki ,
where Nai and Ki are intracellular ions, Nao and Ko areextracellular ions, and Pi is orthophosphate. Similar mech-
Received for publication 21 August 2000 and in final form 2 February2001.
Address reprint requests to Dr. David L. Stokes, NYU Medical Center,Skirball Institute 3-13, 540 First Avenue, New York, NY 10016. Tel.:212-263-1580; Fax: 212-263-1580; [email protected].
© 2001 by the Biophysical Society
0006-3495/01/05/2187/11 $2.00
2187Biophysical Journal Volume 80 May 2001 2187–2197

anisms are consistent with experimental findings from otherP-type ATPases, including Ca21-ATPase.
Subsequent to these thermodynamic investigations, theexistence of the two major conformations of Na1,K1-ATPase was confirmed by various biochemical and bio-physical techniques. For example, there are three majortryptic cleavage sites in thea subunit, and their sensitiv-ity to cleavage depends on the conformational state (Jor-gensen, 1975). Tryptic cleavage at the first site in theN-terminal tail blocked the transition from E1;P to E2-P(Jorgensen and Klodos, 1978). Intrinsic tryptophan fluo-rescence is higher in E2 than in E1 conformations (Karl-ish and Yates, 1978), and fluorescence of probes such asfluorescein (Karlish, 1980) and iodoacetamidofluores-cein (Kapakos and Steinberg, 1982), which bind to theasubunit, change dramatically at key steps in the reactioncycle. All of these changes were thought to reflect aglobal change in enzyme structure. More recently,changes in the pattern of iron-catalyzed oxidative cleav-age (Goldshleger and Karlish, 1999; Patchornik et al.,2000) were interpreted in terms of particular domainmovements associated with the E1-to-E2 transition. As aresult of these and other experiments, it has been widelyconcludedthat the conformational changes provide the mech-anism of communication between cytoplasmic and transmem-brane domains, thus coupling ATP hydrolysis to ion transport,though this conclusion is not universally accepted (Jencks,1989).
The recently published atomic structure for Ca21-ATPasein the E1 conformation and its comparison with the 8-Åstructure in the E2 conformation represents a major advancenot only in defining pump architecture but also in specifyingthe structural basis for the E2-to-E1 transition (Toyoshima etal., 2000). Previous comparisons of 8-Å structures ofNeu-rosporaH1-ATPase and rabbit muscle Ca21-ATPase fromcryoelectron microscopy (Ku¨hlbrandt et al., 1998; Stokes etal., 1999) provided a similar view of the conformationalchange, though specific assignment of the cytoplasmic do-mains was ambiguous at that time. With respect to Na1,K1-ATPase, although it was the first member of this family tobe discovered (Skou, 1957) and the first to form two-dimensional (2D) crystals (Skriver et al., 1981), structuralmodels have been limited to;25-Å resolution (Mohraz etal., 1987; Skriver et al., 1992; Hebert et al., 1985, 1988),because of poor order, small crystal size, and the use ofnegative stain. Here we present a structure of E2-stateNa1,K1-ATPase from cryoelectron microscopy at 11-Åresolution, offering the first view of the entire heterodimerwith unambiguous assignment of its domains. Comparisonof our structure with E2 and E1 models of Ca21-ATPaseindicates that the molecular architecture as well as theconformational changes from E2 to E1 are likely to beconserved across the P-type ATPase family.
MATERIALS AND METHODS
Protein isolation
Microsomes were prepared from supraorbital (or nasal) glands of salt-adapted immature ducks, according to Martin and Sachs (1999). Similar totheir purification procedure, we used SDS to strip away peripheral mem-brane proteins, but longer tubular crystals were obtained at lower SDS:protein ratios (0.3 mg/ml SDS:1.4 mg/ml protein). Following SDS extrac-tion, microsomes were centrifuged over a 10–50% sucrose step gradient.An opaque, protein-rich band was collected, from which the microsomeswere pelleted by centrifugation and then were suspended in a solutioncontaining 50 mM imidazole pH 7.5, 60 mM NaCl, 10 mM KCl, 0.5 mMEGTA, and 2.5% (w/v) sucrose.
Crystallization and data collection
Microsomes were crystallized at 1 mg/ml in 50 mM imidazole pH 7.5, 10mM KCl, 2.5 mM MgCl2, 0.5 mM EGTA, and 0.5 mM Na3VO4 on ice.Although not strictly required for crystallization, the orthovanadate species(prepared by boiling the stock solution for 10 min) seemed to stabilize thecrystals and to increase the proportion of tubular crystals; in contrast,decavanadate solutions (prepared according to Stokes and Lacapere, 1994)provided only marginal improvement. Small amounts of detergent alsoaided crystallization, with 0.3–0.5 mg/ml diheptanoyl phosphatidylcholine(Kessi et al., 1994) being optimal. For data collection, a suspension ofcrystals was rapidly frozen in liquid ethane and imaged at350,000magnification in the frozen-hydrated state with a Philips CM200 FEGelectron microscope (Philips Electron Optics, Eindhoven, The Nether-lands) operating at 200 kV with an Oxford CT3500 cryoholder (OxfordInstruments, Eynsham, UK). Electron micrographs of tubes were screenedby optical diffraction, and well-ordered, tubular crystals were digitized at14-mm intervals with a Zeiss SCAI microdensitometer (Carl Zeiss,Oberkochen, Germany).
Image analysis
The Fourier transform of a helical object comprises layer lines calledGnl(R,Zl) (Klug et al., 1958), which can be directly averaged if objects havethe same helical symmetry. Real-space density maps are then determinedby Fourier-Bessel transformation ofGnl(R,Zl) to yieldgnl(r,Zl), followed bysummation of thesegnl(r,Zl) and Fourier transformation with respect toZ.The tubes of Na1,K1-ATPase showed much more variability in helicalsymmetry than Ca21-ATPase, which required us to employ a variety ofaveraging schemes, involvingGnl(R,Zl), gnl(r,Zl) as well as real-spacedensities. Out of a total of 42 tubular crystals with 20 different helicalsymmetries, 27 tubular crystals spanning seven helical symmetries werechosen for structure analysis (Table 1). Within each helical symmetry,Gnl(R,Zl) were averaged and were used as a reference data set for correctingdistortions of the individual tubes (Unwin, 1993; Beroukhim and Unwin,1997). Where possible, overlapping repeats were chosen for distortioncorrection, thereby maximizing the number of molecules in the data set,even if this resulted in a non-integral number of repeats along a given tube.Defocus values were determined as previously described (Zhang et al.,1998), and the contrast transfer function of the microscope (CTF) wascalculated based on 4.6% amplitude contrast, chosen because of the sim-ilarity of these tubular crystals to those of Ca21-ATPase (Toyoshima et al.,1993b). A weighted sum ofGnl(R,Zl) was calculated for each symmetrygroup, using CTF values for individual repeats as weights during averag-ing; these data were then corrected for the summed value of the CTF(Unwin, 1993). The crystals had p1 symmetry, and data obtained from thenear and far sides of the tubes were kept separate during these andsubsequent manipulations to allow for calculation of phase residuals andFourier shell correlation coefficients (see Fig. 3).
2188 Rice et al.
Biophysical Journal 80(5) 2187–2197
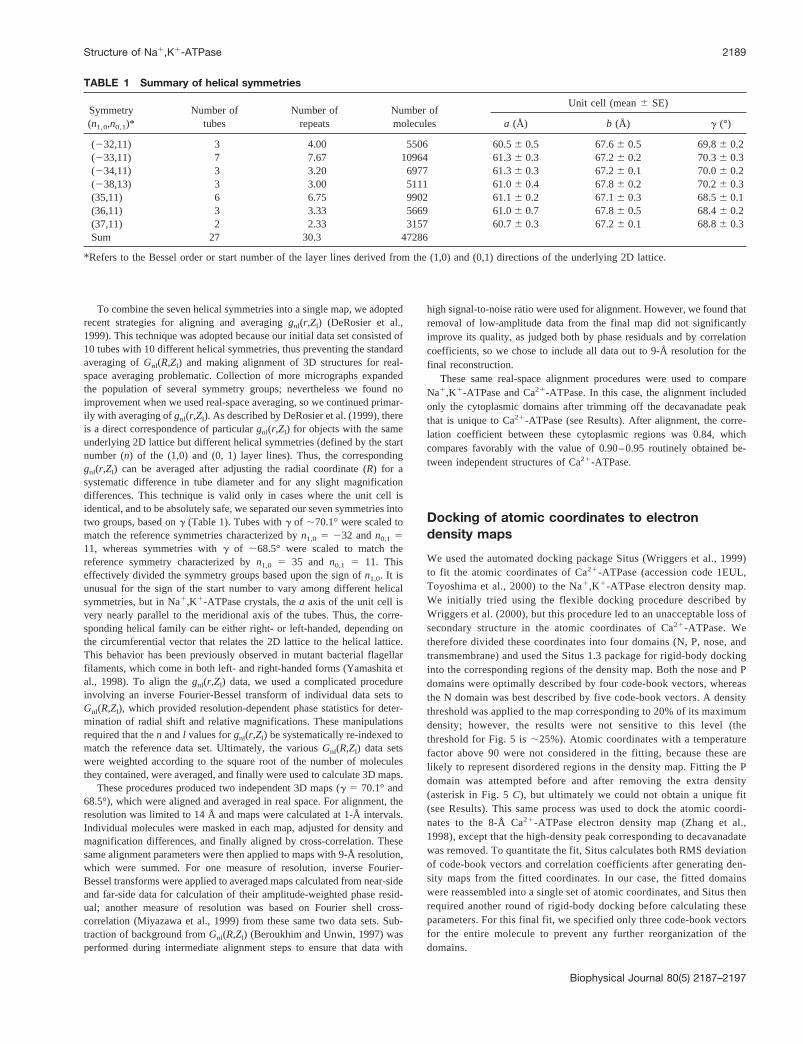
To combine the seven helical symmetries into a single map, we adoptedrecent strategies for aligning and averaginggnl(r,Zl) (DeRosier et al.,1999). This technique was adopted because our initial data set consisted of10 tubes with 10 different helical symmetries, thus preventing the standardaveraging ofGnl(R,Zl) and making alignment of 3D structures for real-space averaging problematic. Collection of more micrographs expandedthe population of several symmetry groups; nevertheless we found noimprovement when we used real-space averaging, so we continued primar-ily with averaging ofgnl(r,Zl). As described by DeRosier et al. (1999), thereis a direct correspondence of particulargnl(r,Zl) for objects with the sameunderlying 2D lattice but different helical symmetries (defined by the startnumber (n) of the (1,0) and (0, 1) layer lines). Thus, the correspondinggnl(r,Zl) can be averaged after adjusting the radial coordinate (R) for asystematic difference in tube diameter and for any slight magnificationdifferences. This technique is valid only in cases where the unit cell isidentical, and to be absolutely safe, we separated our seven symmetries intotwo groups, based ong (Table 1). Tubes withg of ;70.1° were scaled tomatch the reference symmetries characterized byn1,0 5 232 andn0,1 511, whereas symmetries withg of ;68.5° were scaled to match thereference symmetry characterized byn1,0 5 35 and n0,1 5 11. Thiseffectively divided the symmetry groups based upon the sign ofn1,0. It isunusual for the sign of the start number to vary among different helicalsymmetries, but in Na1,K1-ATPase crystals, thea axis of the unit cell isvery nearly parallel to the meridional axis of the tubes. Thus, the corre-sponding helical family can be either right- or left-handed, depending onthe circumferential vector that relates the 2D lattice to the helical lattice.This behavior has been previously observed in mutant bacterial flagellarfilaments, which come in both left- and right-handed forms (Yamashita etal., 1998). To align thegnl(r,Zl) data, we used a complicated procedureinvolving an inverse Fourier-Bessel transform of individual data sets toGnl(R,Zl), which provided resolution-dependent phase statistics for deter-mination of radial shift and relative magnifications. These manipulationsrequired that then andl values forgnl(r,Zl) be systematically re-indexed tomatch the reference data set. Ultimately, the variousGnl(R,Zl) data setswere weighted according to the square root of the number of moleculesthey contained, were averaged, and finally were used to calculate 3D maps.
These procedures produced two independent 3D maps (g 5 70.1° and68.5°), which were aligned and averaged in real space. For alignment, theresolution was limited to 14 Å and maps were calculated at 1-Å intervals.Individual molecules were masked in each map, adjusted for density andmagnification differences, and finally aligned by cross-correlation. Thesesame alignment parameters were then applied to maps with 9-Å resolution,which were summed. For one measure of resolution, inverse Fourier-Bessel transforms were applied to averaged maps calculated from near-sideand far-side data for calculation of their amplitude-weighted phase resid-ual; another measure of resolution was based on Fourier shell cross-correlation (Miyazawa et al., 1999) from these same two data sets. Sub-traction of background fromGnl(R,Zl) (Beroukhim and Unwin, 1997) wasperformed during intermediate alignment steps to ensure that data with
high signal-to-noise ratio were used for alignment. However, we found thatremoval of low-amplitude data from the final map did not significantlyimprove its quality, as judged both by phase residuals and by correlationcoefficients, so we chose to include all data out to 9-Å resolution for thefinal reconstruction.
These same real-space alignment procedures were used to compareNa1,K1-ATPase and Ca21-ATPase. In this case, the alignment includedonly the cytoplasmic domains after trimming off the decavanadate peakthat is unique to Ca21-ATPase (see Results). After alignment, the corre-lation coefficient between these cytoplasmic regions was 0.84, whichcompares favorably with the value of 0.90–0.95 routinely obtained be-tween independent structures of Ca21-ATPase.
Docking of atomic coordinates to electrondensity maps
We used the automated docking package Situs (Wriggers et al., 1999)to fit the atomic coordinates of Ca21-ATPase (accession code 1EUL,Toyoshima et al., 2000) to the Na1,K1-ATPase electron density map.We initially tried using the flexible docking procedure described byWriggers et al. (2000), but this procedure led to an unacceptable loss ofsecondary structure in the atomic coordinates of Ca21-ATPase. Wetherefore divided these coordinates into four domains (N, P, nose, andtransmembrane) and used the Situs 1.3 package for rigid-body dockinginto the corresponding regions of the density map. Both the nose and Pdomains were optimally described by four code-book vectors, whereasthe N domain was best described by five code-book vectors. A densitythreshold was applied to the map corresponding to 20% of its maximumdensity; however, the results were not sensitive to this level (thethreshold for Fig. 5 is;25%). Atomic coordinates with a temperaturefactor above 90 were not considered in the fitting, because these arelikely to represent disordered regions in the density map. Fitting the Pdomain was attempted before and after removing the extra density(asterisk in Fig. 5C), but ultimately we could not obtain a unique fit(see Results). This same process was used to dock the atomic coordi-nates to the 8-Å Ca21-ATPase electron density map (Zhang et al.,1998), except that the high-density peak corresponding to decavanadatewas removed. To quantitate the fit, Situs calculates both RMS deviationof code-book vectors and correlation coefficients after generating den-sity maps from the fitted coordinates. In our case, the fitted domainswere reassembled into a single set of atomic coordinates, and Situs thenrequired another round of rigid-body docking before calculating theseparameters. For this final fit, we specified only three code-book vectorsfor the entire molecule to prevent any further reorganization of thedomains.
TABLE 1 Summary of helical symmetries
Symmetry(n1,0,n0,1)*
Number oftubes
Number ofrepeats
Number ofmolecules
Unit cell (mean6 SE)
a (Å) b (Å) g (°)
(232,11) 3 4.00 5506 60.56 0.5 67.66 0.5 69.86 0.2(233,11) 7 7.67 10964 61.36 0.3 67.26 0.2 70.36 0.3(234,11) 3 3.20 6977 61.36 0.3 67.26 0.1 70.06 0.2(238,13) 3 3.00 5111 61.06 0.4 67.86 0.2 70.26 0.3(35,11) 6 6.75 9902 61.16 0.2 67.16 0.3 68.56 0.1(36,11) 3 3.33 5669 61.06 0.7 67.86 0.5 68.46 0.2(37,11) 2 2.33 3157 60.76 0.3 67.26 0.1 68.86 0.3Sum 27 30.3 47286
*Refers to the Bessel order or start number of the layer lines derived from the (1,0) and (0,1) directions of the underlying 2D lattice.
Structure of Na1,K1-ATPase 2189
Biophysical Journal 80(5) 2187–2197

RESULTS AND DISCUSSION
Crystallization and structure determination
For crystallization, we used native microsomes from ducksupraorbital glands (Martin and Sachs, 1999) and bufferconditions that were discovered almost 20 years ago(Skriver et al., 1981). These conditions include orthovana-date, which inhibits most if not all P-type ATPases bymimicking the transition state for phosphorylation-dephos-phorylation in the E2 state (Cantley et al., 1978). However,we found that although orthovanadate increased the propor-tion of crystalline material, it was not absolutely essentialfor crystallization. This suggests that the stabilization of theE2 conformation by K1 and Mg21 may be the key tocrystallization. Indeed, stabilization of E2-P with ouabainprevented crystallization altogether. A similar conclusionwas reached for Ca21-ATPase crystals, which requireEGTA and decavanadate; thapsigargin forms a dead-endcomplex with Ca21-ATPase in the E2 conformation andthus dramatically stabilizes these crystals (Sagara et al.,1992; Stokes and Lacapere, 1994).
Our Na1,K1-ATPase crystals adopted a wide variety ofmorphologies (Fig. 1), but tubular crystals were chosen foranalysis because their helical symmetry offered a conve-nient means of determining 3D structure (DeRosier and
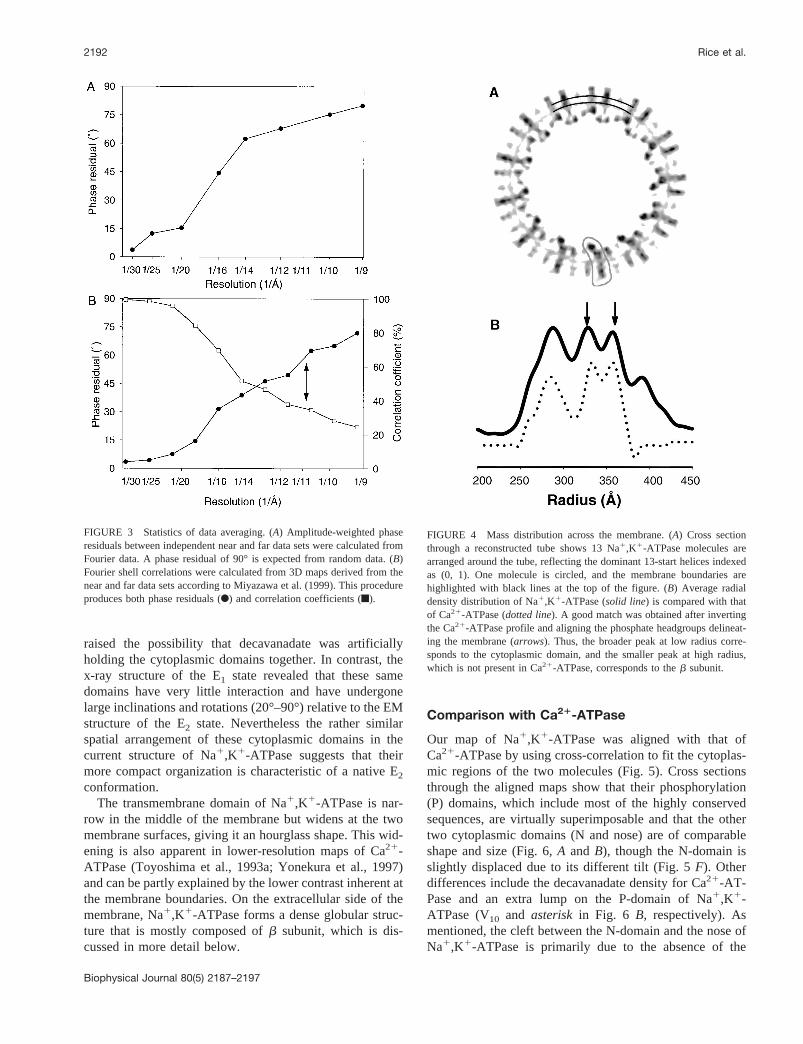
Moore, 1970). Unlike flat 2D crystals, these tubular crystalsdo not require tilting, and the resulting resolution is isotro-pic due to their inherent cylindrical symmetry. Images oftubular crystals in the frozen hydrated state were recordedand the underlying helical symmetry was characterized byassigning Bessel orders to the primary layer lines compos-ing the Fourier transform (Fig. 2). A total of 27 tubes fallinginto seven helical symmetries were used for our reconstruc-tion (Table 1). We used standard techniques for Fourierspace averaging within each helical symmetry. The symme-try groups were divided into two parts based on their unitcells, and Fourier-Bessel components were averaged withinthese groups (DeRosier et al., 1999). Density maps werethen calculated for both unit cells, and real-space averagingwas used to generate the final structure. Measures of phaseresiduals and correlation coefficients are shown in Fig. 3;although phase residuals are better than random and there ispositive correlation all the way to 9 Å, our inability toresolve anya helices (e.g., transmembrane helices) suggeststhat the effective resolution is somewhat worse than 10 Å.At 11 Å, the phase residual (62°) and correlation coefficient(0.37) compare favorably with the corresponding values(60° and 0.3) reported by Miyazawa et al. (1999) for tubularcrystals of the nicotinic acetylcholine receptor.
Orientation in the membrane
The orientation of Na1,K1-ATPase in the membrane can bededuced from cross sections through the tubes (Fig. 4A).The membrane appears as two discontinuous regions ofhigh density that circumnavigate the section, and individualmolecules appear to protrude from both sides of this mem-brane. The membrane borders are more precisely defined bycircumferentially averaging the mass distribution across thetube, and the resulting profile (Fig. 4B) reveals two peakscorresponding to electron-dense phosphates from the lipidheadgroups. This high scattering density also results in lowcontrast and consequent blurring of the molecule at themembrane borders. Both the cross section and the averagedmass distribution show that the majority of the molecularmass is located inside the tube, with a smaller mass on theoutside. This is opposite to the tubular crystals of Ca21-ATPase, in which most of the mass, corresponding to thecytoplasmic domain, is located outside of the tube (Toyo-shima et al., 1993a). Nevertheless, if the Ca21-ATPaseprofile is inverted, it closely resembles that of the Na1,K1-ATPase, except for the smaller extra density on the outsideof the Na1,K1-ATPase tubes (Fig. 4B). This implies thatinternal densities in the Na1,K1-ATPase tubes correspondto the cytoplasmic domains and external densities to thebsubunit. These assignments are consistent with ATPaseactivity measurements of microsomes before crystallization,which require detergent permeabilization for full activity(Martin and Sachs, 1999; our unpublished data). Also, whena single molecule from the map is contoured to correspond
FIGURE 1 Negatively stained crystals of Na1,K1-ATPase. Most of thevesicles contained ordered arrays and many developed distorted cornersreflecting the underlying arrays. A small proportion of vesicles elongatedinto tubes;800 Å in diameter, which contained a helical array of Na1,K1-ATPase molecules.
2190 Rice et al.
Biophysical Journal 80(5) 2187–2197

to the appropriate molecular mass of 147 kDa, 54% is insidethe tube, 23% is within the membrane, and 23% is outsidethe tube, which is consistent with predictions based on a10-transmembrane helixa-chain model (58%, 17%, and25%, respectively; Moller et al., 1996). The overestimate inthe percentage within the membrane is likely to be a con-sequence of the low contrast at the membrane boundary.Carbohydrate groups, which are heterogeneous and likely tobe disordered, were not included in these predicted sizes.
Overall shape of Na1,K1-ATPase
The molecular envelope of the reconstructed Na1,K1-ATPase is shown in Fig. 5. On the cytoplasmic side of themembrane, the Na1,K1-ATPasea subunit consists of astalk just above the membrane, which is connected to atripartite head extending;75 Å above the membrane. Gen-erally speaking, this structure is consistent with previous
reconstructions of Na1,K1-ATPase (Mohraz et al., 1987;Skriver et al., 1992; Hebert et al., 1985, 1988), but withmore clearly defined domains and membrane topology. Thecytoplasmic headpiece is reminiscent of that from Ca21-ATPase in the E2 conformation, which consists of a highlyconserved phosphorylation domain (P) sitting on top of anarrow stalk with a nose pointing to one side and a nucle-otide-binding domain (N) above (Toyoshima et al., 2000).Two notable differences are a cleft that separates the nosefrom the N-domain and a protrusion on top of the P-domain(Fig. 5 C, asterisk). This protrusion is involved in a strongcrystal contact with the N-domain of the adjacent molecule(Fig. 5 C, arrow) and the cleft corresponds to a very highdensity in the Ca21-ATPase map, which has been associatedwith an intramolecular site for decavanadate (Stokes andGreen, 2000; Toyoshima et al., 2000). The location of thissite at the intersection of the three main cytoplasmic do-mains together with the polyanionic nature of decavanadate
FIGURE 2 Image and Fourier data for a frozen-hydrated tube. (A) Electron micrograph of a tubular crystal embedded in amorphous ice at2180°C. Scalebar, 100 nm. (B) The calculated diffraction pattern of the tube is composed of a set of layer lines, three of which have been indexed according to the Millerindices (h, k) of the underlying 2D lattice. Layer lines as high as (2, 4) were often visible, corresponding to approximately 1/16-Å resolution. (C) Amplitudesand phases for layer lines labeled inB, which are consistent with p1 symmetry. Amplitude units are arbitrary but indicate the relative intensities of layerline data. Each layer line is labeled according to an (h, k) index and helical start number (n).
Structure of Na1,K1-ATPase 2191
Biophysical Journal 80(5) 2187–2197
raised the possibility that decavanadate was artificiallyholding the cytoplasmic domains together. In contrast, thex-ray structure of the E1 state revealed that these samedomains have very little interaction and have undergonelarge inclinations and rotations (20°–90°) relative to the EMstructure of the E2 state. Nevertheless the rather similarspatial arrangement of these cytoplasmic domains in thecurrent structure of Na1,K1-ATPase suggests that theirmore compact organization is characteristic of a native E2
conformation.The transmembrane domain of Na1,K1-ATPase is nar-
row in the middle of the membrane but widens at the twomembrane surfaces, giving it an hourglass shape. This wid-ening is also apparent in lower-resolution maps of Ca21-ATPase (Toyoshima et al., 1993a; Yonekura et al., 1997)and can be partly explained by the lower contrast inherent atthe membrane boundaries. On the extracellular side of themembrane, Na1,K1-ATPase forms a dense globular struc-ture that is mostly composed ofb subunit, which is dis-cussed in more detail below.
Comparison with Ca21-ATPase
Our map of Na1,K1-ATPase was aligned with that ofCa21-ATPase by using cross-correlation to fit the cytoplas-mic regions of the two molecules (Fig. 5). Cross sectionsthrough the aligned maps show that their phosphorylation(P) domains, which include most of the highly conservedsequences, are virtually superimposable and that the othertwo cytoplasmic domains (N and nose) are of comparableshape and size (Fig. 6,A and B), though the N-domain isslightly displaced due to its different tilt (Fig. 5F). Otherdifferences include the decavanadate density for Ca21-AT-Pase and an extra lump on the P-domain of Na1,K1-ATPase (V10 and asterisk in Fig. 6 B, respectively). Asmentioned, the cleft between the N-domain and the nose ofNa1,K1-ATPase is primarily due to the absence of the
FIGURE 3 Statistics of data averaging. (A) Amplitude-weighted phaseresiduals between independent near and far data sets were calculated fromFourier data. A phase residual of 90° is expected from random data. (B)Fourier shell correlations were calculated from 3D maps derived from thenear and far data sets according to Miyazawa et al. (1999). This procedureproduces both phase residuals (F) and correlation coefficients (f).
FIGURE 4 Mass distribution across the membrane. (A) Cross sectionthrough a reconstructed tube shows 13 Na1,K1-ATPase molecules arearranged around the tube, reflecting the dominant 13-start helices indexedas (0, 1). One molecule is circled, and the membrane boundaries arehighlighted with black lines at the top of the figure. (B) Average radialdensity distribution of Na1,K1-ATPase (solid line) is compared with thatof Ca21-ATPase (dotted line). A good match was obtained after invertingthe Ca21-ATPase profile and aligning the phosphate headgroups delineat-ing the membrane (arrows). Thus, the broader peak at low radius corre-sponds to the cytoplasmic domain, and the smaller peak at high radius,which is not present in Ca21-ATPase, corresponds to theb subunit.
2192 Rice et al.
Biophysical Journal 80(5) 2187–2197
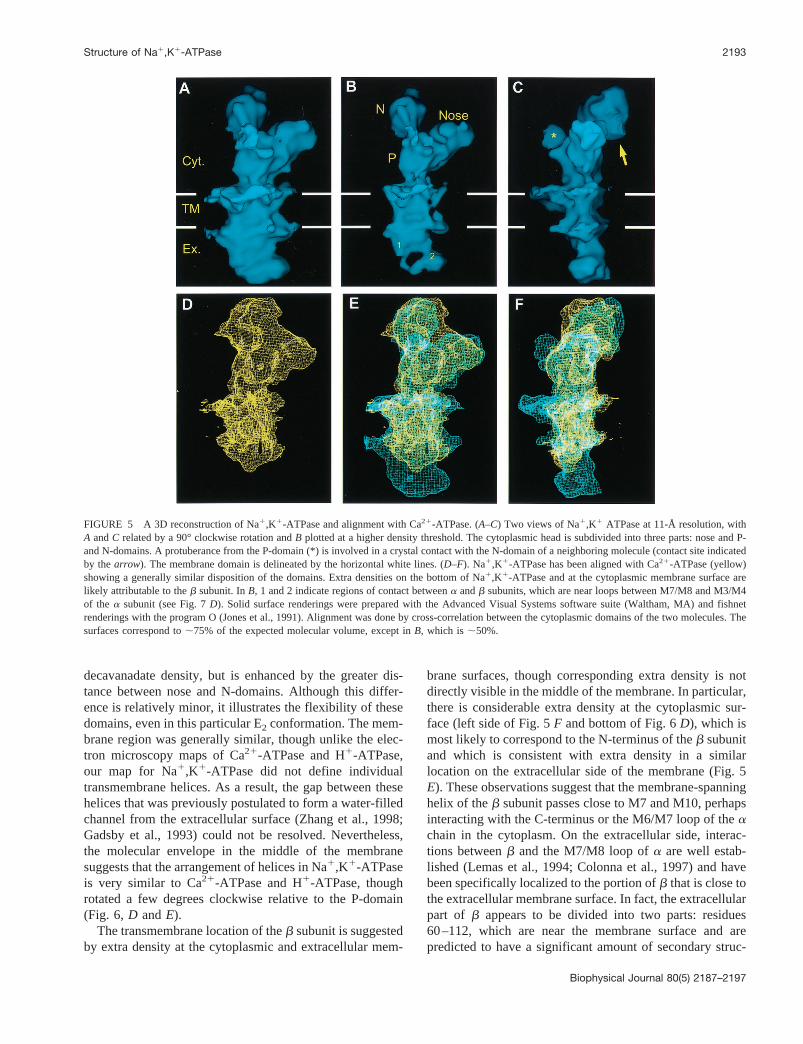
decavanadate density, but is enhanced by the greater dis-tance between nose and N-domains. Although this differ-ence is relatively minor, it illustrates the flexibility of thesedomains, even in this particular E2 conformation. The mem-brane region was generally similar, though unlike the elec-tron microscopy maps of Ca21-ATPase and H1-ATPase,our map for Na1,K1-ATPase did not define individualtransmembrane helices. As a result, the gap between thesehelices that was previously postulated to form a water-filledchannel from the extracellular surface (Zhang et al., 1998;Gadsby et al., 1993) could not be resolved. Nevertheless,the molecular envelope in the middle of the membranesuggests that the arrangement of helices in Na1,K1-ATPaseis very similar to Ca21-ATPase and H1-ATPase, thoughrotated a few degrees clockwise relative to the P-domain(Fig. 6, D andE).
The transmembrane location of theb subunit is suggestedby extra density at the cytoplasmic and extracellular mem-
brane surfaces, though corresponding extra density is notdirectly visible in the middle of the membrane. In particular,there is considerable extra density at the cytoplasmic sur-face (left side of Fig. 5F and bottom of Fig. 6D), which ismost likely to correspond to the N-terminus of theb subunitand which is consistent with extra density in a similarlocation on the extracellular side of the membrane (Fig. 5E). These observations suggest that the membrane-spanninghelix of theb subunit passes close to M7 and M10, perhapsinteracting with the C-terminus or the M6/M7 loop of theachain in the cytoplasm. On the extracellular side, interac-tions betweenb and the M7/M8 loop ofa are well estab-lished (Lemas et al., 1994; Colonna et al., 1997) and havebeen specifically localized to the portion ofb that is close tothe extracellular membrane surface. In fact, the extracellularpart of b appears to be divided into two parts: residues60–112, which are near the membrane surface and arepredicted to have a significant amount of secondary struc-
FIGURE 5 A 3D reconstruction of Na1,K1-ATPase and alignment with Ca21-ATPase. (A–C) Two views of Na1,K1 ATPase at 11-Å resolution, withA andC related by a 90° clockwise rotation andB plotted at a higher density threshold. The cytoplasmic head is subdivided into three parts: nose and P-and N-domains. A protuberance from the P-domain (*) is involved in a crystal contact with the N-domain of a neighboring molecule (contact site indicatedby thearrow). The membrane domain is delineated by the horizontal white lines. (D–F). Na1,K1-ATPase has been aligned with Ca21-ATPase (yellow)showing a generally similar disposition of the domains. Extra densities on the bottom of Na1,K1-ATPase and at the cytoplasmic membrane surface arelikely attributable to theb subunit. InB, 1 and 2 indicate regions of contact betweena andb subunits, which are near loops between M7/M8 and M3/M4of the a subunit (see Fig. 7D). Solid surface renderings were prepared with the Advanced Visual Systems software suite (Waltham, MA) and fishnetrenderings with the program O (Jones et al., 1991). Alignment was done by cross-correlation between the cytoplasmic domains of the two molecules. Thesurfaces correspond to;75% of the expected molecular volume, except inB, which is;50%.
Structure of Na1,K1-ATPase 2193
Biophysical Journal 80(5) 2187–2197

ture, and residues 125–302, which have little predictedsecondary structure but contain the three disulfide bondsand three glycosylation sites. Indeed, when our map isdisplayed at a high-density cutoff (Fig. 5B), theb subunitappears as two discrete densities connected by a narrowloop. The portion closer to the membrane (labeled 1 in Fig.5 B) is well positioned to interact with the M7/M8 loop ofa, whereas the distal portion ofb is larger and less inti-mately associated with this M7/M8 loop. Nevertheless, thisdistal portion does appear to contact thea subunit near theM3/M4 loop (contact labeled 2 in Fig. 5B) and potentiallyto cover the putative, water-filled cavity leading to theion-binding sites.
Fitting of Ca21-ATPase coordinates
To further aid our modeling of Na1,K1-ATPase, we em-ployed both manual and automated docking of atomic co-ordinates to electron density maps. We started by dividingthe atomic coordinates for the E1 state of Ca21-ATPase(PDB accession code 1EUL) into three parts (nose, P-, andN-domains) and then did the same for the electron densitymap of Na1,K1-ATPase. We then used Situs 1.3 (Wriggerset al., 1999, 2000) to dock each of the three domainsindividually by rigid-body movement. For the N-domainand nose, we were able to choose between several equallylikely fits based on the connectivity of the N- and C-terminiwith other parts of the molecule. However, fitting of theP-domain produced 12 different models with equivalentcorrelation coefficients, probably due to the symmetricalshape of this region and the extensive editing at domaininterfaces before docking. When these same procedureswere applied to the 8-Å Ca21-ATPase map, the higherresolution and fidelity of sequence produced unique fits forall three domains (manuscript in preparation). Furthermore,the resulting model visually resembled that described byToyoshima et al. (2000). We therefore docked the P domainmanually into our Na1,K1-ATPase map, using our fitting tothe Ca21-ATPase map as a guide. The resulting fit (Fig. 7)is characterized by a correlation coefficient of 0.601, com-pared with a value of 0.623 for automated docking to theCa21-ATPase map.
FIGURE 6 Cross sections through the aligned Na1,K1-ATPase andCa21-ATPase molecules shown in Fig. 5. (A) The shape of the N-domain
is well conserved, though the entire domain is shifted. (B) V10 indicates thedecavandate binding site between the N-domain and the nose on Ca21-ATPase, and the asterisk indicates the protuberance from the P-domain ofNa1,K1-ATPase (seen also in Fig. 5). (C) The shape of the P-domain isexceedingly well conserved, which is consistent with its high degree ofsequence homology. (D) The cytoplasmic membrane surface of Na1,K1-ATPase has extra density on the bottom, which likely corresponds to theN-terminal part of theb subunit. This region is noisier due to the presenceof the lipid phosphates. (E) The inset indicates the position of transmem-brane helices in Ca21-ATPase together with their sequence based on thex-ray structure. The level of each section is indicated by the bar across theinset on the upper right of each panel.
2194 Rice et al.
Biophysical Journal 80(5) 2187–2197

Visual inspection of the docked coordinates showed thatvarious surface loops from the Ca21-ATPase coordinates fitpoorly within the Na1,K1-ATPase map. In contrast, theCa21-ATPase map generally had bulges that accommodatedthese loops (not shown). By referring to a recent sequencealignment (Stokes and Green, 2000), we found that thebadly matched loops could all be explained by variations inthe amino acid sequences of Ca21-ATPase and Na1,K1-ATPase. In particular, the prominent protrusion from theP-domain of Na1,K1-ATPase is close to the variable loopbetween residues 644 and 650 in Ca21-ATPase, which isfollowed by an insertion of 20 amino acids in the Na1,K1-ATPase sequence (after Glu635 of Na1,K1-ATPase); the
size of this insertion is consistent with the size of the extradensity. In the crystals, this region contacts the N-domain ofadjacent molecules, tempting us to speculate that this loopmight mediate the self-association ofa subunits, which haspreviously been attributed to the sequence Arg554-Pro785(Koster et al., 1995).
To explain the loops that protrude from the Na1,K1-ATPase density (Fig. 7), this same sequence alignmentpredicted deletions from Ca21-ATPase residues 374–392and 457–468, which correspond to two of these surfaceloops. Ca21-ATPase residues 397–402 compose a specificinteraction site for phospholamban (Toyofuku et al., 1994),so it is not surprising that this structural feature is not
FIGURE 7 Fitting of Ca21-ATPase coordinates in the E1 conformation to the map of Na1,K1-ATPase in the E2 conformation. Automated docking ofatomic coordinates to electron density maps was performed using the program Situs 1.3 (Wriggers et al., 1999). Each cytoplasmic domain was separatelydocked to the corresponding region of Na1,K1-ATPase. The side chain of Asp351 of Ca21-ATPase, which is analogous to Asp369 of Na1,K1-ATPaseand is phosphorylated by ATP, is shown as a white space-filling model. (A–C) Three different views of the cytoplasmic domains with protruding surfaceloops identified according to their Ca21-ATPase sequence. (D) Side view of the entire molecule illustrating the relationship of the transmembrane domainto these cytoplasmic domains. The magenta ribbon corresponds to the location of these helices after rigid-body fitting of the P-domain into theNa1,K1-ATPase map. The white ribbons illustrate a more reasonable fit to the density map. This suggests an;40° inclination and;30° rotation of theP-domain relative to the transmembrane domain during the E2 to E1 conformational change. The figure was created with Swiss PDB viewer(http://expasy.cbr.nrc.ca/spdbv) with the final rendering done by POVray (http://www.povray.org).
Structure of Na1,K1-ATPase 2195
Biophysical Journal 80(5) 2187–2197

conserved in Na1,K1-ATPase. Ca21-ATPase residues574–589 form a highly exposed “crown” helix preceded byan extended loop; although there is no corresponding dele-tion in the Na1,K1-ATPase sequence, this region shows noreal homology and, in fact, is deleted in the correspondingH1-ATPase and CadA sequences. Finally, the loop 428–433 corresponds to a three-residue insert in Na1,K1-ATPase, which is near its T1 tryptic cleavage site (R438)that is accessible in E2 but not in E1 (Jorgensen andAndersen, 1988). The protrusion of the latter two loopssuggests that the corresponding Na1,K1-ATPase loops areeither disordered or folded differently.
In addition to rearranging these cytoplasmic domains,this E2-to-E1 conformational change also induces a largedisplacement of the transmembrane domain relative to theP-domain (Fig. 7D). After positioning the P-domain, an;40° inclination and;30° rotation is required to fit thetransmembrane helices from the E1 Ca21-ATPase crystalstructure into the E2 map of Na1,K1-ATPase (Fig. 7D); asimilar movement is required to match the E2 map ofCa21-ATPase. In actuality, the membrane domain mostlikely remains fixed and the binding of Ca21 or Na1 in-duces the corresponding movement of the P-domain as wellas an ;80° counter-rotation of the nose and an;20°inclination of the N-domain, all of which serve to dissociatethe cytoplasmic domains and provide wide-open access tothe site of phosphorylation.
CONCLUSION
In summary, we have presented a structure of Na1,K1-ATPase at 11-Å resolution in the E2 conformation. Threeregions of the cytoplasmic domain (nose, N-, and P-do-mains) could be clearly seen and were arranged similarly toCa21-ATPase in the E2 conformation. This result indicatesnot only that Na1,K1-ATPase has a similar architecture toCa21-ATPase but also that the conformational changes pre-viously postulated to couple nucleotide and ion sites arelikely to occur in all P-type ATPases. In particular, the E2
conformation appears to consist of a compact arrangementof cytoplasmic domains, whereas binding of the primary ion(e.g., Na1 or Ca21) induces the E1 conformation, thusloosening the association between these domains. This re-sults in large inclinations and rotations of intact domainswithout apparently altering the arrangement of secondarystructure within the domains; results from spectroscopy,chemical modification, and proteolysis of both Na1,K1-ATPase and Ca21-ATPase are consistent with suchchanges. By fitting the atomic coordinates for Ca21-ATPasein the E1 conformation to our map of Na1,K1-ATPase inthe E2 conformation, we correlated most of the variableparts of the sequence with surface-exposed loops. Also, itwas apparent that the conformational change involved alarge inclination and rotation of the phosphorylation domainrelative to the transmembrane domain. Although we could
not resolve individual helices within the membrane, ourstructure allowed us to postulate the location of theb-sub-unit transmembrane helix neara-subunit helices M7 andM10. In addition, the extracellular portion ofb may havetwo sites of interaction with thea subunit. In future workwe will increase the number of images included in ourreconstruction in an attempt to improve resolution. Such astrategy has been successful for Ca21-ATPase, which im-proved from 14 to 8 Å with a fivefold increase in thenumber of tubes (Zhang et al., 1998), and nicotinic acetyl-choline receptor, which has been defined to 4.6 Å(Miyazawa et al., 1999). For Na1,K1-ATPase, we hope thatthe next step will reveal the packing of membrane-spanninghelices and will better define the interaction betweena andb subunits.
We thank N. Unwin for the use of programs for helical image analysis, C.Toyoshima for the use of programs for CTF estimation, and S. Darst for theuse of programs for helical re-indexing.
This work was supported by National Institutes of Health grants GM56960(D.L.S.) and DK19185 (J.R.S.). W.J.R. was supported by a postdoctoralfellowship from the Human Frontier Science Program. H.S.Y. was sup-ported by a Scientist Development grant from the American Heart Asso-ciation, Heritage Affiliate.
REFERENCES
Abriel, H., U. Hasler, K. Geering, and J. D. Horisberger. 1999. Role of theintracellular domain of the beta subunit in Na,K pump function.Bio-chim. Biophys. Acta.1418:85–96.
Beroukhim, R., and N. Unwin. 1997. Distortion correction of tubularcrystals: improvements in the acetylcholine receptor structure.Ultrami-croscopy.70:57–81.
Cantley, L. C., Jr., L. G. Cantley, and L. Josephson. 1978. A character-ization of vanadate interactions with the (Na,K)-ATPase: mechanisticand regulatory implications.J. Biol. Chem.253:7361–7368.
Colonna, T. E., L. Huynh, and D. M. Fambrough. 1997. Subunit interac-tions in the Na,K-ATPase explored with the yeast two-hybrid system.J. Biol. Chem.272:12366–12372.
DeRosier, D. J., and P. B. Moore. 1970. Reconstruction of three-dimensional images from electron micrographs of structures with helicalsymmetry.J. Mol. Biol. 52:355–369.
DeRosier, D., D. L. Stokes, and S. A. Darst. 1999. Averaging data derivedfrom images of helical structures with different symmetries.J. Mol. Biol.289:159–165.
Gadsby, D. C., R. F. Rakowski, and P. De Weer. 1993. Extracellular accessto the Na,K pump: pathway similar to ion channel.Science.260:100–103.
Glynn, I. M. 1985. The Na1,K1-transporting adenosine triphosphatase.InThe Enzymes of Biological Membranes. A. N. Martonosi, editor. Ple-num Press, New York. 35–114.
Goldshleger, R., and S. J. Karlish. 1999. The energy transduction mecha-nism of Na,K-ATPase studied with iron-catalyzed oxidative cleavage.J. Biol. Chem.274:16213–16221.
Hasler, U., X. Wang, G. Crambert, P. Beguin, F. Jaisser, J. D. Horisberger,and K. Geering. 1998. Role of beta-subunit domains in the assembly,stable expression, intracellular routing, and functional properties ofNa,K-ATPase.J. Biol. Chem.273:30826–30835.
Hebert, H., E. Skriver, and A. B. Maunsbach. 1985. Three-dimensionalstructure of renal Na,K-ATPase determined by electron microscopy ofmembrane crystals.FEBS Lett.187:182–186.
2196 Rice et al.
Biophysical Journal 80(5) 2187–2197

Hebert, H., E. Skriver, M. Soderholm, and A. B. Maunsbach. 1988.Three-dimensional structure of renal Na,K-ATPase determined fromtwo-dimensional membrane crystals of the p1 form.J. Ultrastruct. Mol.Struct. Res.100:86–93.
Jencks, W. P. 1989. How does a calcium pump pump calcium?J. Biol.Chem.264:18855–18858.
Jones, T. A., J. Y. Zou, S. W. Cowan, and M. Kjeldgaard. 1991. Improvedmethods for binding protein models in electron density maps and thelocation of errors in these models.Acta Crystallogr. A.47:110–119.
Jorgensen, P. L. 1975. Purification and characterization of (Na1,K1)-ATPase. V. Conformational changes in the enzyme: transitions betweenthe Na-form and the K-form studied with tryptic digestion as a tool.Biochim. Biophys. Acta.401:399–415.
Jorgensen, P. L., and J. P. Andersen. 1988. Structural basis for E1-E2
conformational transitions in Na,K-pump and Ca-pump proteins.J. Membr. Biol.103:95–120.
Jorgensen, P. L., and I. Klodos. 1978. Purification and characterization of(Na1 1 K1)-ATPase. VII. Tryptic degradation of the Na-form of theenzyme protein resulting in selective modification of dephosphorylationreactions of the (Na1 1 K1)-ATPase.Biochim. Biophys. Acta.507:8–16.
Kapakos, J. G., and M. Steinberg. 1982. Fluorescent labeling of (Na1 1K1)-ATPase by 5-iodoacetamidofluorescein.Biochim. Biophys. Acta.693:493–496.
Karlish, S. J. 1980. Characterization of conformational changes in (Na,K)ATPase labeled with fluorescein at the active site.J. Bioenerg. Bi-omembr.12:111–136.
Karlish, S. J., and D. W. Yates. 1978. Tryptophan fluorescence of (Na1 1K1)-ATPase as a tool for study of the enzyme mechanism.Biochim.Biophys. Acta.527:115–130.
Kessi, J., J. C. Poiree, E. Wehrli, R. Bachofen, G. Semenza, and H. Hauser.1994. Short-chain phosphatidylcholines as superior detergents in solu-bilizing membrane proteins and preserving biological activity.Biochem.33:10825–10836.
Klug, A., F. H. C. Crick, and H. W. Wyckoff. 1958. Diffraction by helicalstructures.Acta Cryst.11:199–213.
Koster, J. C., G. Blanco, and R. W. Mercer. 1995. A cytoplasmic region ofthe Na,K-ATPase alpha-subunit is necessary for specific alpha/alphaassociation.J. Biol. Chem.270:14332–14339.
Kuhlbrandt, W., M. Auer, and G. A. Scarborough. 1998. Structure ofP-type ATPases.Curr. Opin. Struct. Biol.8:510–516.
Lemas, M. V., M. Hamrick, K. Takeyasu, and D. M. Fambrough. 1994. 26amino acids of an extracellular domain of the Na,K-ATPase alpha-subunit are sufficient for assembly with the Na,K-ATPase beta-subunit.J. Biol. Chem.269:8255–8259.
Martin, D. W., and J. R. Sachs. 1999. Preparation of Na1,K1-ATPase withnear maximal specific activity and phosphorylation capacity: evidencethat the reaction mechanism involves all of the sites.Biochemistry.38:7485–7897.
Miyazawa, A., Y. Fujiyoshi, M. Stowell, and N. Unwin. 1999. Nicotinicacetylcholine receptor at 4.6 Å resolution: transverse tunnels in thechannel wall.J. Mol. Biol. 288:765–786.
Mohraz, M., M. V. Simpson, and P. R. Smith. 1987. The three-dimensionalstructure of the Na,K-ATPase from electron microscopy.J. Cell. Biol.105:1–8.
Moller, J. V., B. Juul, and M. le Maire. 1996. Structural organization, iontransport, and energy transduction of ATPases.Biochim. Biophys. Acta.1286:1–51.
Patchornik, G., R. Goldshleger, and S. J. Karlish. 2000. The complexATP-Fe21 serves as a specific affinity cleavage reagent in ATP-Mg21
sites of Na,K-ATPase: altered ligation of Fe21 (Mg21) ions accompaniesthe E1P3 E2P conformational change.Proc. Natl. Acad. Sci. U.S.A.97:11954–11959.
Sagara, Y., J. B. Wade, and G. Inesi. 1992. A conformational mechanismfor formation of a dead-end complex by the sarcoplasmic reticulumATPase with thapsigargin.J. Biol. Chem.267:1286–1292.
Skou, J. C. 1957. The influence of some cations on an adenosine triphos-phatase from peripheral nerves.Biochim. Biophys. Acta.23:394–401.
Skriver, E., U. Kaveus, H. Hebert, and A. B. Maunsbach. 1992. Three-dimensional structure of Na,K-ATPase determined from membranecrystals induced by cobalt-tetrammine-ATP.J. Struct. Biol. 108:176–185.
Skriver, E., A. B. Maunsbach, and P. L. Jorgensen. 1981. Formation oftwo-dimensional crystals in pure membrane-bound Na1/K1-ATPase.FEBS Lett.131:219–222.
Stokes, D. L., M. Auer, P. Zhang, and W. Kuehlbrandt. 1999. Comparisonof H1-ATPase and Ca21-ATPase suggests that a large conformationalchange initiates P-type ion pump reaction cycles.Curr. Biol. 9:672–679.
Stokes, D. L., and N. M. Green. 2000. Modeling a dehalogenase fold intothe 8-Å density map for Ca21-ATPase defines a new domain structure.Biophys. J.78:1765–1776.
Stokes, D. L., and J.-J. Lacapere. 1994. Conformation of Ca21-ATPase intwo crystal forms: effects of Ca21, thapsigargin, AMP-PCP, and Cr-ATPon crystallization.J. Biol. Chem.269:11606–11613.
Toyofuku, T., K. Kurzydlowski, M. Tada, and D. H. MacLennan. 1994.Amino acids Lys-Asp-Asp-Lys-Pro-Val402 in the Ca21-ATPase of car-diac sarcoplasmic reticulum are critical for functional association withphospholamban.J. Biol. Chem.269:22929–22932.
Toyoshima, C., M. Nakasako, H. Nomura, and H. Ogawa. 2000. Crystalstructure of the calcium pump of sarcoplasmic reticulum at 2.6 Åresolution.Nature.405:647–655.
Toyoshima, C., H. Sasabe, and D. L. Stokes. 1993a. Three-dimensionalcryo-electron microscopy of the calcium ion pump in the sarcoplasmicreticulum membrane.Nature.362:469–471.
Toyoshima, C., K. Yonekura, and H. Sasabe. 1993b. Contrast transfer forfrozen-hydrated specimens. II. Amplitude contrast at very low frequen-cies.Ultramicroscopy.48:165–176.
Unwin, N. 1993. Nicotinic acetylcholine receptor at 9 Å resolution.J. Mol.Biol. 229:1101–1124.
Wriggers, W., R. K. Agrawal, D. L. Drew, A. McCammon, and J. Frank.2000. Domain motions of EF-G bound to the 70S ribosome: insightsfrom a hand-shaking between multi-resolution structures.Biophys. J.79:1670–1678.
Wriggers, W., R. A. Milligan, and J. A. McCammon. 1999. Situs: apackage for docking crystal structures into low-resolution maps fromelectron microscopy.J. Struct. Biol.125:185–195.
Yamashita, I., K. Hasegawa, H. Suzuki, F. Vonderviszt, Y. Mimori-Kiyosue, and K. Namba. 1998. Structure and switching of bacterialflagellar filaments studied by x-ray fiber diffraction.Nat. Struct. Biol.5:125–32.
Yonekura, K., D. L. Stokes, H. Sasabe, and C. Toyoshima. 1997. TheATP-binding site of Ca21-ATPase revealed by electron image analysis.Biophys. J.72:997–1005.
Zhang, P., C. Toyoshima, K. Yonekura, N. M. Green, and D. L. Stokes.1998. Structure of the calcium pump from sarcoplasmic reticulum at 8 Åresolution.Nature.392:835–839.
Structure of Na1,K1-ATPase 2197
Biophysical Journal 80(5) 2187–2197