jwsr v10n2 - bichler & nitzan - dominant capital and the
TRANSCRIPT

The recent shift from ‘global villageism’ to the ‘new wars’ revealed a deep crisis in het-erodox political economy. The popular belief in neoliberal globalization, peace dividends, fiscal conservatism and sound finance that dominated the 1980s and 1990s suddenly col-lapsed. The early 2000s brought rising xeno-phobia, growing military budgets and policy profligacy. Radicals were the first to identify this transition, but their attempts to explain it have been bogged down by two major hurdles: (1) most writers continue to apply nineteenth century theories and concepts to twenty-first century realities; and (2) few seem to bother with empirical analysis.
This paper offers a radical alternative that is both theoretically new and empirically grounded. We use the ‘new wars’ as a stepping stone to understand a triple transformation that altered the nature of capital, the accumu-lation of capital and the unit of capital. Specif-ically, our argument builds on a power under-standing of capital that emphasizes differen-tial accumulation by dominant capital groups. Accumulation, we argue, has little to do with the amassment of material things measured
in ‘utils’ or ‘abstract labor.’ Instead, accumu-lation, or ‘capitalization,’ represents a com-modification of power by leading groups in society. Over the past century, this power has been re-structured and concentrated through two distinct regimes of differential accumula-tion—‘breadth’ and ‘depth.’ A breadth regime relies on proletarianization, on green-field investment and, particularly, on mergers and acquisitions. A depth regime builds on redis-tribution through stagflation—that is, on dif-ferential inf lation in the midst of stagnation. In contrast to breadth which presupposes some measure of growth and stability, depth thrives on ‘accumulation through crisis.’
The past twenty years were dominated by breadth, buttressed by neoliberal rheto-ric, globalization and capital mobility. This regime started to run into mounting difficul-ties in the late 1990s, and eventually collapsed in 2000. For differential accumulation to con-tinue, dominant capital now needs inflation, and inflation requires instability and social crisis. It is within this broader dynamics of power accumulation that the new wars need to be understood.
abstract

255
Dominant Capital and the New Wars¹
journal of world-systems research, x, , summer , –http://jwsr.ucr.edu/issn 1076–156x ©2004 Shimshon Bichler & Jonathan Nitzan
The new wars of the early 2000s mark a signifi cant turning point in world aff airs. During the 1980s and 1990s, it was popular to talk about the return
of ‘unregulated capitalism.’ It was the dawn of a new era, many said, the era of ‘neoliberal globalization.’ Th e hallmarks of this new-old order appeared unmistakable. Falling budget defi cits, tight monetary policy, deregulation, free trade and capital decontrols became the new orthodoxy. Th e ideological rheto-ric spoke of ‘democracy,’ ‘global villageism’ and ‘peace dividends.’ Th e welfare-warfare state was on its way out. Laissez faire was back in fashion. Th e trajectory seemed so obvious that some were even tempted to announce the ‘end of his-tory.’
In the early 2000s, though, the tables suddenly turned. Fiscal and mon-etary policies were ‘loosened,’ ‘protectionist’ measures were reintroduced and the tidal wave of capital fl ow turned to a trickle. Talk of a ‘global village’ quickly disappeared and was replaced by a global ‘war on terror.’ Democracy has given way to Homeland Security. Expectations for peace dividends have dissipated in favor of ‘war profi ts.’ History was back with a vengeance.
Shimshon BichlerJonathan Nitzan
¹. Th e fi rst draft of this paper was presented in October at the YPE Seminar Series at York University. It was submitted to the JWSR in June and accepted for publication in March . During this process, we have received comments from many people, far too numerous to list here, as well as from two anonymous referees of the JWSR. We thank them all for their insights. We accept the paper’s shortcomings as our own and hope that readers will fi nd them suffi ciently important to debate.
Shimshon BichlerPO Box 4283Jerusalem 91–[email protected]://www.bnarchives.net/
Jonathan NitzanDepartment of Political ScienceYork University4700 Keele St. Toronto, Ontario, M3J [email protected]://www.bnarchives.net/

Shimshon Bichler & Jonathan Nitzan256
Th e purpose of this paper is to situate this broad transition within an alter-native understanding of capital accumulation. Th ere have been many insightful explanations for this transition in recent years, but the one presented here is diff erent in two important respects. First, whereas most explanations attempt to reconcile the new trajectory with existing theories of accumulation, ours is based on a new framework altogether. Second, in contrast to most accounts, which are largely polemic, ours is empirical throughout.
1. the argument in a nutshell
We start with capital. Contemporary students of capitalism, hamstrung by nineteenth-century biases, continue to think of accumulation in the ‘material’ terms of labor, production and consumption. In our opinion, this emphasis has become insuffi cient and misleading. Over the past century, capital has grown increasingly politicized in nature and fi nancial in form. ‘Free competition’ and the formal separation of ‘state’ and ‘capital’—where they existed—have given way to a far more complex interaction of ‘dominant capital’ groups and ‘big government.’ Accumulation, which during the nineteenth century was anchored largely in proletarianization and technical advances, has come to depend more and more on corporate amalgamation and infl ationary pricing.
To deal with these new dimensions, this paper off ers an alternative concep-tualization of capital, understood not as a material entity but as a power institu-tion. What gets accumulated, we argue, is neither ‘utility’ nor ‘dead labor,’ but fi nancial claims on expected future earnings. Th ese expected earnings, in turn, represent neither the ‘marginal productivity’ of capital nor ‘surplus value,’ but the way capitalists view the future structure of power in society.
A power understanding of accumulation leads to diff erent units of analysis. Marx diff erentiated between three ‘types’ of capital owned by three correspond-ing ‘fractions’ of the capitalist class—‘industrial,’ ‘commercial’ and ‘fi nancial.’ Th is division is no longer tenable. All modern ownership is fi nancial, and only fi nancial. It is a claim on pecuniary earnings. And pecuniary earnings refl ect not production or consumption, but power, and only power. Th is central role of power means that it is no longer enough to think in terms of capital ‘in gen-eral’ and ‘individual capitals’ in competition. Instead, the attention should be focused on dominant capital—namely, on the largest power coalitions at the centre of the political economy. Diff erent coalitions within dominant capital sometimes are associated with diff erent ‘types’ of business activity, such as oil, weapons, telecommunication or fi nancial intermediation. But these diff erences are only partly, and sometimes not at all, related to the nature of ‘production’ per se. Business is a matter of profi t, and profi t comes not from production, but

Dominant Capital and the New Wars 257
from power—the power to reshape the trajectory of social reproduction as a whole. Diff erent segments within dominant capital are diff erentiated by the nature of their power. Production, narrowly defi ned, is merely an aspect of that power.
Driven by the quest for power, the goal of these dominant capital groups is not absolute accumulation, but diff erential accumulation. Th ey try not to maxi-mize profi t, but to beat the average and exceed the normal rate of return. Th ere is a big diff erence between these two goals. Profi t maximizers focus on their own earnings. By contrast, diff erential accumulators also benefi t, sometimes greatly, by lowering the earnings of others.
Th is diff erence is refl ected in the ‘mechanisms’ of accumulation. Traditional analysis of accumulation emphasizes the importance to accumulation of overall growth and price stability. But for dominant capital, diff erential accumulation works best through mergers and acquisitions and through the redistributional eff ects of stagfl ation (stagnation combined with infl ation). And, indeed, during the twentieth century, with the progressive spread of dominant capital and dif-ferential accumulation, there emerged an almost stylized cycle of diff erential accumulation ‘regimes,’ oscillating between relatively long periods of corporate amalgamation and shorter periods of stagfl ation.
Th e year 2000 seems to mark the beginning of yet another such oscillation: a long upswing of corporate amalgamation had just ended, and as these lines are being written (early 2003) there are signs that stagfl ation may be ready for a comeback. It is in this context that the current shift from neoliberalism to the new wars should be understood.
Traditional analyses of imperialism emphasized the benefi t for accumula-tion of territorial conquest, access to raw material and the expansion of mar-kets. But with capital becoming increasingly political in nature and fi nancial in form, the link between imperialism and accumulation has grown more com-plex and subtle—to the point of making the very concept of ‘imperialism’ seem questionable. Dominant capital has fabricated a whole new arsenal of accumu-lation techniques. Th is arsenal allows it to increase its profi ts immensely with-out military conquest. New populations, new workers and new consumers are now brought under its ambit not through war, but through global corporate mergers. And when war does break out, dominant capital often supports it not for the added territory or the pacifi cation of a rival, but for the mere turmoil it creates. As it turns out, turmoil provides the breeding ground for stagfl ation, and stagfl ation fuels diff erential accumulation. Mainstream economists think of infl ation as a ‘neutral’ phenomenon, but the evidence suggests otherwise. Not only does infl ation tend to come together with stagnation, but it also works to redistribute income—from workers to capitalists and from small fi rms to large ones.

Shimshon Bichler & Jonathan Nitzan258
Th e current shift toward war, and in particular the rekindling of confl ict in the Middle East, is intimately connected with this new arsenal of accumulation. Of course, the reasons for war are always complicated and never singular, and the present historical junction is no exception. But as far as dominant capital is concerned, the ‘battle lines’ are relatively clear. For the leading accumulators, success and failure are a matter of diff erential profi t. Th eir goal is to ‘beat the average,’ and that makes them judge the world based on relative earnings. In their eyes, the key question is how war will aff ect their diff erential accumulation, immediately and in the longer run. And that is the question we need to begin with.
Consider fi rst the military contractors and oil companies. Th e interest of weapon companies in renewed confl ict is pretty obvious, particularly after a decade of peace dividends, curtailed war budgets and dwindling arms exports. Th e interest of the oil companies, however, is more complicated and often mis-understood. Contrary to popular belief, since the 1970s the oil companies, taken as a group, have become relatively impartial to ‘access rights’ and ‘drilling con-cessions.’ As long as they remain the principal off -takers of crude oil, it does not matter much whether or not they own it. Th e key to their profi t is not volume, but price. A higher price of crude oil means higher input costs for them; but it also means a much higher price for refi ned products, and therefore much higher profi ts at the bottom line. When crude oil prices go up, so do their profi ts, and vice versa when the price of oil drops.
And what makes the price of oil go up and down? According to popular conception, the blame rests either with the ‘oil sheiks’ of OPEC or with the market forces of ‘supply and demand.’ Th e reality of the oil business, however, is rather diff erent. As it turns out, over the past thirty years the single most important factor aff ecting the price of oil was the ebb and fl ow of confl ict in the Middle East.
Tension and war brought higher oil prices, which in turn led to higher oil revenues for OPEC and surging profi ts for the oil companies. Local govern-ments, fl ooded with petroleum earnings, used those earnings to buy more weap-ons, and their purchases helped enrich the arms exporters in the industrialized countries. Furthermore, as the region’s arsenals swelled, the groundwork for the next confl ict was put in place. Th us, if the oil and armament groups surround-ing the current Bush Administration have a broad interest here, clearly it is an interest in some measure of instability and war, not peace.
Of course, the armament and oil companies are not the only ones that need to be considered. Most big companies have little to do with the sale of either weapons or oil, and practically all are users of energy. So are these companies not set to lose from war and higher energy prices? Th e answer is ‘yes and no.’ If

Dominant Capital and the New Wars 259
oil prices were to continue rising, the Microsofts, General Motors and Vivendis of this world would likely fall behind the ExxonMobils and Lockheed Martins. And indeed, the prospect of such loss of primacy has already contributed to some squabbling between and within Western governments on precisely how much violence should be infl icted on the Middle East. However, considering the stakes involved, the struggle so far has been rather muted. One possible reason is that most large companies believe that the new wars will indeed con-tribute to world stability and lower oil prices. But there is another possibility, namely, that these companies expect greater instability and higher prices, but view this outcome as desirable—even if it causes them to lose primacy to the oil and armament fi rms.
Th e logic behind this preference is as follows. Presently (early 2003), the biggest danger facing dominant capital as a whole is defl ation. Th e global debt burden is heavier than at any previous point in history, roughly twice what it was on the eve of the Great Depression. Corporate pricing power, however, has been declining for more than twenty years and is now the weakest it has been since the late 1950s. Under these circumstances, if disinfl ation were to give way to fall-ing prices, the specter of chain bankruptcies and debt defl ation could make the Great Depression look like child’s play. Given this risk, any move toward higher infl ation—even when accompanied by stagnation—is the lesser evil and would be welcomed with a sigh of relief.
A likely trigger for higher infl ation is higher oil prices. Th at, at least, has been the pattern since the late 1960s. Over the past forty years, higher oil prices have always led to higher infl ation, and if they do so again dominant capital will likely fi nd the outcome desirable. Furthermore, once the defl ation threat is defused, the icing on the cake would be the reinvigoration of diff erential accu-mulation. As noted, infl ation tends to redistribute income from labor to capital and from small fi rms to larger ones. And if this pattern continues to hold, the net eff ect on dominant capital would end up being positive.
Oil producing countries in and outside OPEC obviously are more ambiva-lent. Th e explicit shift toward interventionism on the part of the United States and its Western allies must be worrying for them. OPEC is the only interna-tional cartel that managed to obtain some degree of ‘autonomy’ from Western infl uence, and now this autonomy is in great danger. At the same time, however, part of the cartel’s lingering weakness stems precisely from its inability to keep prices high—something which a new era of confl ict ‘managed’ by direct U.S. intervention may help remedy.
Needless to say, these arguments leave many questions open. For example, does dominant capital understand its interests in this way, and therefore qui-etly support the new wars? Are the oil and armament companies sophisticated

Shimshon Bichler & Jonathan Nitzan260
enough to ‘engineer’ such roundabout accumulation strategies? Do they have the necessary muscle to stir the U.S. government into such adventures? What is the opposition standing against them—from within dominant capital and from the underlying population more broadly? What are the consequences of these developments for the broader ‘functioning’ of contemporary capitalism? And how should we embed these considerations in the larger context of regional and global politics, cultural change and religious confl ict? Th ese are all important questions that deserve a study far more extensive than what can be attempted here. But, then, our purpose is not to write the fi nal word on the issue, but rather to outline an alternative approach and invite others to debate it.
2. capital accumulation²
What do we mean by the term ‘accumulation’? Most people would probably consider this a trivial query: you accumulate when you become richer, you decu-mulate when you become poorer. And that is certainly part of the answer—but not the whole answer. Suppose your dollar assets grew by 10 percent last year. Suppose further that the overall price level—measured by the GDP price defl a-tor—also grew at the same rate of 10 percent. Since, on average, everything cost 10 percent more, your ‘purchasing power’ remained the same even though the nominal value of your assets had risen. Clearly, your ‘wealth,’ measured in terms of what you can acquire, has not changed. In this sense, you have not accumu-lated. For this reason, economists—conservative and radical alike—argue that accumulation should be measured not in nominal dollars and cents, but in ‘real terms.’
Unfortunately, this is easier said than done. Of course, national statisti-cians produce measurements of the ‘real’ capital stock as a matter of course, but the meaning of these measurements is anything but clear. Th e statistical pro-cedure itself is simple enough. You take the overall value of capital equipment and structures denominated in dollars and cents—for instance, the dollar value of all factories in the automobile industry—and divide this value by the price index for automobile factories. On the face of it, the eff ect is to ‘purge’ from the nominal value of capital the impact of changing prices. For example, if the dollar value of automobile factories in our example rose by 20 percent, and if 5 percent
². For detailed expositions of our view on capital, power and diff erential accumula-tion covered in Sections –, see Nitzan (), Nitzan and Bichler (a) and Bichler and Nitzan (b: ch. ).

Dominant Capital and the New Wars 261
of the increase was due to a rise in the price of a typical factory, the statistician, after subtracting the latter from the former, could tell us that the ‘real’ rate of accumulation was 15 percent; in other words, that the ‘quantity’ of factories, as distinct from their ‘nominal’ value, expanded by 15 percent. A clean, simple computation, no doubt. But does it really measure the rate of ‘accumulation’?
Consider the following facts. An ‘automobile factory’—and any other fac-tory for that matter—is made of many diff erent tools, machines and struc-tures. Over time, the ‘nature’ of these items tends to change. Th ey may take less time and eff ort to produce; they may become more productive due to techni-cal improvement or less productive because of wear and tear; their composi-tion may change with new machines replacing older ones; they may be used to produce diff erent and even entirely new output; etc. Th e result of these many changes is that today’s automobile factories are not the same as yesterday’s, or as last year’s. Th e price index of automobile factories, however, is supposed to track, over time, the price of the very same factories. Th e obvious question, then, is how such an index could be computed when the underlying factories—the ‘things’ whose price the index is supposed to measure—keep changing from one year to the next?
Clearly, in order to measure the price of capital, we must fi rst denominate its underlying ‘substance’ in some homogenous units. Neoclassical economists have solved the problem by saying that machines, factories and structures could all be reduced to universal units of ‘productive capacity,’ counted in terms of the utility they generate. In this way, an automobile factory capable of producing 1,000 ‘utils’ is equivalent to two factories each producing 500 ‘utils.’ As factories change over time, we can simply measure their changing ‘magnitude’ in terms of their greater or lesser ‘util-generating capacity.’
In contrast to the neoclassicists, Marx approached the problem from the input side, arguing that capital, like any other commodity, could be quantifi ed in terms of the socially necessary ‘abstract labor’ required to produce it. So if we begin with an automobile factory that takes, on average, 10 million hours of abstract labor to construct, and add to it another factory that takes, on average, only 5 million hours to build, we end up with an aggregate capital whose ‘mag-nitude’ is equivalent to 15 million hours of abstract labor.
Do these ‘procedures’ solve the problem of separating price from quantity? Not in the least. Indeed, had we known the ‘productivity’ or ‘abstract labor con-tents’ of capital, that knowledge would already tell us what the ‘real’ magnitude of capital is, making the whole statistical exercise redundant. Will political economists ever come to ‘know’ these universal units, so that they can dispense with the make-believe process of separating price from quantity? Perhaps. But so far they have not, and until they do—which we think will be never—the

Shimshon Bichler & Jonathan Nitzan262
meaning of all statistical measures of ‘real’ capital will remain unclear.³ Ironically, even if we could somehow come up with a ‘real’ measure of capi-
tal, that would not really matter for our purpose. Th e reason is simple: the real interest of capitalists has nothing to do with the so-called ‘real’ rate of accu-mulation. Th e Ford family, Bill Gates, the Bronfmans, George Soros—and, for that matter, all contemporary capitalists, including the managers of mutual funds and the directors of the large corporations—do not care about the ‘pur-chasing power’ of their capital. Similarly, they do not care about the ‘productive capacity’ of their machines. And they do not care about how much ‘abstract labor’ went into producing what they own. Of course, they do care very much about the nominal value of their assets. Under the price system of capitalism, says Th orstein Veblen, ‘men have come to the conviction that money-values are more real and substantial than any of the material facts in this transitory world’ (Veblen 1923: 88). And there is a reason for this conviction.
Present-day capitalists own not ‘means of production,’ but a fi nancial claim on corporate earnings.⁴ Th is fact is true for all capitalists, whether they own an automobile company, a software fi rm, a bank, a media conglomerate or a diversifi ed fi nancial portfolio. In this sense, we can no longer diff erentiate between ‘industrial,’ ‘commercial’ and ‘fi nancial’ capitalists. Th e emergence in
³. In order to denote the ‘substance’ of capital in universal units, political econo-mists would need to overcome three obstacles, all of which are insurmountable. First, they would have to explain how we can convert qualitatively diff erent outputs into uni-versal ‘utils ’ (in the neoclassical case), or qualitatively diff erent forms of concrete labor into homogenous units of ‘abstract labor’ (in the Marxist case). Second, they would have to identify the particular ‘utils ’ produced by a particular type of capital (neoclassical), or the exact number of abstract labor hours that went (on average) into making a particular type of machine (Marxist). And, third, they would have to show that the capital mea-surements they came up with were indeed unique; in other words, that the ‘substance’ we call a factory, when measured as ‘capital,’ has one quantity, and one quantity only. On the impossible ‘conversion’ of quality into quantity, see for example Castoriadis (), Nitzan () and Bichler and Nitzan (a). Th e issue of input-output indeterminacy was pointed out by Steadman (; ). Th e problem of providing a unique measure of ‘real’ capital was fi rst identifi ed by Veblen (; ) and Wicksell (), and later gave rise to the ‘Cambridge Controversies’ of the s and s (Cf. Robinson -; Sraff a ; Harcourt ).
⁴. Note that that the ‘objects’ owned by the corporation, such as factories and struc-tures, are merely instrumental to profi t: they derive their capitalization not from their ‘productivity’ or their cost of production, but from the earnings they are expected to generate.

Dominant Capital and the New Wars 263
the late nineteenth century of the corporations as the principal form of owner-ship turned all capitalists into fi nancial capitalists. Furthermore, with extensive conglomeration and crossholdings it is no longer possible to apply the catego-ries of ‘industry,’ ‘commerce’ and ‘fi nance’ even to the corporations themselves. Finally, and crucially, even within the corporation we cannot know how much profi t comes from ‘industry’ as opposed to ‘commerce’ or ‘fi nance.’ It is true that many large companies provide data on sales and profi ts broken by ‘business segment’ and ‘line of activity.’ But these breakdowns, based as they are on intra-company transfer pricing, are forever arbitrary. Th ey could be made as large or small as desired and therefore give us no defi nite insight as to the ultimate ‘source’ of profi t.⁵
In short, there is a decisive ‘break’ between the material facts of production and the fi nancial reality of accumulation. Th is break was well understood by Marx already in the middle of the nineteenth century (cf. Marx 1909: vol. 3, Part V). But in order to defend his notion of ‘actual capital,’ which he believed was made of surplus abstract labor, fi nancial accumulation had to be classi-fi ed as ‘fi ctitious.’ More than a century later, though, the dialectics of capitalist development have completely inverted his classifi cation. Th ese days, the only ‘actual’ capital is fi nance. It is readily observable and measurable, it is the only capital capitalists care about, it moves the world. By contrast, capital counted in abstract labor is entirely ‘fi ctitious.’ It cannot be observed, it cannot be mea-sured, and it is of no interest to capitalists or their managers. It cannot tell us anything about the actual process of accumulation.
And, so, although ‘production’ in its narrow sense matters a great deal for capitalism, it does not—and indeed cannot—provide either the quantitative code for accumulation or the benchmark against which accumulation should be assessed. Accumulation is a matter of power, and, accordingly, the yardstick capitalists use to assess their success or failure cannot be absolute. It has to be relative. Capitalists compare their accumulation not to articles of utility or hours of labor, but to the ‘normal’ rate of accumulation itself.
3. differential accumulation
A capitalist investing in Canadian 10-year bonds typically tries to beat the Scotia McLeod 10-year benchmark; an owner of emerging market equities tries
⁵. Th ese problems are well known to national accounting statisticians. Th e U.S. Department of Commerce, for instance, warns users that its profi t data are based on company reports, and that their classifi cation by industry is ‘inaccurate’ to an unknown extent (U.S. Department of Commerce. Bureau of Economic Analysis ).

Shimshon Bichler & Jonathan Nitzan264
to beat the IFC benchmark; investors in global commodities try to beat the Economist index; owners of large U.S. corporations try to beat the S&P 500; and so on. Every investment is normally stacked against some benchmark. To seek ‘absolute’ returns in our day and age is to be exotic indeed.⁶ Neoclassi-cal economists never tire of talking about ‘profi t maximization,’ although real investors would not know what that meant even if they cared.⁷ Th eir own goal is diff erential accumulation.
On the face of it, this emphasis on diff erential fi nancial gain may seem overblown. Present day capitalists certainly think in nominal terms; and, yes, they do try to beat the average. But in so doing, are they not simply chasing their own tail? And why should studying this game be important for politi-cal economy? After all, everyone knows that fi nancial markets are a ‘bubble’ of hype and defl ation whose booms and busts are pretty much ‘delinked’ from the ‘real’ processes of production and profi t. Looking at how investors behave may be interesting, even entertaining, but how much can it tell us about the underly-ing social reality?
Th e short answer is: plenty. Finance and diff erential accumulation are not a sideshow. Finance is the main ‘language’ of capital, while diff erential accumula-tion is its principal ‘generative order.’ Together, they produce many of the ‘expli-cate’ phenomena of contemporary capitalism and off er a key to understanding some of its most fundamental processes.⁸
⁶. Peter Martin, a Financial Times columnist, clearly is sailing against the wind when he calls on fund managers to abandon their ‘fetish’ for relative performance in favor of absolute returns (Martin ). Some hedge funds have tried to do just that—i.e., achieve a pre-determined rate of return—but as another Financial Times commentator explains, their strategy is tantamount to having their cake and eating it too. In the end, ‘absolute return strategies’ are attractive only insofar as they manage to beat the aver-age…. (Anonymous ).
⁷. Th e idea of profi t maximization was fi rst challenged during the Great Depression by the empirical works of Means () and Hall and Hitch (). Initially, their stud-ies stirred up considerable controversy and debate, but with the post-war victory of the ‘neoclassical synthesis’ of Keynesian macroeconomics and neoclassical microeconomics, the issue was ceremoniously swept under the carpet (see Lee ; Lee et al. –).
⁸. On the notions of explicate and generative orders, see Bohm and Peat () and Bohm ().

Dominant Capital and the New Wars 265
Finance and ‘Reality’
Take the popular ‘delinking thesis.’ According to this theory, equity prices have no basis in ‘reality.’ In buying and selling stocks, investors are simply trying to guess what other investors think, in infi nite regress, a process which inevitably makes them lose sight of anything related to the ‘real’ economy. As John Maynard Keynes put it, ‘We have reached the third degree where we devote our intelli-gences to anticipating what average opinion expects the average opinion to be. And there are some, I believe, who practice the fourth, fi fth and higher degrees’ (Keynes 1936: 156). Th is view has become popular, and it certainly rings true if you spend too much time observing ‘day trading’ and the stock market fl oor. But as an explanation of the market’s long term trajectory it is dangerously misleading.
Figure 1 – S&P 500: Price and Earnings*
10
100
1,000
10,000
100,000
1850 1870 1890 1910 1930 1950 1970 1990 2010
Price
Earnings per Share
1871=100
log scale
* The S&P 500 index splices the following three series: the Cowles/Standard and Poor’s Composite (1871–1925); the 90-stock Composite (1926–1957); and the S&P 500 (1957-present). Earnings per share are computed as the ratio of price to price/earnings.
Source: Global Financial Data (series codes: _SPXD for price; SPPECOMW for price/earnings).

Shimshon Bichler & Jonathan Nitzan266
Consider Figure 1. Th e chart shows the long-term development of the Stan-dard and Poor’s 500 index (s&p 500), which measures the average stock price of the 500 largest companies listed in the United States. Th e Figure also plots the average earnings per share of these companies. Evidently, the two series have not moved together exactly, showing marked discrepancies in their year-to-year fl uctuations (note the log scale). But over the longer term their correlation—measuring 0.95 out of a maximum value of 1—is nothing short of remarkable. In other words, the stock market may be based on subjective speculation (which it certainly is), but it is a speculation tightly correlated with the capitalist reality of profi t.
Should this long-term correlation surprise us? Not really. When a capital-ist buys a share in a company, she buys a portion of that company. But what she pays for are not the machines, structures, or workers of the company. Rather, she pays for the company’s ability to generate profit. And how much she pays for this ability is proportionate to how much profit the firm is expected to gener-ate.⁹ This relationship can be symbolically stated, so that:
rate of accumulation ≈ rate of growth of future profit
We can further simplify this expression by noting that, over the longer haul, profit expectations tend to oscillate around the path of actual profit, so that:
rate of accumulation ≈ rate of growth of profit
In other words, what we see in Figure 1 is not a f luke correlation between the so-called ‘speculative’ fervor of finance and the ‘reality’ of profit, but a relation-ship deeply grounded in the inner logic of accumulation. Over the longer haul, the ‘delinking thesis’ is wrong, not only empirically but also theoretically.
Differential Accumulation: Passive and Active
Now, let us think of what it takes to achieve diff erential accumulation; that is, to have the capitalist’s own capital, measured in dollars, expand faster than the average. Suppose, for the sake of illustration, that the capitalist invests in equities, and suppose further that he systematically beats the s&p 500 bench-mark. To enjoy such a feat, the profi ts of the companies he owns must grow
⁹. We are abstracting here from the other dimension of stock pricing—namely, risk perceptions, the rate of interest and investors’ hype (the later denoting the ex-post ratio of expected to actual profi t). Th ese factors are largely cyclical and therefore important mostly in the short and medium term. In the longer run, they are necessarily secondary to the exponential growth of profi t.

Dominant Capital and the New Wars 267
faster than the average profi t of the 500 fi rms included in the s&p 500 index.¹⁰ And as his own profi ts rise faster than the average, his relative share of total profi t grows as well. In other words, to accumulate diff erentially and to increase your distributive share of profi t are two side of the same process.
Th ere are two basic ways to beat the average: the ‘passive’ and the ‘active.’ Th e passive method, typical of minority owners, is to buy those assets whose profi ts you expect to grow faster than the average—but whose prices are pres-ently ‘undervalued’ relative to this ‘eventual’ outcome—and wait. In due course, or so you hope, other investors will come around to think as you do, bid up the price of your stocks relative to the average, and in the process cause you to accu-mulate diff erentially. Two glaring examples of this strategy are George Soros’ Quantum Fund and Warren Buff ett’s Berkshire Hathaway. Between 1969 and 1997, Soros recorded annual total returns averaging 33 percent, compared with 13 percent for the s&p 500, while Buff ett, nicknamed the ‘Sage of Omaha,’ scored an annual average of 22 percent over the 1965–2002 period, compared with 10 percent for the s&p 500.¹¹
And yet, as they grow bigger, successful ‘passive’ investors increasingly fi nd themselves compelled to pursue more ‘active’ methods. In the 1960s, Soros and Buff ett were small enough to buy and sell without signifi cantly aff ecting the price of their underlying assets. Th at was no longer true in the 1990s. Sys-tematic diff erential accumulation had made them too big for a strictly pas-sive strategy. As a capitalist, it is no longer easy to ‘buy cheap’ when your large purchases quickly drive up the price, or to ‘sell dear’ when unloading assets en masse quickly depresses their price. At that point, you are more or less forced to become active, which is what gradually happened to Soros, Buff ett and scores of other large fund mangers and institutional investors.
Th e active method, typical of majority, or ‘eff ective’ owners, contains the added ingredient of direct intervention. Instead of merely waiting in the hope that profi ts will grow diff erentially, you take deliberate action in order to make sure they do grow diff erentially. Individually, dominant capital groups engage in both methods. But it is the latter method—namely, the active attempt to aff ect profi t—that makes systematic diff erential accumulation possible in the
¹⁰. Again, we are abstracting from shorter term variations in diff erential risk and hype alluded to in footnote .
¹¹. Total return comprises capital appreciation and reinvested dividends. Figures computed from Reier (), Buff ett (: ) and Global Financial Data.http://www.globalfi ndata.com

Shimshon Bichler & Jonathan Nitzan268
fi rst place. Without someone being ‘active,’ there could be no systematic growth in diff erential profi t; and without such growth the passive method becomes untenable.
Capital and Power
Th e emphasis here on active ‘human agency’ is crucial, and all the more so since existing theories of accumulation tend to ignore it. For the neoclas-sicists, capitalists can try to increase their profi t until they are blue in the face. It will not help them. In a competitive market, profi t is equal to the productive contribution of capital, not to the eff ort of its owner. Karl Marx ridiculed the notion that capital could be ‘productive.’ Only labor was productive. Th e source of profi t was the institution of private ownership, which left the means of pro-duction in the hands of capitalists and forced workers to settle for wages lower than the value of their output. In this scheme, Marx recognized the power foundations of capital—the power of capital over labor. Paradoxically, however, beyond this abstract recognition, his analysis of accumulation left little room for concrete power.
Of course, Marx was the fi rst to note the growth of big business and the formative role of the state in the genesis of capitalism, themes that were later developed by neo-Marxist state theorists and the analysts of monopoly capi-talism. But to emphasize these aspects of power was to undermine the labor theory of value. Th is latter theory relied heavily on the Newtonian assump-tions of atomistic competition, the free mobility of capital and labor, and the lack of ‘intervening’ factors such as governments—all of which assumptions were compromised by the ascent of giant corporations and big government. Th e result was an increasingly sophisticated explanation of capitalist power built on an increasingly shaky theory of capital accumulation.
Monopoly Capital theorists took a step forward, by emphasizing the role of centralized power in mature capitalism and by recognizing that such power made labor values more or less irrelevant for the actual trajectory of prices and profi ts. But they failed to take the next logical step, namely to rethink the impli-cation of power for the concept of capital itself. Th is failure was candidly acknowl-edged by Paul Sweezy in his assessment of Monopoly Capital, a book which he wrote together with Paul Baran twenty-fi ve years earlier:
Why did Monopoly Capital fail to anticipate the changes in the structure and functioning of the system that have taken place in the last twenty-five years? Basically, I think the answer is that its conceptualization of the capital accumulation process is one-sided and incomplete. In the established tradition of both mainstream and Marxian economics, we treated capital accumulation as being essentially a matter of adding to the stock of existing capital goods.

Dominant Capital and the New Wars 269
But in reality this is only one aspect of the process. Accumulation is also a matter of adding to the stock of financial assets. The two aspects are of course interrelated, but the nature of this interrelation is problematic to say the least. The traditional way of handling the problem has been in effect to assume it away: for example, buying stocks and bonds (two of the simpler forms of financial assets) is assumed to be merely an indirect way of buying real capital goods. This is hardly ever true, and it can be totally misleading. This is not the place to try to point the way to a more satisfactory conceptualization of the capital accumulation process. It is at best an extremely complicated and difficult problem, and I am frank to say that I have no clues to its solution. But I can say with some confidence that achieving a better understanding of the monopoly capitalist society of today will be possible only on the basis of a more adequate theory of capital accumulation, with special emphasis on the inter-action of its real and financial aspects, than we now possess. (Sweezy , emphasis added)
4. capital as power
In our view, the alternative is to think not of accumulation and power, but of accumulation as power.¹² Th e Marxist belief, according to which surplus value is fi rst ‘produced’ by industrial capitalists and then ‘redistributed’ through intra-class power struggle among the diff erent fractions of the capitalist class, is a grand myth which has run its course. Instead, we argue that all capitalized earnings, regardless of their ‘source,’ are refl ections/expressions of power—the power of capitalists to shape and transform the course of society to their own ends. What is being ‘capitalized,’ always, is not abstract labor, but power itself. And since power, by its very nature, is diff erential, so is accumulation. Th is is the crux of the matter.
Capitalizing Power
Consider the example of Microsoft. In 2000, the company earned $9.4 billion in net profi t—roughly 70 percent of all global software profi t—and boasted a market capitalization of some $310 billion (Anonymous 1999b; Moody’s Online). Th is profi t and capitalization, though, bore little relation to the ‘productivity’ of the company’s workers or to the cost of producing software.
¹². Our ‘equating’ of capital to power is metaphorical, of course. But as Arhtur Koestler (; ) amply demonstrates, metaphors, or ‘bisociations,’ as he calls them, are essential for creativity, including in science. ‘Metaphoric perception,’ say David Bohm and David Peat, ‘is, indeed, fundamental to all science and involves bringing together previously incompatible ideas in radically new ways’ (: ).

Shimshon Bichler & Jonathan Nitzan270
Instead, they were entirely dependent on intellectual property rights, on the state sanction that backed up these rights, and on Microsoft’s ability to harness this sanction to its own diff erential ends. For this reason, it does not matter whether Microsoft spent billions of dollars to ‘invent’ its programs, or instead appropriated them gratis from others. Either way, the programs take only a few dollars’ worth of CDs to ‘reproduce,’ to the byte. Th e only barrier preventing this latter act is the law. Remove the threat of penalty for such ‘procreation,’ and Microsoft’s profi t and capitalization would quickly collapse to zero. Microsoft may be a ‘knowledge company,’ whatever that means, but its diff erential profi t-ability depends squarely and solely on the politics of knowledge.¹³
Or take Citigroup. Th e relative profi t growth of this fi nancial conglom-erate, like that of similar companies, depends, among other things, on inter-est rates. And interest rates, as we know, are aff ected by monetary policy. Th is ‘symbiosis’ between private profi t and state action makes Citigroup’s diff erential accumulation depend on its ability to aff ect monetary policy; and to the extent that it does, part of Citigroup’s assets represents a ‘capitalization of the state.’
Or think of General Motors. GM, together with seven other automobile companies, controls the world market for cars and trucks. Th e diff erential profi t of GM depends on its tacit and open collusion with these other companies. But it also depends on much more. It depends on the highway system provided by the government, as well as the convenient lack of alternative public transporta-tion; it depends on environmental regulation or lack thereof; it depends on the ups and downs in the price of oil; it depends on tax arrangements with various governments and on a complicated global system of ‘transfer pricing’; it depends on a sophisticated propaganda war which creates wants and shapes desires; it depends on the relative strength of its labor unions; and so on and on. GM’s diff erential profi t also depends on its huge credit operations, and therefore on monetary policy; and it depends on the company’s military business, and there-fore on the global politics of armament and the ‘threat’ of confl ict. In this con-text, the ‘production’ of automobiles as such is not the ‘source’ of accumulation, but rather one dimension of a complex order through which GM develops and expands its relative social power.
¹³. Not surprisingly, Microsoft earns most of its profi ts from sales in developed countries such as the United States, where software piracy could cost you up to fi ve years in jail. Most developing countries have not yet perfected the penal system for such acts, and until they ‘develop’ in that direction, their contribution to Microsoft’s bottom line is likely to remain negligible.

Dominant Capital and the New Wars 271
Another illustration: advertising fi rms. Companies such as the Interpub-lic Group, Omnicom and Publicis bypass the sublimations of liberal ideology altogether. Th ey do not sell a product; they sell power—the power to shape the minds of human beings. Th e more eff ective their brainwashing, the greater their relative profi t and diff erential capitalization. Th eir capitalization, quite literally, is the capitalization of diff erential power.
A fi nal example—the oil companies. As we shall see later, over the past thirty years the diff erential profi ts of these companies have had little to do with the production of oil—and almost everything to do with its price. And the price of oil in turn has had little to do with ‘supply and demand’ and everything to do with the global political economy in general and the political economy of the Middle East in particular. So here, too, profi t is a matter of politics, which means that assets capitalize power.
What these examples serve to illustrate is simple. Th e so-called ‘process of production,’ narrowly understood, constitutes one of several explicate ‘media’ through which profi t is generated. But that medium alone still tells us very little about profi tability and accumulation as such. In order to decipher these latter processes, we have to go beyond the narrow understanding of ‘production’ and unpack the general and concrete nature of capitalist power and its oppositions.
Our own starting point is to recognize that contemporary capitalism is obsessed with the diff erential accumulation of fi nancial values. Individual capi-talists can accumulate diff erentially simply by gambling on ‘undervalued’ assets whose underlying profi t they expect will grow diff erentially. But somebody has to make these profi ts grow diff erentially in the fi rst place, and that requires power. Power, in other words, lies at the very heart of accumulation. To under-stand accumulation is to understand power under capitalism, and vice versa.
Politics, Ruling Class and Accumulation Through Crisis
Th e double-sided nature of power and accumulation is important for many reasons, of which we should highlight three. First and foremost it forces us to think of accumulation itself as a political process. From this viewpoint, the ‘political’ dimension is not some sort of a superstructure built on top of ‘material’ accumulation, a mechanism for the redistribution of values previ-ously created in the productive sphere. Instead, politics, broadly understood, is the very crux of accumulation. Making politics the focus of our attention enables us to defuse the anonymity of ‘capitalist forces,’ demystify ‘competition,’ and go beyond the vagueness of ‘the state,’ ‘the capitalist class’ and ‘the capitalist system as a whole.’
More specifi cally within this context, the second reason for the focus on power is that it helps us to think of capital accumulation and ruling class

Shimshon Bichler & Jonathan Nitzan272
dynamics as two sides of the same process. Diff erential accumulation implies the existence of a ‘dominant capital’ group which accumulates faster than the aver-age. And the fact that this group generally succeeds in achieving diff erential accumulation in turn implies its intimate involvement in central power pro-cesses—including government, the law, ideology, mass persuasion, interna-tional organizations, etc. In this sense, dominant capital, by its very nature, must become increasingly fused—although never entirely synonymous—with the ruling class in contemporary capitalism. Th e ‘extent’ to which dominant capital is able to shape the social process is imprinted on the annals of the stock and bond markets in the form of relative fi nancial performance. Th is diff eren-tial performance is not an ‘objective’ measure of power. Rather, it is a measure of how the ruling capitalist class conceives of and universalizes such power in its own mind, how it assesses its own success and failure, and how it tries to impose this understanding on the rest of society. Th ese features make diff erential accu-mulation a highly ‘symbolic’ process. But it is a very real symbol, with very real causes and very real consequences.
From this viewpoint, to understand present day capitalism is to articulate the ‘link’ between the qualitative quest to shape capitalism on the one hand and the quantitative trajectory of diff erential accumulation on the other. Th is bridge, of course, is forever speculative. But we can certainly use it to tell a compelling story, based on a consistent framework, supported by evidence, and subject to some standards of refutation.
Th e third reason for emphasizing the duality of accumulation and power concerns the issue of crisis. Radical theories deal extensively with accumula-tion crises. But with diff erential accumulation there emerges the mischievous possibility of accumulation through crisis. If capital is taken to denote an amass-ment of material things or dead labor, it is only natural to equate its accumula-tion with ‘economic growth.’ But if what gets accumulated is power measured through diff erential ownership titles, it is clear that the process can take place with production decreasing as well as increasing, and with price infl ation as well as price stability. Th e language of power and domination is not the same as the language of production and livelihood. And sometimes—indeed often—power can be greatly augmented precisely by undermining production.
5. regimes of differential accumulation¹⁴
How can dominant capital achieve diff erential accumulation? Analytically, there are two methods of doing so, which we call breadth and depth. To illustrate the meaning of these concepts, think of the dollar level of corporate profi t as a product of two components: (i) the size of the corporate organization, mea-

Dominant Capital and the New Wars 273
sured by the number of employees; and (ii) profi t per employee, measured in dollars, so that:
profit = (employment) · (profit / employment)
Labeling the first brackets ‘breadth’ and the second ‘depth,’ we have:
profit = breadth · depth
Now, think about this equation in relative, or diff erential, terms. As a dominant capitalist you increase breadth in absolute terms by increasing your employment; you increase breadth in relative terms by increasing your diff er-ential employment—that is, by increasing your own employment faster than the average. For example, if average employment growth is 5 percent, and dominant capital expands its labor force by 7 percent, we say that diff erential breadth is 2 percent (the diff erence between the two).
Following the same logic, to increase depth is to raise your profi t per employee; to increase your diff erential depth is to raise your profi t per employee faster than the average. If the average profi t per employee grows by 10 percent and dominant capital achieves 14 percent, diff erential depth is 4 percent.
Each of these methods—breadth and depth—can be further subdivided into external and internal avenues, leading to a four-way classifi cation illustrated in Table 1.
External breadth takes place when you hire new workers and create new, green-fi eld capacity faster than the average. Internal breadth occurs when you take over existing capacity and workers through mergers and acquisitions; that is, by buying other companies. Individually, large fi rms engage in both methods; but as a group, their diff erential breadth is determined almost entirely by the latter. ‘One capitalist always kills many,’ observed Karl Marx in the nineteenth century (1909: vol. 1, p. 836). And, indeed, the twentieth-century growth of big
¹⁴. For a fuller theoretical and empirical discussion of diff erential accumulation regimes, see Nitzan () and Nitzan and Bichler (: ch. ).
Table 1 – Regimes of Differential Accumulation
InternalExternalBreadth
DepthMergers & Acquisitions
Cost-cutting
Green-field
Stagflation

Shimshon Bichler & Jonathan Nitzan274
business was achieved mostly by amalgamation, with large fi rms buying existing capacity rather than building it (see for instance, Scherer and Ross 1990: chs. 3 and 5).
Internal depth refers to the ability of large fi rms to increase profi t per employee by cutting cost faster than the average. External depth denotes the capacity of large fi rms to do the same by increasing prices faster than the aver-age. Again, individually, dominant capital fi rms try to do both, sometimes simultaneously. But over the longer haul it is mostly the latter method that matters for diff erential depth. Cost cutting, of course, is pursued relentlessly by both large and small fi rms. However, since it is diffi cult to exclude others from using new production techniques and from taking advantage of cheaper input prices, the net impact of cost cutting is mostly to meet the average rather than beat it. Historically, the main gains in diff erential depth have come from dominant capital raising its prices faster than the average, a process which at the aggregate level appears as stagfl ation.
Now, to most readers, these claims would seem counterintuitive, if not pre-posterous. In the popular conception, growth often is used as a synonym for accumulation, and infl ation is considered poisonous for profi t. Capitalism, goes the conventional wisdom, abhors stagnation and loves price stability.
Unfortunately, these conventions do not sit well with the facts. Th e mis-match is largely the result of a theoretical fi xation on ‘material’ accumulation measured in absolute terms. If instead we think of accumulation as a diff er-ential power process, mergers and acquisitions suddenly become as important as growth, if not more so, and stagfl ation turns from foe to friend. Indeed, as we shall see below, these two accumulation paths—amalgamation and stagfl a-tion—have become so paramount that they now appear as broad social ‘regimes,’ each with its own unique characteristics. But then we are running ahead of our story.
6. mergers and acquisitions
So far, we have argued that diff erential accumulation by dominant capi-tal—namely, the ability of dominant capital to have its profi t and capitaliza-tion grow faster than the average—is sustained mainly though merger and through stagfl ation. Let us now look more closely at the historical evolution of each path—beginning with merger in this section and stagfl ation in the next. Figure 2 shows the long-term progression of corporate amalgamation in the United States. Th e bottom series provides an ‘amalgamation index,’ or a ‘buy-to-build’ ratio. It measures the ratio between the dollar amount put into mergers and acquisitions and the dollar amount put into green-fi eld investment. According to the data, in 1895, for every $100 of green-fi eld investment in plant

Dominant Capital and the New Wars 275
and equipment there were roughly 60 cents’ worth of mergers and acquisitions. Over the next century, however, this ratio has grown by a multiple of 350 (!), so that by 1999, for every $100 of green-fi eld investment there were $215 spent on corporate amalgamation (note the log scale).
Th e reason for the exponential increase in this ratio is hardly mysterious. Over time, the pace of green-fi eld investment is limited by the overall growth of the market. To expand productive capacity faster than the market is to create ‘glut’ and ensure business ruin. Not so for mergers and acquisitions. Since merg-ers and acquisitions merely ‘fuse’ existing corporations, they can expand many times faster than the market without ever ‘spoiling’ it. And indeed, this is one of the main incentives for buying rather than building. By taking over other fi rms, capitalists augment their profi t stream and reduce potential competition without the risk of ‘overcapacity’ and falling profi t margins.¹⁵
Th e merger process tends to be self-limiting, however. If dominant capital buys faster than it builds, sooner or later it is bound to ‘run out’ of takeover targets. At that point, the only way for dominant capital to keep merging is to ‘break the envelope’ and go beyond its existing corporate universe. Figure 2 shows this imperative unfolding in the United States. Th e fi rst, ‘monopoly’ merger wave, straddling the end of the nineteenth and the beginning of the twentieth centuries, saw the emergence of big business in the United States and the formation of large monopolies in the leading industries. In the second, ‘oli-gopoly’ wave, which lasted through much of the 1920s, fi rms broke their original industry envelope to create vertically integrated fi rms in the various business sectors (for instance, oil refi neries expanding upstream to exploration and drill-ing and downstream to transportation and marketing). Th e third, ‘conglomer-ate’ wave, building up during the late 1950s and 1960s, saw big fi rms diversifying their activity (for example, branching from automobiles to fi nance, to weapons, to computers). And the fourth, ‘global’ wave, which occurred during the 1980s
¹⁵. Standard analysis often is perplexed by the seemingly ‘illogical’ drive to merge—a drive which appears to persist even when takeover targets are ‘too expensive’ relative to green-fi eld investment, and to continue despite ‘disappointing’ post-merger performance (see for example, Brealey et al. : ch. ). Th e problem with this type of analysis is that it focuses on the individual fi rm, failing to appreciate the macro consequences of all fi rms choosing to build rather than buy. If instead of merger, the funds were ploughed back into building new factories, glut and losses would make green-fi eld—not take-over—look like an expensive mistake (the fi rst to understand this ‘dilemma’ was Veblen ; for a critical analysis, see Nitzan and Bichler : ch. ).

Shimshon Bichler & Jonathan Nitzan276
and 1990s, set in motion the process of creating truly global companies (a shift from U.S.-based multinational fi rms to transnational organizations).
Th is successive breaking of ‘envelopes’ was not continuous, however. It unfolded in waves, and there was a reason for that as well. Merger booms tend to ‘hype-up’ investors and make market conditions increasingly fragile as the boom progresses. Eventually, negative sentiment sets in, making the market inhospitable for merger till the next reversal in mood (Nitzan 1995b, 1996). Furthermore, breaking each ‘envelope’ involves major legal, institutional and political realignments, and that takes time. Th e consequence is that the whole process is susceptible to major interruptions. And since merger is a form of dif-ferential accumulation, periodic ruptures in the process mean periodic reduc-tions or even reversals in diff erential accumulation. It is here that stagfl ation enters the picture.
7. stagflation¹⁶
‘Neutrality’
To begin with, there seems to be a general neglect, including among radi-cal political economists, of the historical signifi cance of infl ation for capitalist development. On the face of it, this neglect is rather surprising. Infl ation—commonly defi ned as a general rise in the price of commodities—is hardly new. According to David Hacket Fisher (1996), since the thirteenth century there have been no less than four major infl ationary waves, or ‘price revolutions’ as he calls them. Figure 3 illustrates the pattern of these waves in the U.K., a coun-try whose price indices go back the farthest. Th e fi rst wave occurred during the thirteenth century; the second during the sixteenth century; the third in the latter part of the eighteen century; and the most recent one in the twenti-eth century. Furthermore, each of these price revolutions, Fisher claims, was accompanied, particularly toward the latter part of the wave, by a deepening socio-economic crisis. In other words, the phenomenon of stagfl ation—that is, of stagnation together with infl ation—is not new either. Th e term ‘stagfl ation’ was coined by Paul Samuelson only in the mid-1970s, but the reality of stagfl a-tion goes back many hundreds of years.
Despite its long history and intimate connection to stagnation, political economists continue to view infl ation as ‘neutral.’ Following David Hume’s
¹⁶. For a fuller theoretical and empirical analysis of infl ation and stagfl ation, see Nitzan (; ), Bichler and Nitzan (b: ch. ) and Nitzan and Bichler (b; : ch. ).

Dominant Capital and the New Wars 277
‘classical dichotomy,’ they insist on distinguishing between the ‘real’ and ‘nomi-nal’ spheres of economic life. Of these two realms, the ‘real’ sphere of produc-tion, consumption and distribution is considered primary, whereas the ‘nomi-nal’ sphere of money and absolute prices is thought of mostly as a lubricant, a mechanism that merely facilitates the movement of the ‘real economy.’¹⁷
Figure 2 – Corporate Amalgamation in the United States
Source: Jonathan Nitzan and Shimshon Bichler, The Global Political Economy of Israel (London: Pluto Press, 2002), Data Appendix, pp. 82–3. Updated to 2001.
0
1
10
100
1,000
1880 1900 1920 1940 1960 1980 2000 2020
Buy-to-Build Ratio(Mergers & Acquisitions as a % of gross fixed capital formation)
log scale
18950.6%
1999215%
trend growth rate:3% per annum
200174%
¹⁷. Th is view is pervasive. ‘Th ere cannot, in short, be intrinsically a more insig-nifi cant thing, in the economy of society, than money,’ tells us John Stuart Mill (: Book , ch. ). Money is simply a ‘veil,’ says Irvin Fisher, as does Nobel Laureate Franco Modigliani: ‘Money is “neutral”, a “veil” with no consequences for real economic magni-tudes’ (Papademos and Modigliani : ). And, since, according to Milton Friedman (), ‘infl ation is always and everywhere a monetary phenomenon,’ rising prices, although a nuisance, are ultimately neutral in the grander scheme of things.

Shimshon Bichler & Jonathan Nitzan278
Now, to be fair to the classical political economists, the backdrop against which they were writing was largely one of price stability and even defl ation, not infl ation. As shown in Figure 3, U.K. consumer prices had hardly changed between 1600 and 1750. In the second half of the eighteenth century, they rose relatively quickly, but then fell again throughout the nineteenth century. In that context—which by no means was unique to Great Britain—it was only natural to concentrate on production and the coercive discipline imposed by ‘market forces,’ and to spend less time thinking about the role of infl ation.
However, the historical backdrop changed dramatically during the twenti-eth century. First, infl ation has risen to unprecedented levels. As Figure 3 shows, U.K. prices rose by almost 5,000 percent between 1900 and 2000, compared with less than 800 percent in the previous six centuries combined. Second, there was a clear change in pattern. During pervious infl ationary waves, prices oscillated around their uptrend, but in the twentieth century—with the notable exception of the 1930s—they always moved upwards.¹⁸ Th e classical political economists, writing in a diff erent era, perhaps could be forgiven for not paying too much attention to infl ation. But having lived through the experience of the twentieth century, contemporary observers cannot ask for similar leniency.
So why do most economists continue to believe that infl ation is ‘neutral’? Th e reason begins with the way they defi ne it. Th ere are two common defi ni-tions of infl ation: (1) a continuous increase in the average price level; and (2) an ongoing increase in ‘liquidity’; that is, an increase in the total amount of money relative to the total volume of commodities. Th ese two defi nitions often are seen as equivalent: if we derive the average price level P as the ratio between the total amount of money M and the overall quantity of commodity Q (ignoring the velocity of circulation), it is obvious that in order for P to rise (or fall), the ratio M/Q has to rise (or fall) at the same rate, and vice versa.
Th e crucial thing to note here is the aggregate nature of the defi nition: it focuses wholly on averages and totals. Th is fact is important, since to defi ne infl ation in this way is to miss the point altogether. Infl ation certainly involves a rise in the average price of commodities; but that is like saying that the ‘aver-age’ outcome of a game between two basketball teams is always a draw: one team’s win is another’s loss. Although mathematically correct, the statement
¹⁸. Th e story of the s actually is more complicated than it seems. As Gardiner Means () showed in his study of the U.S. experience, most of the price drop hap-pened in competitive industries (where employment and output dropped only moder-ately), while in the highly concentrated industries prices hardly moved at all (but employ-ment and output fell dramatically).

Dominant Capital and the New Wars 279
is irrelevant to the reality of basketball games. If these games always ended up in a draw, players would soon be looking for another game—one which they could actually win. Similarly with infl ation. If all prices rose at the same average rate, infl ation defi nitely would be ‘neutral’ as mainstream economists say. But it would also serve no purpose whatsoever, and would most likely cease to exist.
Redistribution
Th e crux of infl ation is not that prices rise in general, but that they rise diff erentially. Infl ation is never a uniform process. Although most prices tend to rise during infl ation, they never all rise at the same rate. Th ere is always a spread, with some prices rising faster than the average and others more slowly. And since prices change at diff erent rates, we can paraphrase Milton Friedman’s famous maxim and state, categorically, that ‘infl ation is always and everywhere a redistributional phenomenon.’
Figure 3 – Consumer Prices in the U.K.
1
10
100
1,000
10,000
1200 1300 1400 1500 1600 1700 1800 1900 2000 2100
log scale
Price increase from 1900 to 2000: 4,867%
Price increase from 1300 to 1900: 769%
1900
Source: Global Financial Data (series code: CPGBRM); WEFA.

Shimshon Bichler & Jonathan Nitzan280
Th e diff erence in defi nitions here is crucial. For those who believe that infl ation is an aggregate ‘nominal’ process of ‘too-much-money-chasing-too-few-commodities,’ indeed there is little reason to look any further into the so-called ‘real’ world of production and distribution. Th e only relevant questions are, fi rst, how much money is created and, second, how increased liquidity is ‘transmitted’ to higher prices. But if infl ation is merely the aggregate appear-ance of an underlying distributional struggle, the way to understand it is to begin from that very struggle. In this case, the important questions are: who gains, who loses, and how?¹⁹
Infl ation redistributes income in many diff erent ways, of which we would like to highlight two.²⁰ Th e fi rst is redistribution between workers and capital-
¹⁹. Note that mainstream economists would readily admit that in reality prices do not all change at the same rate, and that relative price variations may even be positively correlated with the rate of infl ation (see for instance, Parks ). But these relative vari-ations, they would add, have little to do with the cause of infl ation, nor do they bear on its long term consequences. First, in a competitive market relative price variations refl ect changes in consumer preferences (marginal utility) and technology (marginal produc-tivity), and in that sense have little to do with overall infl ation. Second, ‘disequilibrium’ prices—namely, those which do not refl ect the underlying logic of utility and productiv-ity—may exist, but only temporarily. Soon enough, the market would force them back to their ‘proper’ equilibrium levels. And fi nally, during infl ation deviations from equilibrium prices arise mostly from misguided expectations and therefore are never systematic in their pattern. Th ese deviations could make some ‘agents’ richer and other poorer, but only by fl uke. Disequilibrium prices could also arise from ‘government intervention’ and ‘monopoly practices’ (mainly by labor unions), but the redistributional eff ect is nullifi ed once agents become aware of these ‘imperfections’ and ‘discount’ them into their demand and supply. Moreover, regardless of their redistributional impact, these ‘imperfection’ cannot translate into infl ation unless validated by increases in overall liquidity.
Unfortunately, this line of defense is persuasive only to those who erect it. First, marginal utility and productivity are never observable, so how could we know what is the equilibrium price which equates them? Second, equilibrium prices, as their name suggests, hold only in equilibrium. But since we never know whether we are in equi-librium or disequilibrium, how can we know which prices are ‘out of line’? And fi nally, why should we assume that infl ation does not systematically redistribute income? To say that market forces prevent such systematic redistribution from happening could be an explanation for an observed outcome. But should we not fi rst establish that this, indeed, is the outcome?
²⁰. Infl ation is related to the distribution of assets through its impact on relative hype and relative risk, as well as through relative profi t—a complicated process that has received inadequate attention and whose study is part of our current research project.

Dominant Capital and the New Wars 281
ists. Figure 4 plots the pattern of this redistribution and the rate of infl ation in the United States over the past half-century. Th e rate of infl ation is measured by the annual percent change in the wholesale price index. Income distribution is presented here as the ratio of s&p 500 earnings per share and the average hourly wage in the private sector. Th e specifi c focus on earnings per share and the wage rate is intended to emphasize the income of individual owners—the owner of capital and the owner of labor power, respectively (both series are smoothed as 3-year moving averages).
Now, if mainstream economics is right and infl ation indeed is ‘neutral,’ the rate of infl ation should have no systematic correlation with the distribution of income between workers and capitalists. But the facts show otherwise. As Figure 4 illustrates, there is a fairly tight positive correlation between the two processes. Th e correlation is not perfect, of course, but that is to be expected given the many factors involved.²¹ For our purposes, the crucial point is the fact that such a systematic correlation exists in the fi rst place. Simply put, this cor-relation tells us that during rising infl ation, corporate profi t has tended to rise relative to wages, and vice versa when infl ation has dropped.
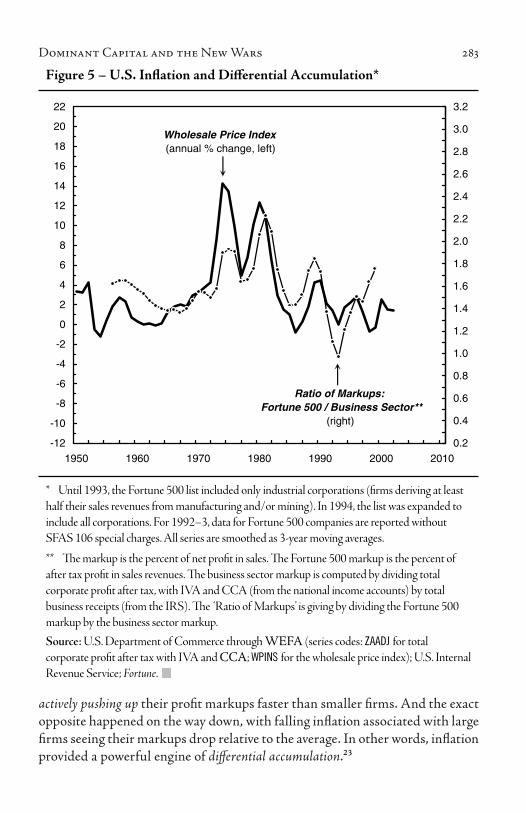
Th e second redistribution is between large and small fi rms. Figure 5 plots the ratio between the profi t markup of the Fortune 500 and the profi t markup of the U.S. business sector as a whole. Th e profi t markup is defi ned here as the percent of net profi t in sales. Th e ratio between the two markups, reminiscent of Kalecki’s (1943) ‘degree of monopoly,’ indicates the relative ‘profi t power’ of large fi rms. In this sense, it provides a proxy for diff erential depth.²² As expected, the Fortune 500 enjoy stronger pricing power (over the past half-century, the ratio between the markups averaged 1.6). But the crucial points for us here are that this relative pricing power has tended to fl uctuate and that the fl uctuations have been positively and tightly correlated with the rate of infl ation (as before, infl ation is measured by the annual percent change in the wholesale price index, and both series in the chart are smoothed as 3-year moving averages).
²¹. Th e sharp spike in the ratio of earnings per share to wages during the s was probably exaggerated by WorldCom and Enron-like accounting practices. Current ‘guesstimates’ suggest that throughout that happy decade, legal creativity and plain fraud helped overstate U.S. corporate profi ts by to percent relative to ‘conventional’ accounting standards.
²². Th is proxy for depth, based on relative profi t shares, is slightly diff erent from the one based on relative profi t per employee as defi ned in Section . In , Fortune stopped publishing aggregate employment data for its listing, making the latter proxy diffi cult to compute. It should be noted, however, that until , the two measures were very tightly correlated.

Shimshon Bichler & Jonathan Nitzan282
Th is positive correlation is rather remarkable, particularly in light of the common belief, popular since Means (1935) and Hall and Hitch (1939), that large fi rms aim at maintaining a long-term ‘target rate of return,’ and that their prices are relatively ‘infl exible’ when compared with those of small fi rms whose own markups are set by ‘market conditions.’ Note, however, that this belief was substantiated by evidence derived mostly from the fi rst half of the century, and particularly from the defl ationary 1930s. Th e second half of the century, though, gives a totally diff erent picture. As Figure 5 suggests, since the 1950s, increases in U.S. infl ation were associated with—and probably driven by—large fi rms
Figure 4 – U.S. Inflation and Capital-Labor Redistribution*
-10
-5
0
5
10
15
20
25
30
35
1950 1960 1970 1980 1990 2000 2010
1.0
1.5
2.0
2.5
3.0
3.5
4.0
Wholesale Price Index(annual % change, left)
Corporate Earnings per Share / Wage Rate**(Index, right)
** Corporate earnings per share are for the S&P 500 Index (ratio of price to price/earnings). The wage rate is the average hourly earning in the private sector.
Source: Global Financial Data (series codes: _SPXD for price; SPPECOMW for price/earnings); U.S. Department of Commerce and U.S. Bureau of Labor Statistics through WEFA (series codes: AHEEAP for the wage rate; WPINS for the wholesale price index).
* Series are smoothed as 3–year moving averages.
Dominant Capital and the New Wars 283
actively pushing up their profi t markups faster than smaller fi rms. And the exact opposite happened on the way down, with falling infl ation associated with large fi rms seeing their markups drop relative to the average. In other words, infl ation provided a powerful engine of diff erential accumulation.²³
Figure 5 – U.S. Inflation and Differential Accumulation*
** The markup is the percent of net profit in sales. The Fortune 500 markup is the percent of after tax profit in sales revenues. The business sector markup is computed by dividing total corporate profit after tax, with IVA and CCA (from the national income accounts) by total business receipts (from the IRS). The ‘Ratio of Markups’ is giving by dividing the Fortune 500 markup by the business sector markup.Source: U.S. Department of Commerce through WEFA (series codes: ZAADJ for total corporate profit after tax with IVA and CCA; WPINS for the wholesale price index); U.S. Internal Revenue Service; Fortune.
-12
-10
-8
-6
-4
-2
0
2
4
6
8
10
12
14
16
18
20
22
1950 1960 1970 1980 1990 2000 2010
0.2
0.4
0.6
0.8
1.0
1.2
1.4
1.6
1.8
2.0
2.2
2.4
2.6
2.8
3.0
3.2
Wholesale Price Index(annual % change, left)
Ratio of Markups:Fortune 500 / Business Sector**
(right)
* Until 1993, the Fortune 500 list included only industrial corporations (firms deriving at least half their sales revenues from manufacturing and/or mining). In 1994, the list was expanded to include all corporations. For 1992–3, data for Fortune 500 companies are reported without SFAS 106 special charges. All series are smoothed as 3-year moving averages.
Shimshon Bichler & Jonathan Nitzan284
Clearly, U.S. infl ation has not been ‘neutral’ in the least. On the contrary, it has been associated with a systematic redistribution of income from workers to fi rms, and from small fi rms to large fi rms. Th at in itself is already a good enough reason to doubt conventional infl ation theory. But what is really remarkable here is that the direction of these two correlations has remained the same for half a century or more.
Patterns
Redistribution is a matter of power, and power can shift over time. So even if we accept that ‘infl ation is always and everywhere a redistributional phenom-enon,’ there still is no inherent reason to expect it always to work in favor of capital in general and in favor of dominant capital in particular. For instance, in Israel, much like in the United States, workers tended to lose from infl ation and large fi rms tended to gain at the expense of smaller ones (Nitzan and Bichler 2002: ch. 4). By contrast, in Germany and France, two countries where labor is relatively strong, the impact of infl ation on labor/capital redistribution has been far less clear (the highly aggregated nature of OECD data makes it diffi cult to draw conclusions regarding the performance of large versus small fi rms).
Evidently, then, the link between infl ation and redistribution has no preset pattern. Infl ation itself is a tricky process; its consequences in the cases exam-ined here depend on the power of dominant capital vis-à-vis labor and relative to capital in general—neither of which can be determined a priori; and the dis-tributional outcome can change over time. In this light, the fact that the U.S. experience has been so systematic in one direction is highly signifi cant.
Th e implication of this systematic pattern is that, in the United States (as well as in other countries with a similar pattern), infl ation has become a very potent—and fairly ‘reliable’—engine of diff erential accumulation. With a long history to learn from, companies know that infl ation helps them raise their profi t faster than it helps workers raise their wages. Th ey know that it helps them more if they are large than if they are small. And they know that there is a certain regularity to the process. In short, they know more or less what to expect.
Accumulation Through Crisis
But, then, if all of these claims are true, why does dominant capital not support indefi nite infl ation? Th e basic reason is that infl ation, although usually eff ective in generating diff erential accumulation, is also socially destabilizing
²³. For similar evidence and analysis of the relationship between infl ation and diff er-ential accumulation in Israel and South Africa, see Nitzan and Bichler (b; ).

Dominant Capital and the New Wars 285
and often diffi cult to manage and contain, and therefore causes capitalists to perceive the world around them as more ‘risky.’²⁴
As we claimed earlier in the paper, over the long run infl ation tends to coincide with stagnating production and high unemployment. Th is claim is certainly unconventional. Indeed, the facts notwithstanding, most economists would probably reject it outright. As a monetary phenomenon, they would counter-argue, infl ation can have no lasting impact on the ‘real’ world. Th ey would concede that infl ation could be triggered by ‘real’ variables—but certainly not by stagnation. To the contrary, the popular macroeconomic canon stipu-lates that infl ation is triggered by growth and that it decreases with recession.
Unfortunately, here too the facts refuse to obey the theory. Figure 6 shows the long-term relationship between infl ation and economic growth in the United States, going back to 1890 (with the series smoothed as 20-year moving averages). Th e data show quite clearly that the relationship between the two phenomena is not positive, but negative. Low infl ation is associated with high growth, whereas high infl ation is commonly accompanied by stagnation—the exact opposite of what conventional theory wants us to believe. Infl ation tends to appear as stagfl ation. And this ‘perverted’ relationship is hardly limited to the United States. In fact, during the postwar period the long-term negative corre-lation between growth and infl ation has become the rule rather than the excep-tion, reproducing itself in country after country, developed as well as developing (see for example, Nitzan 1995a; Nitzan and Bichler 2002: Figure 2.8, p. 71).
Why do these facts diff er so dramatically from popular convention and economic theory? Th e reason has much to do with the timeframe. Th e argu-ment that rapid growth triggers infl ation can make sense only in the very short term and under the very stringent assumption that capacity is already fully uti-lized and cannot be immediately expanded to meet runaway demand.
Th is latter situation, however, is both rare and transitory. First, under so-called ‘normal’ conditions, physical capacity is never fully utilized. To illustrate, over the past century the average rate of unemployment in the United States has stood at 7 percent, and that excludes the categories of part-timers and the underemployed (not to mention those who choose not to work, are discouraged, or are incarcerated, and therefore considered ‘not in the labor force’). Various estimates of the utilization of actual capacity range from 25 percent to 50 per-
²⁴. Insofar as the perceived increase in ‘risk’ exceeds the increase in expected income, the net eff ect of infl ation will be lower asset prices. Th e impact on relative asset prices, however, is far more complicated (see footnote ).

Shimshon Bichler & Jonathan Nitzan286
cent.²⁵ Second, as overall growth continues, green-fi eld investment and capacity tend to rise even faster, causing ‘bottlenecks’ to give way to ‘glut.’²⁶
Th e question, though, is, why, in the absence of any real ‘shortage,’ are buyers willing to pay higher prices? Th e short answer is that usually they are not willing; they are forced. And the way to force them is by creating, imposing and maintaining various forms of social crisis, apparent or real. Military hostilities during the First World War, the reparation crisis of Germany in the 1920s, the global oil crises of the 1970s, rising unemployment in Israel during the 1980s, political instability in Russia circa 1990s, debt default in Argentina in the 2000s are all illustrations of such infl ation-triggering crises. Th e eff ect of these crises on infl ation is twofold. On the one hand, they undermine the power of most people to resist price increases. On the other hand, they enable a ‘consensus’ to emerge within dominant capital that infl ation can be used with ‘impunity.’ In this sense, stagfl ation is the macroeconomic appearance of ‘accumulation through crisis.’ Stagnation and unemployment, along with other forms of instability, confl ict and force, constitute the necessary backdrop for diff erential accumulation through diff erential infl ation.
But the process is highly perilous. More infl ation usually requires a more intense crisis and therefore implies mounting hazards. Th ose who lose from infl ation begin to oppose it, and even if they fail to stop it, instability heightens. And, so, although the potential gains from infl ation are huge, they are commen-surate with the risks—risks to diff erential accumulation specifi cally, and risks to the hegemony of capital more generally. From the viewpoint of dominant capital, therefore, infl ation is forever a double-edged sword. Eff ective but highly
²⁵. Conventional capacity measures consider what is feasible under the existing social order of business enterprise and production for profi t, and they usually estimate normal utilization to be in the to percent range. Alternative measures based on a mate-rial/technological limit, however, suggest a far lower utilization of capacity. At the turn of the twentieth century, Veblen (: ) put the actual rate of utilization at less than percent, a fi gure not much diff erent from later estimates reported in Blair (: ) and Foster (: ch. ). Interestingly, though not surprisingly, U.S. military contractors, engaged in the most destructive form of business enterprise, sometimes operate at as little as percent of their ‘capacity’ (U.S. Congress : ).
²⁶. To illustrate, think of East Asia during the s, where annual growth rates of to percent were associated with falling export prices. Was there anything mysteri-ous behind this combination of growth and defl ation? Hardly. Despite the rapid growth (or rather because of that growth), the investment-to-GDP ratio kept rising, while East Asian companies kept undercutting each other in a hyper-competitive trench war. It is no wonder that their prices kept falling.

Dominant Capital and the New Wars 287
dangerous, it is not the weapon of fi rst choice. It tends to emerge only when there is ‘no alternative.’
8. the new arsenal
To recap, the twentieth century fundamentally altered the nature of accu-mulation. Th e emergence of big government and big business gave rise to a new consolidation, ‘dominant capital.’ Th e new institution of incorporation, which for Marx signaled the ‘abolition of capital as private property within the framework of capitalist production itself,’ along with the rise of big govern-ment, helped create massive power coalitions that further intertwined business
Figure 6 – United States: Long Term Inflation and Growth*
Source: Historical data till 1928 are from Bank Credit Analyst Research Group. From 1929 onward, data are from the U.S. Department of Commerce through WEFA (series codes: GDP for GDP; GDP96 for GDP in constant prices).
* Series are shown as 20-year moving averages. The smooth curve running through the observations is drawn freehand for illustration purposes.** Ratio of GDP in current prices to GDP in constant prices.
-4
-3
-2
-1
0
1
2
3
4
5
6
7
8
-1 0 1 2 3 4 5 6 7 8 9 10
GDP IN CONSTANT PRICES (annual % change)
GD
P IM
PLI
CIT
PR
ICE
DE
FLA
TO
R**
(an
nual
% c
hang
e)
2002
1890

Shimshon Bichler & Jonathan Nitzan288
owners and state organs. In parallel, the ‘larger use of credit,’ whose signifi cance was fi rst studied by Th orstein Veblen, gave capital the infi nitely malleable form of fi nance.
Accumulation in the nineteenth century was thought of—certainly by theorists—largely in absolute terms. As such, it depended on economic growth and relative price stability; it was led by imperial conquest; and it was backed by a gold standard. In the twentieth century, and particularly after the Second Word War, the emphasis shifted toward diff erential performance. Furthermore, the arsenal of accumulation expanded to incorporate two brand new tech-niques—corporate amalgamation and stagfl ation.
Th us, instead of economic growth, dominant capital resorted more and more to corporate merger, and in lieu of geographic conquest it relied increas-ingly on foreign investment and the spread of business ideology and standard-ized accounting. Th e use of force in accumulation was not abandoned, of course, although it was greatly refi ned. Whereas previously force was often used for straightforward ‘material’ confi scation, now it was utilized in a more round-about way. Instability, confl ict and stagnation were now denounced as being ‘bad for accumulation.’ But behind the façade, they enabled a stealthy process of accumulation through infl ation. Th e gold standard, incompatible with this new accumulation technique, was doomed. Sooner or later it had to give way to the more fl exible power of purely fi at money and unbounded credit. And indeed, diff erential infl ation, invisibly mediated through stagnation and crisis, brought a surprisingly ‘orderly’ redistribution of income from workers to owners and from small fi rms to dominant capital.
Historically, the new accumulation arsenal of amalgamation and stagfl a-tion worked with increasing precision and surprising regularity. Figure 7 illus-trates the evolution of this pattern in the United States (with series smoothed as 5-year moving averages). Th e bottom series in the chart is our amalgama-tion index, measuring the buy-to-build ratio introduced in Figure 2. Th e top series provides a ‘stagfl ation index.’ Th e construction of this index is relatively straightforward. We begin with two basic series: the annual rate of unemploy-ment, which is a proxy for stagnation, and the annual rate of change of the Implicit GDP Defl ator, which is a proxy for infl ation. We then express each of these series in terms of standard deviations from its own historical average (for 1890–2001), add up the two standardized series and divide the sum by two.
Now note that, over the past century, the United States has always had some unemployment (read stagnation), along with a positive rate of infl ation (with the exception of the Great Depression, when diff erential infl ation was hidden by aggregate defl ation; see footnote 18 above). With the exception of the 1930s, then, the entire period was one of stagfl ation. Th e purpose of the stagfl ation
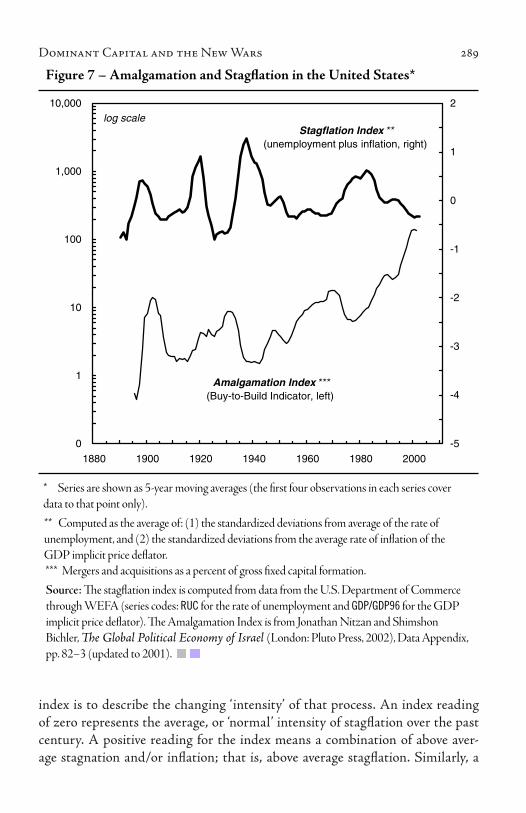
Dominant Capital and the New Wars 289
index is to describe the changing ‘intensity’ of that process. An index reading of zero represents the average, or ‘normal’ intensity of stagfl ation over the past century. A positive reading for the index means a combination of above aver-age stagnation and/or infl ation; that is, above average stagfl ation. Similarly, a
Figure 7 – Amalgamation and Stagflation in the United States*
* Series are shown as 5-year moving averages (the first four observations in each series cover data to that point only).
Source: The stagflation index is computed from data from the U.S. Department of Commerce through WEFA (series codes: RUC for the rate of unemployment and GDP/GDP96 for the GDP implicit price deflator). The Amalgamation Index is from Jonathan Nitzan and Shimshon Bichler, The Global Political Economy of Israel (London: Pluto Press, 2002), Data Appendix, pp. 82–3 (updated to 2001).
** Computed as the average of: (1) the standardized deviations from average of the rate of unemployment, and (2) the standardized deviations from the average rate of inflation of the GDP implicit price deflator.*** Mergers and acquisitions as a percent of gross fixed capital formation.
0
1
10
100
1,000
10,000
1880 1900 1920 1940 1960 1980 2000
-5
-4
-3
-2
-1
0
1
2
Amalgamation Index ***(Buy-to-Build Indicator, left)
Stagflation Index **(unemployment plus inflation, right)
log scale

Shimshon Bichler & Jonathan Nitzan290
negative reading on the index means a combination of below average stagnation and/or infl ation; namely, below average stagfl ation.
Of the two diff erential accumulation weapons—merger and stagfl ation—the former has proven more eff ective and less risky. As we have already seen in Figure 2, the ratio of merger to green-fi eld investment has risen exponen-tially over the past century. And since corporate amalgamation, almost by defi -nition, contributes to diff erential accumulation, it is no surprise that merger and takeover were enthusiastically endorsed by dominant capital, government organs and academic ideologues—all in the name of productive ‘effi ciency’ and national ‘competitiveness.’
A merger boom is largely incompatible with stagfl ation. Corporate take-over thrives on investors’ hype and an open takeover pool, which in turn require some measure of growth, proletarianization, capital mobility and relative politi-cal stability—the exact opposite of the crisis atmosphere needed for infl ation. In other words, diff erential breadth through corporate amalgamation and dif-ferential depth via stagfl ation are contradictory paths, each depending on an opposite set of social circumstances. In this sense, we can treat each path as a distinct ‘regime’ of diff erential accumulation. Of these two regimes, merger is the path of least resistance, and when it prevails, stagfl ation is likely to be dormant. But as noted in Section 6, amalgamation is sometimes diffi cult, and when its pace declines, the door opens for the crisis-ridden but highly eff ective path of stagfl ation.
It is crucial to emphasize, again, that our argument here is neither ‘econ-omistic’ nor ‘deterministic.’ Diff erential accumulation is not about ‘economics.’ It is about power and opposition to power. Th e symbolic form of this power is fi nancial, but its content is political in the broadest sense of the term. Dif-ferential accumulation is evidence—certainly in the mind of accumulators—of growing social power. Indeed, without power, there could be no diff erential accumulation. Th is emphasis on power and resistance to power also suggests, and here we come to the issue of determinism, that the process does not have to follow a preset pattern—or any pattern for that matter. Simply put, diff erential accumulation does not have to happen. It will happen if there are mergers. It will probably happen if there is stagfl ation. But mergers and stagfl ation themselves do not have to happen. Dominant capital may seek mergers or stagfl ation, but it could fail to achieve them—fail because of opposition, inner confl icts, or its own incompetence. And if neither merger nor stagfl ation prevails, the likely result is diff erential decumulation.
In this light, the stylized pattern evident in Figure 7 is remarkable, to say the least. Th e chart shows the amalgamation and stagfl ation cycles moving almost as mirror images of each another. And what is more, the negative cor-

Dominant Capital and the New Wars 291
relation between them seems to have grown tighter over time.²⁷ Given that both regimes serve to boost diff erential accumulation, it is clear that, de facto, dominant capital has been increasingly eff ective in securing its power. But none of this was ‘automatic.’ Th e power of dominant capital is conscientiously con-structed against opposition. It is replete with confl ict and besieged by contra-dictions. It can fail.
9. deflation
Th e conjectural nature of the process is all too clear at the present moment, as is illustrated by the last few data points in Figure 7. In 2000, corporate amal-gamation collapsed, bringing the twenty-year global merger wave to an end (see also Figure 2). In parallel, the long downtrend in stagfl ation seems to have bot-tomed out.
Th is apparent swing of the pendulum—should it materialize—has been long in coming (and indeed predicted—see for instance Nitzan 1999; 2001). Over the past twenty years, the prolonged process of breadth expansion, par-ticularly the opening up for business and green-fi eld investment of ‘emerging markets’ in Asia, Latin America and the former Eastern Block, has created a massive global glut. Although mergers worked to contain these centrifugal forces to some extent, they could not stop them. And as a result, the intensity of stagfl ation declined more or less continuously since the mid-1980s, and in 2001 reached its lowest level in 70 years, according to Figure 7.
By the end of the twentieth century, corporate ‘pricing power’ had weak-ened to its lowest point since the Great Depression. CPI infl ation in the indus-trialized countries declined throughout much of the 1980s, reaching 1 percent in 1999—its lowest since the 1950s (see Figure 10 below). Similarly, in 2000, with the ‘new economy’ hype having been punctured, corporate earnings—both globally and in the U.S.—took a nose-dive, showing their steepest drop since the 1930s.
Clearly, the current situation is not the best for dominant capital. Indeed, with mergers having entered a deep freeze and unlikely to revive any time soon, and with pricing power in the doldrums, there is a real threat of diff erential decumulation taking hold.
²⁷. Th e -year moving correlation between the stagfl ation and amalgamation indi-ces (with the amalgamation index measured as natural log and expressed as deviation from its own trend) rose from a +. in , to –. in .

Shimshon Bichler & Jonathan Nitzan292
The Risk
Th e negative sentiment is most vividly captured by the sudden reappear-ance of a new-old threat: defl ation. For much of the postwar era, the policy and academic rhetoric was focused almost exclusively on infl ation. Th is preoccupa-tion began in the early 1940s. Within a few years after the Great Depression, defl ation had already become a distant memory. John Maynard Keynes, who had just published the seminal text on how to fi ght unemployment, quickly shifted his attention to the threat of rising prices. His subsequent book, aptly titled How to Pay for the War (1940), set the tone. From then on, the goal was to stop infl ation. Forty years later, theorists and central bankers fi nally saw light at the end of the tunnel: in the 1980s, infl ation began to ease. Th e rhetoric, though, had not changed much. Th e experts became less fearful of the (neutral) beast, and there was a lot of self-congratulating analysis for winning the anti-infl ation
Figure 8 – The Threat of Deflation
* January-April.Source: Business Source Premier.
0
1
2
3
4
5
6
7
8
9
10
11
12
13
14
15
16
17
18
1980 1982 1984 1986 1988 1990 1992 1994 1996 1998 2000 2002 2004
Number of articles containing the word "deflation" as a % of the number of articles
containing the word "inflation"
percent*

Dominant Capital and the New Wars 293
‘battle.’ But the discourse was always qualifi ed by a call for vigilance. Th e mon-ster was indeed caged, but it could always escape. When it came to infl ation, you could not be overly cautious.
And then, suddenly, the tone changed. Th e reversal is starkly illustrated in Figure 8. Th e data in the chart are derived from a text search of EBSCO’s Business Source Premier, a database covering more than 2,800 scholarly business journals in English. For every year since 1980, we counted the number of articles that contained the word ‘defl ation’ and the number of articles that contained the word ‘infl ation,’ and we computed the ratio between them.
Th e result points to 1998 as a clear watershed. Till then defl ation was not even on the radar screen: the ratio of defl ation-to-infl ation articles averaged 2.5 percent and rarely exceeded 3 percent. But in 1998, with fear of glut fi nally trig-gering the Asian Crisis, and with ‘contagion’ beginning to infect the major stock markets, concern for defl ation skyrocketed and the index jumped more than fourfold, to over 10 percent. Initially, the unfolding high-tech mania helped camoufl age the problem, making the 1998 episode look like false alarm. But the high-tech mania was coming at the cusp of the long breadth regime of corporate mergers. And when, in the early 2000s, the fl oor fi nally fell out and the stock market collapsed, the defl ation-to-infl ation index jumped to nearly 8 percent in 2001, rising further to 12 in 2002, and to 16 percent in the fi rst four months of 2003. Th e ghost of defl ation came back with a vengeance.
Th e current fear of defl ation is not unfounded. Falling prices obviously are a threat to diff erential accumulation. With mergers stuck in neutral, dominant capital now needs to kick-start infl ation, not combat defl ation. But the prob-lem runs much deeper. Over the past half-century, and particularly since the early 1980s, debt loads measured relative to GDP have soared to unprecedented levels.²⁸ Th e increase in debt has taken place in the context of continuously rising prices, which, by infl ating nominal GDP, have worked to partly mitigate the rising debt burden. Th is mechanism of lessening the debt load no longer works if prices stabilize; and it goes into reverse if prices start falling. Indeed, under the latter circumstances, central bankers may fi nd it diffi cult to lower
²⁸. Th e increase in debt loads refl ects a combination of several factors, including rising ‘multiple counting’ of chained obligations, fresh capitalization of previously non-capitalized incomes, increases in expected future income, a willingness to accept a lower ‘normal rate of return,’ and, paradoxically, a drop in perceptions of risk. Th e overall extent of the surge in the debt-to-GDP ratio is probably understated by the explosive growth over the past twenty years of ‘off -balance sheet’ obligations.

Shimshon Bichler & Jonathan Nitzan294
‘real’ interest rates (since depositors generally refuse to accept negative nominal rates); overextended debtors may become unable to service their debt; and some of these debtors may be forced into bankruptcy. If the process unfolds into a chain reaction, it could conceivably lead to a runaway debt defl ation, not unlike the one experienced during the 1930s.²⁹
As illustrated in Figure 9, the magnitude of this threat is serious, to put it mildly. Th e chart shows, for the period of 1919 to 2002, the value of U.S. total credit market debt expressed as a percent of GDP. It also depicts, for both developed and developing countries since the early 1960s, the growth of total credit to the private sector relative to GDP.
All three series suggest that debtors have become extremely leveraged. In the United States, the current debt load is nearly twice as high as it was in 1929, on the eve of the Great Depression. As the Great Depression unfolded, falling nominal GDP caused the debt-to-GDP ratio to soar to over 270 percent. A comparable decline in nominal GDP today would push the debt-to-GDP ratio to over 400 percent. Th e data for the broader aggregate of countries cover only the private sector, but it is obvious that here, too, there is extreme stress. In the developed countries, the ratio of private credit to GDP is three times what it was in the early 1960s, whereas in the developing countries it is nearly four times as high.
The ‘Solution’
Th ere are two basic ‘solutions’ to this threatening ‘imbalance.’ One is to cut the amount of outstanding debt through default (debt forgiveness being a non-option). Th e other is to increase nominal GDP through price infl ation, while keeping ‘real’ interest rates relatively stable (‘real’ GDP growth being too slow for this purpose). Most practical economists consider the fi rst solution far too painful to contemplate, so their preference naturally gravitates toward the second.
‘Ignore the Ghost of Defl ation,’ recommends Financial Times columnist Samuel Britton. ‘Apart from Japan,’ he observed, ‘the world has not seen defl a-tion for 70 years’ (as if the world’s second largest economy can be treated as an anomaly, and ‘70 years’ as a magic threshold beyond which defl ation can
²⁹. Th e fi rst to analyze the process of debt defl ation in some detail was the American economist Irving Fisher (). Fisher wrote his analysis after the Crash wiped out much of his own fortune of million (over million in today’s prices), a fortune which he invested under the sound assumption that money was ‘neutral’ and that debt loads did not matter.

Dominant Capital and the New Wars 295
never return). ‘Defl ation is an overblown worry,’ declares James Grant, editor of Grant’s Interest Rate Observer. ‘Believe in Ghosts, Goblins, Wizards and Witches if you will,’ concurs fi nancial expert Adrian Douglas, ‘but don’t believe in defl ation occurring any time soon.’ Th ere is little to worry about, says Fed Chairman Alan Greenspan: ‘Th e United States is nowhere close to sliding into a pernicious defl ation.’³⁰
Of course, denying the problem does not solve it. And, so, for those who remain fearful, the experts promise that whatever the risk, it could easily be defused. ‘Th e good news,’ announces former member of the Federal Reserve Board, Angell Wayne, ‘is that monetary policy never runs out of power.’ ‘Th ere’s
Figure 9 – The Debt Load
Source: Bank Credit Analyst Research Group; World Development Indicators.
0
50
100
150
200
250
300
350
1910 1920 1930 1940 1950 1960 1970 1980 1990 2000 2010
United StatesTotal Credit Market Debt
(Private & Public)
High Income CountriesTotal Credit to the Private Sector
Developing CountriesTotal Credit to the Private Sector
1929
percent of GDP
2002
³⁰. All quoted statements in this paragraph and the next were made in , and except the one by Bernanke, all are cited from Prechter (: )

Shimshon Bichler & Jonathan Nitzan296
a much exaggerated concern about defl ation,’ laments Nobel Laureate Milton Friedman. ‘It’s not a serious prospect. Infl ation is still a much more serious prob-lem than defl ation. Today’s Federal Reserve is not going to repeat the mistakes of the Federal Reserve of the 1930s. Th e cure for defl ation is very simple. Print money.’ Th e same assumption underlies the soothing speech by Fed Governor Ben Bernanke, given in 2002 to the National Economist Club. In his address, properly titled ‘Defl ation: Making Sure “It” Doesn’t Happen Here,’ Bernanke explained that ‘Defl ation is always reversible under a fi at money system.’ ‘Th e U.S. government,’ he assured his audience, ‘has a technology called the printing press that allows it to produce as many U.S. dollars as it wishes at essentially no cost’ (Bernanke 2002).
Unfortunately, the matter is not that simple. Th e central bank can certainly print as much ‘high-powered money’ as it wants. But that act in itself does not necessarily mean higher prices, nor does it defuse the concerns of creditors. On its own, it is like ‘pushing on a string,’ as Keynes would have put it. For loose monetary policy to ‘translate’ into infl ation you need to have individual companies and workers actually raise their prices—and that may or many not happen. Japan after its 1989 market crash is a case in point: interest rates have fallen to zero and money has been made practically free—and yet defl ation, not infl ation, has prevailed. Alternatively, and as pointed out correctly by Robert Prechter (2003), simply opening the monetary fl ood gates when debt loads are extremely high could easily create panic, leading to distress selling among bond holders and loan calling by creditors. Th e result of this scenario is to trigger the very debt defl ation that policy loosening was meant to prevent.
10. the oil factor
Differential Profits and the Inflation Outlook
Infl ation cannot be ‘kick-started’ simply by having central banks print money. As we said, it has to start by having fi rms and/or workers charge higher prices for the goods and services they sell. Now, unlike corporate mergers, which individual fi rms can pursue more or less unilaterally, no single corporation can start infl ation ‘on its own.’ Raising your prices when no one else does is busi-ness suicide. A similar limitation restricts workers’ wage demands, especially in a global context where production can be relocated easily. For prices to start rising, particularly after a long period of relative stability and under conditions of perceived ‘glut,’ the stronger groups in society must share a common outlook that infl ation is indeed coming. And this collective outlook is most likely to emerge when these dominant groups feel that infl ation is not only ‘inevitable,’ but also in their diff erential interest.

Dominant Capital and the New Wars 297
In this sense, rising infl ation is not very diff erent from an investment-led boom. Th ere is little to prevent any individual fi rm from building new capacity. But for fi rms to actually go ahead and build new factories, they need to believe that this new capacity will increase profi t in the future; and that belief is most likely to trigger action when it is commonly shared. In other words, it is only when many fi rms begin to view green-fi eld investment favorably that individual companies begin to spend money on new plant and equipment.³¹ Once the pro-cess is set in motion, increases in production, income and spending make these profi t expectations self-fulfi lling, but the initial spark usually requires a change in the broad outlook of companies.
A similar process unfolds when infl ation begins to accelerate. As more and more fi rms start raising prices, and as income begins to be redistributed from workers to fi rms (Figure 4) and from smaller fi rms to larger ones (Figure 5), expectations for diff erential infl ationary profi ts are ‘validated,’ leading to even more price hikes. But like with investment, here, too, in order for the process to begin, there needs to be a common expectation, a shared view among the domi-nant groups in society that infl ation will boost their diff erential profi t.
Note our emphasis here on profi t expectations rather than price expectations. Th e diff erence is crucial. In mainstream economic theory, according to which everyone is powerless, price expectations can only be part of a passive mechanism in which ‘agents’ simply react to expected changes, their sole purpose being to sustain their existing equilibrium income. In the context of diff erential power, however, profi t expectations become part of an active strategy to enhance one’s relative position.
But fi rst there must be the initial change in diff erential profi t expectations, and, as these lines are being written (early 2003), it seems that this change may have begun. Dominant capital already feels its back pressed against the wall. As we have seen, merger activity has dried up and defl ation increasingly is viewed as a threat. Th ere is now a yearning among large fi rms for some ‘pricing power,’ even at the cost of stagfl ation and social instability. ‘Greenspan must go for higher infl ation,’ insist Bill Dudley of Goldman Sacks and Paul McCulley of Pimco in a recent Financial Times article. ‘Infl ation is too low, rather than too high,’ they warn, and ‘the Fed should welcome a modest rise in infl ation’ (Dudley
³¹. Note the fundamental diff erence between boosting current production to meet current increases in sales and building new factories whose profi tability will depend on conditions that will prevail a few years down the road. In the fi rst case, the impact on profi t is nearly certain, in the latter highly conjectural.

Shimshon Bichler & Jonathan Nitzan298
and McCulley 2003). And it is not as if the Fed has not been trying. Over the past two years Alan Greenspan has cut interest rates to levels last seen in the happy 1960s, making money cheaper and cheaper. Fear of defl ation is fi nally creeping into the Fed’s own statements. In a recent announcement, Greenspan warned of ‘unwelcome substantial fall in infl ation’ (Press Release, May 6, 2003). Th at is probably the fi rst time since the Great Depression that the U.S. central bank has said that lower infl ation is ‘unwelcome.’ And a few days later, Treasury Secretary John Snow extended another invitation for infl ation when he sug-gested that his government would abandon its eight-year ‘strong-dollar policy.’³² Clearly, the circumstances have become ripe for a regime change. Th e only thing missing is a ‘spark.’
Inflation and the Price of Oil
In principle, many events could trigger a change in the collective mindset of dominant capital. A declaration of war, a sudden devaluation, massive riots, etc., could each do the trick. Over the past quarter-century, however, the most eff ective infl ation spark, undoubtedly, has been a rise in the price of oil.
Th e statistical correlation between oil prices and overall infl ation is illus-trated in Figure 10. Th e thick line shows the annual CPI infl ation in the indus-trialized countries (measured as the percent rate of change between the same months in successive years). Th e thin line denotes the so-called ‘real’ price of oil, denominated in 2002 U.S. dollars (computed as the dollar price of crude oil divided by the U.S. CPI). A rise in the ‘real’ price of oil means that the U.S. dollar price of oil increased faster (or fell more slowly) than the U.S. consumer price index, and vice versa when the ‘real’ price of oil dropped. As the chart shows, until the early 1970s the ‘real’ price of oil had little relationship with infl ation. From the mid-1970s onward, however, oil clearly became a ‘leading indicator’ for infl ation. It ‘led’ infl ation on the way up, it ‘led’ it on the way down, and, apparently, it still leads it today.
Note that we emphasize here oil prices as a ‘leading indicator’ rather than a ‘direct cause’ of infl ation. Th e relationship between oil prices and infl ation is
³². Incidentally, this announcement fl ies in the face of suggestions that the U.S. attack on Iraq was partly motivated by a desire to ‘defend’ the dollar. According to that argument, OPEC was allegedly planning to denominate its business in Euros instead of dollars, a move which would have weakened the dollar; hence the U.S. conquest of Iraq to prevent that switch from happening. Snow’s announcement puts a big dent in this thesis.

Dominant Capital and the New Wars 299
only partly anchored in the role of oil as a key production input.³³ Th e more important reason for the correlation is that the leading capitalist groups tend to view the price of oil as a ‘barometer’ of future infl ation and adjust their overall pricing strategies in line with its fl uctuations.³⁴
In 1999, when falling crude oil prices approached $10 a barrel, Th e Econo-mist of London confi dently predicted further declines. ‘Th e world is awash with oil,’ it stated, ‘and it is likely to remain so’ (Anonymous 1999a). In that same year, the more cautious U.S. Energy Information Administration predicted that oil prices would rise by a modest 2.5 percent annually for the next seven years.³⁵ With the breadth regime seemingly in full swing, happy scenarios of this type seemed perfectly plausible. Dominant capital was busy taking over other fi rms and hyping up its high-tech assets. It wanted to hear nothing of oil shocks and infl ation.
But the world was changing rapidly. In 2001, diff erential breadth came crashing down. Dominant capital, which till then had insisted on neoliberal ‘sound fi nance,’ suddenly became thirsty for depth-driven infl ation. And then, with little warning and in open defi ance of both ‘market forces’ and the experts, the price of oil tripled. As before, consumer prices followed suit. Yet, as Figure 10 shows, so far the increase in consumer prices remained muted.
³³. Over the past twenty years, the role of crude oil as a key input has declined dramatically. Energy effi ciency has doubled, while the ‘real’ price of oil has fallen by almost two thirds. As a result, the dollar value of oil produced in accounted for only . percent of world GDP, compared to . percent in . And yet, despite this massive decline in the input role of oil, the relationship between oil prices and infl ation has remained practically unchanged (fi gures computed from British Petroleum Annual; World Bank Annual).
³⁴. In fact, the greater the extent to which higher oil prices are ‘passed on’ to fi nal prices, the less the correlation should be between the ‘real’ price of oil and the rate of infl ation. Th is situation seems to have prevailed until the early s: the nominal price of oil rose; overall prices increased at roughly the same rate; and, as a consequence, the ‘real’ price of oil remained more or less fl at. From the early s onward, however, the ‘real’ price of oil became positively correlated with infl ation, which means that changes in oil prices were only partly ‘passed on’ to consumer prices. It is clear, then, that the post- mechanism was neither ‘automatic’ nor ‘neutral.’ It involved redistribution in favor of owners of oil when oil prices rose and redistribution in favor of owners of other com-modities when the price of oil fell.
³⁵. Computed as the compounded annual growth rate which would make the EIA benchmark price rise from its actual average of . in to its forecast level of . in . http://eia.doe.gov/oiaf/analysispaper/pdf/table.pdf

Shimshon Bichler & Jonathan Nitzan300
Th at dominant capital has an interest in higher infl ation right now seems beyond doubt. In the absence of infl ation, it faces the dual risk of debt defl a-tion and diff erential decumulation. Th e way out of this predicament is a change in diff erential accumulation regime—from breadth through merger to depth through stagfl ation. And the most likely trigger for the shift is a signifi cant—and suffi ciently persistent—increase in the price of oil.
Th is last requirement is worth elaborating. Dominant capital presently has an interest in infl ation, but judging by its hesitant response to the recent oil price hikes, it is not yet sure that such infl ation is coming. In order for the col-lective mindset of dominant capital to decisively shift toward depth and infl a-tionary profi t, the ‘oil spark’ probably needs to be both stronger and longer. And that strong and long spark requires agency.
Figure 10 – Inflation and the Price of Oil
Source: International Financial Statistics through WEFA (series codes: L64@C110 for CPI in the industrialized countries; L76AA&Z@C001 for the price of crude oil; L64@C111 for the U.S. CPI).
-5
0
5
10
15
20
1955 1960 1965 1970 1975 1980 1985 1990 1995 2000 2005 2010
-30
-20
-10
0
10
20
30
40
50
60
70
80
90
100
110
120
Real Price of Oil*(right)
CPI in the IndustrializedCountries (left)
annual %change
$2002 / bbl
* $ price of crude oil deflated by the U.S. CPI.

Dominant Capital and the New Wars 301
To reiterate, there is nothing ‘inevitable’ about this chain of events. As we said, diff erential accumulation may or may not happen. Likewise, there is no historical ‘law of motion’ dictating a timely shift from breadth to depth. Th e social and political changes involved in bringing about such a shift are huge, as are the consequences. Furthermore, the processes are both highly complicated and subject to multiple forms of opposition which may or may not be over-come. But to overcome that opposition will probably require a dose of purposeful human action.
Diff erential accumulation is the fi nancial form of increasing capitalist power. It cannot happen without such power. And power has no meaning in the absence of free will: the freedom to exert it or not to exert it; the freedom to chose its particular form; and, of course, the freedom to oppose it by those on whom it is imposed. If everyone were an automaton in the grand ‘structure’ of capitalism, there would be no capitalism. Th e ‘structure,’ or ‘logic’ of capitalism is articu-lated primarily by those who dominate it. Th ose who dominate it are those who profi t the most. And those who profi t the most often are those who experience the fastest diff erential accumulation. If we look for purposeful action in the current historical conjunction, they are the ones we should start with.
11. the weapondollar-petrodollar coalition³⁶
Th e groups that stand to gain the most from higher oil prices and the pen-dulum shift into depth are the transnational armament and oil companies, and, to some extent, also the oil producing countries. To explain why, it is worth taking a step back and considering some basic aspects of the oil business.
Making the Price Go Up
In a world ‘awash with oil,’ as Th e Economist put it, oil prices have little reason to rise. And the world is indeed awash with oil. According to the BP Statistical Review, current global proven oil reserves are equivalent to 40 produc-tion years, up from 30 years in 1960. Of course, these reserves are fi nite, so, ulti-mately they will be exhausted. But the exhaustion process has been going on for a century and half, and so far it has had no systematic impact on the price of oil.
Similarly with current production. Th e argument that oil prices fl uctuate with ‘excess demand’ and ‘excess supply,’ although popular, does not hold much water. If oil prices were indeed responsive to ‘market conditions,’ we would
³⁶. Th e theoretical arguments in this and the remaining sections, along with exten-sive empirical evidence, were fi rst published fi fteen years ago, before the – Gulf War (Bichler, Rowley, and Nitzan ; Nitzan, Rowley, and Bichler ; Rowley, Bichler,

Shimshon Bichler & Jonathan Nitzan302
expect to see inventories rise when the price of oil fell and vice versa when the price rose. In reality, though, the exact opposite has often happened. During the massive price increases of the 1970s and early 1980s, for instance, inventories actually rose instead of fell; and when the price of oil dropped during the 1980s, inventories fell instead of rose (Nitzan and Bichler 2002: Figure 5.5, p. 230).³⁷
So the price of oil has little to do with physical scarcity. Th at is obvious enough. But it has everything to do with perceived scarcity, and perceived scar-city has everything to do with the Middle East. Although the region currently accounts for only 30 percent of world oil production, it is the only place where production is permanently ‘under threat.’ Th ese threats vary greatly: there is the threat of war; the threat of internal strife; the threat of Islamic fundamen-talism; the threat of coups; you name it. So far, though, none of these threats has ever aff ected the physical availability of oil at the global level. Th ere were of course occasional reductions in the region’s output, but these reductions were always compensated for by increases elsewhere, keeping the world total on an even keel. Yet, as we said, considerations of actual supply are beside the point. What counts for the price of oil is risk—or rather, the perception of risk—and of this exotic commodity the region has always had ample supply.
Conflicts and Profits
How have these Middle East ‘risks’ served the large weapon and oil compa-nies? Consider fi rst the armament contractors. After the end of U.S. direct mil-itary involvement in Vietnam, domestic military spending fell sharply—from over 10 percent of GDP during Johnson’s presidency to less than 6 percent at the end of Carter’s (see Figure 16 below). Th e drop was compensated for to some extent by a sharp increase in military exports, which, by the end of that period, accounted for an estimated one third of all U.S. military-related profi t.³⁸ Th e bulk of these exports were now going to the Middle East, which, since the early 1970s, had replaced South-East Asia as the world’s leading market for exported
and Nitzan ). Th is work was further extended and updated in Nitzan and Bichler (), Bichler and Nitzan (), Bichler and Nitzan (b: ch. ) and Nitzan and Bichler (: ch. ).
³⁷. A note of caution. According to the logic of neoclassical economics, an increase in inventories is a sign of ‘excess supply’ only insofar as the inventory buildup is unde-sired. If the buildup is intentional, it should be counted as part of desired demand, not excess supply. Unfortunately, conventional economics cannot tell us how to distinguish between the two.
³⁸. For the precise computation, see Nitzan and Bichler (: –).

Dominant Capital and the New Wars 303
weapons and accounted for over one third of the global trade. Th e relative signifi cance of Middle East sales for the profi ts of the armament companies declined somewhat during Reagan’s military buildup of the early 1980s. But with the armament boom beginning to fi zzle out in the late 1980s and turning to bust with the fall of communism, the Middle East once more became a major source of military profi ts. It seems clear, therefore, that renewed confl ict in the region, particularly with direct U.S. involvement, is very much in the interest of the weapon contractors. Th eir diff erential profi ts are likely to rise—partly from rising sales to the region, but mostly from increased spending at home.
Th e impact of renewed confl ict in the region on oil profi ts should be equally large—although for a reason diff erent than most people think. Th e prevailing view, popular among leftwing and rightwing analysts, is that the U.S. invasions of Afghanistan and Iraq are part of a larger strategy whose goal is to gain direct control over the region’s oil reserves. Th is view may be true. But controlling the region’s reserves will not, in itself, make the oil companies richer.
Individually, each oil company of course is concerned with access to crude reserves. But for the oil companies as a group, the ‘access issue’ is passé. It is rhetoric which belongs to the breadth order of the 1950s and 1960s, a period when oil was in a ‘free fl ow,’ when a barrel sold for $2, when royalties were low or non-existent, and when profi ts depended mostly on production volume—that is, on ‘access.’ Th is situation changed fundamentally in the 1970s. Global diff er-ential accumulation swung into depth, crisis replaced prosperity, OPEC made the headlines, and the oil business shifted from a ‘free fl ow’ to a ‘limited fl ow.’ From then on, oil profi ts came to depend not on output, but on price. During the following three decades, world oil production increased continuously. But the growth in volume was moderate, roughly 1.5 percent a year, and was prac-tically insignifi cant when compared to the wild swings in prices, which often doubled or halved in a single year.³⁹
Th e consequences for the oil companies of their business shifting from a ‘free fl ow’ to a ‘limited fl ow’ are illustrated in Figure 11. Th e thicker line denotes the relative share of integrated oil companies in net corporate profi t worldwide. Th e thinner line measures the ‘real’ price of oil, derived by dividing the dollar
³⁹. World oil production—including crude oil, shale oil, oil sands and natural gas liquids—rose from . million barrels a day in , to . million a day in . Th e price of crude oil over the same period fl uctuated between a low of . per barrel and a high of . when measured in current dollars, and between . and . when mea-sured in dollars (production data from British Petroleum Annual; price data from International Monetary Fund Annual).

Shimshon Bichler & Jonathan Nitzan304
price per barrel by the U.S. CPI, and lagged one year.⁴⁰ Th e correlation between the two series leaves little to the imagination. For the oil companies, diff erential accumulation was, and still is, a matter of diff erential price: the higher the rela-tive price of oil, the higher their share of global profi t.⁴¹
Figure 11 – The Price of Oil and the Global Distribution of Profit*
Source: Datastream (series codes: OILNWD for the integrated oil companies; TOTMKWD for world total); WEFA (series codes: L76AA&Z@C001 for the price of crude oil; L64@C111 for the U.S. CPI).
** Net profit is computed by dividing market value by the price/earning ratio. Data are restated to reflect changes in the series constituent companies.
0
10
20
30
40
50
60
70
80
90
100
1950 1955 1960 1965 1970 1975 1980 1985 1990 1995 2000 2005 2010
0
2
4
6
8
10
12
14
16
18
20
22
24
Global Net Profit**:Integrated Oil Companies
as a Share of All Companies
(right)
$ Price of Oil / U.S. CPI(one year earlier, left)
$2002 / bbl percent
* Series are smoothed as 12–month moving averages.
⁴⁰. Since reported corporate earnings represent the sum of the past four quarters, the full impact on profi t of a change in the price of oil will be felt only after a year.
⁴¹. Th e correlation coeffi cient between the two monthly series measures . (out of ) for the period since January , and . for the period since January .
Dominant Capital and the New Wars 305
On the face of it, this relationship seems counterintuitive. For the oil com-panies, crude oil is the principal input, not output. It is the raw material which they refi ne into gasoline, diesel, petrochemicals and other derivatives. Con-sequently, should they not lose when crude oil becomes more expensive? Th e answer is negative. If the price of refi ned products were fi xed, higher crude oil prices would probably mean lower profi t. But the price of refi ned products is not fi xed. On the contrary, it tends to move up and down with the price of crude oil, causing profi t and cost to move not inversely with each other, but together.⁴²
⁴². For the mathematically inclined, assume for simplicity that the oil companies buy all their crude oil from others; that they refi ne the oil into fi nal products; and that they sell those products for profi t. By defi nition, the companies’ dollar profi t (∏) is the multiple of their output volume (Q), the dollar cost per unit of output (C) and the deci-mal profi t markup (K), such that:
∏ = K · C · Q
Using lower case notations to represent rates of change, we have:
π ≈ k + c + q
Suppose now that the price of crude oil goes up, so that c > . Assuming that the other costs of production remain unchanged, what happens to profi t depends on the relationship between c and (k + q). Profi t will fall if, and only if, (k + q) < –c; in other words, if, and only if, the multiple of the markup and output (K · Q) falls by more than the rise in C. Although possible, this outcome is very unlikely for two reasons. First, rising crude prices tend to both ‘fi re up’ the profi t expectations of oil companies and galvanize their cooperation. Th is closer cooperation, tacit or otherwise, usually works to keep profi t markups from falling, and often helps them go up. (Technically, there is nothing to prevent oil companies from changing their markups as they see fi t. But in the absence of an external ‘shock,’ such as a hike in the price of crude oil, raising the markup signifi cantly is too blatant an act to contemplate politically, and one which often is dif-fi cult to coordinate and maintain.)
Now, since higher costs and higher markups lead to higher prices, one would expect to see consumption—and thererfore output— fall. Oil products were made more expen-sive, so it is only natural for consumers to use less energy overall, as well as to substitute to alternative, non-oil sources. As it turns out, however, this negative impact usually is very small (in the jargon of economists, oil is ‘price-inelastic’). To illustrate, between and , the annual growth rate of crude oil consumption varied between a low of –. percent in and a high of . percent in —an overall range of only . percent. By comparison, the range of price changes during the same period was per-cent—prices fell by as much as percent in , and rose by as much as percent in (computed from British Petroleum Annual). Moreover, there was no clear correla-

Shimshon Bichler & Jonathan Nitzan306
During the early 1980s, crude prices expressed in 2002 dollars exceeded $80 a barrel. For the world, this was the height of the ‘energy crisis.’ For the oil companies, it was the peak of the ‘energy boom’: their earnings reached nearly 19 percent of all global corporate profi t. Since then, however, the ‘real’ price of oil tumbled, and so did the profi t share of the oil companies. Th e nadir was reached in 2000, toward the end of Clinton’s presidency, when oil profi ts were reduced to a mere 3 percent of the world’s total. Th e last couple of years show a sign of reversal. With the Bush family again in the White House and the new-speak of ‘globalism’ giving way to the old rhetoric of ‘imperialism,’ oil prices have recovered and oil companies have seen their global profi t share rising to between 6 and 8 percent. Of course, if this reversal is to continue, the price of oil will have to keep on rising. And for oil to become more expensive, the Middle East must be kept in ‘turmoil.’
Th e position of OPEC on the issue of confl ict is inherently schizophrenic. On the one hand, confl ict could be a very risky business, particularly when you are part of it. On the other hand, from the narrow viewpoint of earnings, the interest of oil producing countries is pretty much the same as that of the oil companies. Th is convergence is illustrated in Figure 12. Th e thick line in the chart shows the net profi t of the ‘Petro-Core,’ made up of the world’s six lead-ing non government oil companies: British Petroleum (BP-Amoco since 1998), Chevron (Chevron-Texaco since 2000), Exxon (ExxonMobil from 1999), Mobil (till 1998), Royal-Dutch/Shell and Texaco (till 2000) (all changes are due to mergers). Th e thin line displays the value of OPEC’s petroleum exports. Th e correlation between the two series is both positive and tight (correlation coef-fi cient of 0.83). And the meaning of this correlation is simple enough: Middle East confl ict, through its impact on the price of oil, has worked to boost OPEC’s income (as well as the income of non-OPEC producers), just as it has raised the profi ts of the oil companies.
So let us recap again. Dominant capital is now in need of infl ation. With mergers and acquisitions in low gear and the world toying with defl ation, the prospects are for diff erential decumulation and possibly debt defl ation. For defl ation to be averted and for diff erential accumulation to continue, there needs to be a shift from breadth and disinfl ation to depth and infl ation. Th is
tion between the two movements, with higher prices often coinciding with higher rather than lower consumption. To sum up, then, higher prices for crude oil (c > ) tend to be associated with stable or even higher markups (k ≥ ), as well as indeterminate but very small changes in output (q ≈ ). Th e net impact of higher crude prices on oil company profi ts therefore is almost always positive.

Dominant Capital and the New Wars 307
shift requires a change in the mindset of ‘price makers.’ Th e most eff ective trig-ger for such change is a return to ‘energy crises’ in the Middle East, with sizeable increases in the price of oil leading to higher infl ation. Within dominant capital, the groups that stand to benefi t the most from this shift are the oil and arma-ment companies. Also likely to gain, at least from the viewpoint of earnings, are oil producing countries in and outside OPEC. Th e only question is whether or not those who stand to gain from the shift can actually make it happen.
The Coalition
Th e answer remains to be seen. What does seem clear, though, is that the ‘political machinery’ necessary to bring this shift is presently in place. As we have described elsewhere at great length, this political machinery fi rst emerged
Figure 12 – OPEC and the Oil Companies
Source: OPEC Annual Statistical Bulletin; Fortune.
* British Petroleum (BP-Amoco since 1998), Chevron (till 2000), Exxon (ExxonMobil since 1999), Mobil (till 1998), Royal-Dutch/Shell and Texaco (till 2000). Company changes are due to merger.
-50
0
50
100
150
200
250
300
350
400
450
1955 1960 1965 1970 1975 1980 1985 1990 1995 2000 2005
-5
0
5
10
15
20
25
30
35
40
45
Petro-Core*Net Profit
(right)
OPEC'sPetroleum Export
(left)
$ billion $ billion

Shimshon Bichler & Jonathan Nitzan308
in the early 1970s in the form a Weapondollar-Petrodollar Coalition between the large armament, construction, oil and fi nancial corporations, in conjunction with OPEC and key Western governments. Th e key feature uniting this coali-tion was a common interest in some measure of confl ict in the Middle East and in high oil prices.
Representatives and owners of key companies within this coalition have grown increasingly intertwined with the hawkish administrations of Richard Nixon, Gerald Ford, Ronald Reagan and George Bush Sr. Even Jimmy Carter, who adopted a more conciliatory approach towards Middle East aff airs, did not manage to signifi cantly restrict their leverage.
One result of this ‘capital-state symbiosis’ was to keep U.S. energy policy conveniently fuzzy. ‘For many decades now,’ complained the authors of the Baker Report, ‘the United States has been without an energy policy’ (Morse and Jaff e 2001: 4). Indeed. According to Daniel Yergin’s analysis of over one thousand State Department cables and papers obtained under the Freedom of Information Act, between 1974 and 1981 the U.S. government in fact objected to higher oil prices, but it didn’t want to see those prices lowered either…. (Yergin 1991: 84, 643).
Offi cially, of course, the government of the United States was ‘fundamen-tally, irrevocably committed’ to maintaining the free fl ow of oil, and ‘the interest in the United States is bound to be cheap energy prices.’ Th at, at least, was how Vice President George Bush Sr. put it 1986 (New York Times, 7 April 1986). Interestingly, though, Bush made this declaration during his emergency trip to Saudi Arabia, a trip whose explicit purpose was to persuade the kingdom to cut output in order to raise the price of oil! Th e ‘free market’ was all good and dandy, but there was a limit. As Bush articulated it to the Saudis: ‘Th ere is some point at which the national security interests of the United States say, “Hey, we must have a strong, viable domestic interest”’ (ibid.).
Unlike with oil, the policy position on armament seemed unambiguous. Th e various U.S. administrations, along with the Soviet Union and count-less other countries, did their best to arm the Middle East to the teeth. Israel, Saudi Arabia, Iraq, Egypt, Iran under the Shah, Iran under Khomeini, Kuwait, Jordan, the Gulf Emirates—all received massive weapon shipments. Th ese shipments, of course, were all made in the interest of ‘stabilization,’ as Secre-tary of State William Rogers put it (cited in Engler 1977: 242). ‘Th e balance of power,’ explained the quintessential go-between, Henry Kissinger, ‘is a kind of policeman, whose responsibility is to prevent peaceful countries from feeling impotent and aggressors from becoming reckless’ (Kissinger 1981: 81).
Unfortunately, or fortunately, depending on the viewpoint, the ‘balance of power’ provided little stability to the region. In fact, it seems safe to conclude

Dominant Capital and the New Wars 309
it has done the exact opposite. Since 1967, the region has had numerous major confl icts, all fought with imported weapons, and all connected directly or indi-rectly to oil.
12. ‘energy conflicts’
Th e connection between oil and confl ict in the Middle East is hardly a nov-elty. Some confl icts—for instance, the 1990–1 war between Iraq and the U.S.-led coalition—have been attributed partly to a struggle over the control of crude reserves, whereas others—specifi cally the Arab-Israeli wars of 1967 and 1973 and the Iran-Iraq confl ict of 1980–8—were seen as having aggravated ongoing energy crises. Most of those studying the subject have concentrated on the link between confl ict on the one hand and oil prices and exports on the other. Few if any, however, have paid attention to the more subtle relationship between confl ict and oil profi ts.
Figure 13 and Figure 14 provide summary statistics on the relative fi nan-cial performance of the ‘Petro-Core’ referred to earlier. Figure 13 displays two measures of return on equity—one for the Petro-Core, the other for the Fortune 500 group of companies. Comparison of these two measures gives an indication for the relative performance of the Petro-Core. When the Petro-Core’s rate of return ‘beats’ the Fortune 500 average, it accumulates diff eren-tially. When it falls short of that average, it decumulates diff erentially. In the fi gure, these latter instances are darkened in black, and are labelled ‘danger zones’ for a reason which we shall explain shortly.
Th e same information is presented somewhat diff erently in Figure 14. Here we measure the rate of diff erential accumulation, fi rst, by taking for each year the diff erence between the rate of return of the Petro-Core and the average rate of return of the Fortune 500, and then expressing this diff erence as a percent of the Fortune 500’s (in order to ‘standardize’ the result). Here, too, instances of diff erential decumulation by the Petro-Core are darkened in black and labelled as ‘danger zones.’
Th e reason for using the term ‘danger zone’ has to do with the 11 ‘explosion’ symbols in Figure 14. Each of these symbols represents the breakout of a major Middle East confl ict—the 1967 Arab-Israeli War, the 1973 Arab-Israeli War, the 1979 Islamic Revolution, the 1979 Soviet Invasion of Afghanistan, the 1979 Israeli invasion of Lebanon, the onset of the 1980–8 Iran-Iraq War, the 1982 Israeli invasion of Lebanon, the 1990–1 Gulf War, the 2000 Palestinian Inti-fada, the 2001 U.S. invasion of Afghanistan and, fi nally, the 2002–3 second Gulf War. As it turns out, this string of confl icts has been intimately connected to the diff erential accumulation of the oil companies, and in more than one way.

Shimshon Bichler & Jonathan Nitzan310
First, since the late 1960s, all major Middle-East confl icts were followed by a period during which the Petro-Core beat the Fortune 500 average. In this sense, and whatever their ultimate ‘cause,’ these were all ‘energy confl icts.’ Now, that fi nding, although striking, should not surprise the reader: as we have already seen, diff erential oil profi ts are intimately correlated with the relative, or ‘real’ price of oil; the ‘real’ price of oil in turn is highly responsive to Middle East ‘risks,’ real or imaginary; these ‘risks’ tend to jump in preparation for and during armed confl ict; and as the ‘risks’ mount, they bring higher ‘real’ oil prices and
Figure 13 – Return on Equity: The Petro-Core* versus the Fortune 500**
Source: Fortune; Standard & Poor’s Compustat.
* British Petroleum (BP-Amoco since 1998), Chevron (till 2000), Exxon (ExxonMobil since 1999), Mobil (till 1998), Royal-Dutch/Shell and Texaco (till 2000). Company changes are due to merger.
0
5
10
15
20
25
66 68 70 72 74 76 78 80 82 84 86 88 90 92 94 96 98 00 02
Fortune 500
Petro-Core
percent
'Danger Zone'
** Until 1993, the Fortune 500 list included only industrial corporations (firms deriving at least half their sales revenues from manufacturing or mining). From 1994 onward, the list includes all corporations. For 1992–3, data for Fortune 500 companies are reported without SFAS 106 special charges.

Dominant Capital and the New Wars 311
therefore diff erential accumulation for the oil companies. Th e important thing to note here, though, is that ‘energy confl icts’ have led not to higher oil profi ts as such, but to higher diff erential oil profi ts. As Figure 13 shows, in 1969–70, 1975, 1980–2, 1985, 1991 and 2001–2, the rate of return on equity of the ‘Petro-Core’ actually fell; but in all cases it fell more slowly than the average rate of return of the Fortune 500, enabling the ‘Petro-Core’ to comfortably ‘beat the average.’
Figure 14 – The Petro-Core’s Differential Accumulation* and Middle
Source: Fortune; Standard & Poor’s Compustat.
* Differential accumulation is defined as the relative deviation of the return on equity of the Petro-Core from the return on equity of the Fortune 500. The Petro-Core comprises British Petroleum (BP-Amoco since 1998), Chevron (till 2000), Exxon (ExxonMobil since 1999), Mobil (till 1998), Royal-Dutch/Shell and Texaco (till 2000). Company changes are due to merger. Until 1993, the Fortune 500 list included only industrial corporations (firms deriving at least half their sales revenues from manufacturing or mining). From 1994 onward, the list includes all corporations. For 1992–3, data for Fortune 500 companies are reported without SFAS 106 special charges.** The specific ‘Energy Conflicts’ are listed in the text.
-80
-60
-40
-20
0
20
40
60
80
100
120
66 68 70 72 74 76 78 80 82 84 86 88 90 92 94 96 98 00 02
percent deviationfrom Fortune 500
'Energy Conflict' 'Danger Zone'
East ‘Energy Conficts’**
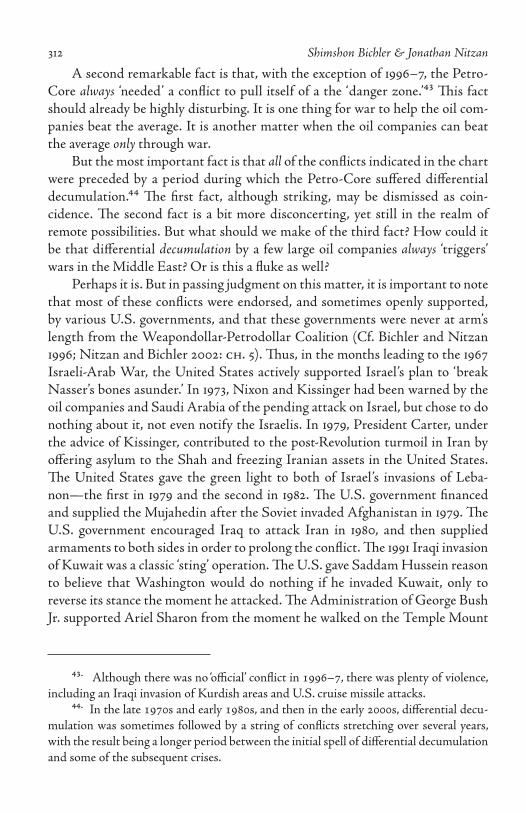
Shimshon Bichler & Jonathan Nitzan312
A second remarkable fact is that, with the exception of 1996–7, the Petro-Core always ‘needed’ a confl ict to pull itself of a the ‘danger zone.’⁴³ Th is fact should already be highly disturbing. It is one thing for war to help the oil com-panies beat the average. It is another matter when the oil companies can beat the average only through war.
But the most important fact is that all of the confl icts indicated in the chart were preceded by a period during which the Petro-Core suff ered diff erential decumulation.⁴⁴ Th e fi rst fact, although striking, may be dismissed as coin-cidence. Th e second fact is a bit more disconcerting, yet still in the realm of remote possibilities. But what should we make of the third fact? How could it be that diff erential decumulation by a few large oil companies always ‘triggers’ wars in the Middle East? Or is this a fl uke as well?
Perhaps it is. But in passing judgment on this matter, it is important to note that most of these confl icts were endorsed, and sometimes openly supported, by various U.S. governments, and that these governments were never at arm’s length from the Weapondollar-Petrodollar Coalition (Cf. Bichler and Nitzan 1996; Nitzan and Bichler 2002: ch. 5). Th us, in the months leading to the 1967 Israeli-Arab War, the United States actively supported Israel’s plan to ‘break Nasser’s bones asunder.’ In 1973, Nixon and Kissinger had been warned by the oil companies and Saudi Arabia of the pending attack on Israel, but chose to do nothing about it, not even notify the Israelis. In 1979, President Carter, under the advice of Kissinger, contributed to the post-Revolution turmoil in Iran by off ering asylum to the Shah and freezing Iranian assets in the United States. Th e United States gave the green light to both of Israel’s invasions of Leba-non—the fi rst in 1979 and the second in 1982. Th e U.S. government fi nanced and supplied the Mujahedin after the Soviet invaded Afghanistan in 1979. Th e U.S. government encouraged Iraq to attack Iran in 1980, and then supplied armaments to both sides in order to prolong the confl ict. Th e 1991 Iraqi invasion of Kuwait was a classic ‘sting’ operation. Th e U.S. gave Saddam Hussein reason to believe that Washington would do nothing if he invaded Kuwait, only to reverse its stance the moment he attacked. Th e Administration of George Bush Jr. supported Ariel Sharon from the moment he walked on the Temple Mount
⁴³. Although there was no ‘offi cial’ confl ict in –, there was plenty of violence, including an Iraqi invasion of Kurdish areas and U.S. cruise missile attacks.
⁴⁴. In the late s and early s, and then in the early s, diff erential decu-mulation was sometimes followed by a string of confl icts stretching over several years, with the result being a longer period between the initial spell of diff erential decumulation and some of the subsequent crises.

Dominant Capital and the New Wars 313
in 2000 and throughout the resulting Intifada. Finally, the background to the September 11 attacks is still engulfed in mystery if not secrecy; but the enthu-siasm of Bush Jr. to use these attacks as a pretext for invading Afghanistan and Iraq is hardly in doubt.
Of course, these observations themselves do not mean that Middle East wars were ‘premeditated’ in the boardrooms of the Weapondollar-Petrodol-lar Coalition and that the U.S. government simply ‘followed orders,’ triggering confl ict whenever it suited the Coalition. It is almost a cliché to say that confl ict and war are never mono-causal. Th ey always occur within a highly complex his-torical context, and that context can never be reduced to a ‘functional’ relation-ship between several ‘variables.’ But in the case of the Middle East, the context of confl ict cannot be comprehended solely from the narrow perspective of the warring factions; it cannot be understood without reference to its own conti-nuities and apparent ‘regularities’; and it cannot be analyzed separately from broader world developments.
Our own view is that Middle East confl icts were integral to the power processes of global accumulation. During the 1970s and 1980s, these confl icts helped trigger and sustain a global depth regime of stagfl ation—which in turn contributed to the diff erential accumulation of dominant capital in general, and of the Weapondollar-Petrodollar Coalition in particular. In the process, this coalition had become increasingly fused with its ‘parent’ governments on the one hand and its OPEC ‘hosts’ on the other, leading to a growing ‘capital-state symbiosis’ between them.
Whether or not there was ‘conspiracy’ here, and what the precise nature of such a ‘conspiracy’ was, remains an open question. Unfortunately, these types of issues are not the usual staple of primetime television. Occasionally, however, the truth does come to light, albeit with a little delay. Th e 1971 publication by Daniel Ellsberg of the Pentagon Papers, for example, revealed the clandestine story behind the Vietnam War (Chomsky, Zinn, and United States Depart-ment of Defense 1971). Similarly, the 1975 declassifi cation of the 1950 National Security Council Memorandum 68 (NSC 68) showed that the military buildup of the Cold War was explicitly designed, at least partly, as a ‘Keynesian stim-ulant’ (National Security Council 1950). Perhaps in due course someone will publish the secret ‘Exxon Papers’ or a declassifi ed ‘NSC Report on Energy and War in the Middle East,’ thereby opening a window into the backroom story of Energy Confl icts in the region.
One way or another, it is clear that during the 1970s and early 1980s the general context was highly favorable to confl ict. Th e diff erential interests of the various groups described above fi t nicely with the realist rhetoric of the ‘Cold War,’ ‘spheres of infl uence,’ the ‘national interest’ and ‘access’ to raw materials.

Shimshon Bichler & Jonathan Nitzan314
Th e net result of these converging interests, institutions and organizations was to make confl ict look more ‘natural,’ which in turn strengthened the hand of those who benefi ted from such confl ict and weakened those who opposed it. In short, it was ‘open season.’ War was less likely to be prevented, more likely to erupt (sometimes with active encouragement), and less likely to be stopped once under way.
13. breadth and the rise of ‘neoliberalism’
Th e importance of diff erential accumulation regimes for understanding Middle East confl icts is all the more evident when considering the relative ‘pause’ in these confl icts during the late 1980s and 1990s and the way this pause was connected with the shift from depth to breadth. Since the late 1980s, the Weapondollar-Petrodollar Coalition was running into increasing diffi culties. Th e profi t share of oil companies tumbled to unprecedented lows (Figure 11). Diff erential decumulation by the Petro-Core also proved far more diffi cult to resolve (Figure 13 and Figure 14). During the earlier period of the 1970s and early 1980s, drops in its diff erential performance were short. Every drop was quickly followed by confl ict, which in turn allowed the oil companies again to beat the average. By contrast, from the mid 1980s onward, wars became fewer and farther between, and their eff ect on diff erential performance usually was disappointing. Worse still, in 1991, George Bush Sr., a Weapondollar-Petrodol-lar loyalist who had just fi nished orchestrating a major international war, was more or less forced to announce the dawn of a ‘New World Order’ of peace. His successor, Bill Clinton, was already a declared ‘peacenik’ who moved swiftly toward resolving the Arab-Israeli confl ict. World military budgets during the 1990s fell sharply, arms exports went into a tailspin and the large armament contractors were reduced to a mere shadow of their past glory. ‘War profi t’ and confl ict were evidently out. Everyone was talking about ‘peace dividend,’ ‘global-ization,’ ‘emerging markets’ and the ‘end of history.’
Th e change certainly was infl uenced by the collapse of the Soviet Union and the disintegration of communism. But that disintegration itself was intimately connected to the expanding frontiers of diff erential accumulation. Th e last ‘envelope,’ which till then had separated the First World from the Second and Th ird, was fi nally broken, triggering a swift shift from depth to breadth. With communism gone, developing countries were more or less compelled to become ‘emerging markets’ open to Western investment. For dominant capital, corpo-rate merger had fi nally gone global. Civilian high-tech was promoted as the new panacea, investors’ optimism was relentlessly hyped up, and market indices and equity valuation were sent into the stratosphere. Th e winds of ‘neoliberalism,’ ‘deregulation’ and ‘openness’ began blowing stronger and stronger.

Dominant Capital and the New Wars 315
By the early 1990s, dominant capital as a whole shifted from relying on depth through stagfl ation to emphasizing breadth through corporate amalga-mation. But the shift also involved a realignment within dominant capital. Th e Weapondollar-Petrodollar Coalition that had led the earlier depth regime was now challenged by a new ‘Technodollar-Mergerdollar Coalition’ geared toward civilian high-tech, global expansion and corporate mergers.
Although there is some overlap between the two coalitions, their charac-teristics are fairly distinct. Th e top defense contractors are mostly high-tech companies, but they rely largely on military orders. By contrast, the large high-tech companies of the Technodollar-Mergerdollar Coalition sell mostly to the civilian market.⁴⁵ Similarly, while both coalitions went through massive corpo-rate consolidation during the 1990s, in the former case the process was largely defensive, whereas in the latter it was highly aggressive.
Th e reversal of fortune of these coalitions is evident in Figure 15. Th e chart shows the net profi t of two corporate clusters, both expressed as a percent of total world profi t: integrated oil and defense companies which proxy the Weap-ondollar-Petrodollar Coalition, and information technology hardware, telecom hardware and computer software and services, which together proxy the new Technodollar-Mergerdollar Coalition.
As the data indicate, the Weapondollar-Petrodollar Coalition reigned supreme till the early 1980s. At the peak of its power, in 1981, it scooped over 20 percent of the global profi t pie. Th en came a long decline, with the slack picked up, particularly since the early 1990s, by the Technodollar-Mergerdollar Coali-tion. Toward the end of the 2000s, the former’s share was reduced to nearly 3 percent, whereas the latter’s soared to 14 percent.
For the new coalition, high energy prices were a mortal threat. More expensive oil would have spoiled business confi dence and growth in ‘emerg-ing markets,’ upset capital mobility and merger prospects and interfered with
⁴⁵. Global data on the ‘military dependency’ of large companies are diffi cult to col-late, but the situation in the United States, which is probably indicative of the broader picture, seems fairly clear. Between and , the leading U.S. defense contrac-tors typically got to percent of their revenues from prime contract awards with the Department of Defense (Nitzan and Bichler : –). Th is ratio has surely increased with recent mergers in the sector. In , the comparable fi gure for the leading civilian high-tech companies based in the United States was a mere . per-cent (computed from the Fortune directory and from U.S. Department of Defense Annual). Th e latter companies often act as subcontractors to the leading defense fi rms, but the magnitudes involved are small relative to their total sales and do not change the overall picture.

Shimshon Bichler & Jonathan Nitzan316
Figure 15 – Shares of Global Net Corporate Profit*
Source: Datastream (series codes TOTMKWD for world total; OILINWD for integrated oil; DEFENWD for defense; INFOHWD for information technology hardware; TELEQWD for telecom equipment; SFTCSWD for software and computer services).
* Net profit is computed by dividing market value by the price/earning ratio. Series denote monthly data smoothed as 12–month moving averages.
0
5
10
15
20
25
1970 1975 1980 1985 1990 1995 2000 2005 2010
percentThe Weapondollar-Petrodollar Coalition
(Integrated Oil and Defense)
The Technodollar-Mergerdollar Alliance(Information Technology Hardware, Telecom
Equipment and Software and Computer Services)
the hyping up of the stock market. And since breadth accumulation benefi ted dominant capital as a whole, both rhetoric and policy tilted toward supporting the new regime. Experts began to sing the praises of a ‘new economy’ of techni-cal progress and infl ationless growth. Government defi cits were made smaller and economies were deregulated. Borders were opened and military spend-ing was reduced. Th e Middle East was put on a fast track toward becoming the next ‘emerging market,’ with peace deals popping up all over and frequent conferences recounting the wonders of regional cooperation and development. Even Israel’s dominant capital, which had made its greatest diff erential fortunes during the depth regime of confl ict and stagfl ation, bought into the dream of a ‘New Middle East’ with Israel as its ‘Silicon Waddi.’ Breadth accumulation was clearly the way to go.

Dominant Capital and the New Wars 317
14. the current crossroads
Regrouping
Th e Weapondollar-Petrodollar Coalition did not die, however. Far from it. During the 1990s, it was busy regrouping its organizations, realigning its poli-tics and reworking its ideology. Th e fi rst task was amalgamation. By the end of the decade, merger had fused many of the Petro-Core giants, formerly known as the ‘Seven Sisters,’ into even larger entities. Similarly with the armament companies. Clinton’s government and the EU encouraged them to bundle up, and within several years there emerged a new leading group of companies, the ‘Seven Angels of Armageddon,’ all intricately tied through joint development projects.⁴⁶
In the meantime, the policy hawks were busy drafting future plans. In 1996, Th e Institute for Advanced Strategic and Political Studies in Jerusalem tabled a report entitled ‘A Clean Break: A New Strategy for Securing the Realm’ (Perle et al. 1996). Th e study, written under the auspices of the Netanyahu govern-ment, called for a drastic change in Israeli policy. Th e ‘New Middle East’ had been a complete failure, the paper argued. Comprehensive peace was a mirage and paying for it with land was suicidal. Instead, Israel should strive for a ‘bal-ance of power.’ Forging an alliance with Turkey and Jordan, Israel should con-tain, destabilize and roll back Syria, its strongest foe. If needed, Israel should not shy from openly attacking Syria, militarily, both in Lebanon and on its own soil. Furthermore, ‘Since Iraq’s future could aff ect the strategic balance in the Middle East profoundly,’ the eff ort to roll back Syria ‘can focus on removing Saddam Hussein from power in Iraq—an important Israeli strategic objective in its own right—as a means of foiling Syria’s regional ambitions.’
Interestingly, the team that wrote the report was entirely American, and many of its members would soon become key fi gures in the government of George Bush Jr. Th e leader of the team was Richard Perle, former assistant
⁴⁶. By the late s, the world’s leading oil companies were Exxon-Mobil (with net profi ts of . billion), Royal-Dutch Shell (. billion), BP-Amoco ( bil-lion), Total Fina Elf (. billion), Chevron-Texaco (. billion) and ENI (.) billion. Th e ‘Seven Angels of Armageddon,’ a nickname suggested to us by Gibin Hong, consisted of Lockheed-Martin (with defense sales of billion), Boeing ( billion), BAE Systems ( billion), Raytheon ( billion), General Dynamics ( billion), EADS ( billion) and Northrop Grumman ( billion) (fi gures from Nitzan and Bichler : Table ., p. ).
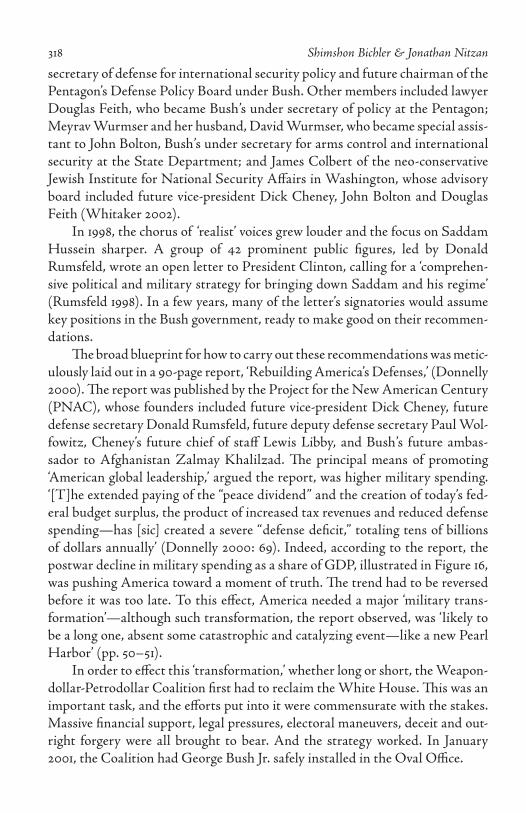
Shimshon Bichler & Jonathan Nitzan318
secretary of defense for international security policy and future chairman of the Pentagon’s Defense Policy Board under Bush. Other members included lawyer Douglas Feith, who became Bush’s under secretary of policy at the Pentagon; Meyrav Wurmser and her husband, David Wurmser, who became special assis-tant to John Bolton, Bush’s under secretary for arms control and international security at the State Department; and James Colbert of the neo-conservative Jewish Institute for National Security Aff airs in Washington, whose advisory board included future vice-president Dick Cheney, John Bolton and Douglas Feith (Whitaker 2002).
In 1998, the chorus of ‘realist’ voices grew louder and the focus on Saddam Hussein sharper. A group of 42 prominent public fi gures, led by Donald Rumsfeld, wrote an open letter to President Clinton, calling for a ‘comprehen-sive political and military strategy for bringing down Saddam and his regime’ (Rumsfeld 1998). In a few years, many of the letter’s signatories would assume key positions in the Bush government, ready to make good on their recommen-dations.
Th e broad blueprint for how to carry out these recommendations was metic-ulously laid out in a 90-page report, ‘Rebuilding America’s Defenses,’ (Donnelly 2000). Th e report was published by the Project for the New American Century (PNAC), whose founders included future vice-president Dick Cheney, future defense secretary Donald Rumsfeld, future deputy defense secretary Paul Wol-fowitz, Cheney’s future chief of staff Lewis Libby, and Bush’s future ambas-sador to Afghanistan Zalmay Khalilzad. Th e principal means of promoting ‘American global leadership,’ argued the report, was higher military spending. ‘[T]he extended paying of the “peace dividend” and the creation of today’s fed-eral budget surplus, the product of increased tax revenues and reduced defense spending—has [sic] created a severe “defense defi cit,” totaling tens of billions of dollars annually’ (Donnelly 2000: 69). Indeed, according to the report, the postwar decline in military spending as a share of GDP, illustrated in Figure 16, was pushing America toward a moment of truth. Th e trend had to be reversed before it was too late. To this eff ect, America needed a major ‘military trans-formation’—although such transformation, the report observed, was ‘likely to be a long one, absent some catastrophic and catalyzing event—like a new Pearl Harbor’ (pp. 50–51).
In order to eff ect this ‘transformation,’ whether long or short, the Weapon-dollar-Petrodollar Coalition fi rst had to reclaim the White House. Th is was an important task, and the eff orts put into it were commensurate with the stakes. Massive fi nancial support, legal pressures, electoral maneuvers, deceit and out-right forgery were all brought to bear. And the strategy worked. In January 2001, the Coalition had George Bush Jr. safely installed in the Oval Offi ce.
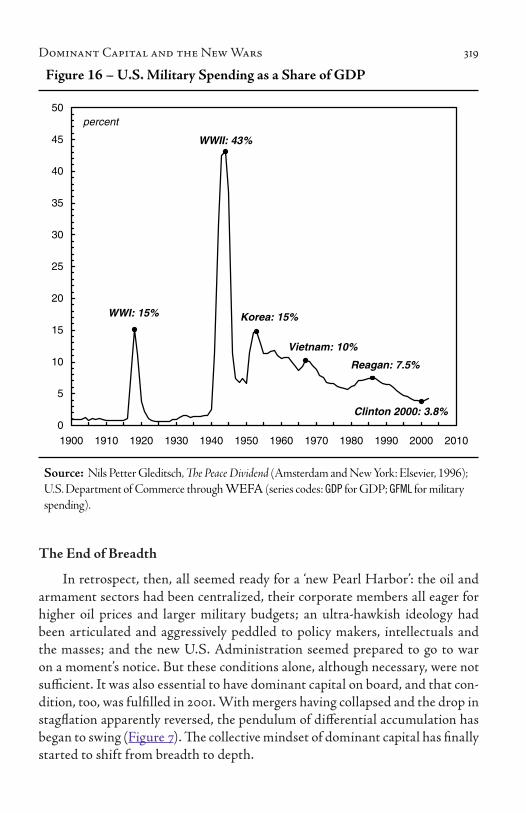
Dominant Capital and the New Wars 319
The End of Breadth
In retrospect, then, all seemed ready for a ‘new Pearl Harbor’: the oil and armament sectors had been centralized, their corporate members all eager for higher oil prices and larger military budgets; an ultra-hawkish ideology had been articulated and aggressively peddled to policy makers, intellectuals and the masses; and the new U.S. Administration seemed prepared to go to war on a moment’s notice. But these conditions alone, although necessary, were not suffi cient. It was also essential to have dominant capital on board, and that con-dition, too, was fulfi lled in 2001. With mergers having collapsed and the drop in stagfl ation apparently reversed, the pendulum of diff erential accumulation has began to swing (Figure 7). Th e collective mindset of dominant capital has fi nally started to shift from breadth to depth.
Figure 16 – U.S. Military Spending as a Share of GDP
Source: Nils Petter Gleditsch, The Peace Dividend (Amsterdam and New York: Elsevier, 1996); U.S. Department of Commerce through WEFA (series codes: GDP for GDP; GFML for military spending).
0
5
10
15
20
25
30
35
40
45
50
1900 1910 1920 1930 1940 1950 1960 1970 1980 1990 2000 2010
Clinton 2000: 3.8%
Reagan: 7.5%
Vietnam: 10%
Korea: 15%
WWII: 43%
WWI: 15%
percent

Shimshon Bichler & Jonathan Nitzan320
In our view, without this change in the outlook of dominant capital, September 11 probably would not have become America’s ‘new Pearl Harbor.’ Had the attacks on the Twin Towers and the Pentagon occurred not in 2001, but in the mid 1990s, at a time when the stock market boom was still in full swing, when ‘emerging markets’ were still red hot, and when high-tech mergers were reshaping the corporate landscape, it is doubtful that a U.S. administra-tion—even one headed by George Bush Jr.—would have been able to substitute ‘infi nite war’ for ‘neoliberal globalization.’ In this sense, the 2001 timing of the attacks was ‘perfect’ (if that is the proper word). Th e attacks came after the stock market had been punctured, after the merger boom had collapsed, after the neoliberal rhetoric had begun to backfi re in ‘emerging markets,’ and after defl ation had emerged as a threat. When the Twin Towers came down, the Technodollar-Mergerdollar Coalition was already in tatters, its profi ts melting, its neoliberal vision tarnished. Dominant capital was fi nally ripe for a ‘regime change’ in the nature of diff erential accumulation, ready to accept the resur-rected Weapondollar-Petrodollar Coalition as its new locomotive, ready to shift from ‘peace dividends’ back to ‘war profi ts.’
The New Wars
It was against this background that George Bush Jr., on the night of Septem-ber 11, could confi dently dictate to his diary: ‘Th e Pearl Harbor of the twenty-fi rst century took place today; We think it’s Osama bin Laden…. We cannot allow a terrorist thug to hold us hostage. My hope is that this will provide an opportunity for us to rally the world against terrorism’ (Balz and Woodward 2002). Th e next day, secretary of defense Donald Rumsfeld suggested that the United States use the opportunity to go after Iraq. Th e suggestion had many supporters, but, in the end, on the counter advice of secretary of state Colin Powell, it was decided to cater to ‘American public opinion’ and, instead, begin with Al Qaeda in Afghanistan (Woodward and Balz 2002).
Offi cially, the new wars are against terrorism. Unoffi cially, they are about securing cheap oil. And, so far, they have ‘failed’ on both counts. Terrorism remains unabated, and oil, instead of becoming cheaper, has grown more expen-sive. And, yet, to the surprise of many, despite this double failure, the ‘business community’ remains quiet: ‘why is Wall Street silent on the war?’ asked Bloom-berg commentator Michael Lewis (2003). Obviously, the reason is not lack of interest. If anything, the new wars are probably the most ‘commodifi ed’ in his-tory, with every move and development on the ground immediately reverberat-ing thought the entire grid of fi nancial markets. Furthermore, the few commen-tators who do make their opinions known show that dominant capital is well aware of the issues at hand. Th us, George Soros (2003) openly blamed Bush for

Dominant Capital and the New Wars 321
his ‘infl ated sense of supremacy,’ warning that ‘war on terrorism cannot be the guiding principle of U.S. foreign policy.’ Th e dangers inherent in such policy were explained by Bill Gross of PIMCO, one of the world’s largest bond man-agement companies: ‘Investors must know that perpetual containment [of ter-rorism] entails costs—not just monetary but those involving potential policy reversals that have formed the backbone of America’s economic hegemony for nearly seven decades.’ Free trade, open capital markets and a strong dollar now were all at risk. ‘Because of 9/11 and our necessity to fi ght a new kind of war,’ says Gross, ‘America is losing its peace dividend at a time when—because of high debt, over consumption, and refl ective trade defi cit—we cannot aff ord to’ (Gross 2003). Clearly, then, dominant capital understands full well that the new wars could mark the end of neoliberalism, at least for the time being.
So why the silence? According to Michael Lewis, the reason is fear. Th e ‘fear of saying the wrong thing,’ which, in his opinion reveals the ‘impotence of the putatively powerful.’ And perhaps he is right. But there is another possibil-ity, the one argued in this paper. Th e tentative reversal shown in Figure 7—the fall of the amalgamation index and the coinciding upturn of the stagfl ation index—suggests that the pendulum of diff erential accumulation may have begun swinging from breadth to depth. In our view, dominant capital under-stands that the new wars could seriously undermine neoliberal globalization. But unlike diehard ‘peaceniks’ such as George Soros and Bill Gross, most of its members feel that the new trajectory of confl ict is presently better for accumu-lation, and therefore say little and do even less. In the current historical con-junction, this inaction allows the new wars to continue and the pendulum to swing from breadth to depth.
And yet this new trajectory remains precarious. Th e Weapondollar-Petro-dollar Coalition, which once more occupies the driver’s seat within dominant capital, needs an atmosphere of permanent threat. Military spending has just begun recovering from its abyss (Figure 16). Th ese expenditures could continue rising—but only if the threats they are supposed to answer can be ‘demon-strated’ as signifi cant and credible. And in a unipolar world, without an oppos-ing superpower, those threats could only be ‘demonstrated’ through open and continued confl ict.
From this perspective, the occupation of Afghanistan and Iraq provided a good start, with plenty of media coverage and no end in sight. But unfortu-nately for the NeoCons and the armament companies, so far the campaigns have proven far too ‘effi cient.’ Th eir combined cost for 2002–3 is estimated around $100–120 billion. Spread over two years, this sum is equivalent roughly to 0.5 percent of U.S. GDP. A longer occupation of Iraq, including reconstruc-tion and interest expenses, would cost much more—$418 billion over ten years

Shimshon Bichler & Jonathan Nitzan322
according to a ‘worst-case scenario’ published by the House Budget Committee of the Democratic Party (Spratt 2003). But, then, even this infl ated sum would represent a mere 0.3 percent of GDP. As illustrated in Figure 16, these ratios remain far smaller than the ‘requirements’ of past confl icts. And the Pentagon, aware of these limitations, projects military spending over the next fi ve years to rise by only 4.1 percent annually, roughly in line with GDP. Of course, the situation would change dramatically if there were new confl icts in the pipeline, which perhaps explains the endless hype about the Axis of Evil and the need to ‘spread democracy.’
Th e outlook for the oil companies is similar. For them, too, the war in Iraq was won way too easily. As these lines are being written (early 2003), the price of crude oil hovers at around $25 to $32 per barrel—higher than before the war, but still far below previous records (Figure 11). Unless confl ict resumes—either through new campaigns or through more intense skirmishes with ‘terrorists’ and ‘fundamentalists’—the likelihood is for oil prices to fall, and for the oil companies to again suff er diff erential decumulation. And so, here too the Axis of Evil has a role to play—although as far as the oil companies are concerned, that ‘role’ should not deviate too far from the oil regions.
Finally, so far the new wars and rising oil prices have managed to keep the world from sliding into defl ation (Figure 10). But the danger remains. And it is on this issue that the fate of the Bush Administration, the Weapondollar-Pet-rodollar Coalition, and the nature of diff erential accumulation more broadly, all hinge. Many big capitalists, whose instincts remain Keynesian, believe that the new wars will be ‘expansionary’ and that expansion is infl ationary. ‘Keynesian theory might be old,’ explain the analysts of Stratfor Forecasting to their clients, ‘but it does teach us a basic truth, which is that the cure for defl ation is economic stimulation through government spending…. So anyone who was concerned about defl ation should be relieved that the Bush administration has adopted Keynes’ (Anonymous 2003). Of course, since infl ation tends to appear as stag-fl ation, the Keynesian hopefuls may well be puzzled to see prices start rising in the midst of stagnation. But as long as infl ation does rise and pricing power is restored, they will be happy to keep ‘silent on the war.’ However, if the new wars fail to deliver—because the confl icts are not suffi ciently ‘intense,’ because the hostilities do not create enough ‘scarcity’ in the oil market, or because infl ation does not ‘respond’ to higher oil prices—the opposition from within dominant capital will likely become much more vocal.
And, in this sense, perhaps little has changed. ‘It is a sad world indeed,’ commented Michal Kalecki at the height of the Vietnam War, ‘where the fate of all mankind depends upon the fi ght between two competing groups within American big business. Th is, however, is not quite new: many far-reaching

Dominant Capital and the New Wars 323
upheavals in human history started from a cleavage at the top of the ruling class’ (Kalecki 1967: 114).
Update (June 2004)
Since this paper was submitted for publication in June 2003, the U.S. ‘vic-tory’ in Iraq has proven illusive and the ‘war on terror’ rather diffi cult to win. Guerrilla warfare, terrorist attacks, counterattacks and reprisals have intensi-fi ed in Iraq and elsewhere in the Middle East. Th e price of crude oil has risen further, and it currently hovers around $40 per barrel. In parallel, the ‘risk’ of defl ation seems to have subsided. Despite the presence of ample idle produc-tive capacity, infl ation has picked up and the Federal Reserve Board recently announced it is ready to step on the monetary breaks should the need arise. For the fi rst time since the 1980s, analysts have began contemplating the prospects of renewed stagfl ation. Increasingly, this new reality seems obvious. Indeed, many experts, who until only a year ago dismissed this new reality as ‘nonsense,’ now know to tell us that they have ‘anticipated it all along.’
references
Anonymous. a. “Drowning In Oil,” The Economist, March , pp. .Anonymous. b. “Microsoft and the Future,” The Economist, November , pp.
–.Anonymous. . “Global Investing. Comparing Hedge Funds and Oranges,”
Financial Times, January , p. .Anonymous. . “The Economy of War,” Stratfor Forecasting, March .Balz, Dan, and Bob Woodward. . “America‘s Chaotic Road to War: Bush‘s
Global Strategy Began to Take Shape in the First Frantic Hours After Attack,” Washington Post, January , pp. a.
Bernanke, Ben S. . Deflation: Making Sure “It” Doesn‘t Happen Here. Washington D.C.: Federal Reserve Board.
Bichler, Shimshon, and Jonathan Nitzan. . “Putting the State In Its Place: US Foreign Policy and Differential Accumulation in Middle-East Energy Conflicts,“ Review of International Political Economy, (): –.
Bichler, Shimshon, and Jonathan Nitzan. a. “The Enigma of Capital,” Mimeograph, Political Science, York University, Toronto, pp. –.
Bichler, Shimshon, and Jonathan Nitzan. b. From War Profits to Peace Dividends. Hebrew. Jerusalem: Carmel.
Bichler, Shimshon, Robin Rowley, and Jonathan Nitzan. . “The Armadollar-Petrodollar Coalition: Demise or New Order?” Working Paper /, Department of Economics, McGill University, Montreal, pp. –.
Blair, John M. . Economic Concentration: Structure, Behavior and Public Policy. New York: Harcourt, Brace Jovanovich.
Bohm, David. . Wholeness and the Implicate Order. London: Routledge.

Shimshon Bichler & Jonathan Nitzan324
Bohm, David, and David F. Peat. . Science, Order, and Creativity. nd ed. New York: Routledge.
Brealey, Richard, Stewart Myers, Gordon Sick, and Ronald Giammarino. . Principals of Corporate Finance. ⁿd Canadian ed. Toronto: McGraw-Hill Ryerson Limited.
British Petroleum. Annual. BP Statistical Review of World Energy. London: The British Petroleum Company.
Buffett, Warren. . Berkshire Hathaway Inc. Annual Report. Castoriadis, Cornelius. . “Value, Equality, Justice, Politics: From Marx to
Aristotle and from Aristotle to Ourselves,” in Crossroads in the Labyrinth. Brighton, Sussex: The Harvester Press Limited, pp. –.
Chomsky, Noam, Howard Zinn, and United States Department of Defense. . The Pentagon Papers: The Defense Department History of United States Decisionmaking on Vietnam. The Senator Gravel ed. Boston: Beacon Press.
Donnelly, Thomas. . “Rebuilding America‘s Defenses. Strategy, Forces and Resources for a New Century,” A Report of The Project for the New American Century, September. Washington D.C.
Dudley, Bill, and Paul McCulley. . “Greenspan Must Go For Higher Inflation,” Financial Times, April , pp. .
Engler, Robert. . The Brotherhood of Oil. Energy Policy and the Public Interest. Chicago and London: University of Chicago Press.
Fischer, David Hackett. . The Great Wave: Price Revolution and the Rhythm of History. New York and Oxford: Oxford University Press.
Fisher, Irving. . “The Debt-Deflation Theory of Great Depressions,” Econometrica (): –.
Foster, John Bellamy. . The Theory of Monopoly Capitalism. An Elaboration of Marxian Political Economy. New York: Monthly Review.
Friedman, Milton. . “Wincott Memorial Lecture,” September , at London.Gross, Bill. . Hegemonic Decay. PIMCO, February.Hall, R. L., and C. J. Hitch. . “Price Theory and Business Behaviour,” Oxford
Economic Papers (): –.Harcourt, Geoffrey C. . “Some Cambridge Controversies in the Theory of
Capital,” Journal of Economic Literature (): –.International Monetary Fund. Annual. International Financial Statistics.Kalecki, Michal. . []. “Costs and Prices,” in Selected Essays on the Dynamics of
the Capitalist Economy, –. Cambridge: Cambridge University Press, pp. –.
Kalecki, Michal. . []. “Vietnam and U.S. Big Business,” in The Last Phase in the Transformation of Capitalism. New York and London: Modern Reader, pp. –.
Keynes, John Maynard. . The General Theory of Employment Interest and Money. New York: Harcourt, Brace and Company.
Keynes, John Maynard. . How to Pay for the War: A Radical Plan for the Chancellor of the Exchequer. London: Macmillan.

Dominant Capital and the New Wars 325
Kissinger, Henry. . For the Record. Selected Statements –. Boston and Toronto: Little Brown & Company.
Koestler, Arthur. . []. The Sleepwalkers: A History of Man‘s Changing Vision of the Universe. London: Hutchinson of London.
Koestler, Arthur. . The Act of Creation. New York: Macmillan.Lee, Frederic S. . “The Marginalist Controversy and the Demise of Full Cost
Pricing,” Journal of Economic Issues : –.Lee, Frederic S., P. Mongin, P. E. Earl, and C. C. Langlois. –. “Symposium:
The Marginalist Controversy and Post Keynesian Price Theory,” Journal of Post Keynesian Economics (Winter): –.
Lewis, Michael. . “Why is Wall Street Silent on War?” Bloomberg, March .Martin, Peter. . “Invest in New Habits: Fund Mangers Should Move Toward
Absolute Performance Measures and Away from a Geographical Spread of Assets,” Financial Times, February , pp. .
Marx, Karl. . Capital: A Critique of Political Economy. vols. Chicago: Charles H. Kerr & Company.
Means, Gardiner C. . “Industrial Prices and Their Relative Inflexibility,” Senate Document , th Congress, st Session. Washington D.C.: GPO.
Mill, John Stuart. []. Principles of Political Economy. With Some of Their Applications to Social Philosophy. Rev. ed., vols. New York: Co-operative Publication Society.
Moody‘s. Online. FISonline.Morse, Edward L., and Amy Myers Jaffe. . “Strategic Energy Policy: Challenges
for the st Century,” Report of an Independent Task Force Sponsored by the James A. Baker III Institute for Public Policy of Rice University and the Council of Foreign Relations. New York: The Council on Foreign Relations.
National Security Council. . “NSC : United States Objectives and Programs for National Security,” A Report to the President Pursuant to the President‘s Directive of January , . Top Secret. Washington D.C .
Nitzan, Jonathan. . “Price and Quantity Measurements: Theoretical Biases in Empirical Procedures,” Working Paper /, Department of Economics, McGill University, Montreal, pp. –.
Nitzan, Jonathan. . Inflation as Restructuring. A Theoretical and Empirical Account of the US Experience. Unpublished Ph.D. Dissertation, Department of Economics, McGill University, Montreal.
Nitzan, Jonathan. a. “Breaking Out of Stagflation: Some Regional Comparisons,” Emerging Markets Analyst (, January): –.
Nitzan, Jonathan. b. “The EMA Phoenix: Soaring on Market Hype,” The BCA Emerging Markets Analyst (, October): –.
Nitzan, Jonathan. . “The EMA Phoenix: Shorting on Market Hype,“ The BCA Emerging Markets Analyst (, October): –.
Nitzan, Jonathan. . “Differential Accumulation: Toward a New Political Economy of Capital,” Reveiw of International Political Economy ():–.

Shimshon Bichler & Jonathan Nitzan326
Nitzan, Jonathan. . “Will the Global Merger Boom End in Global Stagflation? Differential Accumulation and the Pendulum of ‘Breadth‘ and ‘Depth,‘ ” Paper read at International Studies Association Meetings, at Washington D.C.
Nitzan, Jonathan. . “Regimes of Differential Accumulation: Mergers, Stagflation and the Logic of Globalization,” Review of International Political Economy (): –.
Nitzan, Jonathan, and Shimshon Bichler. . “Bringing Capital Accumulation Back In: The Weapondollar-Petrodollar Coalition, Military Contractors, Oil Companies and Middle-East Energy Conflicts,” Review of International Political Economy (): –.
Nitzan, Jonathan, and Shimshon Bichler. a. “Capital Accumulation: Breaking the Dualism of Economics and Politics,” in Global Political Economy: Contemporary Theories, edited by R. Palan. New York: Routledge, pp. –.
Nitzan, Jonathan, and Shimshon Bichler. b. “Inflation and Accumulation: The Case of Israel,” Science & Society (): –.
Nitzan, Jonathan, and Shimshon Bichler. . “Going Global: Differential Accumulation and the Great U-turn in South Africa and Israel,” Review of Radical Political Economics : –.
Nitzan, Jonathan, and Shimshon Bichler. . The Global Political Economy of Israel. London: Pluto Press.
Nitzan, Jonathan, Robin Rowley, and Shimshon Bichler. . “Changing Fortunes: Armaments and the US Economy,” Working Paper /, Department of Economics, McGill University, Montreal, pp. –.
Papademos, Lucas, and Franco Modigliani. . “The Supply of Money and the Control of Nominal Income,” in Handbook of Monetary Economics, edited by B. Friedman and F. Hahn. New York: North Holland, pp. –.
Parks, Richard W. . “Inflation and Relative Price Variability,” Journal of Political Economy (, February): –.
Perle, Richard, James Colbert, Charles Fairbanks Jr., Douglas Feith, Robert Loewenberg, Jonathan Torop, David Wurmser, and Meyrav Wurmser. . A Clean Break: A New Strategy for Securing the Realm. Institute for Advanced Strategic and Political Studies.
Prechter, Robert. . “Deflation: Once More Into the Breach,” The Elliott Wave Theorist (January).
Reier, Sharon. . “Once Heroic, Now Humbled, Global Hedge Funds Seek Safer Turf,” International Herald Tribune, December , p. .
Robinson, Joan. –. “The Production Function and the Theory of Capital,” Review of Economic Studies (): –.
Rowley, Robin, Shimshon Bichler, and Jonathan Nitzan. . “The Armadollar-Petrodollar Coalition and the Middle East,” Working Paper /, Department of Economics, McGill University, Montreal, pp. –.
Rumsfeld, Donald, et al. . Open Letter to the President.Scherer, F. M., and David Ross. . Industrial Market Structure and Economic
Performance. rd ed. Boston: Houghton Mifflin.

Dominant Capital and the New Wars 327
Soros, George. . “Bush‘s Inflated Sense of Supremacy,” Financial Times, March , p. .
Spratt, John M. Jr. . “The Cost War and Reconstruction in Iraq: An Update,” Washington D.C.: House Budget Committee, Democratic Caucus.
Sraffa, Pierro. . Production of Commodities by Means of Commodities. Prelude to a Critique of Economic Theory. Cambridge: Cambridge University Press.
Steedman, Ian. . “Positive Profits With Negative Surplus Value,” Economic Journal (, March): –.
Steedman, Ian. . Marx After Sraffa. London: New Left Books.Sweezy, Paul M. . “Monopoly Capital After Twenty-Five Years,” Monthly Review
(): –.U.S. Congress, Office of Technology Assessment. . Global Arms Trade. OTA-
ISC–, June. Washington D.C.: GPO.U.S. Department of Commerce. Bureau of Economic Analysis. . Corporate
Profits: Profits Before Tax, Profits Tax Liability and Dividends. Methodology Papers: U.S. National Income and Product Accounts, Series mp-. Washington D.C.: Government Printing Office.
U.S. Department of Defense. Annual. Companies Receiving the Largest Dollar Volume of Prime Contract Awards. Washington D.C.: GPO.
Veblen, Thorstein. . []. The Theory of Business Enterprise. Clifton, New Jersey: Augustus M. Kelley, Reprints of Economics Classics.
Veblen, Thorstein. . []. “Professor Clark‘s Economics,” in The Place of Science in Modern Civilisation and Other Essays. New York: Russell & Russell, (Originally published in The Quarterly Journal of Economics , Feb).
Veblen, Thorstein. . []. The Vested Interest and the State of Industrial Arts. New York: B. W. Huebsch.
Veblen, Thorstein. . []. Absentee Ownership and Business Enterprise in Recent Times: The Case of America. Boston: Beacon Press.
Whitaker, Brian. . “Playing Skittles With Saddam,” The Guardian, March .Wicksell, Knut. . Lectures On Political Economy. Translated from the Swedish
by E. Classen and Edited with an Introduction by L. Robbins. nd ed. vols. London: George Routledge & Sons, ltd.
Woodward, Bob, and Dan Balz. . “We Will Rally the World: Bush and His Advisers Set Objectives, but Struggled With How to Achieve Them,” Washington Post, January , p. a.
World Bank. Annual. World Development Indicators. CD-ROM. Washington DC: World Bank.
Yergin, Daniel. . The Prize: The Epic Quest for Oil, Money, and Power. New York: Simon and Schuster.