juvenile justice crime prevention act€¦ · juvenile justice crime prevention act program...
TRANSCRIPT

JUVENILE JUSTICE CRIME PREVENTION ACT P RO G R A M E VA L UA T I O N
2 0 0 5 - 0 6
COUNTY OF SANTA CLARA
COM M UN I T Y- BA SED AFTE RCA RE P ROG RAM
M U LTI - AG EN CY ASSE SSM EN T CEN TER
M EXI CAN AM ERI CAN COM M UN I TY SE RVI CES AG EN CY
RESTO R ATI VE J USTI CE P ROG R AM
TR UA N CY RED UCTI ON SE RVI C ES
Prepared by Community Crime Prevention Associates, January 2007

JJCPA Evaluation Report, January 2007 Prepared by Community Crime Prevention Associates
2
S A N T A C L A R A C O U N T Y L E A D E R S H I P
Santa Clara County Board of Supervisors Donald F. Gage, District One Blanca Alvarado, District Two Peter McHugh, District Three James T. Beall, District Four Liz Kniss, District Five Peter Kutras, Jr., County Executive
Santa Clara County Juvenile Justice Coordinating Council John Porter, Franklin-McKinley School District Blanca Alvarado, Board of Supervisors James T. Beall, Board of Supervisors Sheila Mitchell, Chief Probation Officer Richard Loftus, Juvenile Court Bill Scilacci, Juvenile Justice Commission George Kennedy, District Attorney Olivia Mendiola, Mexican American Community Services Agency Erin O’Brien, Community Solutions Nancy Lopez, Mental Health Department Laurie Smith, Sheriff Jaime Lopez, Social Services Agency Mary Greenwood, Public Defender Robert Davis, San José Police Department

JJCPA Evaluation Report, January 2007 Prepared by Community Crime Prevention Associates
3
A C K N O W L E D G M E N T S
Community Crime Prevention Associates (CCPA) commends the Santa Clara County Board of Supervisors and Santa Clara County Juvenile Justice Coordinating Council for their continued efforts to improve the lives of needy youth and their families. CCPA is also grateful for the staff of the JJCPA-funded service providers. The staff members demonstrated a willingness to participate in the evaluation process and continue to dedicate themselves to serving Santa Clara County’s most vulnerable children and youth. Lastly, CCPA extends it deepest appreciation to the Probation Department’s entire Program, Assessment, Communication, and Evaluation (PACE) and Information Systems Units for their help in gathering data as part of the evaluation and reporting system, particularly, Donald Casillas and Louie Martirez.

JJCPA Evaluation Report, January 2007 Prepared by Community Crime Prevention Associates
4
T A B L E O F C O N T E N T S
I. Executive Summary 4
i. Introduction - Evaluation Design and Limitations ii. Overview - Administrative and Program Recommendations iii. Findings – State Required and Local Outcomes iv. Findings – Effort, Effect, Performance Logic Model
II. Program Recommendations 17
III. Effort: Inputs 25
IV. Effort: Customers 29
V. Effort: Staff 42
VI. Effort: Strategies 48
VII. Effect: Customer Satisfaction 52
VIII. Effect: Service Productivity 55
IX. Performance: Intermediate Outcomes 64
X. Program Summary: Aftercare Services 70
XI. Program Summary: Assessment Center 80
XII. Program Summary: MACSA Case Management 92
XIII. Program Summary: Restorative Justice Program 97
XIV. Program Summary: Truancy Reduction Services 107
XV. Background 116
XVI. Appendix: Data Sets by Program and Provider 120

E X E C U T I V E S U M M A RY
INTRODUCTION
The Evaluation Report for Fiscal Year 2005-2006 is the fifth program year for the State of California’s Juvenile Justice Crime Prevention Act allocation to Santa Clara County. Over these five years, the County of Santa Clara through the Juvenile Justice Coordinating Council has allocated JJCPA funds to five programs: Aftercare, Mexican American Community Services Agency (MACSA) Intensive Case Management, Multi-Agency Assessment Center (MAAC), Restorative Justice Project (RJP), and Truancy Reduction Services (TRS).
In September 2004, a new Probation Chief, Sheila Mitchell, was hired with experience in Juvenile Detention Reform (JDR) efforts. In Spring 2005, Chief Mitchell hired Huskey & Associates, an expert in the field, to evaluate the continuum of services provided by the Department and identify gaps or needs. Bobbie Huskey, who led the study, is a clinical social worker. Her nationally recognized consulting firm provides criminal justice system research, planning, program development, and program evaluation services to state and local governments. The ‘Continuum of Services Report’ dated December 2, 2005 recommended that Juvenile Probation and service providers “should continue to become more evidence-based, increase use of family-centered interventions, and increase its use of non-residential programs.” The Huskey report also cited the need to merge supervision services such as the electronic monitoring program with treatment services. This recommendation of providing services to those on out-of-custody alternative to detention programs is key to reducing the re-offense rate and further incarceration. The current re-offense rate for juveniles in Santa Clara County is in the range of 40% to 50%. To this end, the Probation Department embarked on a plan to realign the JJCPA programs to meet the needs identified in the Huskey report. The JJCC met on March 16, 2006 to discuss the proposed realignment of JJCPA grant funds. The primary recommendation outlined that funding streams should be allocated toward low and medium asset youth versus the high asset youth who often receive services from one or more of the five CMJJP programs. JJCC members agreed to establish a JJCPA Task Force to assess needs for the low asset and medium asset youth. It was tasked to develop a plan that provides low and medium asset youth with needed services through utilizing existing providers and the FY 2007 grant funds. CCPA includes this information in the Fiscal Year 2005-2006 Evaluation Report to provide a context for the utilization of this data by Probation, the community providers network, and policy makers for determining how best to allocate JJCPA funding to fill gaps identified in the Huskey report to assist in achieving the goals of the Juvenile Detention Reform effort – reduce incarceration of youth, especially Latino and African-American youth who are disproportionately represented.
JJCPA Evaluation Report, January 2007 Prepared by Community Crime Prevention Associates
6
Evaluation Design The Fiscal Year (FY) 2005-06 Juvenile Justice Crime Prevention Act (JJCPA) evaluation report is organized according to the Performance-Logic Model: Inputs, Strategies, Outputs, and Outcomes. The design used to evaluate the JJCPA-funded programs is a fusion between Lisbeth Schorr’s Theory-Based Logic Model and Mark Friedman’s Performance-Accountability Model. The full report describes the effort, effect and performance for each of the five JJCPA-funded programs, as well as for each of the contracted community-based service providers. The definitions of terms are listed below:
� Effort – funds spent, demographics of customers, data about staff who delivered services, program strategies, amount of services provided, and the cost per hour of direct service;
� Effect – youth and parent satisfaction rates and effectiveness of service in producing the desired change;
� Performance – process measures, short-term, and intermediate outcomes. Performance variables differ for each program and are listed when applicable.
The Performance-Logic Model evaluation design allows for policy makers and community members to review program performance across common data variables, while still preserving the uniqueness of each program. JJCPA-funded programs are varied in program approach, target population, and expected results.
Limitations to Report Several limitations reduce the generalizability of the findings contained in this report. This evaluation is not based on an experimental research design. Rather, it is based on a theory-based outcome model. First, the evaluation is limited by the resources invested in its design and implementation. Limited resources preclude the evaluation team from collecting more intermediate outcome data and program-specific data. Secondly, the findings, analysis, and conclusions are all limited by the amount and quality of data. The evaluation team relied on data provided by Probation and CBO program staff. Challenges include: consistency of data collection, uniformity of data collection, training of personnel used to collect data, and storage of data in a centralized and secure location – may all have an impact on the evaluation results. Lastly, the evaluation relies, in part, on the subjective opinions of program staff, participants, and evaluators. Despite statistical and research design limitations, the application of statistical tests adds rigor to the study protocol. The pattern of survey results can assist decision-makers with interpreting the significance of program components. Given the relatively small sample size, significant results should be treated with some interest and bear scrutiny. Probation with assistance from the CCPA Evaluation Team has already taken steps to ensure that the process for data collection and validity process is consistent from year to year.

JJCPA Evaluation Report, January 2007 Prepared by Community Crime Prevention Associates
7
OVERVIEW During FY 2005-2006 a multitude of staffing changes occurred throughout all levels of the JJCPA structure – in Probation Management, Supervision, and the Administration’s Program Analysis, Communication, and Evaluation (PACE) Unit, in CCPA’s Evaluation Team, and in some Community Based Providers. These changes posed challenges as well as opportunities particularly in the Aftercare Program.
In addition to the Performance-Logic Model design utilized to evaluate the five JJCPA programs, the Probation Department requested further recommendations related to the overall administration of the JJCPA program. These additional recommendations requested by Probation Department support the notion that the health of individual programs is reflective of the health of the lead agency and its partners. Probation’s ability to identify challenges as opportunities to advance the goals of an improved data-driven, performance-based decision making process will go a long way towards the improvement of programs, building a full continuum of services that meets clients’ needs, and forging more meaningful partnerships with community based organizations.
In addition to Administrative Recommendations, the inclusion of an Overall Findings section has been incorporated to more easily browse the performance of each program.
Administrative Recommendations a. Implement annual review of all JJCPA program data elements by program
management and line staff to ensure that correct fields are included, out-dated fields are eliminated, and data definitions agreed upon. Improvement in quality of data collection is necessary. Schedule mid-year data validation process for all JJCPA programs.
b. Include data fields pertaining to clients’ sexual orientation and more specific ethnicity information. Implement training and quality assurance mechanisms to uniformly collect information in appropriate and respectful manner.
c. Collect client and service data by census tract through data-mapping via a geographic information system (GIS). Current usage of zip code analysis has limited effects.
d. Integrate contract proposal, monitoring, and evaluation systems for the FY07-08 Request for Proposal process based on Oakland’s Family, Children, and Youth (OFCY) and City of San Jose’s B.E.S.T. models.
e. Evaluate all JJCPA-funded services. Currently, the evaluation design is limited to community-based organizations.

JJCPA Evaluation Report, January 2007 Prepared by Community Crime Prevention Associates
8
Program Recommendations It is recommended that all programs be charged with showing evidence of culturally competent and relevant services provided by staff that reflects the clientele, specifically as it relates to African-American/Black and Latino youth. A challenging area that should be prioritized is attracting service agencies with experience in African-American/Black programming that meets the identified service needs. These providers should be sought out given the critically high disproportionality yet overall low numbers. If culturally competent and relevant service providers do not meet the identified programmatic needs, the JJCC should identify ways to bring resources to train up those agencies. (Ethnicity of JJCPA Customers, page 30)
a. Aftercare Services – Re-institute case conferencing among all collaborative staff to allow for information sharing about youth and their progress. Ensuring completion of initial 10-week aftercare period is crucial and reduction of violations of probation throughout aftercare period should be the goal of CBO re-integration service provider and Probation Officers. Appropriate staffing levels for all CBO providers are critical to making case conferencing work. (Page 17)
b. Multi-Agency Assessment Center – Consider expanding one-on-one counseling
for substance abuse treatment and gang intervention for those youth in the longer-term units. Feedback from community-based providers and Probation suggest the importance and need of one-on-one counseling to break down the wall that the youth create and build upon the developmental asset of ensuring there is one caring adult in a youth’s life, especially during incarceration. This can also counter the detrimental effects of detention. (Page 19)
c. MACSA – Ensure consistency of program design, delivery of services, program
curriculum and outreach efforts at both target locations. This will ensure that if a youth client is referred to either the Intervention (East San Jose) or South County location, he/she will receive the same quality of programming regardless of where the delivery of program services is offered. Furthermore, MACSA’s South County target location is highly encouraged to continue their efforts of collaborating and sharing with the Probation Department the various activities and services offered through the case management program -- and improving their referral system to ensure that they meet the probation referred requirement. (Page 20)
d. Restorative Justice Program – Compile an updated list of community and faith-
based organizations that have expressed an interest with providing opportunities for youth to serve their community. With the increase in referrals from fiscal year 2004-05, providers saw a rise in their clients’ need for community service hours. Additionally, RJP providers have seen a 10% increase in customers 13 years and younger compared to the previous year. It is recommended that providers continue to outreach to the faith-based communities and work in
JJCPA Evaluation Report, January 2007 Prepared by Community Crime Prevention Associates
9
collaboration with Probation to identify and develop a list of organizations that will enable younger clients the ability to serve community hours at a facility that provides age appropriate activities. (Page 21)
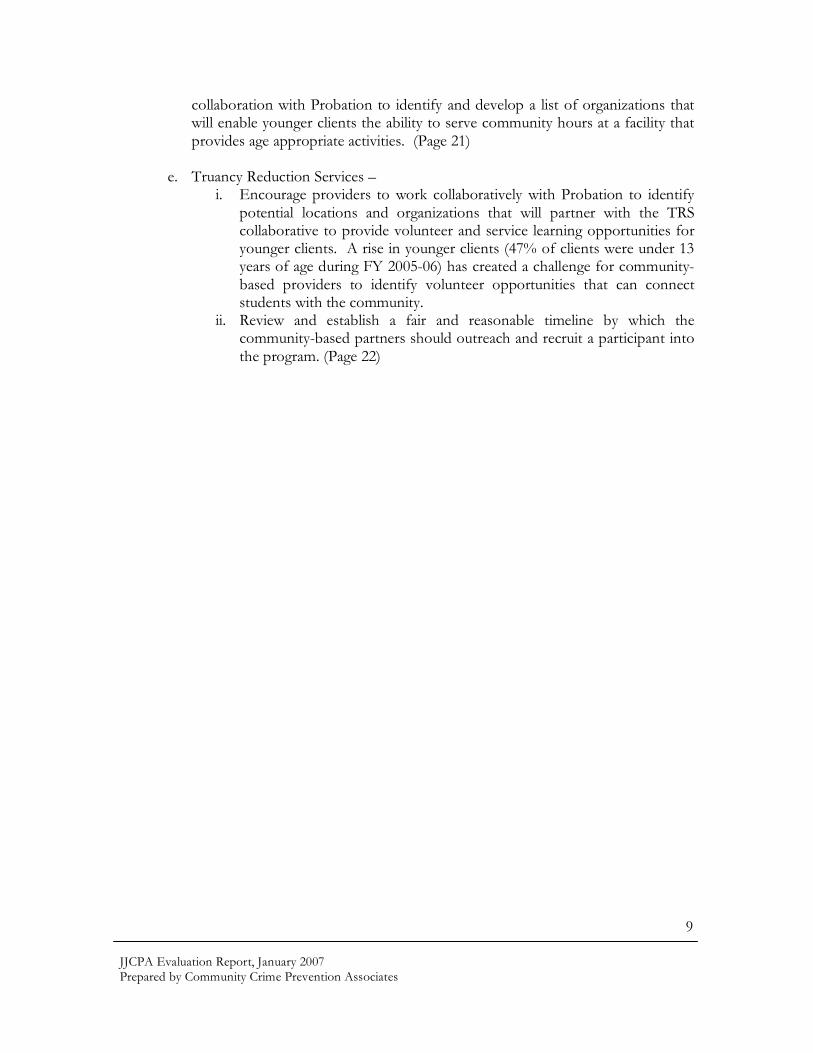
e. Truancy Reduction Services –
i. Encourage providers to work collaboratively with Probation to identify potential locations and organizations that will partner with the TRS collaborative to provide volunteer and service learning opportunities for younger clients. A rise in younger clients (47% of clients were under 13 years of age during FY 2005-06) has created a challenge for community-based providers to identify volunteer opportunities that can connect students with the community.
ii. Review and establish a fair and reasonable timeline by which the community-based partners should outreach and recruit a participant into the program. (Page 22)

JJCPA Evaluation Report, January 2007 Prepared by Community Crime Prevention Associates
10
FINDINGS - STATE REQUIRED OUTCOMES The following table reports the trend comparing the outcomes from FY 2001 - 2002 as measured and defined by the State’s Board of Corrections. (Performance, Page 64) These findings assist in ‘taking the long view’ in whether or not the programs have had positive impacts over time. Those outcome areas shaded in grey indicate a negative trend. For example, the Multi-Agency Assessment Center (MAAC) reports negative outcome trends for all areas, except for restitution completion, which shows no change. During this same time period, the Juvenile Detention Reform effort has been implemented and there is evidence indicating that youth in detention over this period of time are higher risk, higher need youth and thus are more difficult to serve to achieve better outcomes. Also, more youth are being diverted away from the detention center to programs like MACSA and RJP.
For perspective, the Aftercare program serves those youth who have completed a 40-day commitment in either Juvenile Hall or one of the rehabilitation facilities also known as the James Ranch or Wright Center. The MAAC program serves youth who are detained in Juvenile Hall and the remaining programs serve youth in a diversion or intervention program who may or may not necessary be ‘on probation’ and therefore not required to fulfill the State outcome areas.
Table 1
In analysis of previous years’ outcomes for Aftercare, it is apparent that the methodology for measuring outcomes has changed from measuring outcomes after the youth exited the program to during the program period. This impacts all areas but significantly the

JJCPA Evaluation Report, January 2007 Prepared by Community Crime Prevention Associates
11
outcomes for probation completion and restitution completion. Most youth will most likely not complete probation or restitution until some time after the program.
FINDINGS – LOCAL OUTCOMES At the inception of the JJCPA funding stream, each program had the opportunity to develop local outcome measures. This year, MAAC added, 70% of youth will have an assessment completed within the first five days. Process measurements such as this are collected and reported by Probation. The evaluation team reports the survey data about what specific desired changes the youth customers experienced. Further explanation of the local outcomes is included in the Performance section. (Page 65)
Program GoalActual
FY 2001-02
Actual
FY 2002-03
Actual
FY 2003-04
Actual
FY 2004-05
Actual
FY 2005-06
70% of youth will report improved
communication with his/her parent.65% 83% 86% 79% 100%*
70% of parents will report improved
communication with their son/daughter.NS 90% 91% 84% 100%*
50% of youth will indicate an improvement
in the youth’s school attendance.NS 71% 81% 79% 100%*
50% of parents will indicate an
improvement in the youth's school
attendance.
NS 80% 88% 85% 100%*
60% of youth will successfully complete
the ten-week initial aftercare period.NS 65% 68% 79% 59%
70% of youth will receive mental health,
education, substance abuse, and risk
classification assessments within 30 days.
79% 98% 78% 52% 68%
70% of youth will have an assessment
completed within the first five days.NA NA NA NA 67%
70% of youth will have a case plan within
10 days of admission to Juvenile Hall.98% 80% 99% 79% 96%
70% of youth will report improved
communication with his/her parents.78% 72% 56% 85% 79%
70% of parents will report improved
communication with their son/daughter.93% 85% 73% 86% 75%
50% of youth will report improved school
attendance.68% 67% 53% 66% 82%
50% of parents will report improved school
attendance.86% 85% 73% 81% 79%
70% of youth will report an increase in
his/her sensitivity to and understanding of
the negative impact of crimes on victims.
66% 76% 74% 57% 65%
30% of youth will show a growth in risk
avoidance, protective, and resiliency
assets.
61% 66% 62% 59% 55%
The average number of days from referral
to NAB conference will not exceed 18
days.
11 41 54 NA NA
70% of NAB conferences will have victim
representation at the conference.24% 39% 58% NA NA
70% of youth will report improved
communication with his/her parents.57% 58% 52% 74% 61%
70% of parents will report improved
communication with their son/daughter.75% 72% 62% 68% 69%
50% of parents will report improved school
attendance.73% 76% 80% 73% 76%
JJCPA Local Outcomes
Restorative
Justice
Program
Truancy
Reduction
Services
Aftercare
Multi-Agency
Assessment
Center
MACSA

JJCPA Evaluation Report, January 2007 Prepared by Community Crime Prevention Associates
12
FINDINGS - EFFORT 1. Total Funding - The County of Santa Clara received $4,999,244 in FY 2005-06 for its
share of the State’s JJCPA allocation (this includes interest income totaling $222,516 for both the Community Based Aftercare Program and Truancy Reduction Services). This figure represents a slight increase compared to the previous fiscal year. The table and chart below show that the level of JJCPA funds from the State declined from 2001 through 2004 and remained steady from 2004-05 to 2005-06.
Table 2
Fiscal Year State Funds
FY 2001-02 $6,476,102FY 2002-03 $6,143,058FY 2003-04 $5,816,315FY 2004-05 $4,983,048FY 2005-06* $4,999,244
Total JJCPA Funds
FY 2001-02 through FY 2005-06
*$222,516 of total during FY 2005-06 is from
interest income Chart 1
Total JJCPA Funds
FY 2001-02 through FY 2005-06
$4,000,000
$4,500,000
$5,000,000
$5,500,000
$6,000,000
$6,500,000
$7,000,000
FY 2001-02 FY 2002-03 FY 2003-04 FY 2004-05 FY 2005-06
Year
Fu
nd
s

JJCPA Evaluation Report, January 2007 Prepared by Community Crime Prevention Associates
13
2. Funding to CBOs - The County of Santa Clara has continued to demonstrate their
willingness to partner with community-based providers. As shown in the table below, a total of $2,407,319 of JJCPA funds was allocated to the “community” -- contracts with community-based organizations, funds for youth incentives, etc. This figure represents a 9% decline compared to the previous fiscal year.
Table 3
FY 2001-02 $2,930,672
FY 2002-03 $2,671,491
FY 2003-04 $2,974,968
FY 2004-05 $2,648,412
FY 2005-06 $2,407,319
JJCPA Funds Allocated to Community
(CBO, Youth Incentives, etc.)
FY 2001-02 through FY 2005-06
However, the percent of funds allocated to “community” relative to the total JJCPA allocation has increased since FY 2001-02, as illustrated in the chart below.
Chart 2
Percent of JJCPA Funds Allocated to Community
(CBO, Youth Incentives, etc.)
FY 2001-02 through FY 2005-06
48.2%
53.1%51.1%
43.5%
45.3%
30%
40%
50%
60%
FY 2001-02 FY 2002-03 FY 2003-04 FY 2004-05 FY 2005-06
Year
Pe
rce
nt
3. Units of Service - Community-based providers contracted by the five JJCPA-funded
programs delivered 115,213 units of service (one hour of direct service). FY 2004-05 was the first year that this data was collected. This year’s units of service delivered by CBO’s represents a decrease from FY 2004-05. This is contributed in part to: 1) a reduction in Aftercare and MACSA customers from the previous year; 2) a decrease in 13,072 Aftercare units of service primarily due to a reduction in group workshops by 15% 3) a 32% decrease in TRS UOS. The total hours of direct service delivered by JJCPA-funded programs are not available because only community-based providers

JJCPA Evaluation Report, January 2007 Prepared by Community Crime Prevention Associates
14
participated in this part of the evaluation. The overall cost per unit of service for the services delivered by the contracted community-based providers was $21.14.
4. Customer Profile - In fiscal year 2005-2006, JJCPA programs served 7,521 clients, 67% were males. The highest portion of clients was 16 to 17 years of age or 41%. The major ethnicities of the clientele are as follows: Latino youth 55%, White youth 22%, Asian/Pacific Islanders 10%, African American/Black youth 8%.
Youth from East San Jose’s, Mayfair, King/Ocala, and Alum Rock neighborhoods make up the top three zip codes where JJCPA customers reside. Gilroy and South San Jose youth round out the top five. The South San Jose zip code breaks into the top five because of the large number of Restorative Justice clients that come from the 95123. The largest number of non-RJP JJCPA customers resides in the Andrew Hill/Edenvale area of 95111. The zip codes of 95111 and 95122 are the areas of the county that have been identified as the largest contributors to disproportionate minority confinement. Table 4
The asset level of all JJCPA youth changed dramatically from the previous year. Low asset youth made up 47% of the clientele, a 34% increase over the previous year. There was also a 20% increase in the number of high asset youth served. Chart 3
Mayfair 95116 1King/Ocala/Overfelt HS 95122 2Alum Rock/James Lick HS 95127 3Gilroy 95020 4South San Jose 95123 5
Top 5 Zip Codes
with Most JJCPA Clients

JJCPA Evaluation Report, January 2007 Prepared by Community Crime Prevention Associates
15
FINDINGS – EFFECT 5. Productivity Scores - The JJCPA-funded programs youth developmental asset and
program-specific productivity scores for FY 2005-06 reflects a moderate decrease from the previous year. Service productivity is defined as the percent of targeted changes achieved minus the percent of targeted changes missed. The chart below illustrates a modest decrease in developmental asset productivity, while program-specific targeted changes have climbed since FY 2001-02 with a slight decrease in FY 2005-06.
Chart 4
Productivity Scores Over Time
50.0%
55.0%
60.0%
65.0%
70.0%
FY 2001-02 FY 2002-03 FY 2003-04 FY 2004-05 FY 2005-06
Year
Sc
ore
Developmental Asset Program-Specific
6. Performance-Logic Model - The table below summarizes the program-specific
productivity rates by program from this evaluation period to the last. Youth reported reduced productivity in Aftercare, MAAC, and MACSA.
Table 5
The table on the following page provides a JJCPA-wide “at-a-glance” summary and is formatted according to the Performance-Logic Model. The effect is measured by customer satisfaction, developmental asset productivity, and program-specific productivity. The Performance-Logic Model At-A-Glance is also presented for each program in the Program Summary section of this report.
FY 2005-06 FY 2004-05 FY 2005-06 FY 2004-05 FY 2005-06 FY 2004-05
Aftercare Services 67.8% 69.3% 79.6% 84.5% 83.6% 75.0%
Assessment Center 57.0% 63.8% NA NA 70.4% 53.3%
MACSA 77.5% 78.8% 78.5% 85.2% 67.4% 82.9%
RJP 64.9% 60.0% 75.7% 71.2% 83.5% 76.7%
Truancy 70.3% 67.7% 76.5% 75.8% 59.4% 71.4%JJCPA-Wide 64.3% 65.5% 76.4% 74.9% 76.2% 75.5%
Parent-Reported Staff-Reported
Program-Specific Productivity, FY 2004-06
Program
Youth-Reported
JJCPA Evaluation Report, January 2007 Prepared by Community Crime Prevention Associates
16
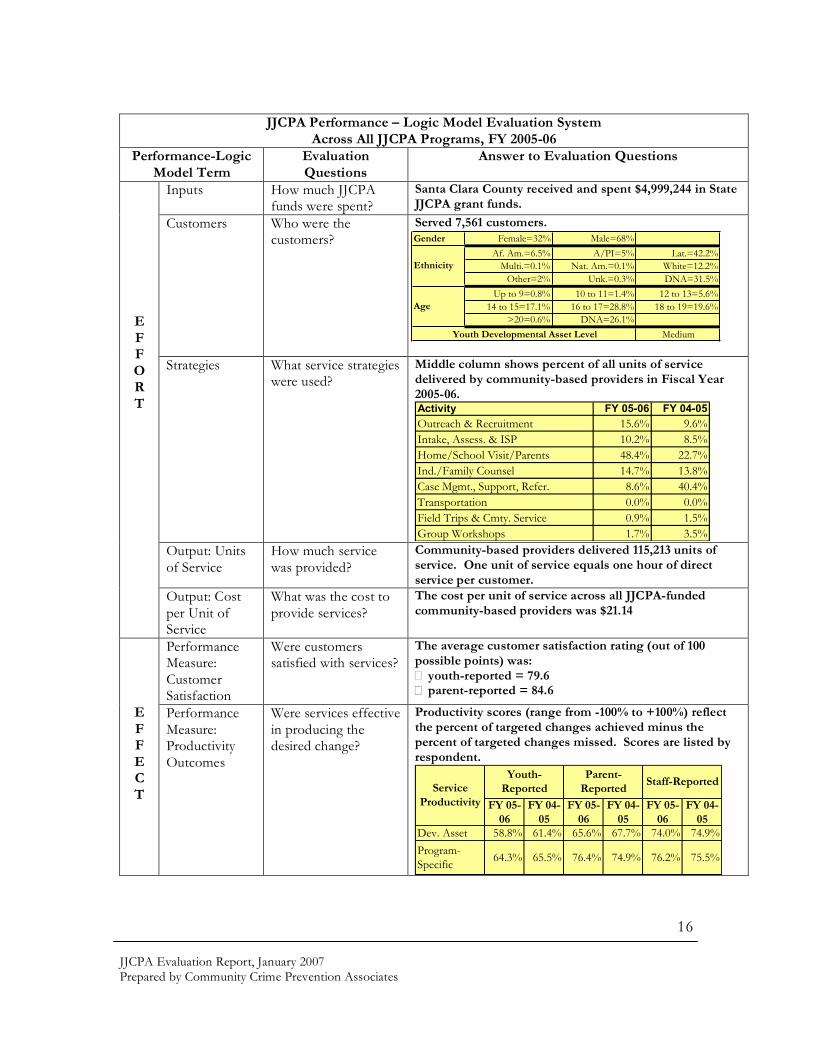
JJCPA Performance – Logic Model Evaluation System
Across All JJCPA Programs, FY 2005-06 Performance-Logic
Model Term Evaluation Questions
Answer to Evaluation Questions
Inputs How much JJCPA funds were spent?
Santa Clara County received and spent $4,999,244 in State JJCPA grant funds.
Customers Who were the customers?
Served 7,561 customers.
Strategies What service strategies
were used? Middle column shows percent of all units of service delivered by community-based providers in Fiscal Year 2005-06. Activity FY 05-06 FY 04-05
Outreach & Recruitment 15.6% 9.6%
Intake, Assess. & ISP 10.2% 8.5%
Home/School Visit/Parents 48.4% 22.7%
Ind./Family Counsel 14.7% 13.8%
Case Mgmt., Support, Refer. 8.6% 40.4%
Transportation 0.0% 0.0%
Field Trips & Cmty. Service 0.9% 1.5%
Group Workshops 1.7% 3.5% Output: Units of Service
How much service was provided?
Community-based providers delivered 115,213 units of service. One unit of service equals one hour of direct service per customer.
E F F O R T
Output: Cost per Unit of Service
What was the cost to provide services?
The cost per unit of service across all JJCPA-funded community-based providers was $21.14
Performance Measure: Customer Satisfaction
Were customers satisfied with services?
The average customer satisfaction rating (out of 100 possible points) was: � youth-reported = 79.6 � parent-reported = 84.6
E F F E C T
Performance Measure: Productivity Outcomes
Were services effective in producing the desired change?
Productivity scores (range from -100% to +100%) reflect the percent of targeted changes achieved minus the percent of targeted changes missed. Scores are listed by respondent.
FY 05-
06
FY 04-
05
FY 05-
06
FY 04-
05
FY 05-
06
FY 04-
05
Dev. Asset 58.8% 61.4% 65.6% 67.7% 74.0% 74.9%
Program-
Specific 64.3% 65.5% 76.4% 74.9% 76.2% 75.5%
Youth-
Reported
Parent-
ReportedStaff-Reported
Service
Productivity
Gender Female=32% Male=68%
Af. Am.=6.5% A/PI=5% Lat.=42.2%
Multi.=0.1% Nat. Am.=0.1% White=12.2%
Other=2% Unk.=0.3% DNA=31.5%
Up to 9=0.8% 10 to 11=1.4% 12 to 13=5.6%
14 to 15=17.1% 16 to 17=28.8% 18 to 19=19.6%
>20=0.6% DNA=26.1%
MediumYouth Developmental Asset Level
Ethnicity
Age

JJCPA Evaluation Report, January 2007 Prepared by Community Crime Prevention Associates
17
P R O G R A M R E C O M M E N D A T I O N S
AFTERCARE SERVICES
The Aftercare Services Steering Committee should: 1. Prioritize long-standing challenges identified by the members of the
Aftercare Collaborative, such as the ability to transport youth to programs, and develop a work plan to address them.
2. Consider judicial representation on the Aftercare Steering Committee or institute more frequent communication with the bench to develop deeper understanding of program’s progress. Conversely, inclusion of judicial representation may improve the understanding of what the bench expects so that youth can be successfully released from probation upon completion.
3. Consider the inclusion of a faith-based component as an additional positive linkage in the community during the Aftercare period and beyond.
4. Consider re-instituting case conferencing among line staff. Previous budget cuts have hampered the collaborative partners’ capacity to work as a team, a cornerstone of the original program model. Case Conferencing allows for providers to share information about the youth and their progress as well as build up the strength of the collaborative.
The Probation Department should:
5. Provide education of Aftercare Services to all geographical unit probation officers. While there are four Aftercare Probation Officers, clients classified as ‘minimum’ may be assigned to a Probation Officer in a geographic unit who is not familiar with the interdisciplinary approach and relationship with the Aftercare Re-Integration Provider and other referral agencies. This can be problematic for the collaborative approach to be effective.
6. Prioritize revising the ranch MDT sessions so that parent/guardian/responsible relative involvement can be achieved. Due to transportation and timing of the MDT, parent/guardian/responsible relatives are not involved. The Enhanced Ranch Program is an opportunity to refine the MDT process.
7. Define expectations and for the collaborative partners that are not included in the formal evaluation – Education Counselor(s), Probation Officers, Pre-Release Counselors, to ensure an ability to engage in meaningful quality improvement and accountability.

JJCPA Evaluation Report, January 2007 Prepared by Community Crime Prevention Associates
18
8. Work with Evaluation Team to develop milestones for reporting to Management and Steering Committee. For example, the failure/completion rate for the 10-week Pre-release aka initial Aftercare period is strongly recommended as a data point that should be tracked, monitored, and reported out on a quarterly basis. Regular reporting will give the collaborative an opportunity to make any necessary corrections when an increase in the failure rate occurs. Conversely, when the completion rate increases, identification and understanding of the reasons for improvement should be captured. Waiting until the end of the year for this particular outcome measure does not assist youth’s chances for success nor does it capitalize on the investment being made to reduce recidivism. The Aftercare Program is at the end of the continuum of community-based services for those youth who have served at least 40-day commitments. Failure will lead to deeper penetration into delinquency and correction institutions.
The Community-based Partners should:
9. Continue to link program services with the intended outcomes and build in a thoughtful approach to utilizing evaluation data.
10. Continue to serve clients on a geographic basis so as to maximize time spent with youth and families.
Focus groups revealed strong commitment to Aftercare Services by all staff and partners and a willingness to be innovative to achieve further improvement. Probation management should be commended for emphasizing outcomes-driven planning and for strengthening the composition of the Steering Committee by including all the program CBO partners. At the end of the year, the Steering Committee directed staff to convene a Providers Committee to better facilitate communication. In the coming year, this should yield a more efficient way to resolve issues that arise in a collaborative model. Additionally, the Department of Drug and Alcohol Services should be commended for joining the evaluation by distributing surveys to their clients. This data will be collected and evaluated for FY06-07.

JJCPA Evaluation Report, January 2007 Prepared by Community Crime Prevention Associates
19
MULTI-AGENCY ASSESSMENT CENTER The Probation Department should:
1. Provide regular forums among the community-based partners and counselors within the units to exchange information about youth participants. As previously recommended, the forums will also allow Juvenile Hall counselors to brief providers about the climate, recent issues, or tension between certain individuals. This may also assist in helping providers understanding why workshops are cancelled due to lock-downs and come up with alternative ways to handle such incidents. Lock-downs continue to interrupt services in the high security units on a monthly basis. The exchange of information may help to facilitate better outcomes.
2. Review the practice of cell searches when group workshops are taking place. The workshops are disrupted when youth see this taking place and it erodes trust between the community agency providing the class and the youth. With the new units and classroom space, this may reduce this problem in the future. Again, forums between unit counselors and unit providers about climate and recent incidents will be beneficial to all.
3. Analyze the feasibility of expanding one-on-one substance abuse treatment and counseling services or provide community-based partners more flexibility to meet this demand. The demand is indicated by the fact that all but one agency exceeded their units of service projected for one-on-one services even while one agency was strictly providing one-on-one services based on referrals. Feedback from community-based providers and Probation suggest the importance and need of one-on-one counseling to break down the wall that the youth create and build upon the developmental asset of ensuring there is one caring adult in a youth’s life, especially during incarceration. In particular, one-on-ones between youth and community-based partners provide a mechanism for establishing trust and the connection to a positive lifestyle once released back into the community.
The Community-based Partners should:
4. Continually making their services relevant for this hard-to-serve population by soliciting feedback from the youth or piloting new innovations. For example, given FLY’s expertise in the law, the program has piloted new curriculum content on topics such as the death penalty, immigration, and juvenile record sealing.
5. Continue using the Open Houses at Juvenile Hall as a means to reach out to parents, and loved ones of the detained youth as an education and recruitment tool.
Juvenile Hall Open Houses have been a success in engaging visiting families to understand the program services and solicit more information about services in the community. Agencies have gained referrals from the Open Houses.
JJCPA Evaluation Report, January 2007 Prepared by Community Crime Prevention Associates
20
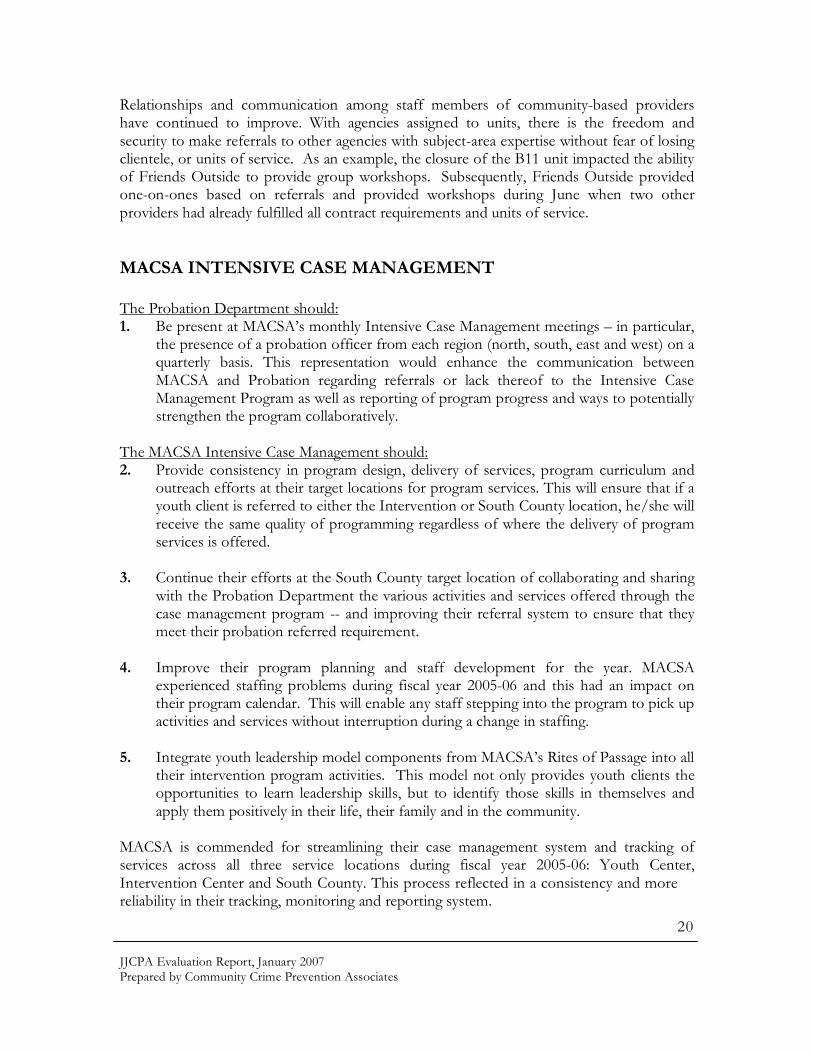
Relationships and communication among staff members of community-based providers have continued to improve. With agencies assigned to units, there is the freedom and security to make referrals to other agencies with subject-area expertise without fear of losing clientele, or units of service. As an example, the closure of the B11 unit impacted the ability of Friends Outside to provide group workshops. Subsequently, Friends Outside provided one-on-ones based on referrals and provided workshops during June when two other providers had already fulfilled all contract requirements and units of service. MACSA INTENSIVE CASE MANAGEMENT The Probation Department should: 1. Be present at MACSA’s monthly Intensive Case Management meetings – in particular,
the presence of a probation officer from each region (north, south, east and west) on a quarterly basis. This representation would enhance the communication between MACSA and Probation regarding referrals or lack thereof to the Intensive Case Management Program as well as reporting of program progress and ways to potentially strengthen the program collaboratively.
The MACSA Intensive Case Management should: 2. Provide consistency in program design, delivery of services, program curriculum and
outreach efforts at their target locations for program services. This will ensure that if a youth client is referred to either the Intervention or South County location, he/she will receive the same quality of programming regardless of where the delivery of program services is offered.
3. Continue their efforts at the South County target location of collaborating and sharing
with the Probation Department the various activities and services offered through the case management program -- and improving their referral system to ensure that they meet their probation referred requirement.
4. Improve their program planning and staff development for the year. MACSA
experienced staffing problems during fiscal year 2005-06 and this had an impact on their program calendar. This will enable any staff stepping into the program to pick up activities and services without interruption during a change in staffing.
5. Integrate youth leadership model components from MACSA’s Rites of Passage into all
their intervention program activities. This model not only provides youth clients the opportunities to learn leadership skills, but to identify those skills in themselves and apply them positively in their life, their family and in the community.
MACSA is commended for streamlining their case management system and tracking of services across all three service locations during fiscal year 2005-06: Youth Center, Intervention Center and South County. This process reflected in a consistency and more reliability in their tracking, monitoring and reporting system.

JJCPA Evaluation Report, January 2007 Prepared by Community Crime Prevention Associates
21
RESTORATIVE JUSTICE PROGRAM The Probation Department should: 1. In collaboration with Restorative Justice Program Community-based providers should
look at increasing the number of referrals of Latino youth to address the high percentage of this population penetrating deeper into the system relative to its diversion rate.
2. Continue their communication with the RJP community-based partners regarding
status of referrals throughout the year. This will enable community-based providers contracted for the program to more adequately adjust program workshops, counseling sessions, community service projects and staffing to fit the anticipated referrals on a monthly basis.
The Community-based Partners should: 3. RJP providers have seen a 10% increase in customers 13 years and younger compared
to the previous year. To this end, community-based partners have had to develop creative community service opportunities for their clients because many organizations that have historically welcomed their clients to complete their community service hours will not take youth 13 years of age and younger. They are encouraged to continue to outreach to the faith based communities and work in collaboration with Probation to identify and develop a list of organizations that will enable younger clients the ability to serve community hours at a facility that provides age appropriate activities.
4. Additionally, RJP providers have indicated a rise in referrals of youth clients with
learning disabilities. They are encouraged to work with Probation and parents of youth clients to establish whether their client has any known special educational needs during intake. This will enable them to more effectively develop their service plan and to work in collaboration with Probation to ensure that any specialized education or learning needs of youth are shared with community-based partners during the referral and intake process. This information could better equip RJP providers with ensuring that youth clients are appropriately placed in program services and community service projects.
5. RJP providers have expressed an interest in updating the workshop curricula to reflect
more interactive and cognitive behavioral activities. Additionally, RJP providers have indicated that the drug and alcohol curriculum does not meet the need of all drug and alcohol referred clients, specifically, those needs of youth who are heavy substance abuse users. It is strongly recommended that Probation and the RJP Program Managers and staff have a planning session to review and modify the existing curricula to more effectively meet the needs and to more effectively create the change in knowledge, behavior, skills and attitudes they would most like to see in their youth clients.

JJCPA Evaluation Report, January 2007 Prepared by Community Crime Prevention Associates
22
5. With the increase in referrals from fiscal year 2004-05, providers saw a rise in their
clients’ need for community service hours. Providers are acknowledged for responding to this need and increasing their community service opportunities throughout the year for their clients in a climate this past year that has been challenging. Community-based partners had difficulty getting plugged into programs due to a lengthy process and request for long-term commitment for community service. In some cases, if the provider could not commit to an average number of youth attendees, organizations stopped offering opportunities for community service. And, South County has limited community service opportunities for youth clients. Probation and the RJP community-based partners are encouraged to work collaboratively to compile an updated list of community organizations that have expressed an interest with providing opportunities for youth to serve their community. It is recommended that those organizations that continue to provide community service opportunities be recognized or acknowledged at the end of the year to encourage their continued efforts with helping youth learn the value of service to their community.
The Restorative Justice Program community-based partners and Probation are commended for their collaborative efforts and improved communication. Community-based partner referrals increased Fiscal Year 2005-06 from the previous year and remained constant throughout the year. Probation demonstrated their on-going commitment to working collaboratively with providers and responding to their concerns.
JJCPA Evaluation Report, January 2007 Prepared by Community Crime Prevention Associates
23
TRUANCY REDUCTION SERVICES Encourage TRS Collaborative: 1. To partner with school districts to ensure that referrals received reflect the need to
provide truancy services to African-American/Black youth to deter further penetration into the system.
2. TRS community-based partner program managers are encouraged to develop a
parental workshop series and/or case plan for parents of youth clients, specifically targeting their efforts for parents of youth clients under the age of 13 (47% of clients were under 13 years of age during FY 2005-06) with an emphasis on parenting skills, how to support their child’s success in school and setting realistic and achievable parental goals for themselves. This will encourage and reinforce with parents of youth clients the importance of them being their child’s first and most important advocate of school success and decrease their dependency on case managers upon their child’s exit from the Truancy Reduction Services Program. Additionally, the rise in younger clients has created a challenge for community-based providers to identify volunteer opportunities that can connect students with the community. Providers are encouraged to work collaboratively with Probation to identify potential locations and organizations that will partner with the TRS collaborative to provide volunteer and service learning opportunities for younger clients.
3. TRS community-based partners continue to demonstrate a strong commitment to helping every referred youth be identified, connected and successful as a participant of the program. To this end, TRS providers’ efforts spent outreaching and recruiting youth participants to the program upon receipt of referral has increased by 6%. The evaluation team recommends that the TRS collaborative review and establish a fair and reasonable timeline by which the community-based partners should outreach and recruit a participant into the program. This will ensure that TRS staffs feel they are being provided an adequate amount of time to outreach and recruit a referred youth. Conversely, referred youth should also be given the same amount of time, effort and attempts for recruitment into the program before they are identified as a “non-participant.” A “non-participant” is a youth that upon several attempts to contact, outreach and recruit into the program does not become an official “intake” for one of the following reasons: moved out of target area, parent/child declined, dropped from school, incarcerated, could not be located, working with other agencies that provide similar services as TRS collaborative or other reason.
Probation and TRS community-based partners are commended for standardizing the Memorandum of Understanding (MOU) template so that it can be used with each partnering school district to ensure increased communication and timely delivery of services. Truancy providers work to obtain the MOU’s a few months prior to the new fiscal year to begin receiving referrals and working with youth clients and their families with minimum disruption in services.
JJCPA Evaluation Report, January 2007 Prepared by Community Crime Prevention Associates
24
Additionally, TRS community-based partners are acknowledged for their diligence and commitment to creating opportunities for youth clients to be re-connected or engaged in positive extracurricular activities through referrals to other community providers, community events and/or through their participation in TRS developed workshops that focus on improving their decision-making, communication and critical thinking skills utilizing curricula such as “Why Try” and “CHOICES.” TRS staffs continue to seek ways for their clients to increase their connection with peers in healthy, pro-social activities even when faced with on-going challenges such as identifying a space to run groups on school campus or identifying space off-campus that would not pose a transportation issue to youth clients. Lastly, due to the unique population of youth being serviced by Truancy Reduction Services, establishing communication and meeting with potential participants upon receiving a referral takes focused effort on the part of program staff. Truancy service providers and their efforts to improve their referral process and intake procedure during Fiscal Year 2005-06 are recognized. Referring sources receive a report back on the case disposition within one week of referral or one month, as established with the school district. The Case Managers with input from the collaborating school district have an established referral and report-back process. This process has established a stronger relationship between truancy providers’ and their school partners and districts.

JJCPA Evaluation Report, January 2007 Prepared by Community Crime Prevention Associates
25
Effort
INPUTS Santa Clara County expended $4,999,244 for the five Juvenile Justice Crime Prevention Act (JJCPA) funded programs under the Schiff-Cardenas Crime Prevention Act of 2000 (CPA 2000) for Fiscal Year 2005-06. JJCPA funds were allocated based upon each county’s population. Only those counties with a Board of Corrections (BOC)-approved Comprehensive Multi-Agency Juvenile Justice Plan received funds. Expenditure Plan of All JJCPA Funds The following table consists of a breakdown of the JJCPA allocation for Fiscal Year 2005-06. Seven expenditure categories are listed in the left-hand column, followed by the five funded programs and the JJCPA-wide figures. Table 6
ItemAftercare
Services
Assessment
CenterMACSA RJP Truancy Services JJCPA-Wide
Salaries and Benefits $681,309 $535,568 $16,250 $1,246,102 $5,747 $2,484,976
Services and Supplies $24,413 $23,315 $0 $23,080 $0 $70,808
Professional Services $15,009 $9,421 $5,034 $28,506 $1,780 $59,750
Community-Based Organizations $561,676 $181,091 $379,136 $969,847 $268,076 $2,359,826
Administrative Overhead
$5,999 $3,766 $2,012 $11,395 $712 $23,884
Total Funds $1,288,406 $753,161 $402,432 $2,278,930 $276,315 $4,999,244
JJCPA Expenditure Plan, FY 2005-06
Each county is required to report its expenditure according to the following seven BOC-defined line items.
Salaries and Benefits – Salaries and benefits of county personal providing all or part of their time to the JJCPA county program(s). This line item also includes those salaries obligated under MOU’s between county departments.
JJCPA Evaluation Report, January 2007 Prepared by Community Crime Prevention Associates
26
Services and Supplies - Services and supplies necessary to support JJCPA programs. This line item also includes those services and supplies obligated under MOU’s between county departments. This line item does not include "professional services" associated with the evaluation of the JJCPA funded programs, services provided by a Community-based Organization, or Administrative Overhead. Professional Services – This line item includes only expenditures for professional services provided by contractors to collect, analyze, evaluate and report outcome measures for a county’s approved JJCPA program(s). CBO Contracts – All JJCPA expenditures for services provided by community-based organizations (CBOs) is reflected in this line item. Fixed Assets – Expenditures for all fixed assets purchased to implement and operate the county’s approved JJCPA program(s) is reported in this line item. Administrative Overhead – Reflects individual county’s definition for administrative overhead, and only up to 0.5% of the county’s JJCPA total allocation. Other – Includes any expenditure which does not fall under the categories identified above.
The following chart illustrates the allocation by program. RJP received the largest allocation with 45.6% of all program funds. Truancy Reduction Services received the smallest amount with 5.5% of all program funds. Probation Department-operated programs constituted 86.5% of all program funds. Chart 5
JJCPA Allocation by Program, FY 2005-06
MACSA
8.0%
Truancy
Services
5.5%
RJP
45.6%
Assessment
Center
15.1%
Aftercare
Services
25.8%
JJCPA Evaluation Report, January 2007 Prepared by Community Crime Prevention Associates
27
Funds allocated to community-based organizations remained the same from the previous fiscal year. No funds were expended for fixed assets and administrative funds were within the 0.5% limit, as shown in the chart below. The Professional Services category includes program evaluation and data collection services. Chart 6
Allocation by Expenditure Category, FY 2005-06
Administrative
Overhead,
0.5%
Community-
Based
Organizations,
47.2%
Services and
Supplies,
1.4%
Professional
Services,
1.2%
Salaries and
Benefits,
49.7%
JJCPA Funds to the Community Of the total JJCPA expenditure, 48.3% was allocated directly to communities, including to community-based organizations. This figure reflects a decrease compared to FY 2004-05. The table and chart below show the breakdown of funds. “Other Non-CBO Expenses” shown in the second row below includes Professional Services and Administrative Overhead. Table 7
Funds to community including
Community-Based
Organizations, etc.
$2,407,319
County Personnel and Other
Non-CBO Expenses$2,591,925
Total Funds $4,999,244
JJCPA Funds to Community, FY 2005-06

JJCPA Evaluation Report, January 2007 Prepared by Community Crime Prevention Associates
28
In the following table, the same breakdown of data is shown by program. Nearly all funds for MACSA and Truancy Services were allocated to CBOs. Over half of funds for Aftercare Services and Restorative Justice were allocated to CBOs. Table 8
Program
Funds to community
including contracts with
Community-Based
Organizations
County
personnel and
other non-CBO
expenses
Percent of total
program funds to
Community-Based
Organizations
Aftercare Services $586,089 $702,317 44.4%
Assessment Center $181,091 $572,070 24.2%
MACSA $379,136 $23,296 94.2%
RJP $992,927 $1,286,003 43.6%
Truancy Services $268,076 $8,239 97.2%
Total Funds $2,407,319 $2,591,925 48.2%
Funds to Community by Program, FY 2005-06
The chart below illustrates the breakdown. Chart 7
JJCPA Funds to Community by Program, FY 2005-06
$0 $500,000 $1,000,000 $1,500,000
Aftercare Services
Assessment Center
MACSA
RJP
Truancy Services
Pro
gra
m
Funds
County personnel and other non-CBO expenses
Funds to community including contracts with Community-BasedOrganizations

JJCPA Evaluation Report, January 2007 Prepared by Community Crime Prevention Associates
29
Since the JJCPA funds were established in 2000, The County of Santa Clara has continued to demonstrate their willingness to partner with community-based providers. As shown in the chart below, 48.2% of JJCPA funds for FY 2005-06 were allocated to the “community.” This figure represents a 9% decline compared to the previous fiscal year. The chart below illustrates the allocation over time. Chart 8
Percent of JJCPA Funds Allocated to Community
(CBO, Youth Incentives, etc.)
FY 2001-02 through FY 2005-06
48.2%
53.1%51.1%
43.5%
45.3%
30%
40%
50%
60%
FY 2001-02 FY 2002-03 FY 2003-04 FY 2004-05 FY 2005-06
Year
JJCPA Evaluation Report, January 2007 Prepared by Community Crime Prevention Associates
30
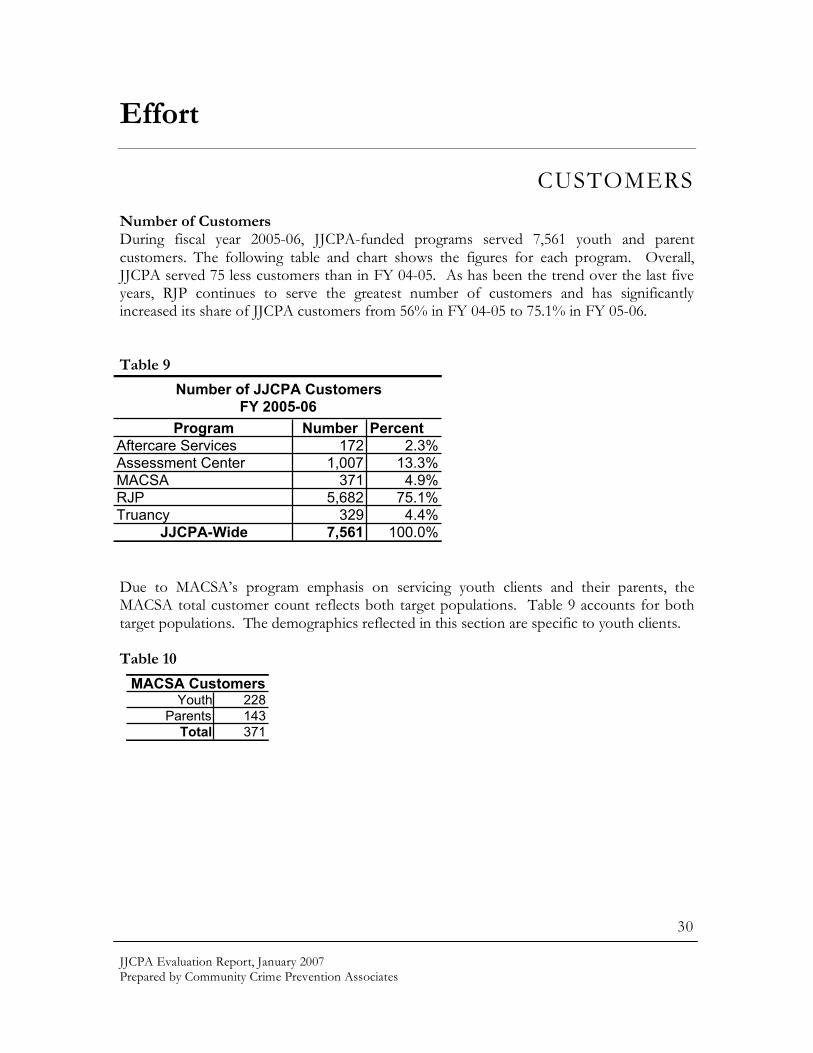
Effort
CUSTOMERS Number of Customers During fiscal year 2005-06, JJCPA-funded programs served 7,561 youth and parent customers. The following table and chart shows the figures for each program. Overall, JJCPA served 75 less customers than in FY 04-05. As has been the trend over the last five years, RJP continues to serve the greatest number of customers and has significantly increased its share of JJCPA customers from 56% in FY 04-05 to 75.1% in FY 05-06. Table 9
Due to MACSA’s program emphasis on servicing youth clients and their parents, the MACSA total customer count reflects both target populations. Table 9 accounts for both target populations. The demographics reflected in this section are specific to youth clients. Table 10
Program Number PercentAftercare Services 172 2.3%Assessment Center 1,007 13.3%MACSA 371 4.9%RJP 5,682 75.1%Truancy 329 4.4%
JJCPA-Wide 7,561 100.0%
Number of JJCPA Customers FY 2005-06
MACSA Customers
Youth 228
Parents 143
Total 371

JJCPA Evaluation Report, January 2007 Prepared by Community Crime Prevention Associates
31
Chart 9
Over the last five years, JJCPA-funded programs have served 35,284 parent and youth customers. RJP has the largest increase in customers with 1,421 more youth, 33% over FY04-05. The Multi-Agency Assessment Center (MAAC) has the largest reduction of customers, 936 less youth served than in FY04-05 and a 66% reduction since the first year of MAAC. This overall reduction can be attributed to a number of factors; one is the decline in number of referrals and subsequent detentions due to the Booking Protocol and Probation’s efforts to reduce detention. It should be noted that the number of youth served in MAAC is different than number of youth detained at Juvenile Hall. MAAC customers is an unduplicated count of those youth who are detained over 72 hours and provided a group workshop or one-on-one counseling session by the community-based providers assigned to the units. In FY05-06, 2,293 youth were detained per the Risk Assessment Instrument used by Probation’s Screening Unit. The RAI data is a duplicated count. The Aftercare Program and MACSA have the largest reduction in participants. The decline in Aftercare customers is a result in the reduction of youth sent to the ranches while Probation was preparing to transition to the Enhanced Ranch Program implemented in August 2006. MACSA’s customer reduction is due to the fact that at the onset of the program, MACSA had an unlimited amount of time in which they were able to service youth clients. Beginning in FY 04-05, the amount of time that MACSA was able to serve a client was limited to one year resulting in a significant exit of customers.

JJCPA Evaluation Report, January 2007 Prepared by Community Crime Prevention Associates
32
Table 11
Gender of JJCPA Customers JJCPA customers were predominantly male, constituting nearly 70% of all customers. Truancy Services, followed by Restorative Justice, served the highest proportion of female customers, and Aftercare Services served the highest proportion of male customers with 83%, as shown in the table below. Table 12
Consistent with prior years, less than one-third of all JJCPA customers were female, as illustrated in the chart below. This was one percent greater than the previous year when 32% of JJCPA customers were female. Chart 10
Program Female Male
Aftercare Services 17.4% 82.6%Assessment Center 18.7% 81.3%MACSA 39.5% 60.5%RJP 35.0% 65.0%
Truancy 48.6% 51.4%
JJCPA-Wide 33.1% 66.9%
Gender of JJCPA Customers, FY 2005-06
Number of Youth Served, FY 2001-02 through FY 2005-06
AftercareAssessment
CenterMACSA RJP Truancy JJCPA-Wide
FY 2001-02 326 2,942 224 2,643 325 6,460
FY 2002-03 768 3,778 388 3,531 336 8,801
FY 2003-04 379 1,796 462 2,100 385 5,122
FY 2004-05 353 1,943 585 4,261 341 7,483
FY 2005-06 172 1,007 228 5,682 329 7,418
Total 1,998 11,466 1,887 18,217 1,716 35,284

JJCPA Evaluation Report, January 2007 Prepared by Community Crime Prevention Associates
33
Ethnicity of JJCPA Customers All five programs served mostly Latino youth, ranging from RJP’s 50.9% at the lowest to MACSA’s 90.4% at the highest. The JJCPA-wide data indicate that Latino youth constituted 55% of all youth served. In general, JJCPA programs served an ethnically diverse group of customers. The table below shows the ethnicity breakdown of JJCPA customers by program. Table 13
When comparing customers within particular ethnicities across programs, the variation of participation for African-American youth is telling. Constituting 3% of the general youth population, they had the largest negative variation of participation between the early intervention and suppression programs, meaning low participation rates in early intervention services (2.9% in Truancy Reduction Services) and high rates in deep-end services (12.5% in MAAC and 10.5% in Aftercare Services). Asian/Pacific Islander and White youth had generally similar participation rates across programs with their highest participation rates in the diversion program, Restorative Justice at 11.5% and 24.9%, respectively. The chart on the following page shows these participation rates across the four major ethnic groups, moving from early intervention to diversion to detention and then to Aftercare. Focus should be paid to the trend line for participation rates from RJP (diversion) to MAAC (detention) for Latino and African-American youth versus Asian/Pacific Islander and White youth. This may be due to high recidivism rates and/or more serious offenses being committed by Latino and African-American youth thus making them ineligible for diversion. Probation and the District Attorney’s office should analyze whether more referrals can be made to RJP for Latino and African-American youth. Probation should analyze whether more culturally competent RJP services might make better outcomes for RJP youth. The Huskey Report points out this County’s historical emphasis on truancy and diversion services as delinquency reduction tools. In addition to these needed services, this data supports the notion that certain youth who do not qualify for these lower-end services are in need of more intensive community-based services to break the cycle of delinquency.
Ethnicity Aftercare
Services
Assessment
CenterMACSA RJP Truancy
JJCPA-
Wide
African American 10.5% 12.5% 3.1% 7.6% 2.4% 8.0%
Asian/Pacific Is. 8.7% 7.5% 0.4% 11.5% 7.3% 10.4%
Latino 67.4% 60.7% 90.4% 50.9% 76.6% 55.0%
Multi-Racial 0.0% 0.0% 2.2% 0.7% 3.0% 0.8%
White 11.0% 16.0% 3.5% 24.9% 10.6% 22.1%
Other 2.3% 2.6% 0.4% 3.9% 0.0% 3.4%
Unknown 0.0% 0.7% 0.0% 0.5% 0.0% 0.5%
Ethnicity of JJCPA Customers, FY 2005-06

JJCPA Evaluation Report, January 2007 Prepared by Community Crime Prevention Associates
34
Chart 11
To this end, it is recommended that Probation in collaboration with Community-based providers partner with school districts to ensure that referrals received reflect the need to provide truancy services to African-American/Black youth. Additionally, Probation in collaboration with providers should look at increasing the number of referrals of eligible Latino youth. Finally, Probation should focus on addressing the gap of intensive services for Latino and African-American youth who continue to re-offend and penetrate deeper into the system.
JJCPA Evaluation Report, January 2007 Prepared by Community Crime Prevention Associates
35
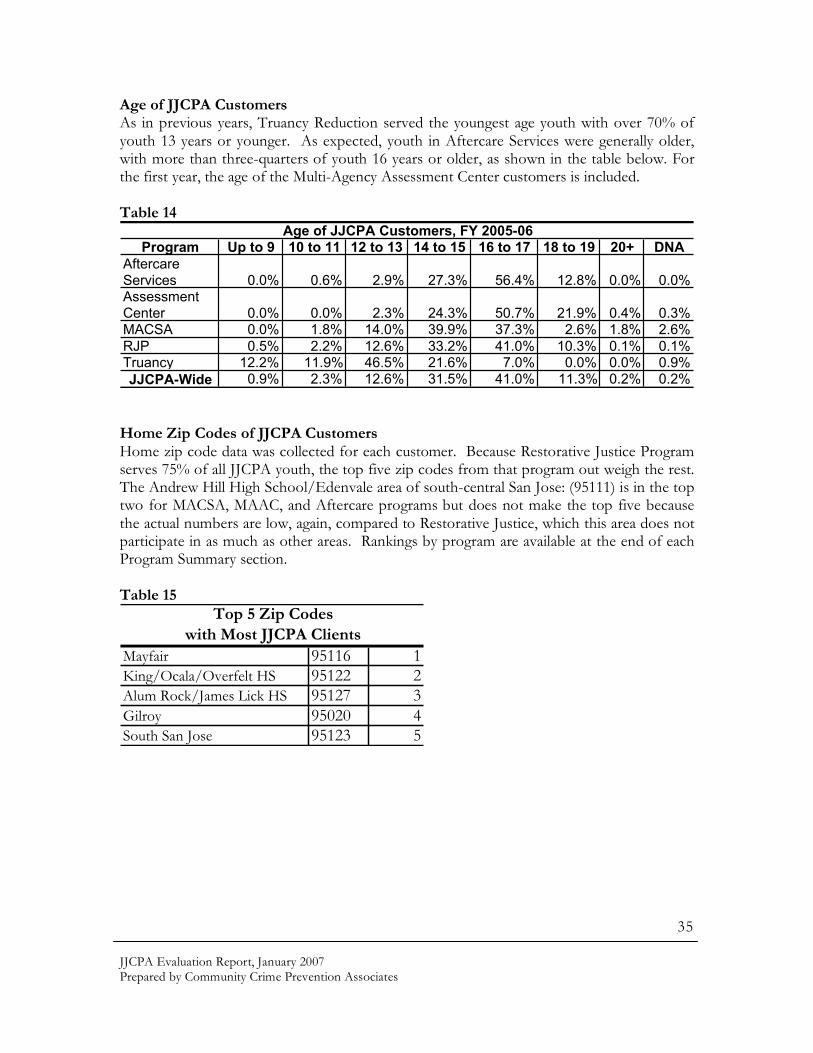
Age of JJCPA Customers As in previous years, Truancy Reduction served the youngest age youth with over 70% of youth 13 years or younger. As expected, youth in Aftercare Services were generally older, with more than three-quarters of youth 16 years or older, as shown in the table below. For the first year, the age of the Multi-Agency Assessment Center customers is included. Table 14
Home Zip Codes of JJCPA Customers Home zip code data was collected for each customer. Because Restorative Justice Program serves 75% of all JJCPA youth, the top five zip codes from that program out weigh the rest. The Andrew Hill High School/Edenvale area of south-central San Jose: (95111) is in the top two for MACSA, MAAC, and Aftercare programs but does not make the top five because the actual numbers are low, again, compared to Restorative Justice, which this area does not participate in as much as other areas. Rankings by program are available at the end of each Program Summary section. Table 15
Program Up to 9 10 to 11 12 to 13 14 to 15 16 to 17 18 to 19 20+ DNA
Aftercare Services 0.0% 0.6% 2.9% 27.3% 56.4% 12.8% 0.0% 0.0%Assessment Center 0.0% 0.0% 2.3% 24.3% 50.7% 21.9% 0.4% 0.3%MACSA 0.0% 1.8% 14.0% 39.9% 37.3% 2.6% 1.8% 2.6%
RJP 0.5% 2.2% 12.6% 33.2% 41.0% 10.3% 0.1% 0.1%Truancy 12.2% 11.9% 46.5% 21.6% 7.0% 0.0% 0.0% 0.9%
JJCPA-Wide 0.9% 2.3% 12.6% 31.5% 41.0% 11.3% 0.2% 0.2%
Age of JJCPA Customers, FY 2005-06
Mayfair 95116 1King/Ocala/Overfelt HS 95122 2Alum Rock/James Lick HS 95127 3Gilroy 95020 4South San Jose 95123 5
Top 5 Zip Codes
with Most JJCPA Clients
JJCPA Evaluation Report, January 2007 Prepared by Community Crime Prevention Associates
36
Risk Avoidance, Protective, and Resiliency Assets (RPRA) The JJCPA Evaluation System also uses an assessment tool to measure the risk avoidance, protective, and resiliency asset level of youth customers. The RPRA instrument is a self-assessment completed by youth upon program exit. The instrument measures change in developmental assets in the areas of: risk avoidance, protective, resiliency, and social attachment. The RPRA has been accepted by over 200 community-based organization and public agencies as a method of measuring the assets of the youths whom they serve. The short form of the instrument has an alpha reliability of .86 and has norms of high, medium, and low levels of assets. Low assets indicate high-risk youth, medium assets indicate at-risk youth, and high asset scores indicate youth with little risk of difficulties at home, school, and in the community. The total RPRA score percentages are normed as follows: 87.5% or higher is High Assets and 81.25% or below is Low Assets. Summary RPRA Results The two-page RPRA instrument was administered to youth at the end of intervention. Summary results shown below can be used to better understand the asset level of JJCPA youth customers. The following table and chart show the JJCPA-wide asset level by type of asset. The table also lists the overall norm asset level for each program. The average age of the youth respondent to the RPRA survey was 16.3 years. The Assessment Center youth had the lowest overall asset level, as expected.

JJCPA Evaluation Report, January 2007 Prepared by Community Crime Prevention Associates
37
Table 16
Aftercare
Services
Assess.
CenterMACSA RJP Truancy JJCPA-Wide
Average Age 18.0 years 17.4 years 17.4 years 16.0 years 14.0 years 16.3 years
Overall Asset
LevelMedium Low Medium Medium Medium Medium
Protective
Assets89.9% 83.7% 88.3% 86.2% 81.1% 85.3%
Resiliency
Assets81.3% 77.3% 81.9% 78.8% 78.8% 78.7%
Risk
Avoidance
Assets
80.0% 72.6% 87.4% 85.5% 86.0% 82.1%
Social
Attachment
Assets
90.1% 79.4% 86.3% 84.0% 80.5% 82.9%
Risk Avoidance, Protective, and Resiliency
Assets (RPRA) Results, FY 2005-06
The table below illustrates that the total asset of JJCPA youth has gone down from the previous year. Furthermore, the total asset of youth for each program has decreased, with the exception of the Restorative Justice Program – which has remained the same as Fiscal Year 2004-05. This indicates that Probation and the community-based partners continue to serve higher need youth. The Risk, Protective and Resiliency Assets for each community-based partner can be found in the Program Summary section of the report by JJCPA Program. Table 17
Program FY 05-06 FY 04-05 FY 05-06 FY 04-05
Aftercare MEDIUM MEDIUM 82.0% 82.1%
Assessment Center LOW LOW 78.5% 80.0%
MACSA MEDIUM HIGH 85.5% 88.1%
Restorative Justice Program MEDIUM MEDIUM 83.2% 83.2%
Truancy Reduction Services MEDIUM MEDIUM 81.5% 82.8%
JJCPA Wide MEDIUM MEDIUM 81.9% 82.4%
Asset Level Total Asset
Risk, Protective and Resiliency Assets by JJCPA Program, FY 2004-2006

JJCPA Evaluation Report, January 2007 Prepared by Community Crime Prevention Associates
38
Table 17 breaks out the percentage of JJCPA youth who scored in each of the three ranges (low asset, medium asset and high asset) -- 46.8% of all JJCPA youth surveyed were low asset and 28.6% were high asset in Fiscal Year 2005-06; an increase from FY 2004-05 of 35.6% and 19.5%, respectively. Conversely, 24.6% of all youth were medium asset, a decrease of 53.3% from the previous year.
Table 18
Level FY 2005-06 FY 2004-05
Low Asset 46.8% 13.0%
Medium Asset 24.6% 77.9%
High Asset 28.6% 9.1%
Asset Level of JJCPA Youth
FY 2004-2006
Data by asset type shows that the resiliency asset continued to be the lowest for JJCPA youth, with an overall score of 78.8%. Conversely, protective assets continued to remain the highest with an overall score of 86.2%, as illustrated in the chart below. JJCPA youth had an overall medium-low asset level -- 0.5 percentage points lower than the previous year. Chart 12
JJCPA-Wide RPRA Scores, FY 2005-06
70.0%
75.0%
80.0%
85.0%
90.0%
Risk
Avoidance
Protective Resiliency Social
Attachment
JJCPA-
Wide
Asset
Sc
ore
High Level of Assets
Low Level of Assets

JJCPA Evaluation Report, January 2007 Prepared by Community Crime Prevention Associates
39
Staff Assessment of Resiliency Variables In addition to the JJCPA-wide developmental asset survey questions and agency-specific survey questions, staff members answered questions about three important measures specific to resiliency: participant’s level of expectation for him/herself; participant’s level of participation at home, school and in the community; level of participation in JJCPA services; and number of new caring and supportive adults in the youth’s life due to JJCPA services. JJCPA staff answered these questions for each participating youth. JJCPA-funded services continue to work to improve the resiliency variables in youth customers. Survey results are shown in the table below. Across all JJCPA programs, participating youth demonstrated a 60.9% growth in expectation level, based on a four-point scale. Similarly, as shown in the third column, participating youth demonstrated a 60.8% growth in participation level. It should be noted that the Aftercare Services staff rated growth in participation level demonstrated in increase of 5.9% from the previous year. The next data column lists staff impressions of youths’ actual participation level, where five is very high, four is high, three is average, two is low, and one is very low. The average across all JJCPA programs is 3.8 and continues to remain high. Finally, the last column shows the number of new caring and supportive adults to whom participating youth were connected, due to services. The number of new caring and supportive adults JJCPA-wide decreased slightly. However, the Restorative Justice Program showed an increase of 1.7 points from FY 2004-05. Table 19
FY 05-06 FY 04-05 FY 05-06 FY 04-05 FY 05-06 FY 04-05 FY 05-06 FY 04-05
Aftercare Services 69.5% 60.0% 76.3% 70.4% 3.9 3.9 2.7 3.0
Assessment Center NA NA NA NA 3.5 4.0 0.9 1.5
MACSA 62.3% 81.1% 70.3% 83.8% 3.1 3.7 3.6 4.1
RJP 60.2% 57.0% 59.9% 53.9% 4.3 4.0 1.5 1.6
Truancy 60.5% 57.7% 55.8% 57.7% 3.2 3.6 3.3 1.6
JJCPA-Wide 60.9% 63.4% 60.8% 63.6% 3.8 3.9 1.7 2.3
Actual Participation
Level (scale 1-5)
New Caring &
Supportive Adults
Staff-Rated Resiliency Variables, FY 2004-06
Growth in
Expectation Level
(4-point scale)
Growth in
Participation Level
(4-point scale)

JJCPA Evaluation Report, January 2007 Prepared by Community Crime Prevention Associates
40
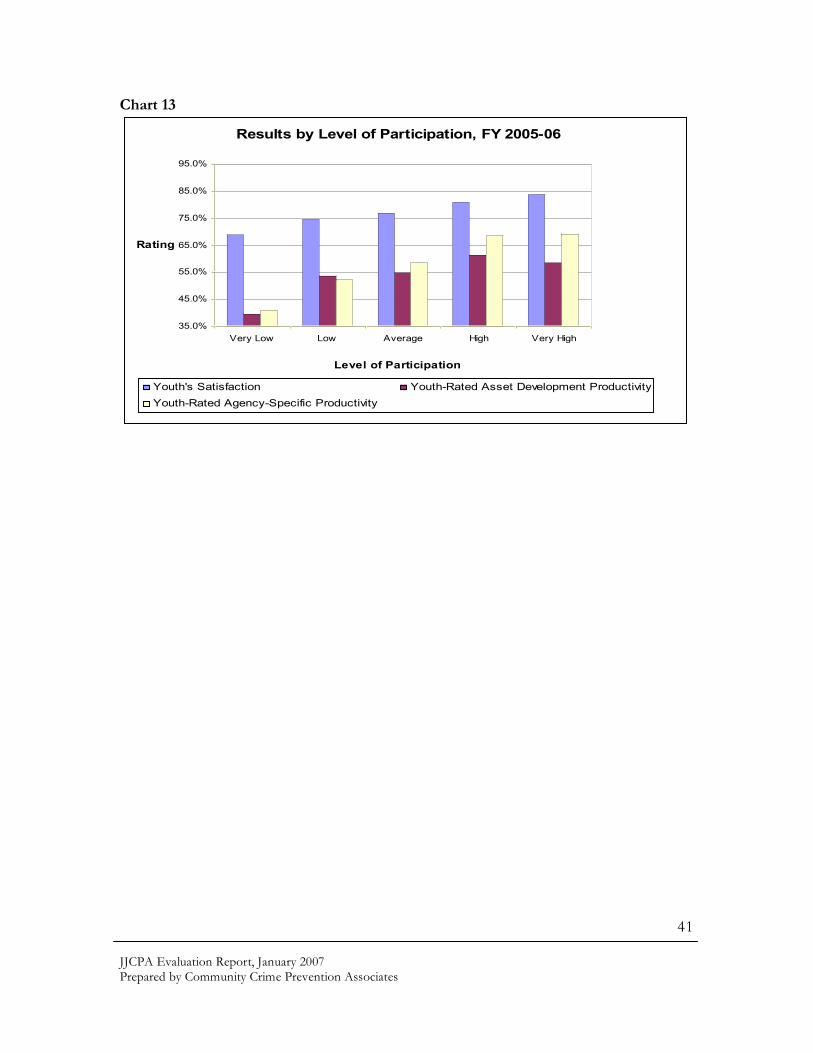
Participation Level and Productivity Ratings Consistent and meaningful participation with youth and families is, obviously, an important element making an impact and effectuating positive change. An analysis of customer service, developmental asset productivity, and direct service productivity scores by youth participation level shows that a high level of participation does, in fact, correlate to positive results. For each of the three measures, the higher the customer participation level, the better the results. With a 28.1-point difference, the discrepancy between a very high level of participation and very low level of participation was marked in the youth-rated agency-specific productivity score. The table and chart below show the results by participation level. The first group of data reflects youth-reported results, followed by parent-reported and staff-reported, respectively. Table 20
Youth Level of
Participation
Measure
Very
LowLow Average High
Very
High
Youth's Satisfaction 68.8% 74.6% 76.9% 81.0% 83.9%
Youth-Rated Asset
Development
Productivity
39.7% 53.6% 54.8% 61.5% 58.5%
Youth-Rated Agency-
Specific Productivity41.0% 52.2% 58.6% 68.6% 69.1%
Parent Satisfaction 65.7% 82.2% 81.2% 85.8% 86.4%
Parent-Rated Asset
Development
Productivity
12.7% 52.8% 57.0% 68.4% 65.0%
Parent-Rated
Agency-Specific
Productivity
28.9% 63.3% 70.9% 79.5% 76.7%
Staff-Rated Asset
Development
Productivity
10.2% 33.5% 65.1% 83.2% 84.2%
Staff-Rated Agency-
Specific Productivity14.8% 38.4% 69.8% 86.3% 87.7%
Results by Level of Participation, FY 2005-06
JJCPA Evaluation Report, January 2007 Prepared by Community Crime Prevention Associates
41
Chart 13
Results by Level of Participation, FY 2005-06
35.0%
45.0%
55.0%
65.0%
75.0%
85.0%
95.0%
Very Low Low Average High Very High
Level of Participation
Rating
Youth's Satisfaction Youth-Rated Asset Development Productivity
Youth-Rated Agency-Specific Productivity

JJCPA Evaluation Report, January 2007 Prepared by Community Crime Prevention Associates
42
Effort
STAFF Staff members of JJCPA-funded programs continue to be professional, dedicated, and demonstrated a passion for improving the lives of children and youth. The information contained this section is based on a focus group process and written questionnaire conducted for each program involving direct service staff and their program managers. The data contained in this section may not include the staff of all subcontracts. Importance of Staff As the Director of the Harvard University Project on Effective Interventions and Co-Chair of the Roundtable on Comprehensive Community Initiatives for Children and Families of the Aspen Institute, Lisbeth B. Schorr has conducted extensive research on improving the future of children and families and communities. Schorr researched thousands of programs across the country and determined seven attributes of highly effective programs. Three of these seven attributes, listed below, deal with program staff. She concluded that successful programs require gifted, tenacious, and flexible individuals to design, implement, and evaluate programs. The following excerpt notes the seven attributes:
1. Successful programs are comprehensive, flexible, responsive, and persevering. 2. Successful programs see children in the context of their families. “Nurture parents so they can nurture their children.”
3. Successful programs deal with families as parts of the neighborhoods and communities. Successful programs grow deep roots in the community and respond to the needs identified by the community.
4. Successful programs have a long-term, prevention orientation, a clear mission, and continue to evolve over time. They hold their goals steady but adapt their strategies to reach their goals.
5. Successful programs are well managed by competent and committed individuals
with clearly identified skills.
6. Staff of successful programs are trained and supported to provide high-quality, responsive services. Effective programs are aware that the greater the discretion given to front-line staff, the greater the need for and importance of excellent training.
7. Successful programs operate in settings that encourage practitioners to build strong relationships based on mutual trust and respect.”1
1 Schorr, Lisbeth. Common Purpose: Strengthening Families and Neighborhoods to Rebuild America, 1997.

JJCPA Evaluation Report, January 2007 Prepared by Community Crime Prevention Associates
43
Gender of JJCPA Staff and Clients In FY 2005-06, female staff members made up 75% of all staff across all JJCPA-funded programs, compared to 62.7% in the previous year. While there has generally been a relatively large disparity in gender of customers, FY 2005-06 is the second year for the disparity between genders of staff members. This suggests a deep need for more males to be recruited by community-based providers to serve the predominately male clientele. The table and chart below show the data. Table 21
Chart 14
Gender of JJCPA Customers vs. Staff
FY 2005-06
Gender Clients Staff
Female 33% 75%
Male 67% 25%
JJCPA-wide 100.0% 100.0%

JJCPA Evaluation Report, January 2007 Prepared by Community Crime Prevention Associates
44
Ethnicity of JJCPA Staff The chart below contains data for the ethnicity of JJCPA staff members compared to the clients. JJCPA-funded programs have done well to hire staff members whose ethnicities reflect the communities that they serve, however, providers should be aware of the lack of cultural competency for African-American youth. The staff demographic is reflective only of community-based providers and does not reflect Probation staff. Chart 15
Work Experience of JJCPA Staff JJCPA staff members were asked to comment on the number of years of experience working with youth and families. The table below shows that 66% indicated they had six or more years of experience in FY 2005-06. This represents an increase of 5-percentage points from the previous year. Table 22
Years FY 2001-02 FY 2002-03 FY 2003-04 FY 2004-05 FY 2005-06
Under 3 years 10% 8% 10% 8% 18%
3 to 5 years 14% 10% 18% 31% 16%
6 to 10 years 41% 38% 33% 33% 33%
Over 10 years 35% 44% 39% 28% 33%JJCPA-Wide 100% 100% 100% 100% 100%
JJCPA Staff Years of Work Experience
FY 2001-02 through FY 2005-06

JJCPA Evaluation Report, January 2007 Prepared by Community Crime Prevention Associates
45
The percent of JJCPA program staff with six or more years of experience working with youth and families declined from FY 2002-03 to FY 2004-05. However, FY 2005-06 demonstrates an increase in the percentage of JJCPA program staff with several years experience working with youth customers and their families. This data can be helpful for program managers in designing their professional development and program planning. Chart 16
Percent of JJCPA Program Staff with Six or More
Years of Experience Working with Youth and
Families
40%
50%
60%
70%
80%
90%
FY 2001-02 FY 2002-03 FY 2003-04 FY 2004-05 FY 2005-06
Year
Pe
rce
nt
Understanding the Importance of Youth Developmental Assets The JJCPA evaluation is rooted, in part, in the widely accepted theory of youth developmental assets. JJCPA-funded staff members were asked to evaluate how well their program performed on several program design components most conducive to building youth developmental assets. Staff members were given a list of program design components related to developmental assets. For each item on the list, staff rated how important the components were in the operation of their JJCPA-funded program. If the factor was critical to the program’s mission and goal, staff members were asked to enter a one. If the respondent felt that the component was highly valued by the program, he or she was asked to enter a two, and if the component was of secondary importance to the program, he or she was asked to enter a three. Additionally, staff members were asked about how well the program performed on implementing each component. By using the same scale, where one indicates implemented remarkably well; two indicates implemented quite well; and three indicates that the program could do better. The following table shows the survey results from staff respondents. As shown, the first column lists the program design component. The second and third columns show the average ranking for importance and accomplishment, respectively. The last column shows the discrepancy between how important the program component was ranked and how well staff members thought they accomplished it. Since

JJCPA Evaluation Report, January 2007 Prepared by Community Crime Prevention Associates
46
accomplishment was subtracted from importance, negative discrepancies reflected more emphasis and less accomplishment. Five of the 28 items had discrepancies of four or higher. Those five -- items 1, 9, 22, 23, and 24 -- are in bold on the full table and listed below. The positive discrepancy score for items number 9, 12 and 24 indicate that the program’s accomplishment outranked its relative importance. Similarly, a negative discrepancy score for items 1 and 22 indicates that the program component is relatively important, but fell short of accomplishment. Table 23
Program Component Rank of Imp.
Rank of Accom.
Discrep-ancy
1. Youth feel they belong to and are accepted by the program.
7 3 -4
9. Youth learn to respect the community. 9 13 4 22. Youth learn how to resolve differences non-violently. 11 6 -5 23. Youth develop new relationships with additional caring and supportive adults.
4 8 4
24. Youth learn how to set high expectations for themselves.
5 9 4
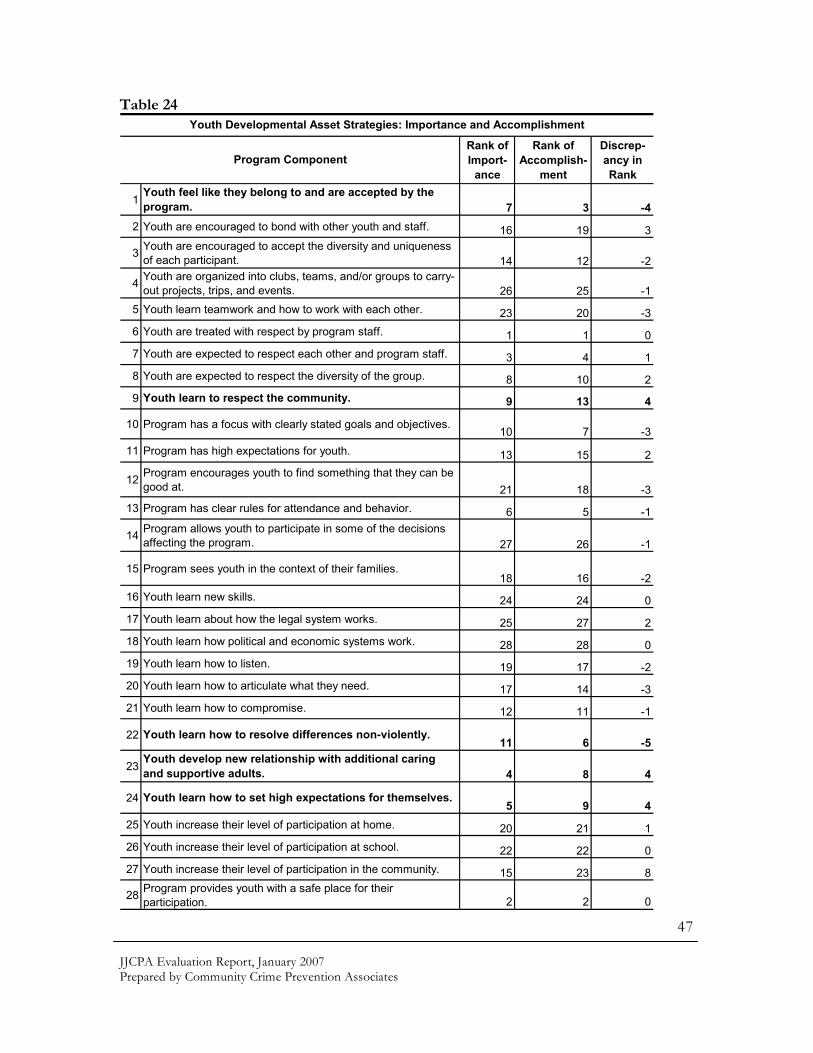
JJCPA Evaluation Report, January 2007 Prepared by Community Crime Prevention Associates
47
Table 24
Rank of
Import-
ance
Rank of
Accomplish-
ment
Discrep-
ancy in
Rank
1Youth feel like they belong to and are accepted by the
program. 7 3 -4
2 Youth are encouraged to bond with other youth and staff. 16 19 3
3Youth are encouraged to accept the diversity and uniqueness
of each participant. 14 12 -2
4Youth are organized into clubs, teams, and/or groups to carry-
out projects, trips, and events. 26 25 -1
5 Youth learn teamwork and how to work with each other. 23 20 -3
6 Youth are treated with respect by program staff. 1 1 0
7 Youth are expected to respect each other and program staff. 3 4 1
8 Youth are expected to respect the diversity of the group. 8 10 2
9 Youth learn to respect the community. 9 13 4
10 Program has a focus with clearly stated goals and objectives.10 7 -3
11 Program has high expectations for youth. 13 15 2
12Program encourages youth to find something that they can be
good at. 21 18 -3
13 Program has clear rules for attendance and behavior. 6 5 -1
14Program allows youth to participate in some of the decisions
affecting the program. 27 26 -1
15 Program sees youth in the context of their families.18 16 -2
16 Youth learn new skills. 24 24 0
17 Youth learn about how the legal system works. 25 27 2
18 Youth learn how political and economic systems work. 28 28 0
19 Youth learn how to listen. 19 17 -2
20 Youth learn how to articulate what they need. 17 14 -3
21 Youth learn how to compromise. 12 11 -1
22 Youth learn how to resolve differences non-violently.11 6 -5
23Youth develop new relationship with additional caring
and supportive adults. 4 8 4
24 Youth learn how to set high expectations for themselves.5 9 4
25 Youth increase their level of participation at home. 20 21 1
26 Youth increase their level of participation at school. 22 22 0
27 Youth increase their level of participation in the community. 15 23 8
28Program provides youth with a safe place for their
participation. 2 2 0
Youth Developmental Asset Strategies: Importance and Accomplishment
Program Component

JJCPA Evaluation Report, January 2007 Prepared by Community Crime Prevention Associates
48
Effort
STRATEGIES JJCPA-funded programs implemented a wide array of strategies in working with youth, families, and communities. Programs are implementing the type of strategies and services recommended by Lisbeth B. Schorr’s well-regarded research in the area of human services. In the 1990’s, extensive research was conducted on juvenile delinquency prevention. State and National experts developed a variety of best practices in preventing and intervening with youth at greatest risk for or already involved in the juvenile justice system. These best practices have been developed by the California Task Force to Review Juvenile Crime and the Juvenile Justice Response, the U.S. Office of Juvenile Justice and Delinquency Prevention, and the U.S. Department of Justice, Coordinating Council on Juvenile Justice and Delinquency Prevention, to name a few. Delinquency Prevention is Cost Effective These research findings also concluded that prevention is cost effective. Decades of research demonstrate that delinquency prevention is cost effective. According to a conservative estimate, the average cost of incarcerating a juvenile for one year is close to $34,000.1 In addition, national research estimates that the total cost to society of a young adult’s serious violent criminal career beginning at ages 18 to 23 years to be $1.1 million.2 Therefore, the JJCPA program is cost effective if only two youth served this year were persuaded to follow a pro-social path that did not lead to a serious violent criminal career. Research conducted by experts Lipsey3, Tolan and Guerra4, Howell5, and Mendel6 also concludes that delinquency prevention works. Youth Developmental Assets JJCPA programs were directed to utilize strategies that focus on and foster youth developmental assets. Some of the 41 developmental assets prepared by the Search Institute, such as family boundaries, school engagement, and resistance skills are consistent with the scope of services provided by programs.
1 Lipsey, M.W. 1992. Juvenile Delinquency Treatment, Meta-Analysis for Explanation: A Case Book. N.Y. N. Y.: Russell Sage Foundation 2 Cohen, M.A. 1994. The Monetary Value of Saving a High Risk Youth. Washington, D.C.: The Urban Institute. 3 Ibid. 4 Tolan, P., and Guerra, N. 1994 What Works in Reducing Adolescent Violence, An Empirical Review of the Field.: The Center for the Study and Prevention of Violence, University of Colorado. 5 Howell, J.C. 1995. The Guide for implementing the Comprehensive Strategy for Serious, Violent, and Chronic Juvenile Offenders. Wash. D.C.: U.S. Department of Justice. 6 Mendel, R.A. 1995. Prevention or Pork? A Hard-Headed Look at Youth-Oriented Anti-Crime Programs. Washington D.C.: American Youth Policy Forum
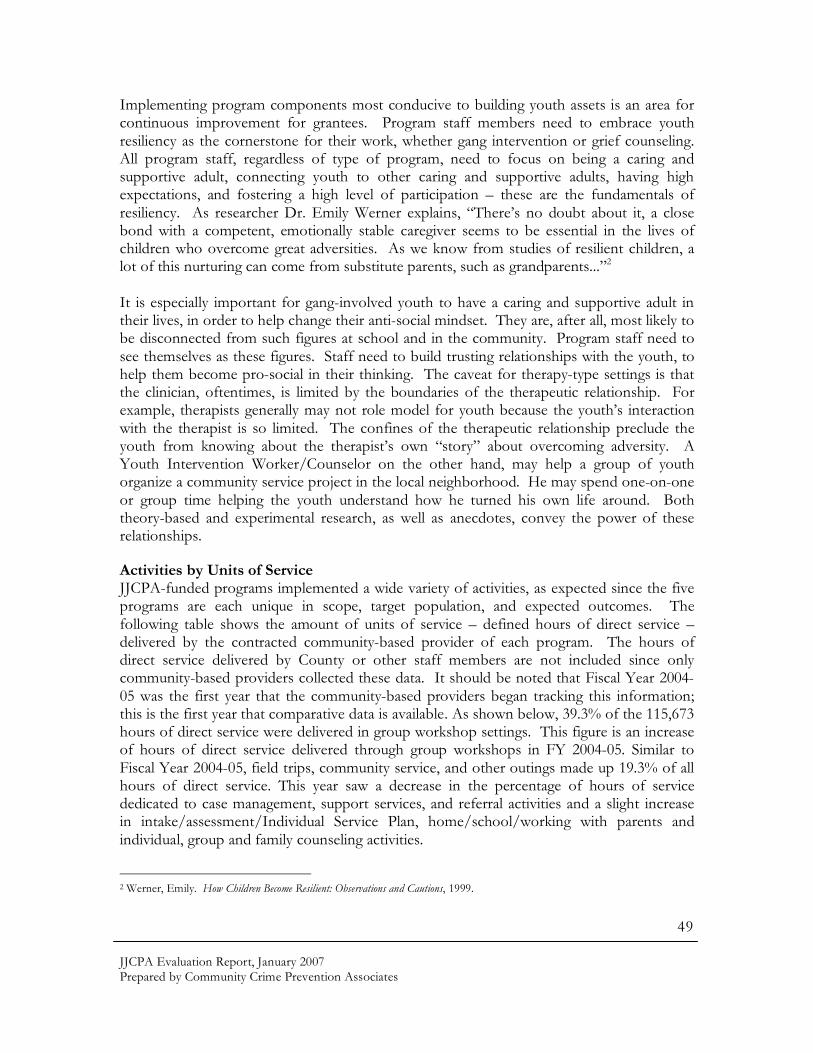
JJCPA Evaluation Report, January 2007 Prepared by Community Crime Prevention Associates
49
Implementing program components most conducive to building youth assets is an area for continuous improvement for grantees. Program staff members need to embrace youth resiliency as the cornerstone for their work, whether gang intervention or grief counseling. All program staff, regardless of type of program, need to focus on being a caring and supportive adult, connecting youth to other caring and supportive adults, having high expectations, and fostering a high level of participation – these are the fundamentals of resiliency. As researcher Dr. Emily Werner explains, “There’s no doubt about it, a close bond with a competent, emotionally stable caregiver seems to be essential in the lives of children who overcome great adversities. As we know from studies of resilient children, a lot of this nurturing can come from substitute parents, such as grandparents...”2 It is especially important for gang-involved youth to have a caring and supportive adult in their lives, in order to help change their anti-social mindset. They are, after all, most likely to be disconnected from such figures at school and in the community. Program staff need to see themselves as these figures. Staff need to build trusting relationships with the youth, to help them become pro-social in their thinking. The caveat for therapy-type settings is that the clinician, oftentimes, is limited by the boundaries of the therapeutic relationship. For example, therapists generally may not role model for youth because the youth’s interaction with the therapist is so limited. The confines of the therapeutic relationship preclude the youth from knowing about the therapist’s own “story” about overcoming adversity. A Youth Intervention Worker/Counselor on the other hand, may help a group of youth organize a community service project in the local neighborhood. He may spend one-on-one or group time helping the youth understand how he turned his own life around. Both theory-based and experimental research, as well as anecdotes, convey the power of these relationships. Activities by Units of Service JJCPA-funded programs implemented a wide variety of activities, as expected since the five programs are each unique in scope, target population, and expected outcomes. The following table shows the amount of units of service – defined hours of direct service – delivered by the contracted community-based provider of each program. The hours of direct service delivered by County or other staff members are not included since only community-based providers collected these data. It should be noted that Fiscal Year 2004-05 was the first year that the community-based providers began tracking this information; this is the first year that comparative data is available. As shown below, 39.3% of the 115,673 hours of direct service were delivered in group workshop settings. This figure is an increase of hours of direct service delivered through group workshops in FY 2004-05. Similar to Fiscal Year 2004-05, field trips, community service, and other outings made up 19.3% of all hours of direct service. This year saw a decrease in the percentage of hours of service dedicated to case management, support services, and referral activities and a slight increase in intake/assessment/Individual Service Plan, home/school/working with parents and individual, group and family counseling activities.
2 Werner, Emily. How Children Become Resilient: Observations and Cautions, 1999.

JJCPA Evaluation Report, January 2007 Prepared by Community Crime Prevention Associates
50
Table 25
Activity FY 05-06 FY 04-05
Outreach & Recruitment 2.7% 1.7%
Intake, Assessment and Individual Service Plan 5.3% 4.6%
Home/School Visit/Working with Parents 11.2% 10.7%
Individual, Group and Family Counseling 11.2% 8.2%
Case Management, Support Services and Referrals 9.7% 17.1%
Transportation 1.2% 1.2%
Field Trips, Community Service and Other Outings 19.3% 20.0%
Group Workshops 39.3% 36.5%
JJCPA - Wide 100.0% 100.0%
Activities by Units of Service for all JJCPA Providers
FY 2004-2006
The same data is included in the following table but for each program. As indicated, the community-based providers of the Aftercare, Assessment Center, and Restorative Justice programs delivered most of their direct services in group workshop settings, similar to Fiscal Year 2004-05. While MACSA and Truancy Reduction Services delivered most of its direct services in home/school visits/working with parents. Table 26
AftercareAssessment
CenterMACSA RJP Truancy JJCPA-Wide
Outreach & Recruitment1.0% 0.0% 3.3% 1.3% 15.6% 2.7%
Intake and Assessment
Process 1.9% 0.0% 4.5% 8.0% 10.2% 5.3%
Home/School
Visit/Working with Parents 14.3% 0.0% 42.1% 0.4% 48.4% 11.2%
Individual and Family
Counseling 17.0% 7.3% 0.0% 9.7% 14.7% 11.2%
Case Management,
Support Services, and 25.8% 0.0% 25.0% 2.3% 8.6% 9.7%
Transportation4.9% 0.0% 0.0% 0.0% 0.0% 1.2%
Field Trips, Community
Services, and Other 1.5% 0.0% 0.0% 42.3% 0.9% 19.3%
Group Workshops 33.7% 92.7% 25.1% 36.0% 1.7% 39.3%
JJCPA-Wide 100.0% 100.0% 100.0% 100.0% 100.0% 100.0%
Activities by Units of Service by JJCPA Program

JJCPA Evaluation Report, January 2007 Prepared by Community Crime Prevention Associates
51
Length of Intervention The following table shows the average number of days during the intervention period for each grantee. Aftercare Services had the longest average intervention period with 587 days. This is 343 days longer than the previous year when the average length of intervention was 244 days. After reviewing data provided by Probation, this increase has been determined to be artificial and is most likely not accurate. Probation and the Evaluation Team are developing a data collection plan that will eliminate future errors and seek to remedy this data point. The intervention period should be approximately between 180 and 210 days, given that it is a six-month program. Table 27
Grantee Average Number of Days
Aftercare Services 587.0
Assessment Center 48.0
MACSA 367.0
RJP 110.0
Truancy Reduction Services 123.0
JJCPA-Wide 247.0
Average Length of Intervention, FY 2005-06
Over time, the length of intervention across all JJCPA-funded programs showed a decrease from FY 2002-03 to FY 2004-05. This was attributed in part to Aftercare Services, which had become more focused and intensive during the time period referenced. However, the length of intervention from the previous year has increased, up from 170.4 days in FY 2004-05 to 247.0 days in FY 2005-06. The increase is attributed partially to the RJP and Truancy community based providers requesting the ability to extend their intervention period, if necessary, by an additional 30 days. This would enable the providers the opportunity to establish a relationship with their youth clients and their families upon referral, provide a thorough assessment, develop an individual service plan and ensure compliance with program requirements and services. The table and chart below show the results. Table 28
Aftercare
Services
Assessment
CenterMACSA RJP Truancy
JJCPA-
Wide
FY 2002-03 459.0 51.0 394.0 91.0 109.0 220.8
FY 2003-04 306.0 27.0 369.0 88.0 95.0 163.9
FY 2004-05 244.0 45.0 365.0 88.0 110.0 170.4
FY 2005-06 587.0 48.0 367.0 110.0 123.0 247.0
Length of Intervention Over Time

JJCPA Evaluation Report, January 2007 Prepared by Community Crime Prevention Associates
52
Effect
CUSTOMER SATISFACTION Sample Size The JJCPA Evaluation System is comprised of four core performance measures: customer satisfaction, developmental asset productivity, agency-specific service productivity, and intermediate outcomes. Each of these measures is determined by survey results administered to the youth and parent at the end of program intervention. Staff members of each program also complete a survey about the youth that they served. The sample size for each survey type, by program, is listed in the table below. The parent surveys are not part of the Assessment Center evaluation design and are denoted by NA. Table 29
Survey Questions The first of these four measures covered in this report is customer satisfaction. The measure is determined by asking youth customers and their parents to respond to four standard customer satisfaction questions. The following is a list of the questions. Youth • I think the program I participated in was: (rated Poor to Great) • I feel I benefited from this program: (rated Not at all, Some, or A lot) • I thought the people who run the program were: (rated Very Helpful, Somewhat
Helpful, or Not Helpful) • Would you tell a friend or schoolmate to come to this program if he/she needed it? (rated Yes, No, or Maybe)
Number of Surveys Submitted, FY 2005-06
RPRAYouth
Survey
Parent
Survey
Staff
Survey
Aftercare 75 146 95 72
Assessment Center 483 554 NA 456
MACSA 107 94 74 69
RJP 1,050 1,047 977 850
Truancy 176 218 211 208
JJCPA-Wide 1,891 2,059 1,357 1,655
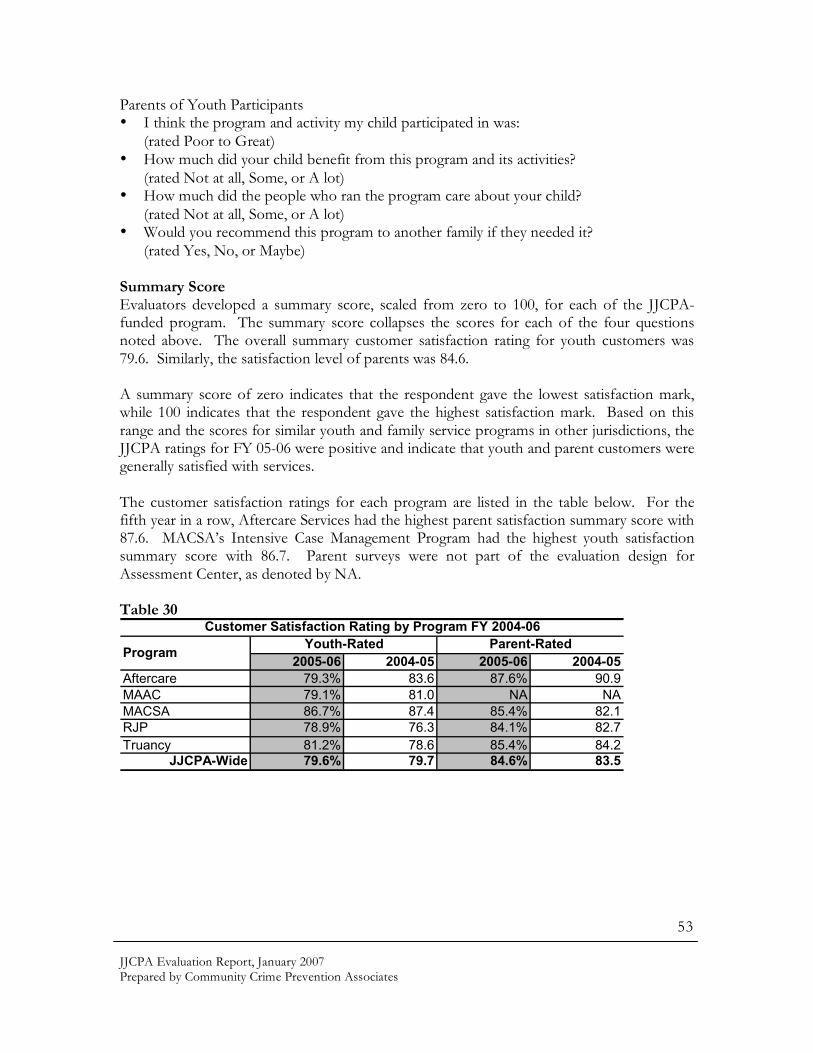
JJCPA Evaluation Report, January 2007 Prepared by Community Crime Prevention Associates
53
Parents of Youth Participants • I think the program and activity my child participated in was:
(rated Poor to Great) • How much did your child benefit from this program and its activities?
(rated Not at all, Some, or A lot) • How much did the people who ran the program care about your child?
(rated Not at all, Some, or A lot) • Would you recommend this program to another family if they needed it?
(rated Yes, No, or Maybe) Summary Score Evaluators developed a summary score, scaled from zero to 100, for each of the JJCPA-funded program. The summary score collapses the scores for each of the four questions noted above. The overall summary customer satisfaction rating for youth customers was 79.6. Similarly, the satisfaction level of parents was 84.6. A summary score of zero indicates that the respondent gave the lowest satisfaction mark, while 100 indicates that the respondent gave the highest satisfaction mark. Based on this range and the scores for similar youth and family service programs in other jurisdictions, the JJCPA ratings for FY 05-06 were positive and indicate that youth and parent customers were generally satisfied with services. The customer satisfaction ratings for each program are listed in the table below. For the fifth year in a row, Aftercare Services had the highest parent satisfaction summary score with 87.6. MACSA’s Intensive Case Management Program had the highest youth satisfaction summary score with 86.7. Parent surveys were not part of the evaluation design for Assessment Center, as denoted by NA. Table 30
2005-06 2004-05 2005-06 2004-05
Aftercare 79.3% 83.6 87.6% 90.9
MAAC 79.1% 81.0 NA NA
MACSA 86.7% 87.4 85.4% 82.1
RJP 78.9% 76.3 84.1% 82.7
Truancy 81.2% 78.6 85.4% 84.2
JJCPA-Wide 79.6% 79.7 84.6% 83.5
Customer Satisfaction Rating by Program FY 2004-06
Youth-Rated Parent-RatedProgram
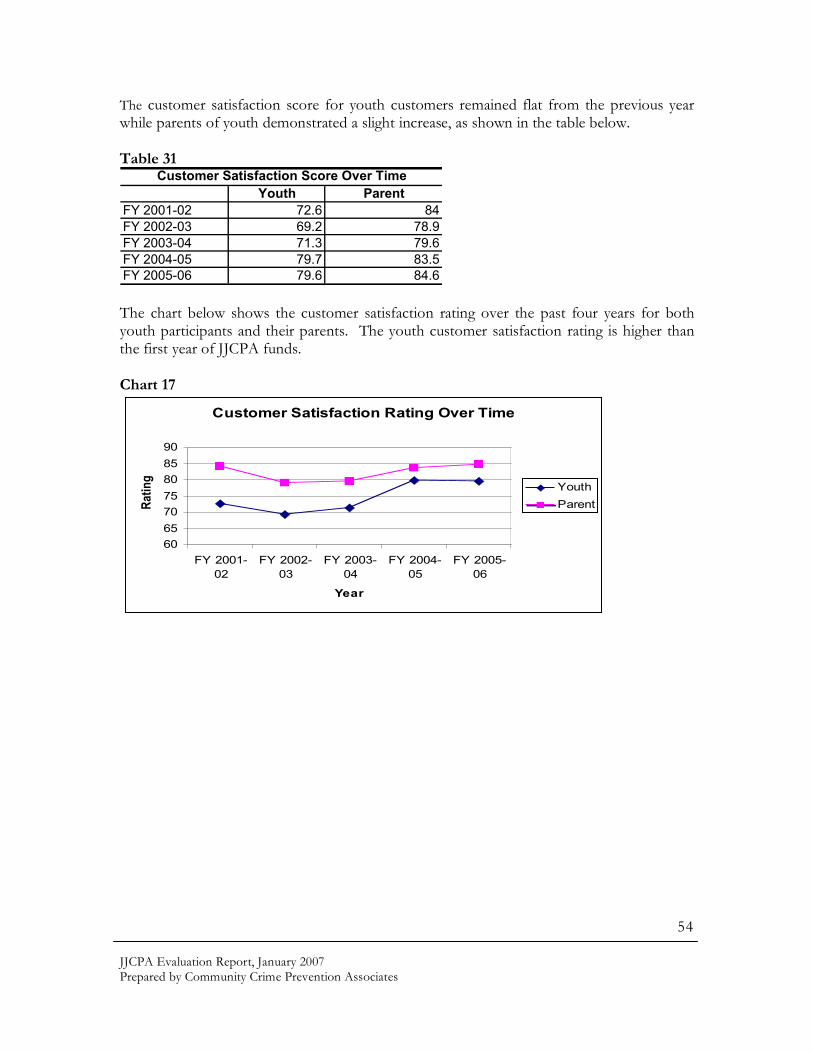
JJCPA Evaluation Report, January 2007 Prepared by Community Crime Prevention Associates
54
The customer satisfaction score for youth customers remained flat from the previous year while parents of youth demonstrated a slight increase, as shown in the table below. Table 31
Customer Satisfaction Score Over Time
Youth Parent
FY 2001-02 72.6 84
FY 2002-03 69.2 78.9
FY 2003-04 71.3 79.6
FY 2004-05 79.7 83.5
FY 2005-06 79.6 84.6 The chart below shows the customer satisfaction rating over the past four years for both youth participants and their parents. The youth customer satisfaction rating is higher than the first year of JJCPA funds. Chart 17
Customer Satisfaction Rating Over Time
60
65
70
75
80
85
90
FY 2001-
02
FY 2002-
03
FY 2003-
04
FY 2004-
05
FY 2005-
06
Year
Ra
tin
g
Youth
Parent

JJCPA Evaluation Report, January 2007 Prepared by Community Crime Prevention Associates
55
Effect
SERVICE PRODUCTIVITY The second and third performance measures in the JJCPA Evaluation System are related to service productivity. Service productivity is a measure of how effective services were in producing the desired change (a change for the better) in customers. In the case of JJCPA, service productivity measures youth developmental assets and program-specific services. This evaluation technique gives program staff the opportunity to understand the specific ways in which their customers are better off due to their unique program components. These changes may include improved skills, gain in knowledge, acquired assets, improved attitudes, and improved behaviors. Customer Opinion and Service Productivity As with customer satisfaction, service productivity is based on the opinions of the youth participants, their parents, and staff members. Essentially, productivity measures the customer’s opinions of the impact of JJCPA services on his/her life. Productivity measures are similar to customer satisfaction measures in that regard and have been used extensively by the private sector to measure service benefits to customers. This method is based on the premise that the person best able to determine whether or not a change has actually occurred is the person who experienced the change him/herself; in this case, this person is the JJCPA customer. Service productivity results are the key to the success of any service, whether in the public or private sector. Service productivity measures whether the service is producing value to the customer. Results are defined as benefits experienced or received by the customer. Measuring Service Productivity The measurement of service productivity in the JJCPA Evaluation System is based on the definition of services as transformations of people through a service. Services, according to Hill (1976), require the presence of a relationship between the producer and consumer that results in a change in the condition of the consumer, or something belonging to the consumer. For example, an automobile is a product that receives services: a tune up, oil and filter change, etc. The automobile remains the same, but the dirty oil is replaced by clean oil, thus resulting in a change in the status of the automobile. Hill explains that this change only occurs in the presence of the producer and consumer. If school success improved as a result of receiving services from a particular grantee, then a positive change was counted. If school success got worse as a result of receiving services from a grantee, then a negative change was counted. Following the model of Roos (1997) for calculating service productivity in hospitals as the sum of all changes in functioning, the sum of the positives and negatives was calculated to obtain a total count. The percent of productivity for each grantee was calculated as the average score across all respondents. If more negative changes than positive changes occurred, the percentage would be
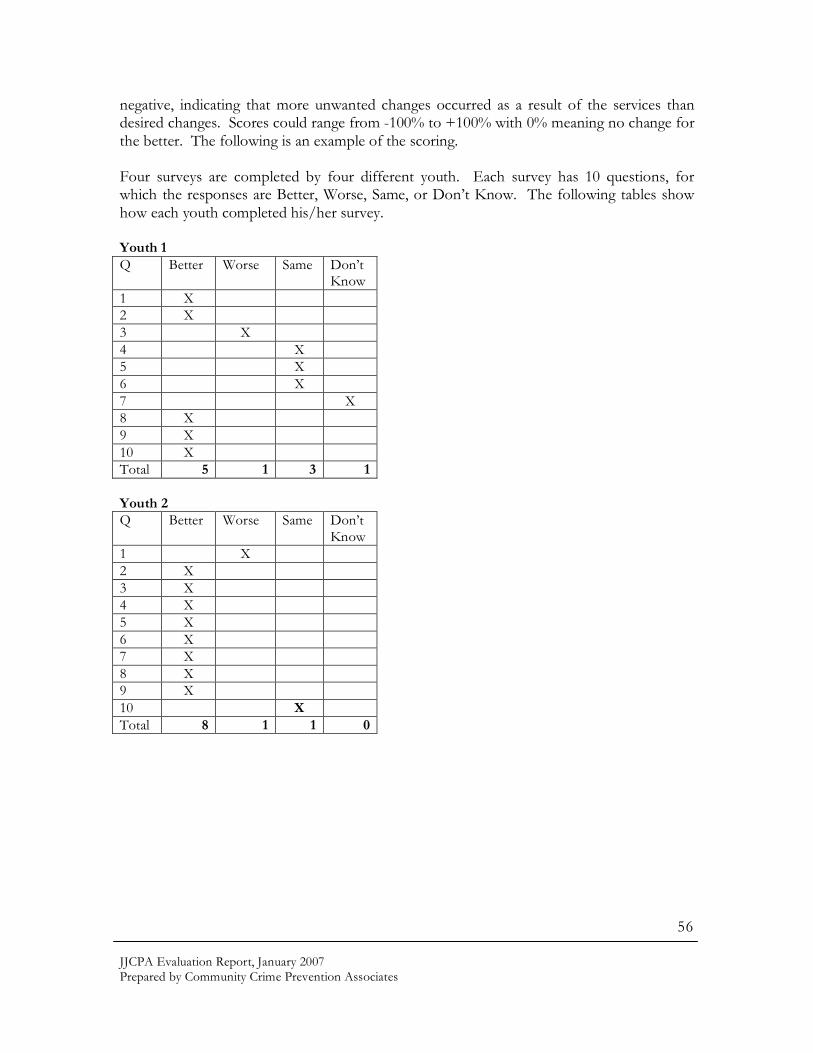
JJCPA Evaluation Report, January 2007 Prepared by Community Crime Prevention Associates
56
negative, indicating that more unwanted changes occurred as a result of the services than desired changes. Scores could range from -100% to +100% with 0% meaning no change for the better. The following is an example of the scoring. Four surveys are completed by four different youth. Each survey has 10 questions, for which the responses are Better, Worse, Same, or Don’t Know. The following tables show how each youth completed his/her survey. Youth 1 Q Better Worse Same Don’t
Know 1 X 2 X 3 X 4 X 5 X 6 X 7 X 8 X 9 X 10 X Total 5 1 3 1 Youth 2 Q Better Worse Same Don’t
Know 1 X 2 X 3 X 4 X 5 X 6 X 7 X 8 X 9 X 10 X Total 8 1 1 0

JJCPA Evaluation Report, January 2007 Prepared by Community Crime Prevention Associates
57
Youth 3 Q Better Worse Same Don’t
Know 1 X 2 X 3 X 4 X 5 X 6 X 7 X 8 X 9 X 10 X Total 7 1 1 1 Youth 4 Q Better Worse Same Don’t
Know 1 X 2 X 3 X 4 X 5 X 6 X 7 X 8 X 9 X 10 X Total 10 0 0 0 The scores across all questions and all respondents are as follows: Better = 30 out of 40 Worse = 3 out of 40 Same = 5 out of 40 Don’t Know = 2 out of 40 Percent of Targeted Changes Achieved (‘Better’ responses)
Minus Percent of Missed Changes (‘Worse’
responses)
Equals Service Productivity
30/40 or 75% - 3/40 or 7.5% = 67.5% The service productivity score for this set of four surveys is 67.5%.

JJCPA Evaluation Report, January 2007 Prepared by Community Crime Prevention Associates
58
Tying Outcomes to JJCPA Services Evaluators have been struggling for decades with measuring outcomes and subsequently attempting to determine if the outcomes could be tied to the services delivered. For example, if a youth’s school success improves, who was responsible for this improvement? Was it the service provider, the school, the parents, a new friend, a job, or any other number of influences on the youth’s life that had an impact on this outcome? The JJCPA service productivity model asks the youth and the parent(s) directly if the JJCPA services specifically had an impact on the youth’s school success, thereby directly tying the JJCPA service to outcomes. The current system does not indicate the extent to which the youth got better in school, for instance, but does indicate whether the service was effective in producing the desired change. Developmental Asset Productivity Rating A summary score was also determined for Developmental Asset Productivity. Youth, parents, and staff gave their opinions about various developmental asset variables. For each variable, each respondent was given four response choices: got better, stayed the same, got worse, or don’t know. The following seven questions were used to develop the service productivity score for developmental assets. The Multi-Agency Assessment Center did not incorporate this feature of the evaluation design. • Because of this program, my success at school (job/training) is: • Because of this program, my understanding of who I am and what I can do is: • Because of this program, my ability to communicate is: • Because of this program, my ability to learn new things is: • Because of this program, my ability to connect with adults is: • Because of this program, my ability to work with others is: • Because of this program, my ability to stay safe is: The responses for these seven questions were used to generate a productivity score. The youth-rated developmental asset service productivity across all programs is 58.8%. The parent-rated developmental asset productivity across all programs is 65.6%. Table 32 lists the results. The data columns show the developmental asset productivity score as reported by youth participants, their parents, and staff members, respectively. While the JJCPA - wide youth-reported developmental asset productivity score decreased slightly from FY 2004-05, the Restorative Justice Program and Truancy Reduction Services youth developmental asset productivity scores demonstrated an increase. The Aftercare Program youth reported a 10% decrease between FY04-05 and FY 05-06, however, the parent-reported and staff-reported productivity scores increased. There a several possible factors contributing to this decrease: 1) limited opportunities for line-staff to ‘case conference’ and share with each other clients’ progress and their needs; 2) A lack of attention to the developmental assets in programming; 3) indication of youth taking the survey at exit after a failure; 4) increase in number of younger clients.

JJCPA Evaluation Report, January 2007 Prepared by Community Crime Prevention Associates
59
To the credit of Probation leadership, since notification of this 10% drop in developmental asset productivity, management has taken steps to focus on this outcome measure with the Aftercare Steering Committee, to increase asset training with the community-based providers and Probation staff, and seeks to monitor the progress. Table 32
FY 2005-06 FY 2004-05 FY 2005-06 FY 2004-05 FY 2005-06 FY 2004-05
Aftercare Services 60.6% 70.6% 72.9% 84.3% 82.5% 80.4%
Assessment Center NA NA NA NA NA NA
MACSA 79.5% 83.7% 81.1% 89.3% 72.7% 88.2%
RJP 54.7% 51.7% 62.5% 60.3% 76.5% 71.2%
Truancy 68.4% 63.0% 68.4% 64.8% 61.5% 64.5%JJCPA-Wide 58.8% 61.4% 65.6% 67.7% 74.0% 74.9%
Developmental Asset Productivity, FY 2004-06
Youth-Reported Parent-Reported Staff-Reported
Program
Program-Specific Service Productivity Rating The third component of the JJCPA Evaluation System is direct service productivity. Unlike developmental asset productivity where the same questions were posed to youth, parents and staff for all of the five funded programs, direct service productivity relies on program-specific questions that are tailored to various programs. Staff members of each program developed survey questions based on their unique program goals. Survey instruments were constructed to measure the productivity of the unique services provided by grantees. Translations were completed for those agencies who requested them. Program-specific questions included: • My ability to make good choices (such as avoiding drugs and alcohol) is: • My ability to set educational goals: • My ability to communicate with my parent/guardian is: • My connection to other services or community programs: • My understanding of my culture is: • My ability to resolve conflicts verbally rather than through violent actions is • My knowledge of positive life alternatives is: The program-specific service productivity scores are listed in Table 31. The JJCPA-wide score for all youth respondents is 64.3%. The scores reported by parents ranged from 79.6% to 75.9%, as shown below. The youth-reported program-specific productivity score decreased slightly from the previous year while the parent-reported and staff-reported productivity score demonstrated an improvement.

JJCPA Evaluation Report, January 2007 Prepared by Community Crime Prevention Associates
60
Table 33
FY 2005-06 FY 2004-05 FY 2005-06 FY 2004-05 FY 2005-06 FY 2004-05
Aftercare Services 67.8% 69.3% 79.6% 84.5% 83.6% 75.0%Assessment Center 57.0% 63.8% NA NA 70.4% 53.3%
MACSA 77.5% 78.8% 78.5% 85.2% 67.4% 82.9%
RJP 64.9% 60.0% 75.7% 71.2% 83.5% 76.7%
Truancy 70.3% 67.7% 76.5% 75.8% 59.4% 71.4%JJCPA-Wide 64.3% 65.5% 76.4% 74.9% 76.2% 75.5%
Parent-Reported Staff-Reported
Program-Specific Productivity, FY 2004-06
Program
Youth-Reported
The table and chart below summarize the productivity scores by respondent across all JJCPA programs. Table 34
Respondent Develpmental Asset Program Specific
According to Youth 58.8% 64.3%
According to Parents of Youth 65.6% 76.4%
According to Staff 74.0% 76.2%
JJCPA-Wide Productivity Ratings, FY 2005-06
The chart below illustrates that the range for productivity ratings is -100 to 100. A -100 score would indicate that all respondents gave a “got worse” response for each variable. Chart 18
JJCPA-Wide Productivity Scores, FY 2005-06
-100.0% -75.0% -50.0% -25.0% 0.0% 25.0% 50.0% 75.0% 100.0%
According to Youth
According to
Parents of Youth
According to Staff
Res
po
nd
ent
Score
Develpmental Asset Program Specif ic

JJCPA Evaluation Report, January 2007 Prepared by Community Crime Prevention Associates
61
Youth developmental asset productivity scores have decreased over the last three years. Parent and staff development asset productivity scores have increased since FY 2002-03 and leveled off this past year. The chart below shows the results over time. Chart 19
Developmental Asset Productivity Over Time
40.0%
45.0%
50.0%
55.0%
60.0%
65.0%
70.0%
75.0%
80.0%
FY 2001-02 FY 2002-03 FY 2003-04 FY 2004-05 FY 2005-06
Year
Sco
re
Youth
Parents
Staff
Youth program-specific productivity scores have increased beginning FY 2001-02 and demonstrated a slight decrease from FY 2004-05. Both parent and staff program-specific productivity scores have increased over the last five years. The chart below shows the results over time. Chart 20
Program-Specific Productivity Over Time
40.0%
45.0%
50.0%
55.0%
60.0%
65.0%
70.0%
75.0%
80.0%
FY 2001-02 FY 2002-03 FY 2003-04 FY 2004-05 FY 2005-06
Year
Sco
re
Youth
Parents
Staff

JJCPA Evaluation Report, January 2007 Prepared by Community Crime Prevention Associates
62
Making Data More Informative The acceptability, appropriateness, and effectiveness of JJCPA services for the customers of Santa Clara County were assessed from three points of view—the youth who received services, their parents, and staff members who interacted with the customers. The effectiveness was assessed by calculating both asset development service productivity and direct service productivity. Choices were made about which questions of each type to ask and how many to include in the questionnaires. Ideally, enough questions were included to learn what happened without causing the persons completing the questionnaires to lose interest in answering the questions. In order to determine whether enough questions were asked, and of the right kind, a psychometric evaluation was conducted on each type of assessment. Assessing Reliability The reliability of each questionnaire was determined by calculating the internal consistency of the items. Cronbach’s alpha was calculated for the item responses after re-scaling them to a range from 0 to 1. Reliability ranges from zero (no consistency) to one (complete agreement among the items). In other words, a one means that youth answer the items so that all youth and all items can be ordered consistently. Desired levels of reliability are determined by the purpose behind using the scores. If decisions need to be made about placing a particular youth in one program versus another, the level of reliability should exceed .90. If decisions will be made about groups of youth, such as whether males or females benefited more from the program, the level of reliability should exceed .75. If multivariate analyses of these data are pursued to clarify patterns of service effectiveness, the level of reliability should exceed .60. Continuous Improvement for JJCPA Evaluation Instruments To support drawing inferences from the results presented in this evaluation report, we expected that the levels of reliability would exceed .60. One question achieved lower reliability (“Because of this program, my ability to stay out of trouble is:”) and was revised for FY 2004-05. As a result, question was re-worded to read: “Because of this program, my ability to stay safe is:” Two steps can be taken to improve data quality for under-performing scales. One, those items that did not fit the pattern being followed by the other items in the scale can be removed. The column for deviant items indicates whether an item lowered the overall reliability of the scale when included. Two, the reliability of scales can be increased by adding items that measure the same concept and produce similar answer patterns to the other items. For example, customer satisfaction questions were revised beginning in FY 2002-03. Assessing Validity The validity of the assessment data indicates how well the underlying idea or concept is captured. In other words, when gathering subjective information with no physical referent, it is important to demonstrate that the pattern of results reflects expected differences based on conceptual distinctions. For example, it was expected that service
JJCPA Evaluation Report, January 2007 Prepared by Community Crime Prevention Associates
63
productivity would not be too similar to service satisfaction or level of asset development, since the purpose was to measure different concepts. Also, it was expected that the youth, parents, and staff would tend to agree, not disagree, about service productivity and service satisfaction. Validity testing was conducted in FY 2001-02 at the beginning of the JJCPA funding. For level of asset development, the three sub-scales correlated about .60 with each other and about .75 with the total score. This pattern of correlations indicates some agreement among the sub-scales and near-equal contributions to total score. None of these scales correlated over .30 with any of the other scales, thus demonstrating distinctiveness as expected. Social Attachment does not correlate over .30 with any other scale, as expected. Satisfaction scales correlated with service productivity scales to some degree within a source of data, about .40. Across sources of data (youth, parent, or staff) and within focus of assessment (satisfaction or service productivity) the correlations were sizable, .35 or higher, except for staff reporting on service productivity. The overall pattern of concurrent validity correlations consistently supported the selection of these scales as measuring distinct concepts. By performing this evaluation of the quality of the JJCPA data, we learned that much of the data we are gathering is of sufficient quality to indicate how effective services are to the customers participating in the programs. Also, we learned that several scales could be improved. Most of the improvement will occur by adding questions to the questionnaires. The evaluation team recognizes that time is taken away from serving the youth to obtain these data and is striving to keep the questionnaires brief. Only after documenting why more questions are needed, are we willing to make the changes. Accuracy of the Data The quality of the responses that the three types of people make also is related to the reliability and validity of the assessment scales. Unless respondents think the information will be used, they may fail to complete the questionnaire thoughtfully. Thus, when agency staff members distribute the questionnaires to youth or parents, it is important to explain why we need this information. Respondents can be advised that what they report is confidential and that providing the most accurate information will help the agency to improve services. The youth who complete the questionnaire while attending the program should be assured that the time needed to fully answer one questionnaire is less than 10 minutes and will not interfere with the day’s schedule of activities. Some staff person should review all of the questionnaires that are completed and verify that the information requested was accurately and properly noted. In particular, only when the youth’s date of birth and initials are correctly reported can analyses be performed which compare reports submitted at different times and by different types of people, i.e., youth, parents, and staff. Comparisons of different reports over time tell us whether the youth are doing better. Comparisons between the different sources of information tell us what the three groups agree about. Knowing what the consensus is reveals what issues should be addressed first.

JJCPA Evaluation Report, January 2007 Prepared by Community Crime Prevention Associates
64
Performance
INTERMEDIATE OUTCOMES The State Board of Corrections (BOC) required funded programs to report on six statewide outcomes. These outcomes are:
1. Arrest Rate 2. Probation Completion Rate 3. Incarceration Rate 4. Restitution Completion Rate
5. Court-Ordered Community Service Completion Rate
6. Probation Violation Rate
In addition to these six BOC-required outcomes, programs were asked to develop and track local outcome measures – that is, measures that are specific to each unique program and selected by program staff. Each of the five funded programs stated their local outcome measures in the County’s Comprehensive Multi-Agency Juvenile Justice Plan. Statewide Outcomes Required by the Board of Corrections In order to report to the State Legislature on common outcome variables, the BOC developed six measures. Each county was required to report on these outcomes, whether or not they applied to the program. The statewide outcomes were reported to the BOC reflect a different sample size for each program. Outcomes for the Aftercare and MACSA programs were measured during the program period. Outcomes for the Assessment Center (MAAC), RJP, and Truancy programs were measured after the youth exited the program. The table below summarizes the results by program. Table 35
The Program Summary section will analyze whether the outcome went in a positive or negative direction. It should be kept in mind that the methodology for the Aftercare Program has changed from measuring outcomes after the youth exited the program for a period of 6 months to during the program period. This impacts all variables but most significantly for probation completion and restitution completion. Most youth will not complete probation or restitution until some time after the program.

JJCPA Evaluation Report, January 2007 Prepared by Community Crime Prevention Associates
65
Local Outcome Measures As explained earlier in the report, surveys are used to understand whether the youth customer experienced the desired changes as a result of participating in the program. The evaluation team reports the survey data about what specific desired changes the youth customers experienced. These desired changes are grouped into three categories: customer satisfaction, youth developmental assets, and program-specific. At the inception of the JJCPA funding stream, each program had the opportunity to develop local outcome measures. These measures vary from program to program, may include process measures (e.g. length of time from referral to receiving services will be seven days), and vary in data source. These local outcome measures are required by the State and are also reported to the Juvenile Justice Coordinating Council. The data upon which a program’s local outcome measure is based varies from program to program as well as outcome to outcome. For example, the Multi-Agency Assessment Center’s (MAAC) local outcome measures consist entirely of process measures and the data is produced by the Probation Department. MAAC added an additional process measurement this program year, to determine how soon assessments are conducted. The Aftercare Program has five local outcome measures, four of which are determined by survey data and one of which is determined by the Probation Department (e.g. youth that successfully complete 10-week initial aftercare period a.k.a. pre-release period). *During FY 2005-06, the evaluation team inadvertently omitted a question on an Aftercare Program survey making it impossible to use the surveys as a way to determine the result of two local outcome measures: (1) 70% of youth will report improved communication with his/her parent and (2) 70% of parents will report improved communication with their son/daughter. The evaluation team apologizes for this error and will ensure that this oversight does not happen again. As a result of the error, the evaluation team conducted a phone survey of 140 Aftercare youth and parents during a two-week period from December 1-15, 2006. Unfortunately, of the 140 records, 30% had a disconnected phone number (not in service) and 28.6% were working but wrong numbers. Successful contacts were only made in 18 cases or a 13% sample size. Of the 18 successful contacts with youth and parents who participated in the Aftercare Program, all 36 responses (18 youth + 18 parents) were positive. All 36 respondents indicated that the youth’s ability to communicate with his/her parent(s) had improved as a result of participating in the program – and all 36 respondents indicated that the youth’s attendance at school had improved as well. While the phone survey was not successful in reaching all of the participants, the results do indicate that the program was helpful in accomplishing these two desired results – for the survey participants. Furthermore, in order to increase survey data validity, the evaluation team has made a change to the way it reports on local outcome measures. Rather than relying on one question to determine whether a program achieved its local outcome measure, the team will used three questions to make this determination. For example, if a program’s local
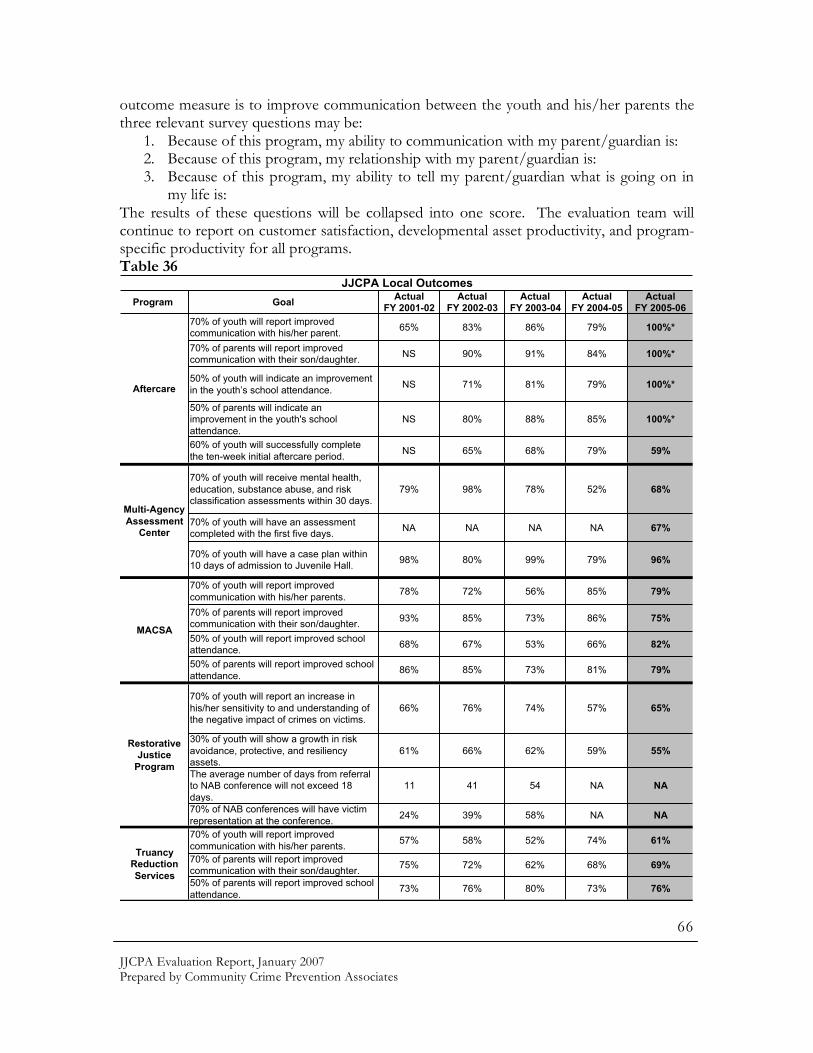
JJCPA Evaluation Report, January 2007 Prepared by Community Crime Prevention Associates
66
outcome measure is to improve communication between the youth and his/her parents the three relevant survey questions may be:
1. Because of this program, my ability to communication with my parent/guardian is: 2. Because of this program, my relationship with my parent/guardian is: 3. Because of this program, my ability to tell my parent/guardian what is going on in
my life is: The results of these questions will be collapsed into one score. The evaluation team will continue to report on customer satisfaction, developmental asset productivity, and program-specific productivity for all programs. Table 36
Program GoalActual
FY 2001-02Actual
FY 2002-03Actual
FY 2003-04Actual
FY 2004-05Actual
FY 2005-06
70% of youth will report improved communication with his/her parent.
65% 83% 86% 79% 100%*
70% of parents will report improved communication with their son/daughter.
NS 90% 91% 84% 100%*
50% of youth will indicate an improvement
in the youth’s school attendance.NS 71% 81% 79% 100%*
50% of parents will indicate an improvement in the youth's school
attendance.
NS 80% 88% 85% 100%*
60% of youth will successfully complete
the ten-week initial aftercare period.NS 65% 68% 79% 59%
70% of youth will receive mental health,
education, substance abuse, and risk classification assessments within 30 days.
79% 98% 78% 52% 68%
70% of youth will have an assessment completed with the first five days.
NA NA NA NA 67%
70% of youth will have a case plan within 10 days of admission to Juvenile Hall.
98% 80% 99% 79% 96%
70% of youth will report improved
communication with his/her parents.78% 72% 56% 85% 79%
70% of parents will report improved communication with their son/daughter.
93% 85% 73% 86% 75%
50% of youth will report improved school attendance.
68% 67% 53% 66% 82%
50% of parents will report improved school
attendance.86% 85% 73% 81% 79%
70% of youth will report an increase in
his/her sensitivity to and understanding of the negative impact of crimes on victims.
66% 76% 74% 57% 65%
30% of youth will show a growth in risk
avoidance, protective, and resiliency assets.
61% 66% 62% 59% 55%
The average number of days from referral to NAB conference will not exceed 18
days.
11 41 54 NA NA
70% of NAB conferences will have victim
representation at the conference.24% 39% 58% NA NA
70% of youth will report improved
communication with his/her parents.57% 58% 52% 74% 61%
70% of parents will report improved communication with their son/daughter.
75% 72% 62% 68% 69%
50% of parents will report improved school
attendance.73% 76% 80% 73% 76%
JJCPA Local Outcomes
Restorative Justice
Program
Truancy Reduction
Services
Aftercare
Multi-Agency
Assessment Center
MACSA

JJCPA Evaluation Report, January 2007 Prepared by Community Crime Prevention Associates
67
Local Outcomes Analysis Restorative Justice and MACSA met all of the Local Outcome goals. MACSA’s results declined from the previous year in the categories of improved communication with parents/with son or daughter and in the parents’ response to their child’s improvement in school attendance. Youth reported a 20% increase from the previous year in their school attendance. MAAC only met one of its three goals – 96% of youth had a case plan within 10 days of admission, a 17% increase over the previous year. While MAAC didn’t meet the goal, it had an impressive 16% gain for achieving assessments within 30 days. Truancy Reduction Services had gains in parent reporting of improved school attendance and improved communication with their child. Unfortunately, youth reported a significant 13% drop in improved communication with their parents. This program only met one of the three goals. Finally, for Aftercare Services, a major concern is the 20% drop in the number of youth who successfully completed the initial 10-week Aftercare period. The evaluation team addresses this issue in the Program Recommendations. School Data In FY 2002-03, the JJCPA Evaluation Team began to collect and analyze school attendance data for Truancy Reduction Services – beyond the data that is captured by surveying youth, parents, and staff. Consequently, program staff obtained and submitted school attendance data on each youth. Staff members submitted a school attendance print-out for youth showing the youth’s attendance history prior to the intervention, and at the end of intervention. Subsequently, in FY 2003-04, the Evaluation Subcommittee of the Juvenile Justice Coordinating Council directed the JJCPA Evaluation Team to develop and report on two school-related outcomes for all JJCPA programs: grade point average and school attendance – for two time periods: three months before program entry and three months after program exit. The JJCPA Evaluation Team approached seven school districts. The number of school districts was based on evaluation budget and which school districts were based on the location of JJCPA program participants. Of the seven districts, two indicated that they would not be able to provide the data; three districts agreed to provide the data, but did not produce anything in time for the report; and two districts produced data for the report. The table below shows which districts were approached by the evaluation team and the results of school data collection efforts during FY 2004-05.

JJCPA Evaluation Report, January 2007 Prepared by Community Crime Prevention Associates
68
Table 37
Results of School Data Collection, FY 2004-05 School District Unable to
Assist Agreed to Assist, but
Did Not Produce Data Agreed to Assist and Produced
Data Alum Rock Unified School District X Campbell Union High School District
X
East Side Union High School District
X
Franklin-McKinley School District X Gilroy Unified School District X San José Unified School District X Santa Clara Unified School District X The JJCPA Evaluation Team developed a template based on the requested data by the JJCC Evaluation Subcommittee. The template included the youth’s first name, last name, gender, and date of birth by JJCPA program and school district. Additionally, the JJCPA Evaluation Team paid $20.00 - $30.00 per hour for data extraction to school district personnel, as well as provided training on using the data template. As indicated in the table above, school districts were not particularly helpful in providing the data. Since the JJCPA Evaluation Team does not have direct access to the school district data systems, it is entirely dependent on the cooperation of school districts. Data provided by the two participating school districts was limited. Of the 1,335 records given to the East Side Union High School District, data was returned on only 134 records. Data from the Franklin-McKinley School District was considerably more complete for the 190 records submitted to the district. In FY2005-2006, the Evaluation Sub-Committee directed the CCPA Evaluation Team to contact school districts and inquire whether ParentConnect, a web-based program available to parents and families to stay informed of students’ attendance and grades was utilized by the district and could be made available to CCPA to collect JJCPA youth clients information. ParentConnect was originally funded through Juvenile Accountability Block Grant funding based on a recommendation by the Truancy Abatement Collaborative. Of the districts contacted that utilize ParentConnect, San Jose Unified wanted to assist in pulling data for us but ParentConnect does not track the information as requested for this evaluation. For example, the grade point average is tracked cumulatively. Therefore, we could not collect GPA data before and after the service period. San Jose Unified provided attendance data in hard copy. ESUHSD was contacted to determine if their ParentConnect program would provide the attendance and academic data in the format we would need for analysis. Similar to San Jose Unified School District, the grade point average is tracked cumulatively and the program does not allow queries by groupings of student, data would

JJCPA Evaluation Report, January 2007 Prepared by Community Crime Prevention Associates
69
have to be extracted for each student participant and permission would be required from each parent to access the ParentConnect database. The evaluation team submitted a Memorandum of Understanding (MOU) to ESUHSD to establish a partnership between the Evaluation Team and ESUHSD for collection data of youth in ESUHSD that were participants of the JJCPA Programs. The evaluation proposed payment of $20/hour for the data entry services of the district IT personnel. After submission of the MOU, the evaluation team was told that upon the review of the school board, we would be notified of their decision. Several attempts were made to contact the IT and Student Services Division regarding the status of the MOU without success. Gilroy Unified, Santa Clara Unified and Alum Rock Unified School Districts do not utilize ParentConnect.
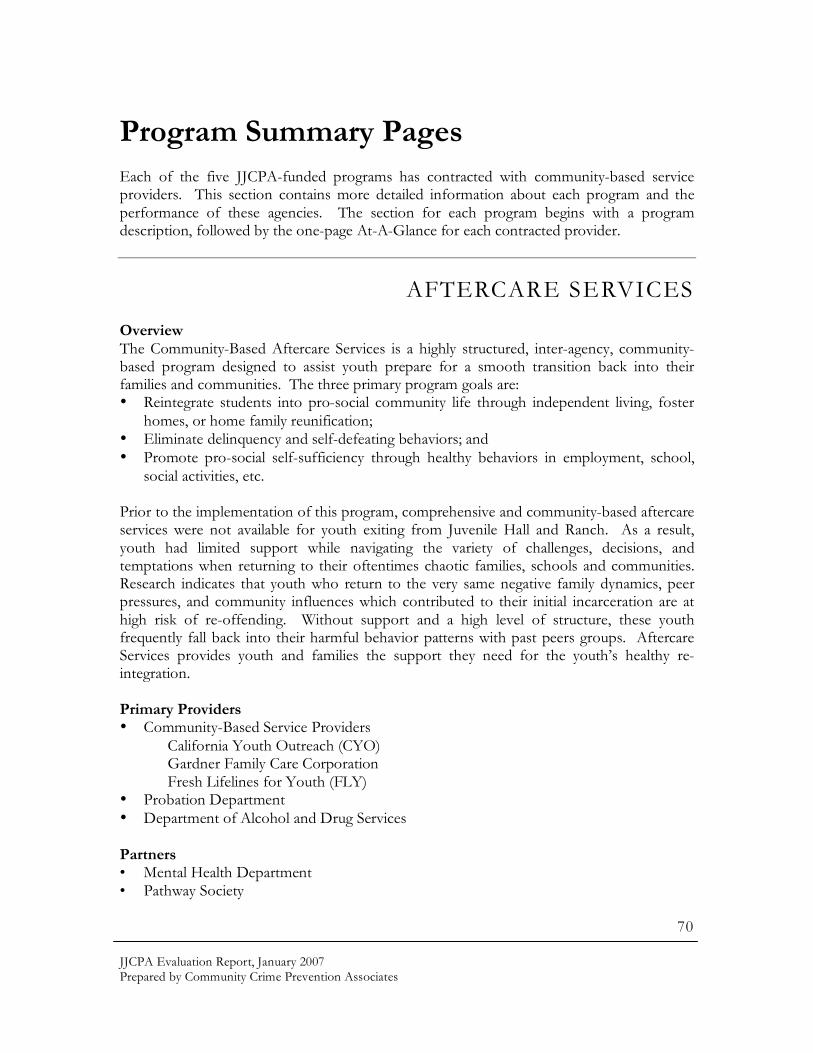
JJCPA Evaluation Report, January 2007 Prepared by Community Crime Prevention Associates
70
Program Summary Pages Each of the five JJCPA-funded programs has contracted with community-based service providers. This section contains more detailed information about each program and the performance of these agencies. The section for each program begins with a program description, followed by the one-page At-A-Glance for each contracted provider.
AFTERCARE SERVICES Overview The Community-Based Aftercare Services is a highly structured, inter-agency, community-based program designed to assist youth prepare for a smooth transition back into their families and communities. The three primary program goals are: • Reintegrate students into pro-social community life through independent living, foster
homes, or home family reunification; • Eliminate delinquency and self-defeating behaviors; and • Promote pro-social self-sufficiency through healthy behaviors in employment, school,
social activities, etc. Prior to the implementation of this program, comprehensive and community-based aftercare services were not available for youth exiting from Juvenile Hall and Ranch. As a result, youth had limited support while navigating the variety of challenges, decisions, and temptations when returning to their oftentimes chaotic families, schools and communities. Research indicates that youth who return to the very same negative family dynamics, peer pressures, and community influences which contributed to their initial incarceration are at high risk of re-offending. Without support and a high level of structure, these youth frequently fall back into their harmful behavior patterns with past peers groups. Aftercare Services provides youth and families the support they need for the youth’s healthy re-integration. Primary Providers • Community-Based Service Providers California Youth Outreach (CYO) Gardner Family Care Corporation Fresh Lifelines for Youth (FLY) • Probation Department • Department of Alcohol and Drug Services Partners • Mental Health Department • Pathway Society

JJCPA Evaluation Report, January 2007 Prepared by Community Crime Prevention Associates
71
Program Approach Since the inception of the Aftercare Program, the program approach has changed at various times for a variety of reasons, including budget cuts, systems issues, and caseload management. This following description applies to FY 2005-06. Program partners set out to reduce the recidivism rate for participating youth and prevent the further penetration of these youth in the criminal justice system. The program approach is rooted in helping youth to: (1) envision a positive future for themselves; (2) create new pro-social values and become involved in community life; (3) discover and develop new life skills and behaviors that will further their goals; (4) disassociate from a delinquent and/or criminal lifestyle; and (5) complete their probationary status without re-offending. The following section describes the four core steps of the Aftercare Services process.
Step 1: Intake/Assessment/ Individual Transition Service Plan (ITSP) The youth assessment and Individual Transition Service Plan (ITSP) are developed three weeks before a youth’s release by the Aftercare Multi-Disciplinary Team (MDT). The MDTs for youth from the Ranch and Juvenile Hall differ depending on the providers but are generally comprised of representatives from California Youth Outreach (CYO), Mental Health Department (MH), Drug and Alcohol Services Department, Pathways, Gardner, Probation Education Counselor, and staff from the facility. The Aftercare Probation Officer schedules the MDT, writes the ITSP, and works closely with CYO to ensure that the plan is implemented during the aftercare period. The Probation Officer also contacts the parents to inform them about the MDT process and to ask for input about what services they believe their child will need when released. Prior to the MDT meeting, each member gathers pertinent information (including any existing assessments) on the youth and his family; conducts any necessary assessments; and meets with the youth and his family as needed. For example, the Probation Education Counselor inquires about the youth’s school status; the CYO Community Aftercare Worker begins to build a relationship with youth; and the MH staff person determines mental health needs in preparation for youth’s release and the aftercare period, including identifying referral sources and making System of Care referrals as needed. At this time, it is determined whether a referral to Gardner is appropriate for dual-diagnosis treatment and/or to FLY for additional programming The intake and assessment process is also conducted in order to determine classification of the youth. The practice was developed by the Steering Committee in order to ensure that youth receive the appropriate level of service. For instance, youth needing more intense services have more frequent contact with his/her Aftercare Worker.

JJCPA Evaluation Report, January 2007 Prepared by Community Crime Prevention Associates
72
The ITSP is developed with clear guidelines and expectations for the youth. It addresses the youth’s: • living arrangement • education plan • employment training/placement • social & extra-curricular activities • guidelines and rules for the home • individual behavioral goals • mental health and/or substance abuse counseling, as needed. • restitution and community service requirements The MDT draws on the youth and family’s strengths and places emphasis on family reunification that includes preserving, strengthening and/or re-establishing family acceptance of the youth. Step 2: Service Delivery Upon release from the facility, the youth enters the Initial Aftercare Period also known as, ‘Pre-Release’, when the youth is still under the authority of the Ranch. (Youth released from Juvenile Hall do not have a ‘Pre-Release’ period.) The youth is most vulnerable and at-risk of regressing to past destructive behaviors during this period, which is the first ten weeks of the program. The Ranch Aftercare Counselor begins primary supervision and meets with the youth once per week in order to ensure contract compliance and implementation of the transition plan. The Aftercare Probation Officer coordinates across MDT partners as it relates to the implementation of transition plan, and maintains primary oversight of the case. While supervision and services from all partners is critical, the Community Aftercare Worker plays an especially important role in continuing to build a caring and trusting relationship with the youth. The core of the youth’s change in mindset and behavior begins with this relationship.
Step 3: Ongoing Client Contract/Case Management: The Aftercare Counselor, Probation Officer, and Community Aftercare Worker share case monitoring and service delivery responsibilities. Together, they work to ensure that services and activities are consistent with the findings articulated in the ITSP. The service plan is updated as needed; the youth classification is modified if the youth is re-arrested. ITSP activities for the first 30 days are especially engaging, intensive and meaningful for the youth. Updates to the ITSP incorporate the youth’s own articulated goals and concerns, in order to obtain his buy-in. The Community Aftercare Worker is also available for on-call support services for urgent matters. The Community Aftercare Worker works closely with the Aftercare Probation Officer to share information about the youth and his/her progress. The youth and his family continue to participate in the Aftercare program for the remaining ten and one-half weeks, the Extended Aftercare period. During this time, supervision provided by the Aftercare Counselor’s (also

JJCPA Evaluation Report, January 2007 Prepared by Community Crime Prevention Associates
73
know as the Ranch Pre-Release Counselor) is reduced as the youth’s Ranch commitment is vacated. Supervision by the Probation Officer increases, as does supervision provided by the CYO Community Aftercare Worker. Step 4: Exit: When the youth has successfully met the goals of the ITSP at the end of the six-month period, the Probation Officer meets with the youth and his/her family. The Probation Officers closes out the ITPS and returns the youth’s case to a general supervision unit, if Probation dismissal is not possible.

JJCPA Evaluation Report, January 2007 Prepared by Community Crime Prevention Associates
74
JJCPA Performance – Logic Model Evaluation System
Aftercare Program, FY 2005-06 Performance-Logic
Model Term Evaluation Questions
Answer to Evaluation Questions
Inputs What was spent on services?
The Aftercare Program expended $602,520 in JJCPA grant funds to deliver services.
Customers Who were the customers?
Served 172 customers. See appendix.
Strategies What service strategies were used?
Middle column shows percent of all units of service delivered in FY 2005-06. Activity FY 05-06 FY 04-05
Outreach & Recruitment 1.0% 0.0%
Intake, Assess. & ISP 1.9% 1.8%
Home/School Visit/Parents 14.3% 17.1%
Case Mgmt., Support, Refer. 25.8% 23.8%
Ind./Family Counsel 17.0% 8.9%
Transportation 4.9% 3.8%
Field Trips & Cmty. Service 1.5% 9.2%
Group Workshops 33.7% 35.3% Output: Units of Service
How much service was provided?
Community-based providers of the Aftercare Program delivered 28,542 units of service. One unit of service equals one hour of direct service per customer.
E F F O R T
Output: Cost per Unit of Service
What was the cost to provide services?
The cost per unit of service for the services delivered by the community-based providers was $21.11.
Performance Measure: Customer Satisfaction
Were customers satisfied with services?
The average customer satisfaction rating (out of 100 possible points) was: � youth-reported = 79.3 � parent-reported = 87.6
E F F E C T
Performance Measure: Productivity Outcomes
Were services effective in producing the desired change?
Productivity scores (range from -100% to +100%) reflect the percent of targeted changes achieved minus the percent of targeted changes missed. Scores are listed by respondent.
FY 05-
06
FY 04-
05
FY 05-
06
FY 04-
05
FY 05-
06
FY 04-
05
Dev. Asset 60.6% 70.6% 72.9% 84.3% 82.5% 80.4%
Program-
Specific 67.8% 69.3% 79.6% 84.5% 83.6% 75.0%
Service
Productivity
Youth-Reported Parent-Reported Staff-Reported

JJCPA Evaluation Report, January 2007 Prepared by Community Crime Prevention Associates
75
JJCPA Performance – Logic Model Evaluation System
Aftercare Program – California Youth Outreach, FY 2005-06 Performance-Logic
Model Term Evaluation Questions
Answer to Evaluation Questions
Inputs What was spent on services?
California Youth Outreach spent $378,436 to deliver services for the Aftercare Program.
Customers Who were the customers?
See appendix.
Strategies What service strategies were used?
Middle column shows percent of all units of service delivered in FY 2005-06. Activity FY 05-06 FY 04-05
Outreach & Recruitment 1.2% 0.0%
Intake, Assess. & ISP 1.3% 1.0%
Home/School Visit/Parents 27.4% 19.0%
Case Mgmt., Support, Refer. 44.0% 33.7%
Ind./Family Counsel 16.0% 10.3%
Transportation 4.8% 3.3%
Field Trips & Cmty. Service 0.0% 12.1%
Group Workshops 5.3% 20.6% Output: Units of Service
How much service was provided?
California Youth Outreach delivered 14,788 units of service. One unit of service equals one hour of direct service per customer.
E F F O R T
Output: Cost per Unit of Service
What was the cost to provide services?
The cost per unit of service for this provider was $25.59.
Performance Measure: Customer Satisfaction
Were customers satisfied with services?
The average customer satisfaction rating (out of 100 possible points) was: � youth-reported = 85.1 � parent-reported = 86.4
E F F E C T
Performance Measure: Productivity Outcomes
Were services effective in producing the desired change?
Productivity scores (scale from -100% to +100%) reflect the percent of targeted changes achieved minus the percent of targeted changes missed. Developmental asset and program-specific targeted changes are listed by respondent.
FY 05-
06
FY 04-
05
FY 05-
06
FY 04-
05
FY 05-
06
FY 04-
05
Dev. Asset 64.6% 83.5% 73.7% 84.2% 88.1% 80.3%
Program-
Specific 80.9% 75.3% 82.0% 84.8% 76.7% 71.9%
Youth-
Reported
Parent-
ReportedStaff-Reported
Service
Productivity

JJCPA Evaluation Report, January 2007 Prepared by Community Crime Prevention Associates
76
JJCPA Performance – Logic Model Evaluation System
Aftercare Program – Fresh Lifelines for Youth, FY 2005-06 Performance-Logic
Model Term Evaluation Questions
Answer to Evaluation Questions
Inputs What was spent on services?
Fresh Lifelines for Youth spent $38,000 to deliver services for the Aftercare Program.
Customers Who were the customers?
See appendix.
Strategies What service strategies were used?
Middle column shows percent of all units of service delivered in FY 2005-06. Activity FY 05-06 FY 04-05
Outreach & Recruitment 4.1% 0.2%
Intake, Assess. & ISP 6.5% 6.9%
Home/School Visit/Parents 1.1% 1.6%
Case Mgmt., Support, Refer. 11.3% 14.2%
Ind./Family Counsel 0.0% 0.0%
Transportation 28.5% 25.5%
Field Trips & Cmty. Service 11.0% 3.8%
Group Workshops 37.4% 47.9% Output: Units of Service
How much service was provided?
Fresh Lifelines for Youth delivered 2,414 units of service. One unit of service equals one hour of direct service per customer.
E F F O R T
Output: Cost per Unit of Service
What was the cost to provide services?
The cost per unit of service for this provider was $15.74.
Performance Measure: Customer Satisfaction
Were customers satisfied with services?
The average customer satisfaction rating (out of 100 possible points) was: � youth-reported = 82.8 � parent-reported = 94.9
E F F E C T
Performance Measure: Productivity Outcomes
Were services effective in producing the desired change?
Productivity scores (scale from -100% to +100%) reflect the percent of targeted changes achieved minus the percent of targeted changes missed. Developmental asset and program-specific targeted changes are listed by respondent.
FY 05-
06
FY 04-
05
FY 05-
06
FY 04-
05
FY 05-
06
FY 04-
05
Dev. Asset 70.9% 72.3% 68.1% 85.0% 87.5% 80.7%
Program-
Specific 79.9% 85.3% 88.2% 78.5% 100.0% 89.9%
Service
Productivity
Youth-
Reported
Parent-
ReportedStaff-Reported

JJCPA Evaluation Report, January 2007 Prepared by Community Crime Prevention Associates
77
JJCPA Performance – Logic Model Evaluation System
Aftercare Program – Gardner, FY 2005-06 Performance-Logic
Model Term Evaluation Questions
Answer to Evaluation Questions
Inputs What was spent on services?
Gardner spent $186,084 to deliver services for the Aftercare Program.
Customers Who were the customers?
See appendix.
Strategies What service strategies were used?
Middle column shows percent of all units of service delivered in FY 2005-06. Activity FY 05-06 FY 04-05
Outreach & Recruitment 0.0% 0.0%
Intake, Assess. & ISP 1.6% 2.6%
Home/School Visit/Parents 0.0% 16.2%
Case Mgmt., Support, Refer. 5.1% 1.3%
Ind./Family Counsel 22.0% 7.6%
Transportation 0.0% 0.0%
Field Trips & Cmty. Service 1.5% 3.2%
Group Workshops 69.9% 69.1%
Output: Units of Service
How much service was provided?
Gardner delivered 11,340 units of service. One unit of service equals one hour of direct service per customer.
E F F O R T
Output: Cost per Unit of Service
What was the cost to provide services?
The cost per unit of service for this provider was $16.41.
Performance Measure: Customer Satisfaction
Were customers satisfied with services?
The average customer satisfaction rating (out of 100 possible points) was: � youth-reported = 62.1 � parent-reported = 93.1
E F F E C T
Performance Measure: Productivity Outcomes
Were services effective in producing the desired change?
Productivity scores (scale from -100% to +100%) reflect the percent of targeted changes achieved minus the percent of targeted changes missed. Developmental asset and program-specific targeted changes are listed by respondent.
FY 05-
06
FY 04-
05
FY 05-
06
FY 04-
05
FY 05-
06
FY 04-
05
Dev. Asset 31.8% 41.9% 81.0% 84.7% NDA 78.0%
Program-
Specific 41.9% 50.2% 66.7% 82.0% NDA 83.7%
Service
Productivity
Youth-
Reported
Parent-
ReportedStaff-Reported
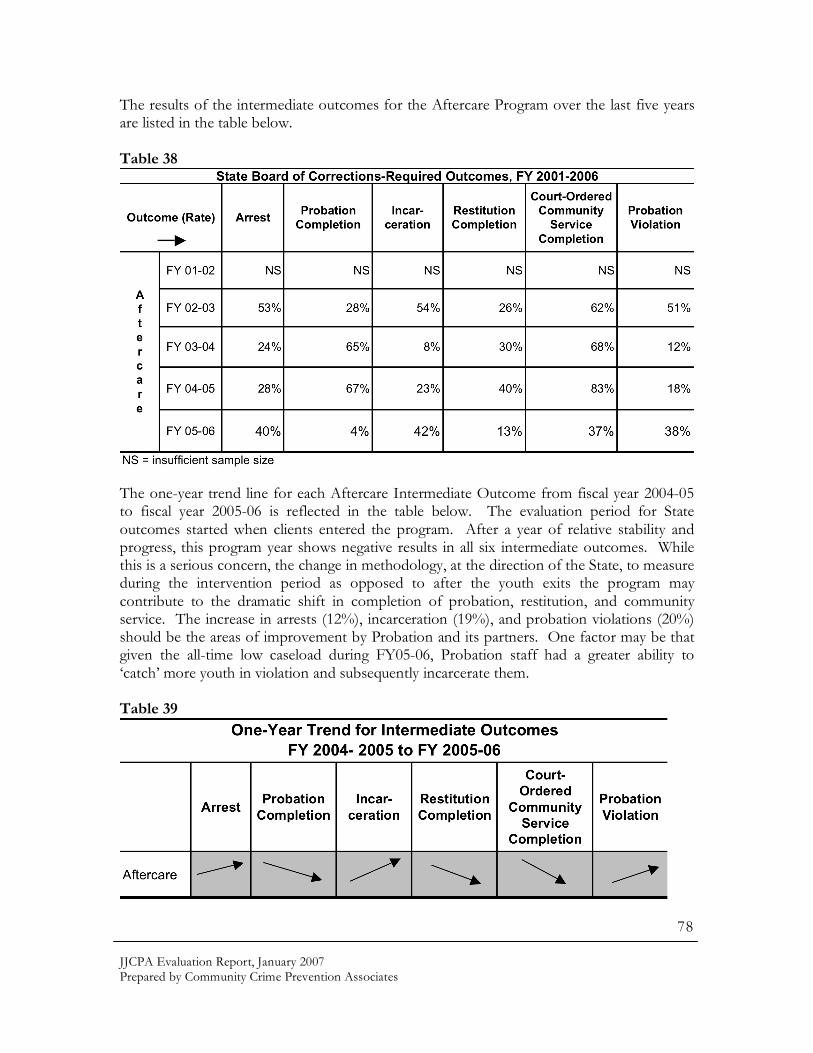
JJCPA Evaluation Report, January 2007 Prepared by Community Crime Prevention Associates
78
The results of the intermediate outcomes for the Aftercare Program over the last five years are listed in the table below. Table 38
The one-year trend line for each Aftercare Intermediate Outcome from fiscal year 2004-05 to fiscal year 2005-06 is reflected in the table below. The evaluation period for State outcomes started when clients entered the program. After a year of relative stability and progress, this program year shows negative results in all six intermediate outcomes. While this is a serious concern, the change in methodology, at the direction of the State, to measure during the intervention period as opposed to after the youth exits the program may contribute to the dramatic shift in completion of probation, restitution, and community service. The increase in arrests (12%), incarceration (19%), and probation violations (20%) should be the areas of improvement by Probation and its partners. One factor may be that given the all-time low caseload during FY05-06, Probation staff had a greater ability to ‘catch’ more youth in violation and subsequently incarcerate them. Table 39
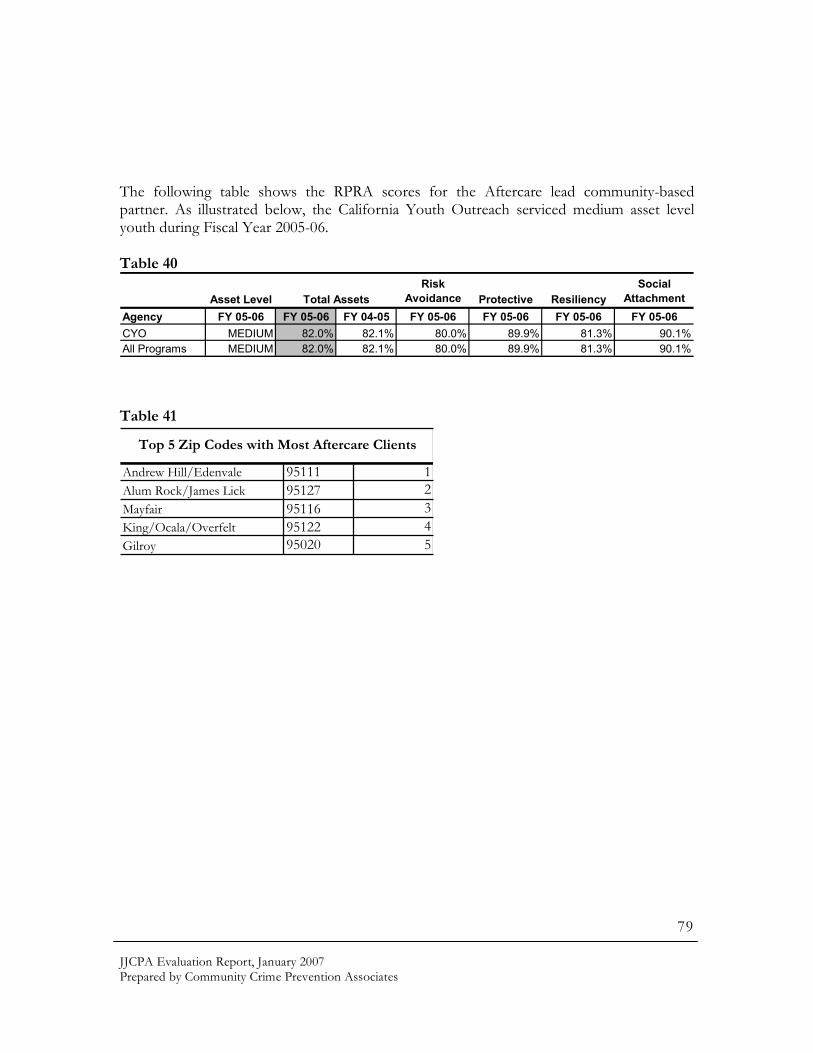
JJCPA Evaluation Report, January 2007 Prepared by Community Crime Prevention Associates
79
The following table shows the RPRA scores for the Aftercare lead community-based partner. As illustrated below, the California Youth Outreach serviced medium asset level youth during Fiscal Year 2005-06. Table 40
Asset Level
Risk
Avoidance Protective Resiliency
Social
Attachment
Agency FY 05-06 FY 05-06 FY 04-05 FY 05-06 FY 05-06 FY 05-06 FY 05-06
CYO MEDIUM 82.0% 82.1% 80.0% 89.9% 81.3% 90.1%
All Programs MEDIUM 82.0% 82.1% 80.0% 89.9% 81.3% 90.1%
Total Assets
Table 41
Andrew Hill/Edenvale 95111 1
Alum Rock/James Lick 95127 2
Mayfair 95116 3
King/Ocala/Overfelt 95122 4
Gilroy 95020 5
Top 5 Zip Codes with Most Aftercare Clients

JJCPA Evaluation Report, January 2007 Prepared by Community Crime Prevention Associates
80
Program Summary Pages
MULTI-AGENCY ASSESSMENT CENTER Overview The Multi-Agency Assessment Center provides comprehensive assessments for youth admitted and detained in Juvenile Hall for longer than 72 hours. Youth receive mental health, educational, and medical screening assessments. The assessment information is used to develop an individual case plans for each youth. The assessment results help to inform the integrated case management process and assist staff in identifying the appropriate support services for youth while in custody. The assessment center process also helps to prevent ‘over-programming’ of youth. In addition to using assessment results to inform in-custody needs for youth, the results are used to link the youth and his family to appropriate community-based services upon release from Juvenile Hall. Contracted community-based organizations provide these services when the youth returns to his family and community. Lastly, the assessment-based individual case plans provide valuable information for those youth who transition to the Aftercare Services program. Primary Partners • Probation Department • Community-Based Service Providers: Asian American Recovery Services Asians for Community Involvement California Youth Outreach Fresh Lifelines for Youth
Friends Outside Gardner Family Care Mexican American Community Services Agency
• County Office of Education • Mental Health Department
Program Approach Youth who are to be detained for longer than 72 hours are referred to the Assessment Center for a mental health assessment and risk/classification assessment that occur during the intake procedure. Educational testing takes place within the first 72 hours of a youth’s admission, as is the Valley Medical Center (VMC) medical clinic screening. Drug and alcohol-related testing takes places within the first week.

JJCPA Evaluation Report, January 2007 Prepared by Community Crime Prevention Associates
81
Based on the results of the various assessments, an individual case plan is developed for each youth. While the Probation Department oversees the development of the case plan, each agency gives input based on the testing results. Following the battery of assessments and the development of the individual case plan, the youth receives in-custody services. Each community-based provider is assigned a unit except for Friends Outside, which only provides one-on-one counseling due to the closure of a living unit. All other agencies are contracted to perform group workshops and one-on-one counseling. Group workshop services include substance abuse/relapse prevention, life skills development, conflict resolution, anti-criminal thinking patterns, gang intervention, parenting/family skills, and family/domestic violence education, and character building. Assessment Center staff monitor the youth’s progress and make adjustments to the case plan as needed. The following table provides a guide to the housing units and classification of youth.
Table 42
Provider Unit Classification/Population of Housing Units
AACI B5 General Population 12-14 year old males FLY B12 General Population 14-16 year old males MACSA B2 General Population 16-18 year old males FLY B6 General Population- Male Honors Unit CYO G1 General Population - Female CYO B7 General Population - Female Honors Unit GARDNER G2 Placement/Mental Health Unit - Male CYO B9 High Security Unit - Male MACSA B8 High Security Unit - Male AARS B10 Commitment Unit - Male FRIENDS OUTSIDE One-on-one counseling by referral for all units

JJCPA Evaluation Report, January 2007 Prepared by Community Crime Prevention Associates
82
JJCPA Performance – Logic Model Evaluation System
Multi-Agency Assessment Center, FY 2005-06 Performance-Logic
Model Term Evaluation Questions
Answer to Evaluation Questions
Inputs What was spent on services?
The Multi-Agency Assessment Center expended $181,091 in JJCPA grant funds to deliver services.
Customers Who were the customers?
Served 1,007 customers. See appendix.
Strategies What service strategies were used?
Middle column shows percent of all units of service delivered in FY 2005-06. Activity FY 05-06 FY 04-05
Outreach & Recruitment 0.0% 0.0%
Intake, Assess. & ISP 0.0% 0.0%
Home/School Visit/Parents 0.0% 0.2%
Case Mgmt., Support, Refer. 0.0% 1.7%
Ind./Family Counsel 7.3% 5.0%
Transportation 0.0% 0.0%
Field Trips & Cmty. Service 0.0% 0.0%
Group Workshops 92.7% 93.2% Output: Units of Service
How much service was provided?
Community-based providers of the Multi-Agency Assessment Center delivered 16,735 units of service. One unit of service equals one hour of direct service per customer.
E F F O R T
Output: Cost per Unit of Service
What was the cost to provide services?
The cost per unit of service for services delivered by the community-based providers was $10.82.
Performance Measure: Customer Satisfaction
Were customers satisfied with services?
The average customer satisfaction rating (out of 100 possible points) was: � youth-reported = 79.1 � parent-reported = NA
E F F E C T
Performance Measure: Productivity Outcomes
Were services effective in producing the desired change?
Productivity scores (scale from -100% to +100%) reflect the percent of targeted changes achieved minus the percent of targeted changes missed. Scores are listed by respondent.
FY 05-
06
FY 04-
05
FY 05-
06
FY 04-
05
FY 05-
06
FY 04-
05
Dev. Asset NA NA NA NA NA NA
Program-
Specific 57.0% 63.8% NA NA 70.4% 53.3%
Youth-
Reported
Parent-
ReportedStaff-Reported
Service
Productivity
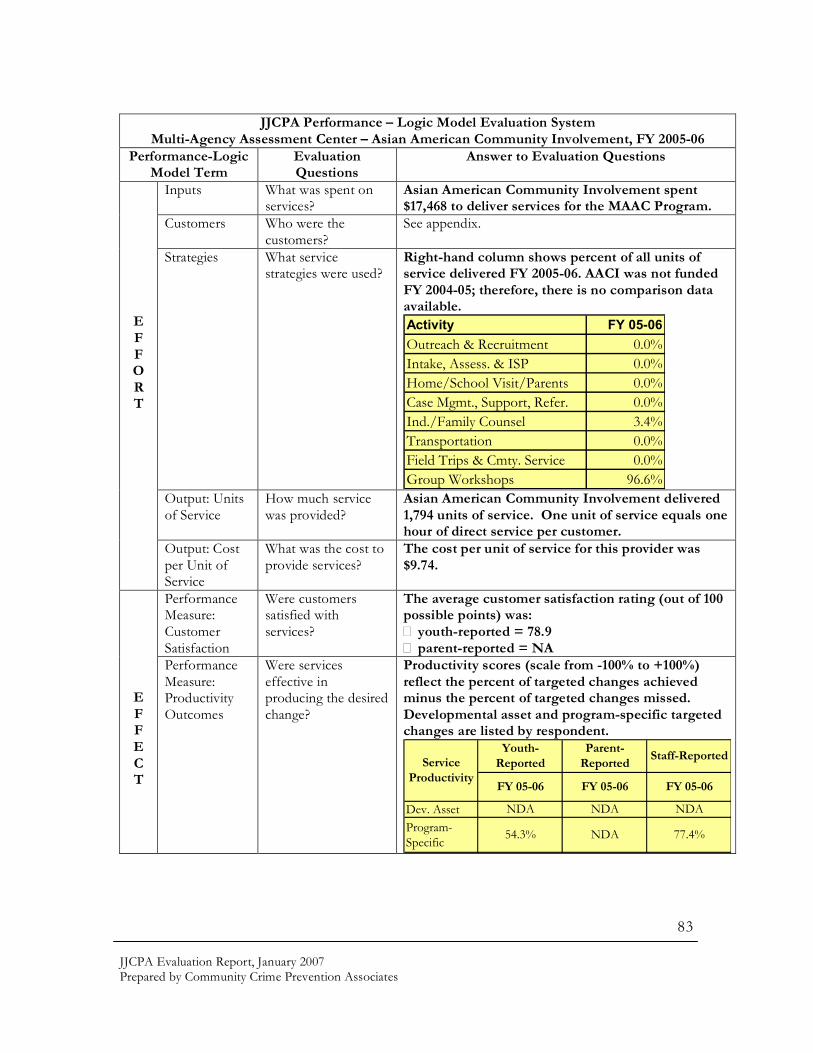
JJCPA Evaluation Report, January 2007 Prepared by Community Crime Prevention Associates
83
JJCPA Performance – Logic Model Evaluation System
Multi-Agency Assessment Center – Asian American Community Involvement, FY 2005-06 Performance-Logic
Model Term Evaluation Questions
Answer to Evaluation Questions
Inputs What was spent on services?
Asian American Community Involvement spent $17,468 to deliver services for the MAAC Program.
Customers Who were the customers?
See appendix.
Strategies What service strategies were used?
Right-hand column shows percent of all units of service delivered FY 2005-06. AACI was not funded FY 2004-05; therefore, there is no comparison data available. Activity FY 05-06
Outreach & Recruitment 0.0%
Intake, Assess. & ISP 0.0%
Home/School Visit/Parents 0.0%
Case Mgmt., Support, Refer. 0.0%
Ind./Family Counsel 3.4%
Transportation 0.0%
Field Trips & Cmty. Service 0.0%
Group Workshops 96.6% Output: Units of Service
How much service was provided?
Asian American Community Involvement delivered 1,794 units of service. One unit of service equals one hour of direct service per customer.
E F F O R T
Output: Cost per Unit of Service
What was the cost to provide services?
The cost per unit of service for this provider was $9.74.
Performance Measure: Customer Satisfaction
Were customers satisfied with services?
The average customer satisfaction rating (out of 100 possible points) was: � youth-reported = 78.9 � parent-reported = NA
E F F E C T
Performance Measure: Productivity Outcomes
Were services effective in producing the desired change?
Productivity scores (scale from -100% to +100%) reflect the percent of targeted changes achieved minus the percent of targeted changes missed. Developmental asset and program-specific targeted changes are listed by respondent.
Dev. Asset
Program-
Specific
NDA
54.3% NDA 77.4%
FY 05-06 FY 05-06
NDA NDA
Service
Productivity
Youth-
Reported
Parent-
ReportedStaff-Reported
FY 05-06
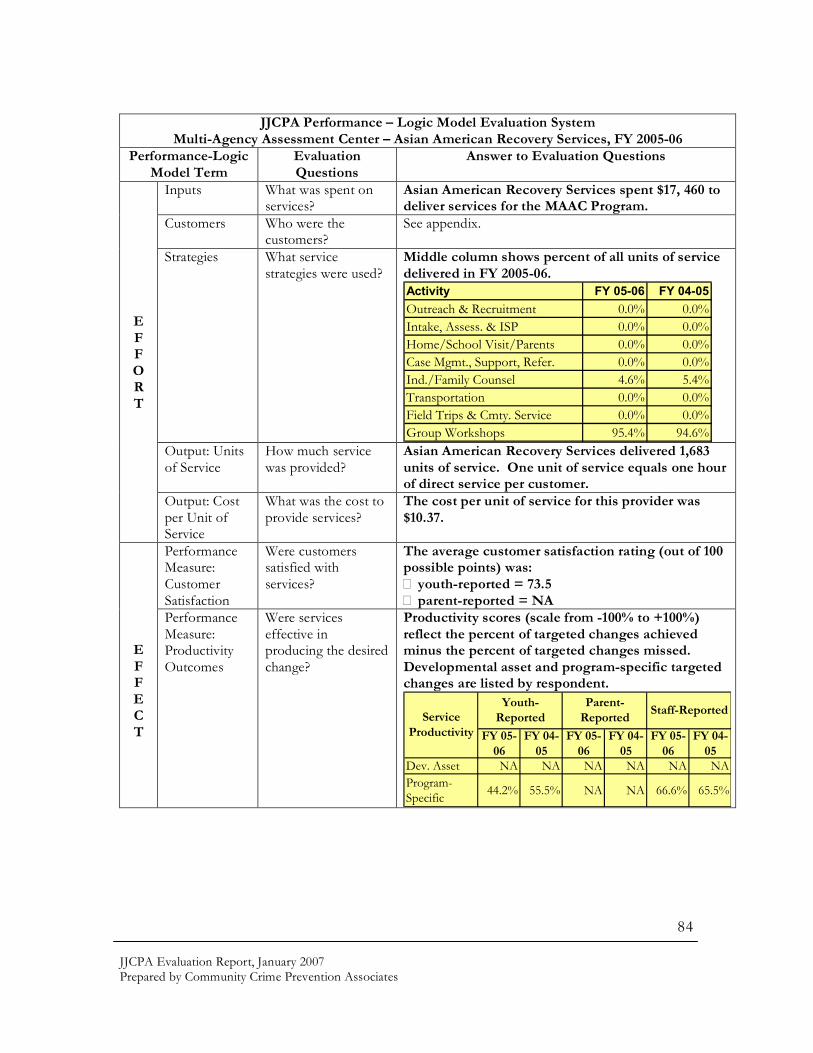
JJCPA Evaluation Report, January 2007 Prepared by Community Crime Prevention Associates
84
JJCPA Performance – Logic Model Evaluation System
Multi-Agency Assessment Center – Asian American Recovery Services, FY 2005-06 Performance-Logic
Model Term Evaluation Questions
Answer to Evaluation Questions
Inputs What was spent on services?
Asian American Recovery Services spent $17, 460 to deliver services for the MAAC Program.
Customers Who were the customers?
See appendix.
Strategies What service strategies were used?
Middle column shows percent of all units of service delivered in FY 2005-06. Activity FY 05-06 FY 04-05
Outreach & Recruitment 0.0% 0.0%
Intake, Assess. & ISP 0.0% 0.0%
Home/School Visit/Parents 0.0% 0.0%
Case Mgmt., Support, Refer. 0.0% 0.0%
Ind./Family Counsel 4.6% 5.4%
Transportation 0.0% 0.0%
Field Trips & Cmty. Service 0.0% 0.0%
Group Workshops 95.4% 94.6% Output: Units of Service
How much service was provided?
Asian American Recovery Services delivered 1,683 units of service. One unit of service equals one hour of direct service per customer.
E F F O R T
Output: Cost per Unit of Service
What was the cost to provide services?
The cost per unit of service for this provider was $10.37.
Performance Measure: Customer Satisfaction
Were customers satisfied with services?
The average customer satisfaction rating (out of 100 possible points) was: � youth-reported = 73.5 � parent-reported = NA
E F F E C T
Performance Measure: Productivity Outcomes
Were services effective in producing the desired change?
Productivity scores (scale from -100% to +100%) reflect the percent of targeted changes achieved minus the percent of targeted changes missed. Developmental asset and program-specific targeted changes are listed by respondent.
FY 05-
06
FY 04-
05
FY 05-
06
FY 04-
05
FY 05-
06
FY 04-
05
Dev. Asset NA NA NA NA NA NA
Program-
Specific 44.2% 55.5% NA NA 66.6% 65.5%
Service
Productivity
Youth-
Reported
Parent-
ReportedStaff-Reported

JJCPA Evaluation Report, January 2007 Prepared by Community Crime Prevention Associates
85
JJCPA Performance – Logic Model Evaluation System
Multi-Agency Assessment Center – California Youth Outreach, FY 2005-06 Performance-Logic
Model Term Evaluation Questions
Answer to Evaluation Questions
Inputs What was spent on services?
California Youth Outreach spent $52,213 to deliver services for the MAAC Program.
Customers Who were the customers?
See appendix.
Strategies What service strategies were used?
Middle column shows percent of all units of service delivered in FY 2005-06. Activity FY 05-06 FY 04-05
Outreach & Recruitment 0.0% 0.0%
Intake, Assess. & ISP 0.0% 0.0%
Home/School Visit/Parents 0.0% 0.0%
Case Mgmt., Support, Refer. 0.0% 0.0%
Ind./Family Counsel 3.5% 6.1%
Transportation 0.0% 0.0%
Field Trips & Cmty. Service 0.0% 0.0%
Group Workshops 96.5% 93.9% Output: Units of Service
How much service was provided?
California Youth Outreach delivered 5,931 units of service. One unit of service equals one hour of direct service per customer.
E F F O R T
Output: Cost per Unit of Service
What was the cost to provide services?
The cost per unit of service for this provider was $8.80.
Performance Measure: Customer Satisfaction
Were customers satisfied with services?
The average customer satisfaction rating (out of 100 possible points) was: � youth-reported = 80.3 � parent-reported = NA
E F F E C T
Performance Measure: Productivity Outcomes
Were services effective in producing the desired change?
Productivity scores (scale from -100% to +100%) reflect the percent of targeted changes achieved minus the percent of targeted changes missed. Developmental asset and program-specific targeted changes are listed by respondent.
FY 05-
06
FY 04-
05
FY 05-
06
FY 04-
05
FY 05-
06
FY 04-
05
Dev. Asset NA NA NA NA NA NA
Program-
Specific 61.2% 79.8% NA NA 63.8% 61.2%
Service
Productivity
Youth-
Reported
Parent-
ReportedStaff-Reported
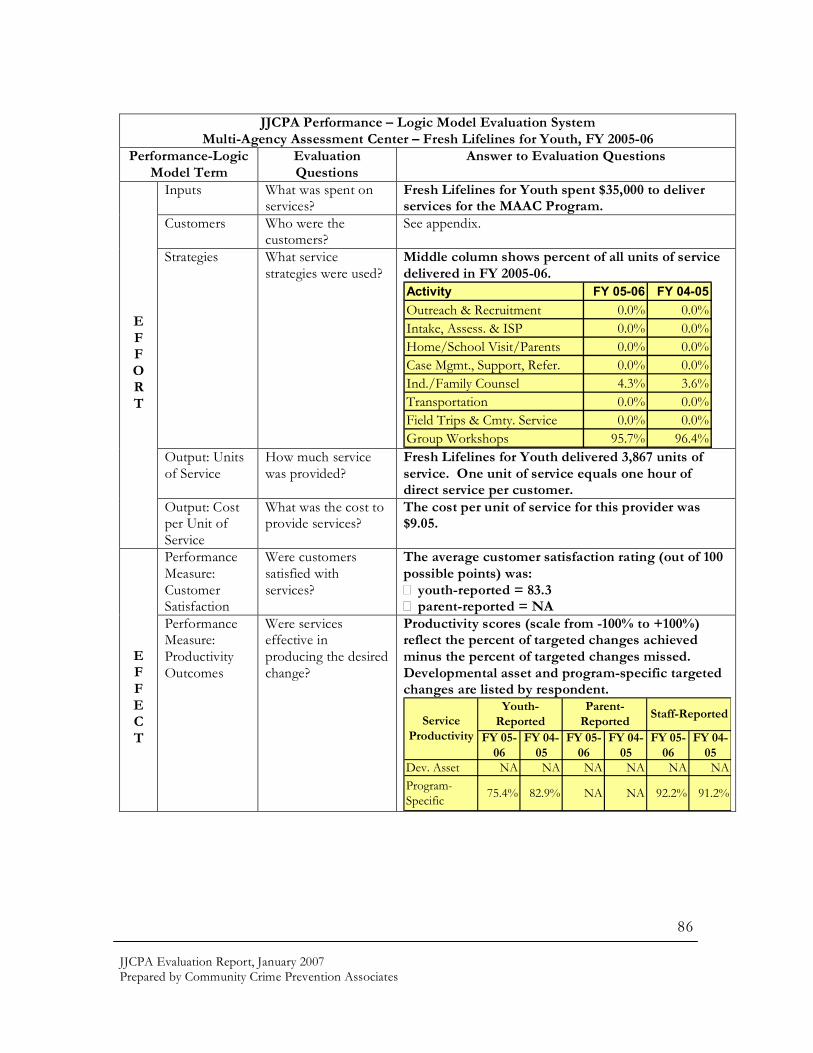
JJCPA Evaluation Report, January 2007 Prepared by Community Crime Prevention Associates
86
JJCPA Performance – Logic Model Evaluation System
Multi-Agency Assessment Center – Fresh Lifelines for Youth, FY 2005-06 Performance-Logic
Model Term Evaluation Questions
Answer to Evaluation Questions
Inputs What was spent on services?
Fresh Lifelines for Youth spent $35,000 to deliver services for the MAAC Program.
Customers Who were the customers?
See appendix.
Strategies What service strategies were used?
Middle column shows percent of all units of service delivered in FY 2005-06. Activity FY 05-06 FY 04-05
Outreach & Recruitment 0.0% 0.0%
Intake, Assess. & ISP 0.0% 0.0%
Home/School Visit/Parents 0.0% 0.0%
Case Mgmt., Support, Refer. 0.0% 0.0%
Ind./Family Counsel 4.3% 3.6%
Transportation 0.0% 0.0%
Field Trips & Cmty. Service 0.0% 0.0%
Group Workshops 95.7% 96.4% Output: Units of Service
How much service was provided?
Fresh Lifelines for Youth delivered 3,867 units of service. One unit of service equals one hour of direct service per customer.
E F F O R T
Output: Cost per Unit of Service
What was the cost to provide services?
The cost per unit of service for this provider was $9.05.
Performance Measure: Customer Satisfaction
Were customers satisfied with services?
The average customer satisfaction rating (out of 100 possible points) was: � youth-reported = 83.3 � parent-reported = NA
E F F E C T
Performance Measure: Productivity Outcomes
Were services effective in producing the desired change?
Productivity scores (scale from -100% to +100%) reflect the percent of targeted changes achieved minus the percent of targeted changes missed. Developmental asset and program-specific targeted changes are listed by respondent.
FY 05-
06
FY 04-
05
FY 05-
06
FY 04-
05
FY 05-
06
FY 04-
05
Dev. Asset NA NA NA NA NA NA
Program-
Specific 75.4% 82.9% NA NA 92.2% 91.2%
Service
Productivity
Youth-
Reported
Parent-
ReportedStaff-Reported
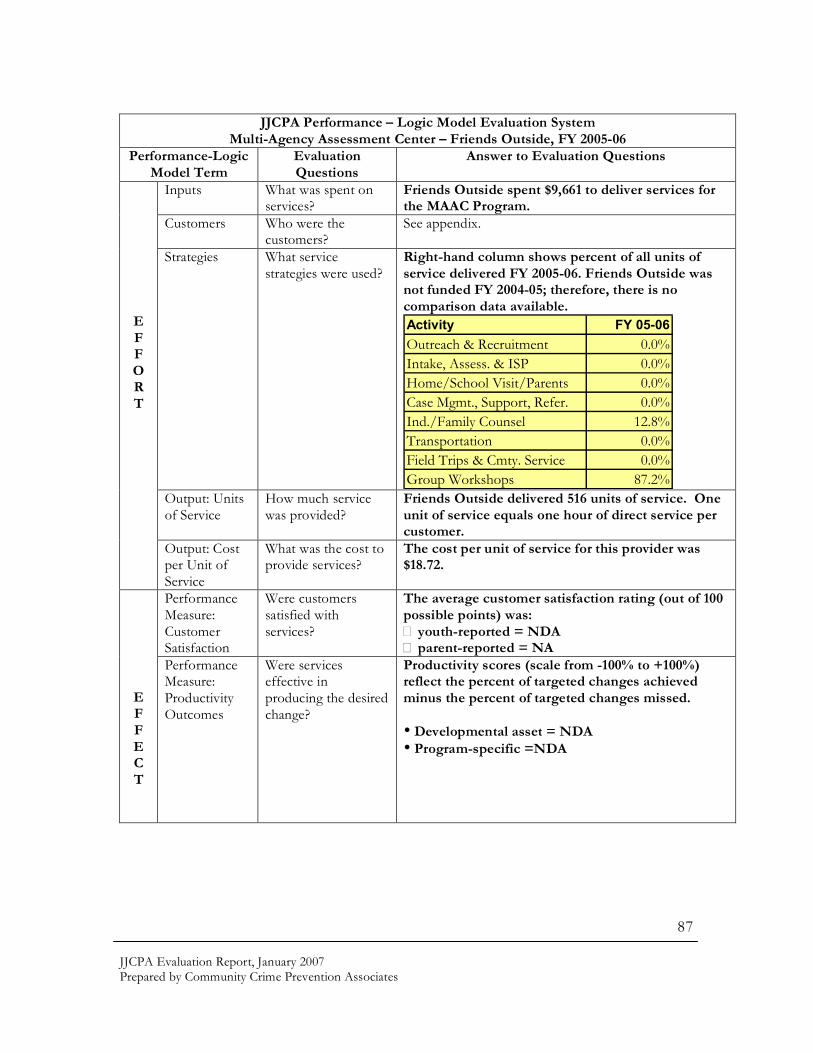
JJCPA Evaluation Report, January 2007 Prepared by Community Crime Prevention Associates
87
JJCPA Performance – Logic Model Evaluation System
Multi-Agency Assessment Center – Friends Outside, FY 2005-06 Performance-Logic
Model Term Evaluation Questions
Answer to Evaluation Questions
Inputs What was spent on services?
Friends Outside spent $9,661 to deliver services for the MAAC Program.
Customers Who were the customers?
See appendix.
Strategies What service strategies were used?
Right-hand column shows percent of all units of service delivered FY 2005-06. Friends Outside was not funded FY 2004-05; therefore, there is no comparison data available. Activity FY 05-06
Outreach & Recruitment 0.0%
Intake, Assess. & ISP 0.0%
Home/School Visit/Parents 0.0%
Case Mgmt., Support, Refer. 0.0%
Ind./Family Counsel 12.8%
Transportation 0.0%
Field Trips & Cmty. Service 0.0%
Group Workshops 87.2% Output: Units of Service
How much service was provided?
Friends Outside delivered 516 units of service. One unit of service equals one hour of direct service per customer.
E F F O R T
Output: Cost per Unit of Service
What was the cost to provide services?
The cost per unit of service for this provider was $18.72.
Performance Measure: Customer Satisfaction
Were customers satisfied with services?
The average customer satisfaction rating (out of 100 possible points) was: � youth-reported = NDA � parent-reported = NA
E F F E C T
Performance Measure: Productivity Outcomes
Were services effective in producing the desired change?
Productivity scores (scale from -100% to +100%) reflect the percent of targeted changes achieved minus the percent of targeted changes missed. • Developmental asset = NDA • Program-specific =NDA
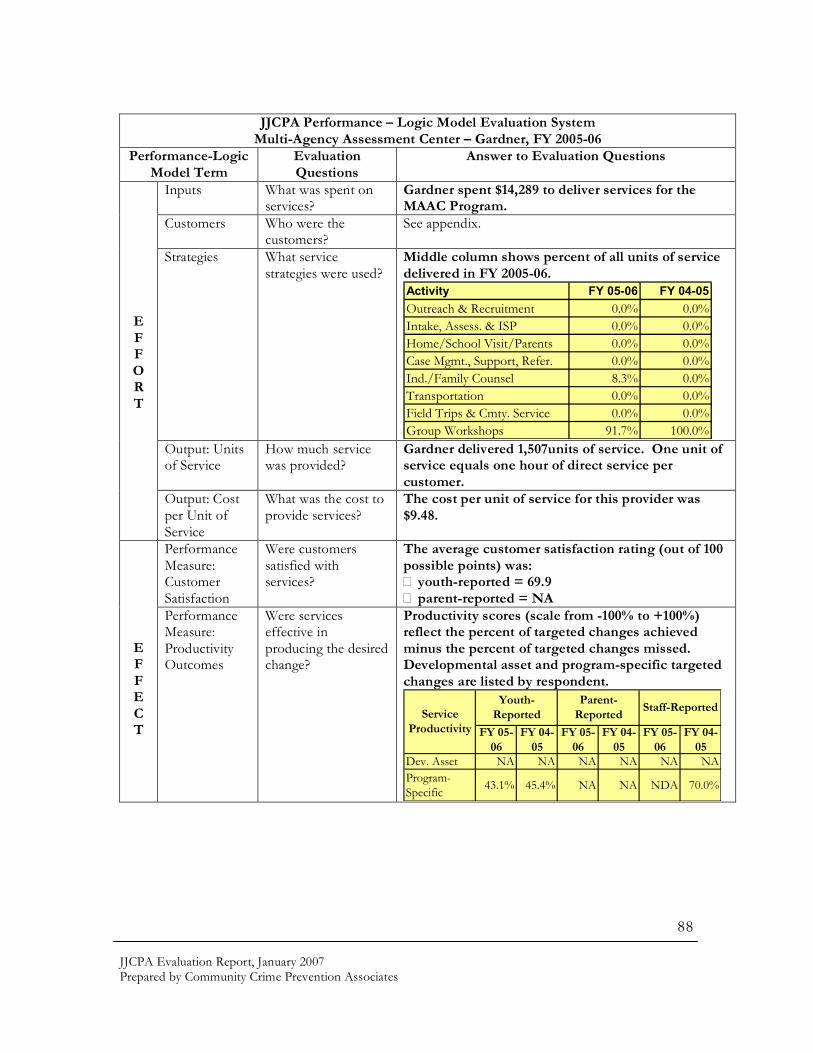
JJCPA Evaluation Report, January 2007 Prepared by Community Crime Prevention Associates
88
JJCPA Performance – Logic Model Evaluation System
Multi-Agency Assessment Center – Gardner, FY 2005-06 Performance-Logic
Model Term Evaluation Questions
Answer to Evaluation Questions
Inputs What was spent on services?
Gardner spent $14,289 to deliver services for the MAAC Program.
Customers Who were the customers?
See appendix.
Strategies What service strategies were used?
Middle column shows percent of all units of service delivered in FY 2005-06. Activity FY 05-06 FY 04-05
Outreach & Recruitment 0.0% 0.0%
Intake, Assess. & ISP 0.0% 0.0%
Home/School Visit/Parents 0.0% 0.0%
Case Mgmt., Support, Refer. 0.0% 0.0%
Ind./Family Counsel 8.3% 0.0%
Transportation 0.0% 0.0%
Field Trips & Cmty. Service 0.0% 0.0%
Group Workshops 91.7% 100.0% Output: Units of Service
How much service was provided?
Gardner delivered 1,507units of service. One unit of service equals one hour of direct service per customer.
E F F O R T
Output: Cost per Unit of Service
What was the cost to provide services?
The cost per unit of service for this provider was $9.48.
Performance Measure: Customer Satisfaction
Were customers satisfied with services?
The average customer satisfaction rating (out of 100 possible points) was: � youth-reported = 69.9 � parent-reported = NA
E F F E C T
Performance Measure: Productivity Outcomes
Were services effective in producing the desired change?
Productivity scores (scale from -100% to +100%) reflect the percent of targeted changes achieved minus the percent of targeted changes missed. Developmental asset and program-specific targeted changes are listed by respondent.
FY 05-
06
FY 04-
05
FY 05-
06
FY 04-
05
FY 05-
06
FY 04-
05
Dev. Asset NA NA NA NA NA NA
Program-
Specific 43.1% 45.4% NA NA NDA 70.0%
Service
Productivity
Youth-
Reported
Parent-
ReportedStaff-Reported

JJCPA Evaluation Report, January 2007 Prepared by Community Crime Prevention Associates
89
JJCPA Performance – Logic Model Evaluation System
Multi-Agency Assessment Center – MACSA, FY 2005-06 Performance-Logic
Model Term Evaluation Questions
Answer to Evaluation Questions
Inputs What was spent on services?
MACSA spent $35,000 to deliver services for the MAAC Program.
Customers Who were the customers?
See appendix.
Strategies What service strategies were used?
Middle column shows percent of all units of service delivered in FY 2005-06. Activity FY 05-06 FY 04-05
Outreach & Recruitment 0.0% 0.0%
Intake, Assess. & ISP 0.0% 0.0%
Home/School Visit/Parents 0.0% 1.1%
Case Mgmt., Support, Refer. 0.0% 11.0%
Ind./Family Counsel 36.5% 8.0%
Transportation 0.0% 0.0%
Field Trips & Cmty. Service 0.0% 0.0%
Group Workshops 63.5% 79.9% Output: Units of Service
How much service was provided?
MACSA delivered 1,437 units of service. One unit of service equals one hour of direct service per customer.
E F F O R T
Output: Cost per Unit of Service
What was the cost to provide services?
The cost per unit of service for this provider was $24.36.
Performance Measure: Customer Satisfaction
Were customers satisfied with services?
The average customer satisfaction rating (out of 100 possible points) was: � youth-reported = 92.8 � parent-reported = NA
E F F E C T
Performance Measure: Productivity Outcomes
Were services effective in producing the desired change?
Productivity scores (scale from -100% to +100%) reflect the percent of targeted changes achieved minus the percent of targeted changes missed. Developmental asset and program-specific targeted changes are listed by respondent.
FY 05-
06
FY 04-
05
FY 05-
06
FY 04-
05
FY 05-
06
FY 04-
05
Dev. Asset NA NA NA NA NA NA
Program-
Specific 72.2% 78.8% NA NA 77.8% 42.5%
Service
Productivity
Youth-
Reported
Parent-
ReportedStaff-Reported

JJCPA Evaluation Report, January 2007 Prepared by Community Crime Prevention Associates
90
The results of the intermediate outcomes for the Assessment Center over the last five years are listed in the table below. Table 43
The trend for each Assessment Center Intermediate Outcome from fiscal year 2004-05 to fiscal year 2005-06 is reflected in the table below. The evaluation period for State outcomes started when clients exited the program. Four of the six intermediate outcomes are headed in the wrong direction from the previous year. Violations of probation remained steady with roughly 1 out of every 5 youth violating the terms of their probation. JDR data from this same period indicates a 12%VOP rate, which needs to be reconciled with the State methodology. Table 44

JJCPA Evaluation Report, January 2007 Prepared by Community Crime Prevention Associates
91
The following table shows the RPRA scores for each Assessment Center community-based partner. As illustrated below, the Asian American Recovery Services serviced the lowest asset level youth, followed by MACSA. Table 45
Asset Level
Risk
Avoidance Protective Resiliency
Social
Attachment
Agency FY 05-06 FY 05-06 FY 04-05 FY 05-06 FY 05-06 FY 05-06 FY 05-06
AACI MEDIUM 83.4% 76.7% 89.9% 81.5% 78.5%
AARS LOW 74.4% 77.9% 70.3% 78.8% 72.4% 77.9%
CYO LOW 80.3% 86.0% 74.3% 85.8% 79.0% 79.6%
FLY MEDIUM 81.8% 77.0% 74.8% 88.2% 80.6% 86.3%
FO NDA NDA NDA NDA NDA NDA
Gardner NDA NDA NDA NDA NDA NDA
MACSA LOW 76.8% 80.5% 70.7% 81.7% 76.2% 78.8%
All Programs LOW 78.5% 80.0% 72.6% 83.7% 77.3% 79.4%
Total Assets
Table 46
Gilroy 95020 1Andrew Hill/Edenvale 95111 2Mayfair 95116 3King/Ocala/Overfelt 95122 4Alum Rock/James Lick 95127 5
Top 5 Zip Codes with Most MAAC Clients

JJCPA Evaluation Report, January 2007 Prepared by Community Crime Prevention Associates
92
Program Summary Pages
MACSA INTENSIVE CASE MANAGEMENT Overview JJCPA funds have enabled MACSA to expand, strengthen and continue existing programs. The Male Involvement Program (MIP) is a teen pregnancy prevention program, focused on male responsibility, providing traditional rites of passage for adolescent males, youth leadership, and promoting fatherhood involvement. The MIP provides presentations; support groups (Circulos), multi-session workshops and staff trainings on how to work with at-risk Latino males and Fathers. This program is intended to teach youth between the ages of 14-25 the skills necessary to make wise and responsible decision. The Ollin Project provides gang intervention services to youth, ages 10 to 21 years old. The program’s primary objectives are to provide a highly mobile outreach and Crisis Response Team with the expertise in gang intervention and mediation. The Ollin Project recruits and involves youth congregating (hanging out) on streets, parks, community centers, and schools and enrolls them into our comprehensive transitional program that begins with assessment, case management and mentoring services; continues with asset development and resiliency skills; developing leadership skills and community organizing; employment readiness; family wellness/mediation and ends with the youth prepared to improve academic success and personal development. MACSA’s JJCPA-funded strategy has been able to improve services at the Interventions Center in San José and the South County Youth Center, as well as at MACSA’s two charter schools (Academica Calmecac and El Portal). The programs were fortified by adding an intensive case management approach that is built upon a personalized development plan. A Case Manager is assigned to each youth and relies on the asset-based assessment to determine and implement the youth’s personalized development plan. In addition to the intensive case management component, JJCPA funds made it possible for MACSA to continue the family advocate and parent education component. The family advocate provides support to parents who are trying to navigate the school and justice systems. Such support assists parents to gain the tools necessary for being an effective advocate for their own child. Parents are also better able to understand the options available to them and make informed decisions. The program enhancement also consists of bilingual parent education and counseling services. These services target those parents whose children have not been incarcerated. In addition to providing JJCPA-funded services in the county’s neediest areas, MACSA’s programs are linguistically and culturally appropriate in design and implementation.

JJCPA Evaluation Report, January 2007 Prepared by Community Crime Prevention Associates
93
Primary Partners • Alum Rock Counseling Center • Chamberlains Counseling Center • Eastside Union High School District • Gilroy Unified School District • Morgan Hill Unified School District
• Probation Department • School-Linked Services • Workforce Investment Act – Youth
Employment Services
Program Approach There are four core program components to the JJCPA-funded program enhancements: assessment, intensive case management, family advocacy, and parent education.
Assessment: A Case Manager conducts a comprehensive intake and assessment of each youth. MACSA uses an asset-based assessment model and incorporates the 40 assets identified by the Search Institute. The case manager also meets with the youth’s parents and siblings as needed in order to determine family and community assets. The information is used to develop a personalized development plan for each youth. Intensive Case Management: The Case Manager works to ensure that all components of the personalized development plan are implemented. Instead of simply identifying and referring a youth and his family to a program or service, the intensive case management system ensures that the youth understands the service, knows how to get there, attends regularly, and is engaged. In addition to working with the youth and his parents to select the programs and services, the Case Manager monitors the youth’s progress through individual and family meetings, site visits, and home visits. Quarterly assessments are conducted to document the success as well as to update the personalized development plan as needed.
Youth and Family Advocacy: The Case Manager refers a youth and his family to the Family Advocate when a family needs additional support. Services include translation for school and County services, support at court hearings, understanding procedures and completing documents, and enrolling in and accessing other services such as low-income health insurance programs. The Family Advocate works closely with the Case Manager to ensure that all progress is included in the case management system. Parent Education: Parent education services are available to parents whose youth are at risk of entering the juvenile justice system or are recently released from custody. Parent education services are conducted in one-time workshops and ongoing parent support groups. Parent workshop and support group topics include: communicating with youth teenager, domestic violence, depression, and anger management.

JJCPA Evaluation Report, January 2007 Prepared by Community Crime Prevention Associates
94
JJCPA Performance – Logic Model Evaluation System
MACSA Intensive Case Management, FY 2005-06 Performance-Logic
Model Term Evaluation Questions
Answer to Evaluation Questions
Inputs What was spent on services?
MACSA spent $379,136 to deliver services for the Intensive Case Management Program.
Customers Who were the customers?
Served 371 customers. See appendix.
Strategies What service strategies were used?
Right-hand column shows percent of all units of service delivered in FY 2005-06. Activity FY 05-06 FY 04-05
Outreach & Recruitment 3.3% 0.8%
Intake, Assess. & ISP 4.5% 3.3%
Home/School Visit/Parents 42.1% 10.2%
Ind./Family Counsel 0.0% 6.8%
Case Mgmt., Support, Refer. 25.0% 15.4%
Transportation 0.0% 0.0%
Field Trips & Cmty. Service 0.0% 53.2%
Group Workshops 25.1% 10.5% Output: Units of Service
How much service was provided?
MACSA delivered 6,458 units of service. One unit of service equals one hour of direct service per customer.
E F F O R T
Output: Cost per Unit of Service
What was the cost to provide services?
The cost per unit of service for this provider was $58.17.
Performance Measure: Customer Satisfaction
Were customers satisfied with services?
The average customer satisfaction rating (out of 100 possible points) was: � youth-reported = 86.7 � parent-reported = 85.4
E F F E C T
Performance Measure: Productivity Outcomes
Were services effective in producing the desired change?
Productivity scores (scale from -100% to +100%) reflect the percent of targeted changes achieved minus the percent of targeted changes missed. Scores are listed by respondent.
FY 05-
06
FY 04-
05
FY 05-
06
FY 04-
05
FY 05-
06
FY 04-
05
Dev. Asset 79.5% 83.7% 81.1% 89.3% 72.7% 88.2%
Program-
Specific 77.5% 78.8% 78.5% 85.2% 67.4% 82.9%
Service
Productivity
Youth-
Reported
Parent-
ReportedStaff-Reported

JJCPA Evaluation Report, January 2007 Prepared by Community Crime Prevention Associates
95
The results of the intermediate outcomes for MACSA Intensive Case Management over the last five years are listed in the table below. Table 47
The trend for each MACSA Intermediate Outcome from fiscal year 2004-05 to fiscal year 2005-06 is reflected in the table below. The evaluation period for State outcomes started when clients entered the program. While the arrest rate is down by 10% from the previous year, the incarceration rate has risen 2%. Table 48

JJCPA Evaluation Report, January 2007 Prepared by Community Crime Prevention Associates
96
The following table shows the RPRA scores for the MACSA Intensive Case Management Program. As illustrated below, the total asset level of MACSA youth declined from Fiscal Year 2004-05, meaning that the program is serving higher need youth over time. Table 49
Asset Level
Risk
Avoidance Protective Resiliency
Social
Attachment
Agency FY 05-06 FY 05-06 FY 04-05 FY 05-06 FY 05-06 FY 05-06 FY 05-06
MACSA MEDIUM 85.5% 88.1% 87.4% 88.3% 81.9% 86.3%
All Programs MEDIUM 85.5% 88.1% 87.4% 88.3% 81.9% 86.3%
Total Assets
Table 50
Alum Rock/James Lick 95127 1Andrew Hill/Edenvale 95111 2Gilroy 95020 3Mayfair 95116 4King/Ocala/Overfelt 95122 5
Top 5 Zip Codes with Most MACSA Clients

JJCPA Evaluation Report, January 2007 Prepared by Community Crime Prevention Associates
97
Program Summary Pages
RESTORATIVE JUSTICE PROGRAM
Overview The JJCPA funds allowed for the continuation of the Restorative Justice Program (RJP) in all areas of the county. The program uses balanced and restorative justice principals to prevent youth from further penetrating the juvenile justice system. The Probation Department directly contacts victims of juvenile crime to request impact statements and restitution information. The program utilizes strength-based and family-focused rehabilitation services mindful of the ethnic and cultural diversity of its communities. In addition, the program is also a vehicle for increased victim participation in shaping youth accountability by incorporating victim offender meetings and victim awareness workshops. The program promotes community safety and youth accountability by supporting youth to repair the harm that they inflicted on the victim and community. Community Service Work provides youth the opportunity to develop empathy skills, gain assets and regain respect, as well as identifying and utilizing community resources to develop youth and family competencies. Primary Partners • Bill Wilson Center • California Youth Outreach • Community Health Awareness Council • Community Solutions • Probation Department Program Approach As stated in the Santa Clara County Juvenile Justice Action Plan, RJP was established to develop a balanced and restorative justice system with three components: • To provide for the protection and safety of the community; • To hold youth personally responsible and accountable for delinquent acts; and • To foster youth who are contributing and responsible members of the community by focusing on youth developmental assets and youth resiliency. RJP tests the theory that the best method of reducing juvenile crime and violence is to build the capacity of victims of crime, the community, and its youth. There are three core components to RJP: community protection, accountability, and youth competency development. Each of the three core components is described below. Community Protection: Each community has affected public safety through appropriate intervention strategies and monitoring of offenders for the duration of their contract.
JJCPA Evaluation Report, January 2007 Prepared by Community Crime Prevention Associates
98
Concentrated justice system resources have been used to identify, prosecute, and remove chronic violent offenders. Promoting victim restitution and restoration are important aspects of community protection. Youth Competency Development: In addition to expanding and enhancing existing youth programs, RJP developed life skill, leadership, and community re-integration curriculum that specifically focuses on violence prevention, drug/alcohol prevention and property offenses. Competency development programs are measured against outcomes related to youth developmental assets and resiliency. Youth that are identified as needing additional assistance beyond the competency development workshops, can receive a referral for counseling services. Youth can participate in a maximum of 10 counseling sessions, including, but not limited to individual, family and group counseling. Accountability: Swift, immediate, and appropriate sanctions characterize the accountability component to RJP. Holding youth accountable for the harm they caused to the victim and community, and fostering the community’s capacity to fulfill this element, has been essential to reducing a youth’s level of penetration into the juvenile justice system. Accountability strategies have included Victim Awareness Workshops, Victim Offender Meetings, and Community Service Work. Mentoring: During Fiscal Year 04-05, a mentoring component was made available for youth in the East and West regional areas of the Restorative Justice Program who were identified as needing additional services and could benefit by being connected with a caring, adult role model from the community. The goal of Mentoring is to engage and support the youth in developing positive alternatives to delinquent behavior through the establishment of a relationship with an older, wiser, more experienced adult who can assist the youth by providing consistent support, guidance and concrete help to a minor whose at-risk environment increases his or her chances of exposure to at-risk behaviors. The mentoring program ensures that those elements of culture, language, values, beliefs, worldview traditions and historical experiences are incorporated into the services provided to youth and their families. These services also ensure accessibility and maximize the strengths of different cultural groups in Santa Clara County.
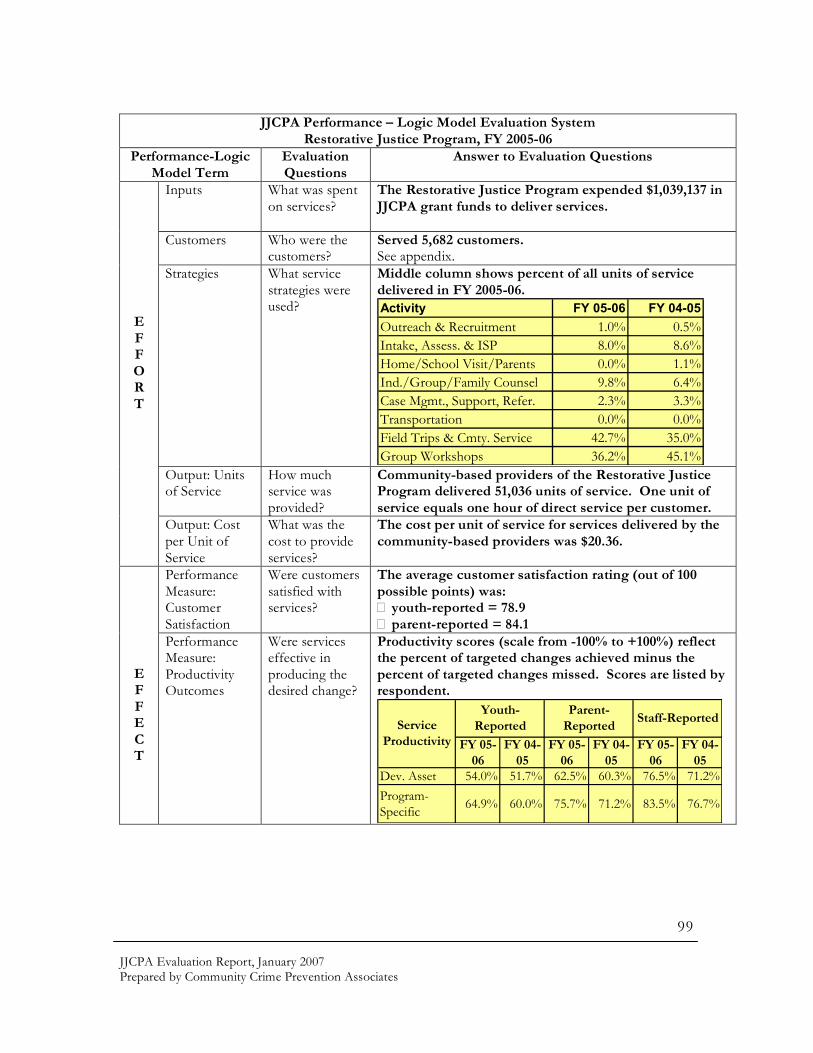
JJCPA Evaluation Report, January 2007 Prepared by Community Crime Prevention Associates
99
JJCPA Performance – Logic Model Evaluation System
Restorative Justice Program, FY 2005-06 Performance-Logic
Model Term Evaluation Questions
Answer to Evaluation Questions
Inputs What was spent on services?
The Restorative Justice Program expended $1,039,137 in JJCPA grant funds to deliver services.
Customers Who were the customers?
Served 5,682 customers. See appendix.
Strategies What service strategies were used?
Middle column shows percent of all units of service delivered in FY 2005-06. Activity FY 05-06 FY 04-05
Outreach & Recruitment 1.0% 0.5%
Intake, Assess. & ISP 8.0% 8.6%
Home/School Visit/Parents 0.0% 1.1%
Ind./Group/Family Counsel 9.8% 6.4%
Case Mgmt., Support, Refer. 2.3% 3.3%
Transportation 0.0% 0.0%
Field Trips & Cmty. Service 42.7% 35.0%
Group Workshops 36.2% 45.1% Output: Units of Service
How much service was provided?
Community-based providers of the Restorative Justice Program delivered 51,036 units of service. One unit of service equals one hour of direct service per customer.
E F F O R T
Output: Cost per Unit of Service
What was the cost to provide services?
The cost per unit of service for services delivered by the community-based providers was $20.36.
Performance Measure: Customer Satisfaction
Were customers satisfied with services?
The average customer satisfaction rating (out of 100 possible points) was: � youth-reported = 78.9 � parent-reported = 84.1
E F F E C T
Performance Measure: Productivity Outcomes
Were services effective in producing the desired change?
Productivity scores (scale from -100% to +100%) reflect the percent of targeted changes achieved minus the percent of targeted changes missed. Scores are listed by respondent.
FY 05-
06
FY 04-
05
FY 05-
06
FY 04-
05
FY 05-
06
FY 04-
05
Dev. Asset 54.0% 51.7% 62.5% 60.3% 76.5% 71.2%
Program-
Specific 64.9% 60.0% 75.7% 71.2% 83.5% 76.7%
Youth-
Reported
Parent-
ReportedStaff-Reported
Service
Productivity

JJCPA Evaluation Report, January 2007 Prepared by Community Crime Prevention Associates
100
JJCPA Performance – Logic Model Evaluation System
Restorative Justice Program – Bill Wilson Center, FY 2005-06 Performance-Logic
Model Term Evaluation Questions
Answer to Evaluation Questions
Inputs What was spent on services?
Bill Wilson Center spent $180,000 to deliver services for the Restorative Justice Program.
Customers Who were the customers?
See appendix.
Strategies What service strategies were used?
Middle column shows percent of all units of service delivered in FY 2005-06. Activity FY 05-06 FY 04-05
Outreach & Recruitment 0.0% 0.0%
Intake, Assess. & ISP 7.8% 13.0%
Home/School Visit/Parents 0.0% 0.0%
Ind./Group/Family Counsel 6.7% 6.7%
Case Mgmt., Support, Refer. 3.0% 3.1%
Transportation 0.0% 0.0%
Field Trips & Cmty. Service 60.5% 3.0%
Group Workshops 22.0% 74.1% Output: Units of Service
How much service was provided?
Bill Wilson Center delivered 13,337 units of service. One unit of service equals one hour of direct service per customer.
E F F O R T
Output: Cost per Unit of Service
What was the cost to provide services?
The cost per unit of service for this provider was $13.50.
Performance Measure: Customer Satisfaction
Were customers satisfied with services?
The average customer satisfaction rating (out of 100 possible points) was: � youth-reported = 77.7 � parent-reported = 87.1
E F F E C T
Performance Measure: Productivity Outcomes
Were services effective in producing the desired change?
Productivity scores (scale from -100% to +100%) reflect the percent of targeted changes achieved minus the percent of targeted changes missed. Developmental asset and program-specific targeted changes are listed by respondent.
FY 05-
06
FY 04-
05
FY 05-
06
FY 04-
05
FY 05-
06
FY 04-
05
Dev. Asset 56.6% 47.3% 69.4% 56.9% 71.3% 66.2%
Program-
Specific 67.6% 57.2% 78.4% 72.0% 83.2% 76.5%
Service
Productivity
Parent-
ReportedStaff-Reported
Youth-
Reported
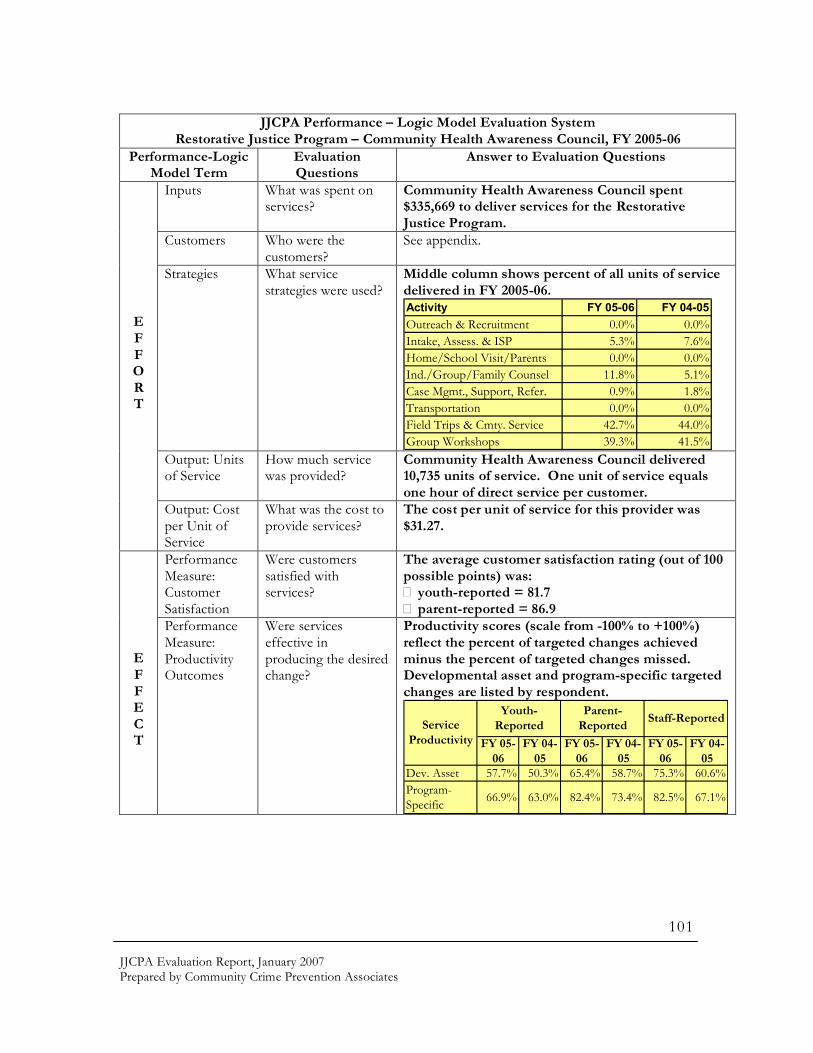
JJCPA Evaluation Report, January 2007 Prepared by Community Crime Prevention Associates
101
JJCPA Performance – Logic Model Evaluation System
Restorative Justice Program – Community Health Awareness Council, FY 2005-06 Performance-Logic
Model Term Evaluation Questions
Answer to Evaluation Questions
Inputs What was spent on services?
Community Health Awareness Council spent $335,669 to deliver services for the Restorative Justice Program.
Customers Who were the customers?
See appendix.
Strategies What service strategies were used?
Middle column shows percent of all units of service delivered in FY 2005-06. Activity FY 05-06 FY 04-05
Outreach & Recruitment 0.0% 0.0%
Intake, Assess. & ISP 5.3% 7.6%
Home/School Visit/Parents 0.0% 0.0%
Ind./Group/Family Counsel 11.8% 5.1%
Case Mgmt., Support, Refer. 0.9% 1.8%
Transportation 0.0% 0.0%
Field Trips & Cmty. Service 42.7% 44.0%
Group Workshops 39.3% 41.5% Output: Units of Service
How much service was provided?
Community Health Awareness Council delivered 10,735 units of service. One unit of service equals one hour of direct service per customer.
E F F O R T
Output: Cost per Unit of Service
What was the cost to provide services?
The cost per unit of service for this provider was $31.27.
Performance Measure: Customer Satisfaction
Were customers satisfied with services?
The average customer satisfaction rating (out of 100 possible points) was: � youth-reported = 81.7 � parent-reported = 86.9
E F F E C T
Performance Measure: Productivity Outcomes
Were services effective in producing the desired change?
Productivity scores (scale from -100% to +100%) reflect the percent of targeted changes achieved minus the percent of targeted changes missed. Developmental asset and program-specific targeted changes are listed by respondent.
FY 05-
06
FY 04-
05
FY 05-
06
FY 04-
05
FY 05-
06
FY 04-
05
Dev. Asset 57.7% 50.3% 65.4% 58.7% 75.3% 60.6%
Program-
Specific 66.9% 63.0% 82.4% 73.4% 82.5% 67.1%
Youth-
Reported
Parent-
ReportedStaff-Reported
Service
Productivity

JJCPA Evaluation Report, January 2007 Prepared by Community Crime Prevention Associates
102
JJCPA Performance – Logic Model Evaluation System
Restorative Justice Program – California Youth Outreach, FY 2005-06 Performance-Logic
Model Term Evaluation Questions
Answer to Evaluation Questions
Inputs What was spent on services?
California Youth Outreach spent $162,343 to deliver services for the Restorative Justice Program.
Customers Who were the customers?
See appendix.
Strategies What service strategies were used?
Middle column shows percent of all units of service delivered in FY 2005-06. Activity FY 05-06 FY 04-05
Outreach & Recruitment 0.0% 0.0%
Intake, Assess. & ISP 4.9% 5.1%
Home/School Visit/Parents 0.0% 0.0%
Ind./Group/Family Counsel 14.7% 12.2%
Case Mgmt., Support, Refer. 2.5% 0.3%
Transportation 0.0% 0.0%
Field Trips & Cmty. Service 48.6% 54.4%
Group Workshops 29.3% 28.0% Output: Units of Service
How much service was provided?
California Youth Outreach delivered 15,267 units of service. One unit of service equals one hour of direct service per customer.
E F F O R T
Output: Cost per Unit of Service
What was the cost to provide services?
The cost per unit of service for this provider was $10.63.
Performance Measure: Customer Satisfaction
Were customers satisfied with services?
The average customer satisfaction rating (out of 100 possible points) was: � youth-reported = 74.7 � parent-reported = 79.4
E F F E C T
Performance Measure: Productivity Outcomes
Were services effective in producing the desired change?
Productivity scores (scale from -100% to +100%) reflect the percent of targeted changes achieved minus the percent of targeted changes missed. Developmental asset and program-specific targeted changes are listed by respondent.
FY 05-
06
FY 04-
05
FY 05-
06
FY 04-
05
FY 05-
06
FY 04-
05
Dev. Asset 50.3% 61.8% 59.8% 62.4% 83.5% 82.0%
Program-
Specific 61.0% 59.1% 68.7% 68.4% 80.3% 81.9%
Service
Productivity
Youth-
Reported
Parent-
ReportedStaff-Reported

JJCPA Evaluation Report, January 2007 Prepared by Community Crime Prevention Associates
103
JJCPA Performance – Logic Model Evaluation System
Restorative Justice Program – Community Solutions, FY 2005-06 Performance-
Logic Model Term Evaluation Questions
Answer to Evaluation Questions
Inputs What was spent on services?
Community Solutions spent $261,129 to deliver services for the Restorative Justice Program.
Customers Who were the customers?
See appendix.
Strategies What service strategies were used?
Middle column shows percent of all units of service delivered in FY 2005-06. Activity FY 05-06 FY 04-05
Outreach & Recruitment 0.0% 0.0%
Intake, Assess. & ISP 17.0% 9.9%
Home/School Visit/Parents 0.0% 0.0%
Ind./Group/Family Counsel 7.5% 3.2%
Case Mgmt., Support, Refer. 3.4% 2.2%
Transportation 0.0% 0.0%
Field Trips & Cmty. Service 22.1% 36.7%
Group Workshops 50.0% 48.0% Output: Units of Service
How much service was provided?
Community Solutions delivered 7,784 units of service. One unit of service equals one hour of direct service per customer.
E F F O R T
Output: Cost per Unit of Service
What was the cost to provide services?
The cost per unit of service for this provider was $33.55.
Performance Measure: Customer Satisfaction
Were customers satisfied with services?
The average customer satisfaction rating (out of 100 possible points) was: � youth-reported = 81.0 � parent-reported = 84.7
E F F E C T
Performance Measure: Productivity Outcomes
Were services effective in producing the desired change?
Productivity scores (scale from -100% to +100%) reflect the percent of targeted changes achieved minus the percent of targeted changes missed. Developmental asset and program-specific targeted changes are listed by respondent.
FY 05-
06
FY 04-
05
FY 05-
06
FY 04-
05
FY 05-
06
FY 04-
05
Dev. Asset 53.7% 54.7% 58.8% 61.8% 77.1% 80.2%
Program-
Specific 65.6% 62.2% 76.8% 71.8% 86.1% 81.1%
Service
Productivity
Youth-
Reported
Parent-
ReportedStaff-Reported
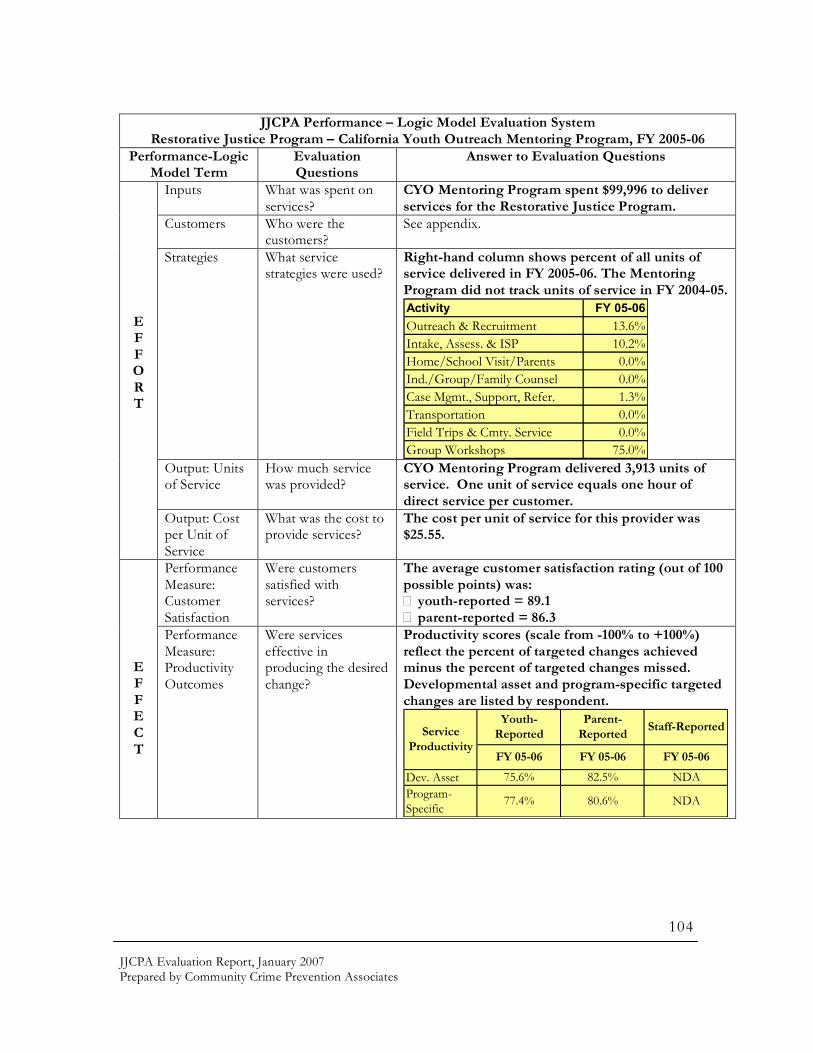
JJCPA Evaluation Report, January 2007 Prepared by Community Crime Prevention Associates
104
JJCPA Performance – Logic Model Evaluation System
Restorative Justice Program – California Youth Outreach Mentoring Program, FY 2005-06 Performance-Logic
Model Term Evaluation Questions
Answer to Evaluation Questions
Inputs What was spent on services?
CYO Mentoring Program spent $99,996 to deliver services for the Restorative Justice Program.
Customers Who were the customers?
See appendix.
Strategies What service strategies were used?
Right-hand column shows percent of all units of service delivered in FY 2005-06. The Mentoring Program did not track units of service in FY 2004-05. Activity FY 05-06
Outreach & Recruitment 13.6%
Intake, Assess. & ISP 10.2%
Home/School Visit/Parents 0.0%
Ind./Group/Family Counsel 0.0%
Case Mgmt., Support, Refer. 1.3%
Transportation 0.0%
Field Trips & Cmty. Service 0.0%
Group Workshops 75.0% Output: Units of Service
How much service was provided?
CYO Mentoring Program delivered 3,913 units of service. One unit of service equals one hour of direct service per customer.
E F F O R T
Output: Cost per Unit of Service
What was the cost to provide services?
The cost per unit of service for this provider was $25.55.
Performance Measure: Customer Satisfaction
Were customers satisfied with services?
The average customer satisfaction rating (out of 100 possible points) was: � youth-reported = 89.1 � parent-reported = 86.3
E F F E C T
Performance Measure: Productivity Outcomes
Were services effective in producing the desired change?
Productivity scores (scale from -100% to +100%) reflect the percent of targeted changes achieved minus the percent of targeted changes missed. Developmental asset and program-specific targeted changes are listed by respondent.
Dev. Asset
Program-
Specific
Service
Productivity
Youth-
Reported
Parent-
ReportedStaff-Reported
FY 05-06 FY 05-06 FY 05-06
75.6%
77.4%
82.5%
80.6%
NDA
NDA

JJCPA Evaluation Report, January 2007 Prepared by Community Crime Prevention Associates
105
The results of the intermediate outcomes for the Restorative Justice Program over the last five years are listed in the table below. Table 51
The trend for each Restorative Justice Program Intermediate Outcome from fiscal year 2004-05 to fiscal year 2005-06 is reflected in the table below. The evaluation period for State outcomes started when the clients exited the program. The arrest rate intermediate outcome has increased slightly (1%) from the previous year, while the restitution completion outcome demonstrated a strong increase. Table 52
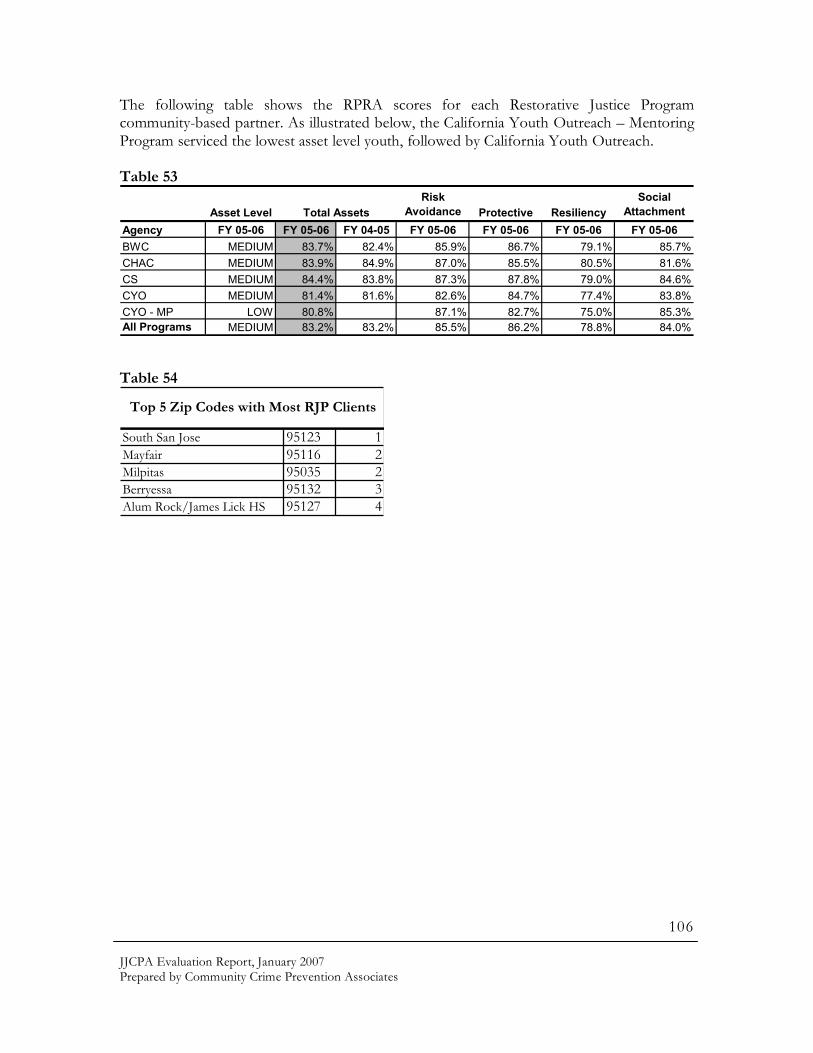
JJCPA Evaluation Report, January 2007 Prepared by Community Crime Prevention Associates
106
The following table shows the RPRA scores for each Restorative Justice Program community-based partner. As illustrated below, the California Youth Outreach – Mentoring Program serviced the lowest asset level youth, followed by California Youth Outreach. Table 53
Asset Level
Risk
Avoidance Protective Resiliency
Social
Attachment
Agency FY 05-06 FY 05-06 FY 04-05 FY 05-06 FY 05-06 FY 05-06 FY 05-06
BWC MEDIUM 83.7% 82.4% 85.9% 86.7% 79.1% 85.7%
CHAC MEDIUM 83.9% 84.9% 87.0% 85.5% 80.5% 81.6%
CS MEDIUM 84.4% 83.8% 87.3% 87.8% 79.0% 84.6%
CYO MEDIUM 81.4% 81.6% 82.6% 84.7% 77.4% 83.8%
CYO - MP LOW 80.8% 87.1% 82.7% 75.0% 85.3%
All Programs MEDIUM 83.2% 83.2% 85.5% 86.2% 78.8% 84.0%
Total Assets
Table 54
South San Jose 95123 1
Mayfair 95116 2Milpitas 95035 2Berryessa 95132 3Alum Rock/James Lick HS 95127 4
Top 5 Zip Codes with Most RJP Clients

JJCPA Evaluation Report, January 2007 Prepared by Community Crime Prevention Associates
107
Program Summary Pages
TRUANCY REDUCTION SERVICES Overview The Truancy Reduction Services (TRS) is comprised of four community-based organizations (CBO) and ten school districts. The four youth service organizations serve school-age youth between the ages of six and 17 years who are identified as “habitual” truants – those with six or more absences. The collaborative was formed based on an Action Plan developed by the Status Offender Services (SOS) Task Force. The Action Plan called for an expansion of services to status offenders, including truants of all ages. During FY 2004-05, the collaborative between the four community-based organizations was expanded from nine to ten participating school districts. The relationship is delineated in memorandums of understanding between the service agencies and school districts. Partners • Alum Rock Counseling Center (lead agency)
Community Solutions Emergency Housing Consortium
• California Youth Outreach School Districts • School Districts and Student Attendance Review Boards (SARB)
1. East Side Union High School District 2. San José Unified School District 3. Santa Clara Unified School District 4. Cupertino School District 5. Sunnyvale School District 6. Gilroy Unified School District 7. Morgan Hill Unified School District 8. Alum Rock Union Elementary School District 9. Berryessa Union School District 10. Franklin-McKinley School District
Program Approach Depending on the school district, youth clients are referred to the program by the youth’s attendance office, school Counselor or Administrator, and/or SARB. In some cases, school districts have opted to place the TRS counselor at a school(s) with a demonstrated incidence of truancy. If any TRS service provider receives a referral from a CBO, and if the child/youth is in the corresponding school district, the referring source is directed to the child’s school to make the referral to TRS. All TRS cases are certified by a school official
JJCPA Evaluation Report, January 2007 Prepared by Community Crime Prevention Associates
108
and/or administrator. This ensures that the school and/school district are identifying the youths and for monitoring and tracking purposes. Referring sources receive a report back on the case disposition within one week of referral or one month, as established with the school district. The Case Managers with input from the collaborating school district have an established referral and report-back process. Intensive case management services are provided to youth who are referred to the program. Intensive case management includes comprehensive youth and family assessment; development and implementation of an individual case plan with focus on increasing school attendance, participation, achievement, and diversion of youth from involvement with the criminal justice system; individual one-on-one support, and monitoring of progress through individual and family case management, school visits, home visits, and referral to other services as needed. Each Case Manager carries a caseload of 15-20 clients and generally carries the cases for an average of 90 days. In addition to working with the referred youth, Case Managers work closely with parents and siblings of the identified youth. In some instances, Case Managers discover early truancy behaviors in younger siblings. Working with parents is also an integral part of the Case Manager’s effort to improve the youth’s school attendance. Case Managers refer parents to counseling, job training, and substance abuse services as part of the overall goal to reduce the youth’s truant behavior. The TRS intervention model integrates culturally sensitive and language proficient services that are relevant and appropriate to the needs of participating youths and their families. Service providers work to ensure that clients have access to educational services as well as linked to community resources, including monitoring and follow-up.

JJCPA Evaluation Report, January 2007 Prepared by Community Crime Prevention Associates
109
JJCPA Performance – Logic Model Evaluation System
Truancy Reduction Services, FY 2005-06 Performance-Logic
Model Term Evaluation Questions
Answer to Evaluation Questions
Inputs What was spent on services?
Truancy Reduction Services expended $268,076 in JJCPA grant funds to deliver services.
Customers Who were the customers?
Served 329 customers. See appendix.
Strategies What service strategies were used?
Right-hand column shows percent of all units of service delivered. Activity FY 05-06 FY 04-05
Outreach & Recruitment 15.6% 9.6%
Intake, Assess. & ISP 10.2% 8.5%
Home/School Visit/Parents 48.4% 22.7%
Ind./Family Counsel 14.7% 13.8%
Case Mgmt., Support, Refer. 8.6% 40.4%
Transportation 0.0% 0.0%
Field Trips & Cmty. Service 0.9% 1.5%
Group Workshops 1.7% 3.5% Output: Units of Service
How much service was provided?
Community-based providers of Truancy Reduction Services delivered 12,442 units of service. One unit of service equals one hour of direct service per customer.
E F F O R T
Output: Cost per Unit of Service
What was the cost to provide services?
The cost per unit of service for services delivered by the community-based providers was $21.55.
Performance Measure: Customer Satisfaction
Were customers satisfied with services?
The average customer satisfaction rating (out of 100 possible points) was: � youth-reported = 81.2 � parent-reported = 85.4
E F F E C T
Performance Measure: Productivity Outcomes
Were services effective in producing the desired change?
Productivity scores (scale from -100% to +100%) reflect the percent of targeted changes achieved minus the percent of targeted changes missed. Scores are listed by respondent.
FY 05-
06
FY 04-
05
FY 05-
06
FY 04-
05
FY 05-
06
FY 04-
05
Dev. Asset 68.4% 63.0% 68.4% 64.8% 61.5% 64.5%
Program-
Specific 70.3% 67.7% 76.5% 75.8% 59.4% 71.4%
Service
Productivity
Youth-
Reported
Parent-
ReportedStaff-Reported

JJCPA Evaluation Report, January 2007 Prepared by Community Crime Prevention Associates
110
JJCPA Performance – Logic Model Evaluation System
Truancy Reduction – Alum Rock Counseling Center, FY 2005-06 Performance-
Logic Model Term Evaluation Questions
Answer to Evaluation Questions
Inputs What was spent on services?
Alum Rock Counseling Center spent $94,492 to deliver services for the Truancy Reduction Program.
Customers Who were the customers?
See appendix.
Strategies What service strategies were used?
Middle column shows percent of all units of service delivered in FY 2005-06. Activity FY 05-06 FY 04-05
Outreach & Recruitment 9.8% 13.9%
Intake, Assess. & ISP 10.2% 12.5%
Home/School Visit/Parents 50.9% 17.4%
Ind./Family Counsel 22.4% 29.4%
Case Mgmt., Support, Refer. 6.6% 26.8%
Transportation 0.0% 0.0%
Field Trips & Cmty. Service 0.0% 0.0%
Group Workshops 0.0% 0.0% Output: Units of Service
How much service was provided?
Alum Rock Counseling Center delivered 4,910 units of service. One unit of service equals one hour of direct service per customer.
E F F O R T
Output: Cost per Unit of Service
What was the cost to provide services?
The cost per unit of service for this provider was $19.24.
Performance Measure: Customer Satisfaction
Were customers satisfied with services?
The average customer satisfaction rating (out of 100 possible points) was: � youth-reported = 76.4 � parent-reported = 89.1
E F F E C T
Performance Measure: Productivity Outcomes
Were services effective in producing the desired change?
Productivity scores (scale from -100% to +100%) reflect the percent of targeted changes achieved minus the percent of targeted changes missed. Developmental asset and program-specific targeted changes are listed by respondent.
FY 05-
06
FY 04-
05
FY 05-
06
FY 04-
05
FY 05-
06
FY 04-
05
Dev. Asset 58.3% 66.6% 61.4% 86.7% 57.6% 66.3%
Program-
Specific 63.8% 74.3% 73.4% 93.3% 62.7% 72.9%
Service
Productivity
Youth-
Reported
Parent-
ReportedStaff-Reported

JJCPA Evaluation Report, January 2007 Prepared by Community Crime Prevention Associates
111
JJCPA Performance – Logic Model Evaluation System
Truancy Reduction Services – California Youth Outreach, FY 2005-06 Performance-Logic
Model Term Evaluation Questions
Answer to Evaluation Questions
Inputs What was spent on services?
California Youth Outreach spent $85,870 spent to deliver services for the Truancy Reduction Program.
Customers Who were the customers?
See appendix.
Strategies What service strategies were used?
Middle column shows percent of all units of service delivered in FY 2005-06. Activity FY 05-06 FY 04-05
Outreach & Recruitment 24.9% 8.3%
Intake, Assess. & ISP 11.9% 4.9%
Home/School Visit/Parents 32.6% 19.0%
Ind./Family Counsel 9.7% 9.9%
Case Mgmt., Support, Refer. 10.4% 50.3%
Transportation 0.0% 0.0%
Field Trips & Cmty. Service 3.5% 0.0%
Group Workshops 6.9% 7.6% Output: Units of Service
How much service was provided?
California Youth Outreach delivered 3,097 units of service. One unit of service equals one hour of direct service per customer.
E F F O R T
Output: Cost per Unit of Service
What was the cost to provide services?
The cost per unit of service for this provider was $27.73.
Performance Measure: Customer Satisfaction
Were customers satisfied with services?
The average customer satisfaction rating (out of 100 possible points) was: � youth-reported = 85.1 � parent-reported = 92.1
E F F E C T
Performance Measure: Productivity Outcomes
Were services effective in producing the desired change?
Productivity scores (scale from -100% to +100%) reflect the percent of targeted changes achieved minus the percent of targeted changes missed. Developmental asset and program-specific targeted changes are listed by respondent.
FY 05-
06
FY 04-
05
FY 05-
06
FY 04-
05
FY 05-
06
FY 04-
05
Dev. Asset 75.8% 63.0% 83.6% 60.6% 79.9% 60.0%
Program-
Specific 74.5% 65.0% 80.1% 71.4% 64.3% 69.1%
Service
Productivity
Youth-
Reported
Parent-
ReportedStaff-Reported

JJCPA Evaluation Report, January 2007 Prepared by Community Crime Prevention Associates
112
JJCPA Performance – Logic Model Evaluation System
Truancy Reduction Services – Community Solutions, FY 2005-06 Performance-Logic
Model Term Evaluation Questions
Answer to Evaluation Questions
Inputs What was spent on services?
Community Solutions spent $43,857 to deliver services for the Truancy Reduction Program.
Customers Who were the customers?
See appendix.
Strategies What service strategies were used?
Middle column shows percent of all units of service delivered in FY 2005-06. Activity FY 05-06 FY 04-05
Outreach & Recruitment 32.9% 14.8%
Intake, Assess. & ISP 12.7% 18.4%
Home/School Visit/Parents 39.5% 28.9%
Ind./Family Counsel 10.0% 19.6%
Case Mgmt., Support, Refer. 4.9% 18.3%
Transportation 0.0% 0.0%
Field Trips & Cmty. Service 0.0% 0.0%
Group Workshops 0.0% 0.0% Output: Units of Service
How much service was provided?
Community Solutions delivered 1,862 units of service. One unit of service equals one hour of direct service per customer.
E F F O R T
Output: Cost per Unit of Service
What was the cost to provide services?
The cost per unit of service for this provider was $23.55.
Performance Measure: Customer Satisfaction
Were customers satisfied with services?
The average customer satisfaction rating (out of 100 possible points) was: � youth-reported = 74.5 � parent-reported = 64.9
E F F E C T
Performance Measure: Productivity Outcomes
Were services effective in producing the desired change?
Productivity scores (scale from -100% to +100%) reflect the percent of targeted changes achieved minus the percent of targeted changes missed. Developmental asset and program-specific targeted changes are listed by respondent.
FY 05-
06
FY 04-
05
FY 05-
06
FY 04-
05
FY 05-
06
FY 04-
05
Dev. Asset 68.6% 59.9% 61.4% 60.3% 63.2% 66.0%
Program-
Specific 68.2% 62.0% 74.1% 70.2% 65.8% 69.9%
Service
Productivity
Youth-
Reported
Parent-
ReportedStaff-Reported
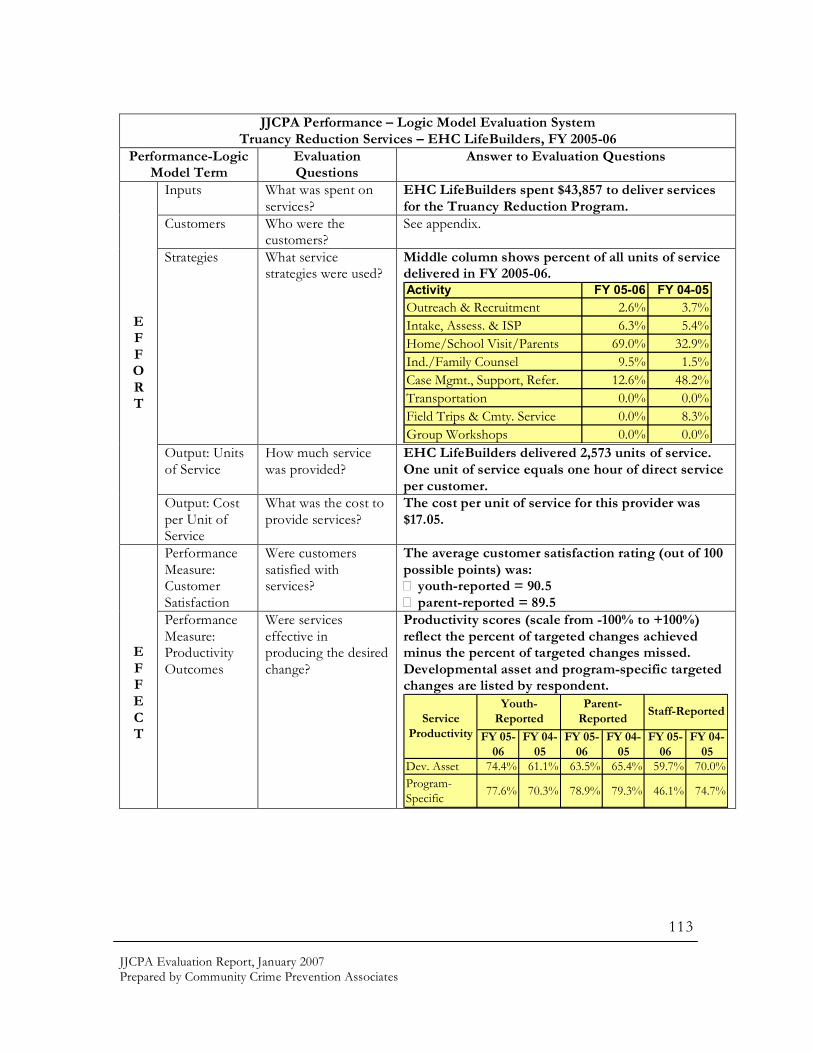
JJCPA Evaluation Report, January 2007 Prepared by Community Crime Prevention Associates
113
JJCPA Performance – Logic Model Evaluation System
Truancy Reduction Services – EHC LifeBuilders, FY 2005-06 Performance-Logic
Model Term Evaluation Questions
Answer to Evaluation Questions
Inputs What was spent on services?
EHC LifeBuilders spent $43,857 to deliver services for the Truancy Reduction Program.
Customers Who were the customers?
See appendix.
Strategies What service strategies were used?
Middle column shows percent of all units of service delivered in FY 2005-06. Activity FY 05-06 FY 04-05
Outreach & Recruitment 2.6% 3.7%
Intake, Assess. & ISP 6.3% 5.4%
Home/School Visit/Parents 69.0% 32.9%
Ind./Family Counsel 9.5% 1.5%
Case Mgmt., Support, Refer. 12.6% 48.2%
Transportation 0.0% 0.0%
Field Trips & Cmty. Service 0.0% 8.3%
Group Workshops 0.0% 0.0% Output: Units of Service
How much service was provided?
EHC LifeBuilders delivered 2,573 units of service. One unit of service equals one hour of direct service per customer.
E F F O R T
Output: Cost per Unit of Service
What was the cost to provide services?
The cost per unit of service for this provider was $17.05.
Performance Measure: Customer Satisfaction
Were customers satisfied with services?
The average customer satisfaction rating (out of 100 possible points) was: � youth-reported = 90.5 � parent-reported = 89.5
E F F E C T
Performance Measure: Productivity Outcomes
Were services effective in producing the desired change?
Productivity scores (scale from -100% to +100%) reflect the percent of targeted changes achieved minus the percent of targeted changes missed. Developmental asset and program-specific targeted changes are listed by respondent.
FY 05-
06
FY 04-
05
FY 05-
06
FY 04-
05
FY 05-
06
FY 04-
05
Dev. Asset 74.4% 61.1% 63.5% 65.4% 59.7% 70.0%
Program-
Specific 77.6% 70.3% 78.9% 79.3% 46.1% 74.7%
Service
Productivity
Youth-
Reported
Parent-
ReportedStaff-Reported

JJCPA Evaluation Report, January 2007 Prepared by Community Crime Prevention Associates
114
The results of the intermediate outcomes for Truancy Reduction Services over the last five years are listed in the table below. Table 55
The trend for each Truancy Reduction Services Intermediate Outcome for fiscal year 2005-06 is reflected in the table below. The evaluation period for State outcome started when youth exited the program. Two of the four intermediate outcomes are headed in the right direction in comparison to the previous year. Table 56
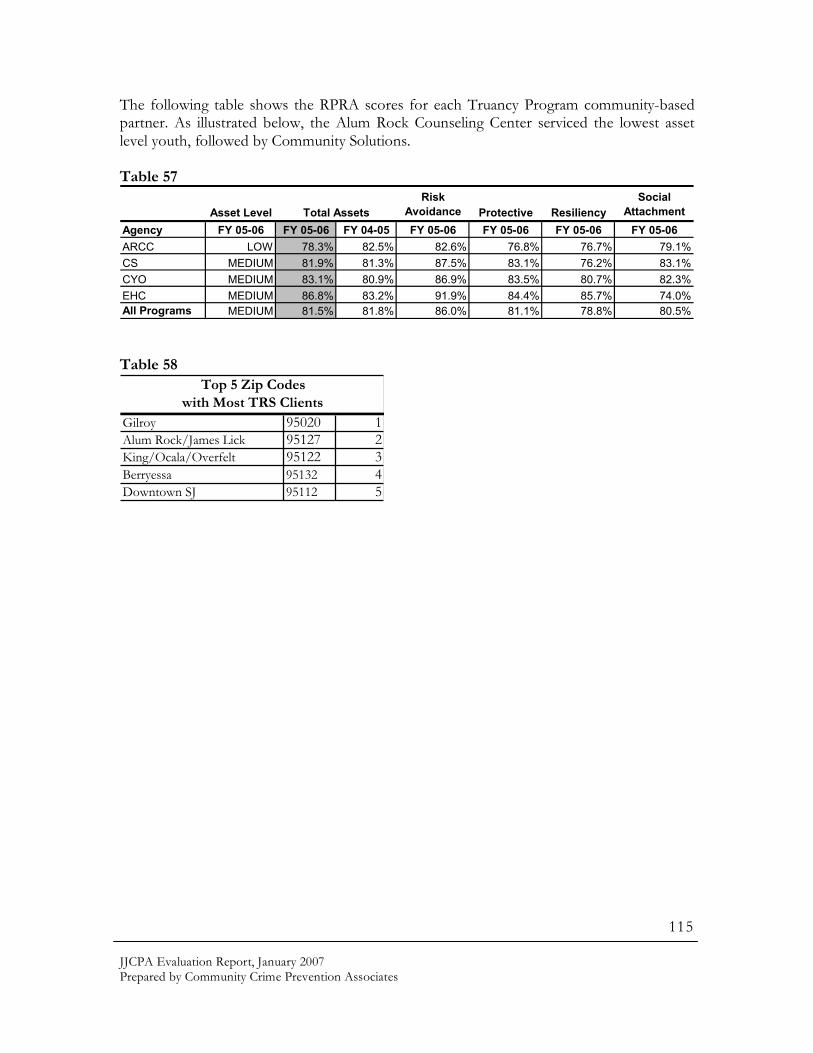
JJCPA Evaluation Report, January 2007 Prepared by Community Crime Prevention Associates
115
The following table shows the RPRA scores for each Truancy Program community-based partner. As illustrated below, the Alum Rock Counseling Center serviced the lowest asset level youth, followed by Community Solutions. Table 57
Asset Level
Risk
Avoidance Protective Resiliency
Social
Attachment
Agency FY 05-06 FY 05-06 FY 04-05 FY 05-06 FY 05-06 FY 05-06 FY 05-06
ARCC LOW 78.3% 82.5% 82.6% 76.8% 76.7% 79.1%
CS MEDIUM 81.9% 81.3% 87.5% 83.1% 76.2% 83.1%
CYO MEDIUM 83.1% 80.9% 86.9% 83.5% 80.7% 82.3%
EHC MEDIUM 86.8% 83.2% 91.9% 84.4% 85.7% 74.0%
All Programs MEDIUM 81.5% 81.8% 86.0% 81.1% 78.8% 80.5%
Total Assets
Table 58
Gilroy 95020 1Alum Rock/James Lick 95127 2King/Ocala/Overfelt 95122 3Berryessa 95132 4Downtown SJ 95112 5
Top 5 Zip Codes
with Most TRS Clients

JJCPA Evaluation Report, January 2007 Prepared by Community Crime Prevention Associates
116
B A C K G R O U N D
Background The Juvenile Justice Crime Prevention Act (JJCPA) provides support to local jurisdictions to implement their local juvenile justice action strategy. The passage of JJCPA (also known as the Schiff-Cardenas Crime Prevention Act) in 2000 provided over $121 million to counties for juvenile justice programs. Including interest income, Santa Clara County allocated $4,999,244 in FY 2005-06. Allocations were made to counties based on population and given only to those counties with a Board of Corrections (BOC)-approved Comprehensive Multi-Agency Juvenile Justice Plan (CMJJP). As required by the creating legislation, counties were required to articulate their local CMJJP strategy. Comprehensive Multi-Agency Juvenile Justice Plan Community Crime Prevention Associates (CCPA) was retained by the Probation Department to assist in the development of the CMJJP, as well as the development of prioritized programs. Santa Clara County’s CMJJP was an update of its Local Action Plan originally developed in 1997 in response to the Juvenile Crime Enforcement and Accountability Challenge Grant. As with the previous Local Action Plan, the CMJJP was developed with the input of numerous key community leaders including: • Alum Rock Counseling Center • Asian Americans for Community Involvement • Asian American Recovery Services • Big Brothers/Big Sisters • Bill Wilson Center • Boys and Girls Clubs • California Youth Outreach • Catholic Charities • Center for Training & Careers • City of San José – Mayor’s Gang Prevention Task Force, BEST Program, Youth Intervention & Employee Svcs., Police Dept. • City Year • Community Solutions • Crosscultural Community Services Center • Department of Corrections • District Attorney’s Office
• Fair Middle School • Filipino Youth Coalition • Franklin-McKinley S.D. • Fresh Life for Youth • Juvenile Court Judges • MACSA • Mental Health Department • Office of Supervisor Blanca Alvarado • Office of Supervisor Jim Beall • Office of Human Relations • Pathway Society • Probation Department • Public Allies • Public Defender’s Office • ROHI Alternative Community Outreach • San José Conservation Corps • Social Advocates for Youth • Social Services Agency • Ujima Adult & Family Services

JJCPA Evaluation Report, January 2007 Prepared by Community Crime Prevention Associates
117
• United Way of Silicon Valley • Vietnamese Voluntary Foundation
• YWCA
The creating legislation required that programs proposed for funding:
1. Be based on programs and approaches along the entire continuum of services that have demonstrated effectiveness in reducing delinquency and addressing juvenile crime;
2. Collaborate and integrate services; 3. Employ information sharing systems; and 4. Adopt goals to be used to determine the effectiveness of programs.
In addition to the proposed programs for funding, the BOC required counties to include the following in the CMJJP:
1. Assessment of existing youth services specifically targeted at at-risk youth, juvenile offenders, and their families;
2. Identification and prioritization of at-risk neighborhoods and schools; and
3. Development of a strategy providing a continuum of responses to juvenile crime.
Lastly, the five guiding principles adopted by the Juvenile Justice Coordinating Council (JJCC), Santa Clara County’s local oversight committee required by the legislation, helped to shape activities related to juvenile crime enforcement. The JJCC has relied on these principles to guide budget and policy recommendations, assist law and justice practitioners understand their role in the larger system of services for children and youth, and support service providers shape their services. These five guiding principles are:
• strengthen the family to instill moral values and provide guidance and support to children. Where there is no functioning family unit, we must establish a family surrogate to assist the child to develop pro-social behavior;
• support core social institutions, such as schools, religious institutions,
community-based organizations, and public youth service organizations, in order to develop pro-social behavior in our youth;
• promote delinquency prevention programs as a cost effective approach
to reducing juvenile delinquency. Levels of prevention programs are an appropriate sanction for problem delinquent behavior;
• intervene immediately and effectively when at-risk and delinquent

JJCPA Evaluation Report, January 2007 Prepared by Community Crime Prevention Associates
118
behavior occurs to successfully prevent delinquent offenders from becoming chronic offenders or committing more progressively serious and violent crimes; and
• identify and control the small group of serious, violent, and chronic
juvenile offenders who have failed to respond to intervention efforts and graduated sanctions. Incarcerating these youths will protect the community through their removal.
Program Selection Process The Probation Department engaged in a number of activities to develop the prioritized programs. In October 2000, the Probation Department issued an announcement to community-based organizations, County departments, local law and justice practitioners, and other service providers about the Crime Prevention Act 2000 funding opportunity. The announcement contained the background of the legislation, as well as the process for submitting proposals to the Juvenile Justice Coordinating Council. Information about the funding opportunity was disseminated to numerous coalitions, community providers, and multi-agency efforts. Prospective applicants were clearly informed about expectations regarding legislatively mandated outcome measures such as rate of juvenile arrest and rate of successful probation completion. Furthermore, applicants were instructed to complete a proposal information sheet, which included important data elements stated in the legislation, such as collaborative partners, timeline for implementation, and citation of demonstrated effectiveness. Subsequently, the Probation Department staff worked with consultants to synthesize the information submitted for 13 proposals, organized the information into a matrix format, and present the information to the JJCC at its November 15, 2000 meeting. This meeting served as an opportunity for the JJCC to conduct a first review of the proposed programs totaling $7.5 million in requests, and hear comments from the applicants. Due to the overwhelming request, the JJCC asked that those applicants still interested in seeking CPA 2000 funds further develop and refine their proposals to be reviewed at a subsequent public hearing. The Probation Department worked with its consultants to develop its recommendations of top programs. The recommendations were based on the criteria set forth in the legislation and reiterated by the State Board of Corrections. The JJCC approved staff’s recommendations, as did the Board of Supervisors Public Safety and Justice Committee in January 2001. The following five programs were awarded JJCPA funds for FY 2001-02. • Aftercare Services • Assessment Center • Mexican American Community Services Agency • Restorative Justice Program • Truancy Reduction Services

JJCPA Evaluation Report, January 2007 Prepared by Community Crime Prevention Associates
119
Program descriptions for FY 2005-06 are contained in the Program Summary Section of this report. Additional Information The evaluation team included Rachel Camacho, Andrea Flores Shelton, Shirly Lee, and with the assistance of Dr. Peter Ellis, Tanya Baker and Dr. Rex Green. For additional information contact: Community Crime Prevention Associates P.O. Box 730 San José, CA 95108 (408) 271-7049

JJCPA Evaluation Report, January 2007 Prepared by Community Crime Prevention Associates
120
Appendix
DATA SETS BY PROGRAM AND PROVIDER
Table 59 Youth-
Reported
Parent-
Reported
California Youth Outreach 85.1 86.4
Fresh Lifelines for Youth 82.8 94.9
Gardner Family Care 62.1 93.1
Program-Wide 79.3 87.6
Asian American Community Involvement 78.9 NA
Asian American Recovery Services 73.5 NA
California Youth Outreach 80.3 NA
FLY 83.3 NA
Friends Outside NDA NDA
Gardner 69.9 NA
MACSA 92.8 NA
Program-Wide 79.1 NA
Program-Wide 86.7 85.4
Bill Wilson Center 77.7 87.1
California Youth Outreach 74.7 79.4
CHAC 81.7 86.9
Community Solutions 81.0 84.7
California Youth Outreach Mentoring Program 89.1 86.3
Program-Wide 78.9 84.1
Alum Rock Counseling Center 76.4 89.1
California Youth Outreach 85.1 92.1
Community Solutions 74.5 64.9
EHC Life Builders 90.5 89.5
Program-Wide 81.2 85.4
85.4
Customer Satisfaction, FY 2005-06
Aftercare
Multi-Agency
Assessment
Center
MACSA
Restorative
Justice
Truancy Reduction
Services
Intensive Case Management 86.7
NDA refers to no data available for analysis; NA indicates not applicable to the program.
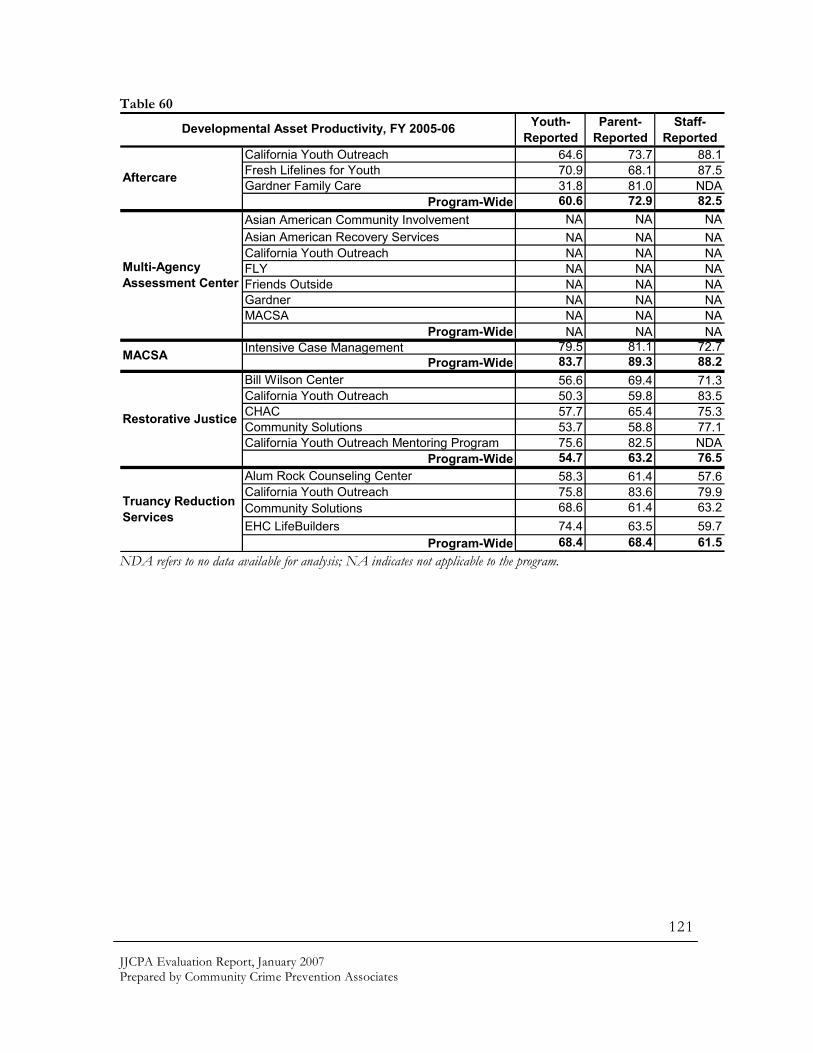
JJCPA Evaluation Report, January 2007 Prepared by Community Crime Prevention Associates
121
Table 60 Youth-
Reported
Parent-
Reported
Staff-
Reported
California Youth Outreach 64.6 73.7 88.1
Fresh Lifelines for Youth 70.9 68.1 87.5
Gardner Family Care 31.8 81.0 NDA
Program-Wide 60.6 72.9 82.5
Asian American Community Involvement NA NA NA
Asian American Recovery Services NA NA NA
California Youth Outreach NA NA NA
FLY NA NA NA
Friends Outside NA NA NA
Gardner NA NA NA
MACSA NA NA NA
Program-Wide NA NA NA
Program-Wide 83.7 89.3 88.2
Bill Wilson Center 56.6 69.4 71.3
California Youth Outreach 50.3 59.8 83.5
CHAC 57.7 65.4 75.3
Community Solutions 53.7 58.8 77.1
California Youth Outreach Mentoring Program 75.6 82.5 NDA
Program-Wide 54.7 63.2 76.5
Alum Rock Counseling Center 58.3 61.4 57.6
California Youth Outreach 75.8 83.6 79.9
Community Solutions 68.6 61.4 63.2
EHC LifeBuilders 74.4 63.5 59.7
Program-Wide 68.4 68.4 61.5
79.5 81.1 72.7
Restorative Justice
Truancy Reduction
Services
Multi-Agency
Assessment Center
Intensive Case Management
Developmental Asset Productivity, FY 2005-06
Aftercare
MACSA
NDA refers to no data available for analysis; NA indicates not applicable to the program.

JJCPA Evaluation Report, January 2007 Prepared by Community Crime Prevention Associates
122
Table 61 Youth-
Reported
Parent-
Reported
Staff-
Reported
California Youth Outreach 80.9 82.0 76.7
Fresh Lifelines for Youth 79.9 88.2 100.0
Gardner Family Care 41.9 66.7 NDA
Program-Wide 67.8 79.6 83.6
Asian American Community Involvement 54.3 NA 77.4
Asian American Recovery Services 44.2 NA 66.6
California Youth Outreach 61.2 NA 63.8
FLY 75.4 NA 92.2
Friends Outside NDA NA NDA
Gardner 43.1 NA NDA
MACSA 72.2 NA 77.8
Program-Wide 57.0 NA 70.4
Program-Wide 77.5 78,5 67.4
Bill Wilson Center 67.6 78.4 83.2
California Youth Outreach 61.0 68.7 80.3
CHAC 66.9 82.4 82.5
Community Solutions 65.6 76.8 86.1
California Youth Outreach Mentoring Program 77.4 80.6 NDA
Program-Wide 65.3 75.9 83.5
Alum Rock Counseling Center 63.8 73.4 62.7
California Youth Outreach 74.5 80.1 64.3
Community Solutions 68.2 74.1 65.8
EHC LifeBuilders 77.6 78.9 46.1
Program-Wide 70.3 76.5 59.4
77.5 78.5 67.4
Program-Specific Productivity, FY 2005-06
Aftercare
MACSA
Restorative Justice
Truancy Reduction
Services
Multi-Agency
Assessment
Center
Intensive Case Management
NDA refers to no data available for analysis; NA indicates not applicable to the program.

JJCPA Evaluation Report, January 2007 Prepared by Community Crime Prevention Associates
123
Table 62
CYO 15,267 $162,343 $10.63
CHAC 10,735 $335,669 $31.27CS 7,784 $261,129 $33.55
BWC 13,337 $180,000 $13.50
CYO - MP 3,913 $99,996 $25.55
Program-Wide 51,036 $1,039,137 $20.36
AACI 1,794 $17,468 $9.74
AARS 1,683 $17,460 $10.37
CYO 5,931 $52,213 $8.80
FLY 3,867 $35,000 $9.05
Friends Outside 516 $9,661 $18.72
Gardner 1,507 $14,289 $9.48
MACSA 1,437 $35,000 $24.36
Program-Wide 16,735 $181,091 $10.82
ARCC 4,910 $94,492 $19.24EHC LifeBuilders 2,573 $43,857 $17.05
CS 1,862 $43,857 $23.55
CYO 3,097 $85,870 $27.73
Program-Wide 12,442 $268,076 $21.55
Gardner 11,340 $186,084 $16.41
CYO 14,788 $378,436 $25.59
FLY 2,414 $38,000 $15.74
Program-Wide 28,542 $602,520 $21.11
Program-Wide 6,458 $379,136 $58.71MACSA
$379,136 $58.71
MAAC
Intensive Case Mgt. 6,458
RJP
Truancy
Aftercare
Units of Service, FY 2005-06
Total UOSAmount
Spent from Cost/Unit of Service

JJCPA Evaluation Report, January 2007 Prepared by Community Crime Prevention Associates
124
Table 63
Table 64
Table 65
Table 66
JJCPA-wide
Gender Female=33% Male=67%
Af. Am.=8% A/PI=10.4% Lat.=55%
Multi.=0.8% Nat. Am.=0.1% White=22%
Other=3.2% Unk.=0.4% DNA=.1%
Up to 9=0.9% 10 to 11=2.3% 12 to 13=12.6%
14 to 15=31% 16 to 17=41% 18 to 19=11.3%
>20=0.2% DNA=0.2%
MediumYouth Developmental Asset Level
Ethnicity
Age
Aftercare
Gender Female=17.4% Male=82.4%
Af. Am.=10.5% A/PI=8.7% Lat.=67.4%
Multi.=0% Nat. Am.=0.6% White=11%
Other=1.7% Unk.=0% DNA=0%
Up to 9=0% 10 to 11=0.6% 12 to 13=2.9%
14 to 15=27.3% 16 to 17=56.4% 18 to 19=12.8%
>20=0% DNA=0%
Medium
Age
Youth Developmental Asset Level
Ethnicity
MAAC
Gender Female=18.7% Male=81.3%
Af. Am.=12.5% A/PI=7.5% Lat.=60.7%
Multi.=0% Nat. Am.=0.2% White=16%
Other=2.4% Unk.=0.2% DNA=0%
Up to 9=0% 10 to 11=0% 12 to 13=2.3%
14 to 15=24.3% 16 to 17=50.7% 18 to 19=21.9%
>20=0.4% DNA=0%
DNA
Ethnicity
Age
Youth Developmental Asset Level
MACSA
Gender Female=39.5% Male=60.5%
Af. Am.=3.1% A/PI=0.4% Lat.=90.4%
Multi.=2.2% Nat. Am.=0% White=3.5%
Other=0.4% Unk.=0% DNA=0%
Up to 9=0% 10 to 11=1.8% 12 to 13=14%
14 to 15=39.9% 16 to 17=37.3% 18 to 19=2.6%
>20=1.8% DNA=2.6%
MediumYouth Developmental Asset Level
Ethnicity
Age
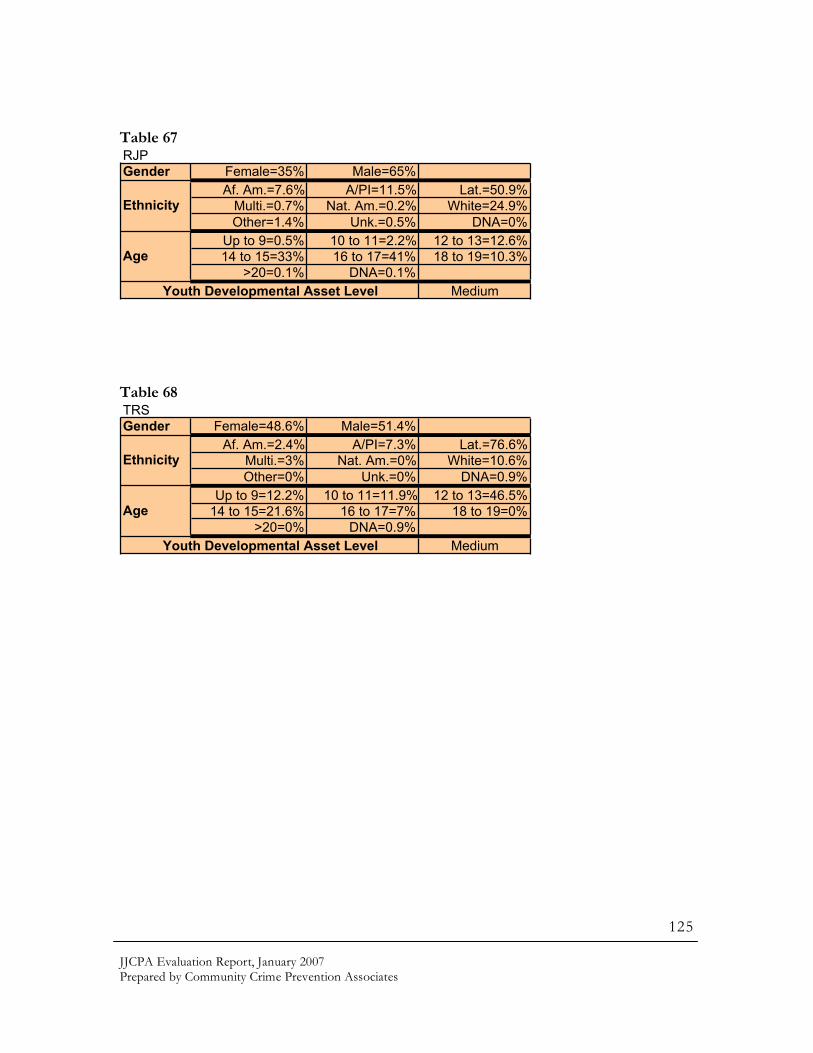
JJCPA Evaluation Report, January 2007 Prepared by Community Crime Prevention Associates
125
Table 67
Table 68
RJP
Gender Female=35% Male=65%
Af. Am.=7.6% A/PI=11.5% Lat.=50.9%
Multi.=0.7% Nat. Am.=0.2% White=24.9%
Other=1.4% Unk.=0.5% DNA=0%
Up to 9=0.5% 10 to 11=2.2% 12 to 13=12.6%
14 to 15=33% 16 to 17=41% 18 to 19=10.3%
>20=0.1% DNA=0.1%
Medium
Ethnicity
Age
Youth Developmental Asset Level
TRS
Gender Female=48.6% Male=51.4%
Af. Am.=2.4% A/PI=7.3% Lat.=76.6%
Multi.=3% Nat. Am.=0% White=10.6%
Other=0% Unk.=0% DNA=0.9%
Up to 9=12.2% 10 to 11=11.9% 12 to 13=46.5%
14 to 15=21.6% 16 to 17=7% 18 to 19=0%
>20=0% DNA=0.9%
Medium
Age
Youth Developmental Asset Level
Ethnicity