juvenile delinquency and justice trends in the united states
TRANSCRIPT

The Handbook of Juvenile Delinquency and Juvenile Justice, First Edition. Edited by Marvin D. Krohn and Jodi Lane. © 2015 John Wiley & Sons, Inc. Published 2015 by John Wiley & Sons, Inc.
In the US, concern about juvenile crime hit the political forefront in the latter part of the twentieth century, and the policies passed during that get‐tough era continue to affect juvenile offenders and the justice system. This chapter briefly discusses the policy and justice system trends of the last few decades, including the way that states tried to curb the incorrectly anticipated rise in juvenile crime and the changes in the number and characteristics of youths who are processed in both the juvenile and adult justice systems. It concludes with a brief discussion of recent policy efforts in American juvenile justice.
Get Tough Movement and Beyond
The US has generally treated juvenile lawbreakers (younger than 18 years old) dif-ferently from criminal adults at least since the early 1800s, when Houses of Refuge were established to hold troubled and delinquent children (see New York State Archives, n.d.). At the end of that century, in 1899, the first separate juvenile justice system was formally established, when Illinois created the first juvenile court designed to focus on the children’s “best interests” and to help troubled juveniles, rather than punish them as adults (see Illinois Juvenile Court Act of 1899). Soon all states had developed separate juvenile justice systems in which most delinquent youths continue to be processed and punished (about 99% of youths who went to court in 2010) (Griffin, Addie, Adams, & Firestine, 2011).
In the 1980s and 1990s, juvenile crime became increasingly worrisome to policy-makers and practitioners in the US, who scrambled to get out ahead of what they
Juvenile Delinquency and Justice Trends in the United States
Jodi Lane
1
0002477916.indd 3 3/24/2015 10:06:34 AM
COPYRIG
HTED M
ATERIAL

4 Jodi Lane
considered to be a rapidly escalating problem (Lipsey et al., 2010). Specifically, murders (in 1993) and violent crime (in 1994) by juveniles, especially with fire-arms, were increasing faster than they were for adults and reached new heights (Puzzanchera & Adams, 2011; Snyder, Sickmund, & Poe‐Yamagata, 1996). Moreover, population projections were that the numbers of teens generally would skyrocket by the early 2000s, prompting some scholars to worry about even more “teen killers” (e.g., Fox, 1996, p. 3) and young “super‐predators” (Bennet, DiIulio, & Walters, 1996, p. 26) preying on the public. In fact, at the time, Bennet et al. (1996, p. 21) warned that because they expected a rise in young criminal men soon, America was “a ticking crime bomb”. Concerns about rising juvenile crime and these warnings of impending doom prompted policymakers and practitioners to enhance their efforts to combat juvenile crime significantly, including “get‐tough” policies, such as increasing the use of gang intervention programs and transfer to adult court as ways to get ahead of the projected coming storm of juvenile crime (Torbet & Szymanksi, 1998).
Even during the get‐tough movement the vast majority of youths remained in the juvenile justice system (Lipsey et al., 2010; Snyder et al., 1996), but the system was modified to make it tougher on young offenders. A few adolescent offenders, often chronic, serious or older ones, continued to be processed in the adult court system, and the get‐tough movement of the 1980s and 1990s significantly increased the number of youths who were transferred to adult court during that period (Griffin et al., 2011; Snyder and Sickmund, 1999).
Because of concerns about rising juvenile crime, state legislatures across the country rewrote their laws to get tougher on juveniles, including expanding provi-sions for transfer to adult court (Torbet & Szymanski, 1998). Before the 1970s, juve-niles primarily were transferred only after a judge had considered their individual cases, but policies changed drastically through the 1990s. Now, 38 states have automatic transfer laws (sending certain offenders automatically to adult court based on age and/or offense), and 15 allow prosecutors the opportunity to make decisions in some or all cases without judicial review (Griffin et al., 2011). Yet, in the last decade, there has been some policy movement in a few states toward reducing the numbers of youths who go to adult court. For example, ten states recently revised their waiver laws, by making it easier to get reverse waiver hearings (to move a case back to juvenile court), increasing the lower age limit at which a youth can be tried as an adult, allowing the possibility that youths who are transferred can be treated as a juvenile in later hearings, and/or reducing the list of offenses that trigger automatic placement in the adult court process (Arya, 2011).
During the 1990s, states also toughened other policies, including increasing the age at which the juvenile justice system could hold youths for dispositional pur-poses, enhancing the use of blended sentences (some combination of juvenile and adult options), boosting the emphasis on public safety and accountability (versus the best interests of the child), reducing confidentiality protections for juvenile proceedings and records, and strengthening victim participation in the process (Torbet & Szymanski, 1998). Although juvenile violent crime has decreased
0002477916.indd 4 3/24/2015 10:06:35 AM
Juvenile Delinquency and Justice Trends in the United States 5
significantly since the mid‐1990s, most of the get‐tough laws remain on the books (Griffin et al., 2011). Delinquent youths in the US primarily face processing and punishment in a tougher juvenile justice system. Currently, the juvenile system focuses on both rehabilitation and public safety as goals, and emphasizes the use of evidence‐based treatment programming, or approaches that have been shown to be effective through evaluation research (Brown, 2012). Now we turn to specific information about who goes through the system and what happens to them when they get there.
Juvenile Crime and Punishment Trends: The Statistics
Crime
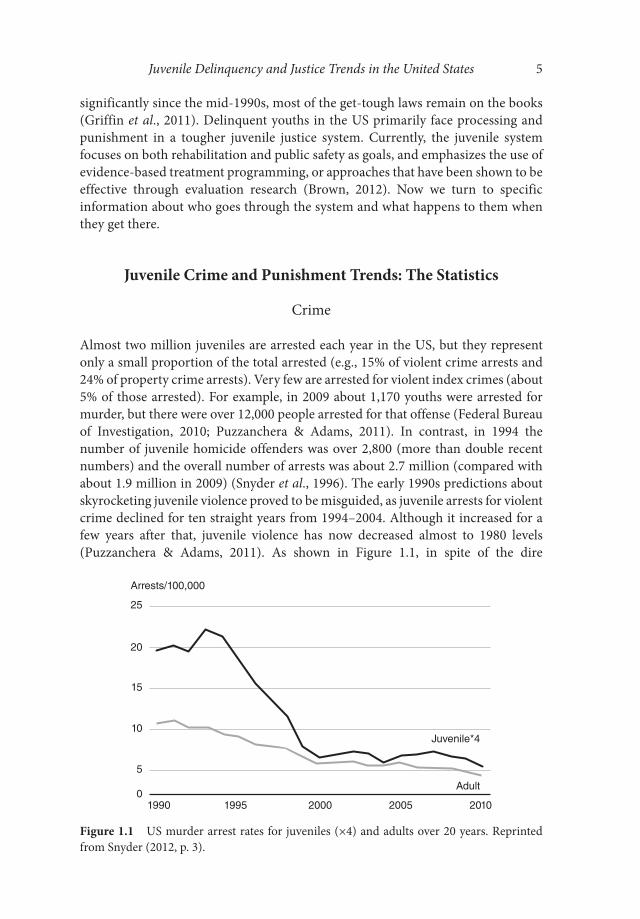
Almost two million juveniles are arrested each year in the US, but they represent only a small proportion of the total arrested (e.g., 15% of violent crime arrests and 24% of property crime arrests). Very few are arrested for violent index crimes (about 5% of those arrested). For example, in 2009 about 1,170 youths were arrested for murder, but there were over 12,000 people arrested for that offense (Federal Bureau of Investigation, 2010; Puzzanchera & Adams, 2011). In contrast, in 1994 the number of juvenile homicide offenders was over 2,800 (more than double recent numbers) and the overall number of arrests was about 2.7 million (compared with about 1.9 million in 2009) (Snyder et al., 1996). The early 1990s predictions about skyrocketing juvenile violence proved to be misguided, as juvenile arrests for violent crime declined for ten straight years from 1994–2004. Although it increased for a few years after that, juvenile violence has now decreased almost to 1980 levels (Puzzanchera & Adams, 2011). As shown in Figure 1.1, in spite of the dire
Arrests/100,000
25
20
15
10
5
01990 1995 2000 2005 2010
Juvenile*4
Adult
Figure 1.1 US murder arrest rates for juveniles (×4) and adults over 20 years. Reprinted from Snyder (2012, p. 3).
0002477916.indd 5 3/24/2015 10:06:35 AM
6 Jodi Lane
predictions, the juvenile arrest rate for murder declined significantly after 1990, dropping at a much steeper rate than it did for adults. Juvenile arrest rates have also decreased over that 20‐year period for forcible rape, robbery, aggravated assault, burglary, motor vehicle theft, weapons law violations, and drug dealing, although juvenile arrests for drug possession and simple assault have not declined compared with 1990 numbers (Snyder, 2012).
Males represent about 70% of arrests, and minorities are disproportionately arrested, especially for violent crimes. African‐Americans represented 67% of rob-bery offenders and 58% of murder offenders, but only 37% of burglary and 25% of drug abuse violations in 2009 (Puzzanchera & Adams, 2011). African‐Americans account for only about 13% of the US population, and 16% of the juvenile population (Knoll & Sickmund, 2012; US Census Bureau, 2010).
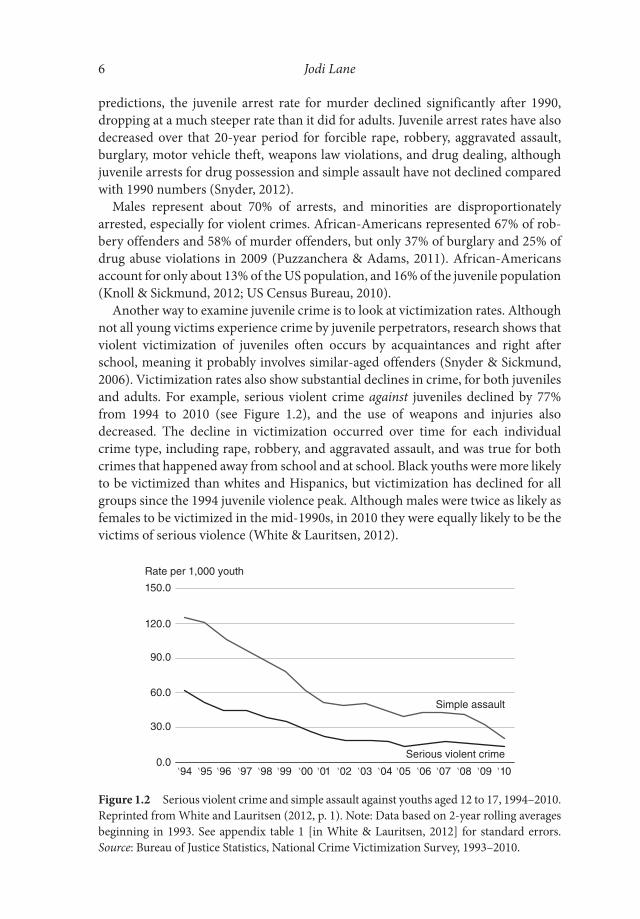
Another way to examine juvenile crime is to look at victimization rates. Although not all young victims experience crime by juvenile perpetrators, research shows that violent victimization of juveniles often occurs by acquaintances and right after school, meaning it probably involves similar‐aged offenders (Snyder & Sickmund, 2006). Victimization rates also show substantial declines in crime, for both juveniles and adults. For example, serious violent crime against juveniles declined by 77% from 1994 to 2010 (see Figure 1.2), and the use of weapons and injuries also decreased. The decline in victimization occurred over time for each individual crime type, including rape, robbery, and aggravated assault, and was true for both crimes that happened away from school and at school. Black youths were more likely to be victimized than whites and Hispanics, but victimization has declined for all groups since the 1994 juvenile violence peak. Although males were twice as likely as females to be victimized in the mid‐1990s, in 2010 they were equally likely to be the victims of serious violence (White & Lauritsen, 2012).
Rate per 1,000 youth
Simple assault
Serious violent crime
150.0
120.0
90.0
60.0
30.0
0.0‵94 ‵95 ‵96 ‵97 ‵98 ‵99 ‵00 ‵01 ‵02 ‵03 ‵04 ‵05 ‵06 ‵07 ‵08 ‵09 ‵10
Figure 1.2 Serious violent crime and simple assault against youths aged 12 to 17, 1994–2010. Reprinted from White and Lauritsen (2012, p. 1). Note: Data based on 2‐year rolling averages beginning in 1993. See appendix table 1 [in White & Lauritsen, 2012] for standard errors. Source: Bureau of Justice Statistics, National Crime Victimization Survey, 1993–2010.
0002477916.indd 6 3/24/2015 10:06:35 AM

Juvenile Delinquency and Justice Trends in the United States 7
Juvenile and adult court
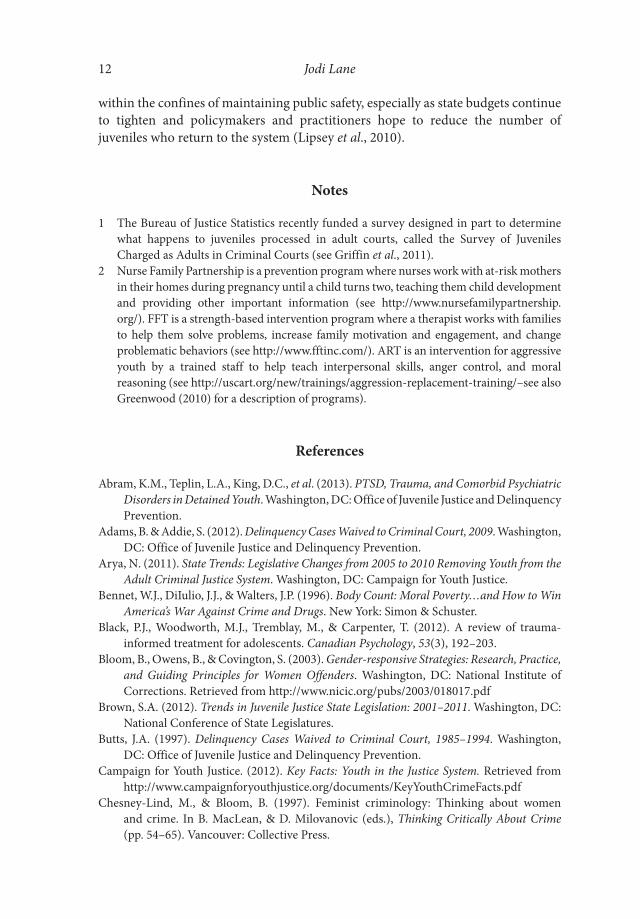
Recent numbers show that about 1.5 million cases are handled by juvenile courts in the US in a year, meaning that only about a quarter of arrestees are diverted from formal processing. The number of cases in court has declined since the mid‐1990s by 20%, but clearly not as steeply as juvenile crime itself. Interestingly, public‐order court cases continued to increase over this period, but person and drug cases remained relatively stable. Property cases, however, have steadily declined since 1985 (almost 20%). An examination of trends since the 1960s generally shows increases in cases through the mid‐1990s, but decreases in the last few years (see Figure 1.3) (Knoll & Sickmund, 2012).
As shown for crime, generally, minorities are overrepresented in juvenile court. While black youths were 16% of the juvenile population, they represented about 34% of the cases that went to court, and 41% of the person cases. Youths under 16 were involved in about half of the cases overall (52%), but 59% of person cases. Finally, males accounted for 72% of offenders in juvenile court, although the proportion of girls in court has been increasing in recent decades (from 19% in 1985 to 28% in 2009). Most (59%) of those who went to court were adjudicated delinquent (the term for conviction in juvenile court) (Knoll & Sickmund, 2012).
Counting the number of youths transferred to adult court in the US is compli-cated, because there are three ways a youth can be moved to the adult system, and states do not uniformly count those who face each process or their outcomes. Youths can be judicially waived (a judge reviews the case in a hearing and makes the decision), sent there through direct file by a prosecutor (where there is no judicial review), or legislatively waived (where statute requires certain juvenile offenders – by age and/or offense – automatically go to adult court). In 13 states all 16‐ and/or 17‐year‐olds go to adult court automatically via statute, and there may be about
Number of cases
Total delinquency
2,000,000
1,600,000
1,200,000
800,000
400,000
061 65 69 73 77 81 85 89 93 97 01 05 09
Figure 1.3 Trends in total number of cases in juvenile court. Reprinted from Knoll and Sickmund (2012, p. 1).
0002477916.indd 7 3/24/2015 10:06:35 AM

8 Jodi Lane
175,000 youths in adult court who are statutorily excluded from juvenile court based on age alone (see Griffin et al., 2011).
The best numbers available over time show the number of youths waived by judges. As mentioned above, transfers to adult court significantly increased dur-ing the mid–late 1990s, when the get‐tough approach was in full swing. The total number waived to adult court was highest in 1994, when 12,100 cases were sent to adult court by judges across the US (Puzzanchera, 2001). By 2009, the number had dropped about 45% to around 7,600, and the rate of transfer had declined (about 14 of every 1000 cases in 1994, to about 9 of every 1000 cases in 2009) (Adams & Addie, 2012; Butts, 1997; see Figure 1.4). Yet, the advocacy organiza-tion Campaign for Youth Justice (2012) estimates that about 250,000 youths are sent through the adult system when all mechanisms of transfer are considered. Although theoretically waivers are supposed to apply to the most serious cases, only about half of those transferred in 2009 had committed person offenses (Adams & Addie, 2012).
Males (89% of cases) are much more likely than females to be transferred. For most of the time period since panic about juvenile offenders erupted, black males were much more likely to be transferred than were white males, but in 2009 they faced an equal likelihood of being waived.
Sanctions
The most common disposition for juvenile offenders in the juvenile system is probation (60% of cases), which typically is coupled with other conditions (such as treatment, restitution, or community service). About a quarter of cases (27%) are ordered into residential placement, which means removal from the home into
Cases judicially waived to criminal court
Total delinquency
14,000
12,000
10,000
8,000
6,000
4,000
2,000
085 87 89 91 93 95 97 99 01 03 05 07 09
Figure 1.4 Number of cases judicially waived to criminal court. Reprinted from Adams and Addie (2012, p. 1).
0002477916.indd 8 3/24/2015 10:06:35 AM

Juvenile Delinquency and Justice Trends in the United States 9
any of a variety of programs (group homes, camps, wilderness programs, locked institutions, etc.). The remainder receives a disposition other than probation or institutionalization (Knoll & Sickmund, 2012).
The number of youths in residential placement has decreased 33% since 1997, when juvenile crime was still at the political forefront (Hockenberry, 2013). In 2010, there were over 79,000 youths in residential placement in the US, and the over-whelming majority (about 86%) were there for delinquency (or crimes that would be illegal for adults also). The largest group was person offenders (37%), followed by property offenders (25%), and then public order (11%) and drug offenses (7%). Very few (5%) were locked up for offenses that would not be crimes for adults (skipping school, curfew violations, running away, incorrigibility, etc.) (see Figure 1.5). The remaining few were held for other reasons, such as abuse or mental concerns. In addition, some offenders are detained in custody prior to their court hearings (over 20,000), and combined with those who were committed post‐adjudication (convic-tion), the rate in custody was 225/100,000 juveniles. Again, males (87% of those held) and minorities (only 32% held were white) were much more likely to be in custody. Data show that males and juveniles who committed person offenses are held longer than others (Hockenberry, 2013).
Because of the problems with tracking transfers to adult court (e.g., poor statistics regarding the numbers waived in ways other than by a judge), it is diffi-cult to document what happens to these juveniles once they go through court. In 2012, there were about 4,600 youths held as adults in jails (Minton, 2013), and in 2010, there were 2,295 youths under 18 in prison (Guerino, Harrison, & Sabol, 2012). Yet, there are no good national data on how many juveniles sentenced to adult prison remain there after they turn 18, how long they remain in custody, or what happens to them once they are released. There are also no national data on how many of those transferred to adult court are sentenced to other sanctions like probation or sent back to the juvenile system for sanctions, or how they do while being sanctioned or after (see Singer, 2003).1
Offenders in juvenile facilities120,000
100,000
80,000
60,000
40,000
20,000
10/1997 10/1999 10/2001 10/2003
Census date
Status offenders
Delinquents
Juvenile offendersTotal
02/2006 10/2007 02/20100
Figure 1.5 Offenders in juvenile facilities, 1997–2010. Reprinted from Hockenberry (2013, p. 5).
0002477916.indd 9 3/24/2015 10:06:35 AM

10 Jodi Lane
Recent Trends in Juvenile Justice
Because later chapters address trends in more detail, this section only briefly describes a few of the major juvenile justice efforts now underway in the US. One of the biggest trends in American juvenile justice (and justice more generally) is the push for “ evidence‐based” approaches. According to Greenwood (2010, p. 1), “the term ‘evidence‐based practice’ refers to a program or strategy that has been evaluated through rigorous scientific study using experimental or quasi‐experimental methods.” Greenwood (2010, p. 1) distinguished between what he called “brand‐name pro-grams” and “strategies”. Brand‐name programs are those developed by specific researchers over time through research and replication, and they often provide written manuals and/or technical assistance to ensure that practitioners maintain fidelity to the program design. Examples of what Greenwood (2010, p. 9) calls “proven programs” being used in the US include Nurse Family Partnership, Functional Family Therapy (FFT), and Aggression Replacement Training (ART).2 According to Greenwood (2010), strategies are more general approaches that have been shown in studies, such as meta‐analyses, to be effective. Examples of these include cognitive‐behavioral therapy, mentoring, teen court, social skills training, and sex offender treatment (Greenwood, 2010).
Another focal point of treatment policy has been to provide gender‐specific ser-vices, after research showed that the needs and problems of girls differed significantly from those of boys (Chesney‐Lind & Bloom, 1997), and scholars argued that girls needed gender‐specific programming (e.g., Bloom, Owens, & Covington, 2003; Greene, Peters, & Associates, 1998). The goal of this type of programming is to take into account the needs of girls and use treatment programs that are more suited to their psychological, social and emotional states (Greene, Peters, & Associates, 1998). At least five states – Connecticut, Florida, Hawaii, Minnesota, and Oregon – have passed statutes requiring gender‐specific programming (Brown, 2012), but other states are also implementing these types of programs at different points in the system.
In line with the push for evidence‐based services, an additional focus has been on addressing the mental health needs of juvenile offenders. Studies show that trauma is a serious issue for youths in the juvenile justice system. For example, the Northwestern Juvenile Project, which is a longitudinal study of youths in detention in Chicago, found that almost 93% of youths had been traumatized, and over half had faced trauma at least six times, often from witnessing violence. About 10% had post‐traumatic stress disorder (Abram et al., 2013). One relatively new approach is to use what is called “trauma‐informed” care, which hopes to consider the impact of trauma and ensure that treatment does not intensify problems or retraumatize cli-ents (Black, Woodworth, Tremblay, & Carpenter, 2012, p. 192; Miller & Najavits, 2012). States have made some progress in addressing mental health needs of clients. For example, Washington recently allowed counties to increase the sales tax to fund mental health courts, and Idaho also developed mental health courts for youths. Other states, such as Minnesota and Nevada, have focused upon improving mental health assessments that are conducted in the system (Brown, 2012).
0002477916.indd 10 3/24/2015 10:06:35 AM

Juvenile Delinquency and Justice Trends in the United States 11
Due to children’s relative immaturity to adults, there are also efforts to improve their experiences in the system and to ensure due process, thereby moving back to protecting the child. One critical issue in the scholarly literature is whether juveniles have the mental maturity, or competence, to stand trial (e.g., whether they can understand what is happening). Consequently, seven states have allowed develop-mental incompetence as a consideration in court (see O’Donnell & Gross, 2012). States have also focused on ensuring better defense counsel (e.g., requiring that they be given competent counsel, including youths who cannot afford to hire any them-selves). In addition, states have been working to help youths avoid the system entirely, by increasing diversion and community‐based services. Interestingly, after many confidentiality safeguards were removed during the get‐tough movement, states have now begun reinstituting protections. Since 2007, at least 10 states have done so (Brown, 2012).
Another trend that shows evidence of movement away from the get‐tough approach is that some states are expanding the upper age limit of juvenile court jurisdiction (i.e., reducing the number of youths automatically tried in adult court). For example, in 2007, Connecticut raised the upper age from 16 to 18, and in 2009, Illinois raised the age of jurisdiction from 17 to 18 for juvenile misdemeanants. In 2010, Oklahoma allowed for youths in the first half of their eighteenth year to stay in the juvenile system if they committed a misdemeanor. As mentioned before, some states are changing laws pertaining to transfer to adult court. For example, in 2007 Virginia required that a youth be convicted in adult court (not just tried) before being considered as an adult for all future cases. In 2008, Maine allowed younger youth (15 and under) to start serving adult prison sentences in juvenile facilities, and in 2012 Colorado raised the minimum age to be tried as an adult from 14 to 16 (Brown, 2012).
Finally, like in the system more generally, there are increased efforts to improve the reentry experiences of youths returning from correctional programming in hopes of reducing recidivism and improving life chances. There are about 100,000 juveniles released back into the community each year that need help transitioning. Some states (e.g., Oklahoma and Virginia) have passed laws providing mental health services, substance abuse treatment, and other services to youths returning home. Others have made other programs available, such as healthcare, probation program-ming, and reentry courts (Brown, 2012).
In conclusion, the last 30 or more years have brought major changes for how juvenile offenders are handled in the US. The 1980s and 1990s were riddled with concerns about rising juvenile crime, which led to major get‐tough reforms in an effort to get ahead of the anticipated increase in juvenile crime and violence. Yet the warnings were wrong, and the last decade or so has seen declines in crime and juvenile justice system clients. In the last decade, states have slowly begun to make efforts toward reducing the negative effects of the get‐tough movement on both offenders and the system. That is, states are starting to increase protections for chil-dren and improve rehabilitative services. Consequently, it is likely that the near future will include even more efforts to move back towards the idea of rehabilitation
0002477916.indd 11 3/24/2015 10:06:35 AM
12 Jodi Lane
within the confines of maintaining public safety, especially as state budgets continue to tighten and policymakers and practitioners hope to reduce the number of juveniles who return to the system (Lipsey et al., 2010).
Notes
1 The Bureau of Justice Statistics recently funded a survey designed in part to determine what happens to juveniles processed in adult courts, called the Survey of Juveniles Charged as Adults in Criminal Courts (see Griffin et al., 2011).
2 Nurse Family Partnership is a prevention program where nurses work with at‐risk mothers in their homes during pregnancy until a child turns two, teaching them child development and providing other important information (see http://www.nursefamilypartnership.org/). FFT is a strength‐based intervention program where a therapist works with families to help them solve problems, increase family motivation and engagement, and change problematic behaviors (see http://www.fftinc.com/). ART is an intervention for aggressive youth by a trained staff to help teach interpersonal skills, anger control, and moral reasoning (see http://uscart.org/new/trainings/aggression‐replacement‐training/–see also Greenwood (2010) for a description of programs).
References
Abram, K.M., Teplin, L.A., King, D.C., et al. (2013). PTSD, Trauma, and Comorbid Psychiatric Disorders in Detained Youth. Washington, DC: Office of Juvenile Justice and Delinquency Prevention.
Adams, B. & Addie, S. (2012). Delinquency Cases Waived to Criminal Court, 2009. Washington, DC: Office of Juvenile Justice and Delinquency Prevention.
Arya, N. (2011). State Trends: Legislative Changes from 2005 to 2010 Removing Youth from the Adult Criminal Justice System. Washington, DC: Campaign for Youth Justice.
Bennet, W.J., DiIulio, J.J., & Walters, J.P. (1996). Body Count: Moral Poverty…and How to Win America’s War Against Crime and Drugs. New York: Simon & Schuster.
Black, P.J., Woodworth, M.J., Tremblay, M., & Carpenter, T. (2012). A review of trauma‐informed treatment for adolescents. Canadian Psychology, 53(3), 192–203.
Bloom, B., Owens, B., & Covington, S. (2003). Gender‐responsive Strategies: Research, Practice, and Guiding Principles for Women Offenders. Washington, DC: National Institute of Corrections. Retrieved from http://www.nicic.org/pubs/2003/018017.pdf
Brown, S.A. (2012). Trends in Juvenile Justice State Legislation: 2001–2011. Washington, DC: National Conference of State Legislatures.
Butts, J.A. (1997). Delinquency Cases Waived to Criminal Court, 1985–1994. Washington, DC: Office of Juvenile Justice and Delinquency Prevention.
Campaign for Youth Justice. (2012). Key Facts: Youth in the Justice System. Retrieved from http://www.campaignforyouthjustice.org/documents/KeyYouthCrimeFacts.pdf
Chesney‐Lind, M., & Bloom, B. (1997). Feminist criminology: Thinking about women and crime. In B. MacLean, & D. Milovanovic (eds.), Thinking Critically About Crime (pp. 54–65). Vancouver: Collective Press.
0002477916.indd 12 3/24/2015 10:06:35 AM

Juvenile Delinquency and Justice Trends in the United States 13
Federal Bureau of Investigation. (2010). Crime in the United States, 2009. Clarksburg, WV: Federal Bureau of Investigation.
Fox, J.A. (1996). Trends in Juvenile Violence: A Report to the United States Attorney General on Current and Future Rates of Juvenile Offending. Washington, DC: Bureau of Justice Statistics.
Greene, Peters, & Associates (1998). Guiding Principles for Promising Female Programming: An Inventory of Best Practices. Washington, DC: Office of Juvenile Justice and Delinquency Prevention.
Greenwood, P. (2010). Preventing and Reducing Youth Crime and Violence: Using Evidence‐Based Practices. Sacramento, CA: Governor’s Office of Gang and Youth Violence Policy. Retrieved from http://www.nursefamilypartnership.org/assets/PDF/Journals‐and‐Reports/ CA_GOGYVP_Greenwood_1‐27‐10
Griffin, P., Addie, S., Adams, B., & Firestine, K. (2011). Trying Juveniles as Adults: An Analysis of State Transfer Laws and Reporting. Washington, DC: Office of Juvenile Justice and Delinquency Prevention.
Guerino, P., Harrison, P.M., & Sabol, W.J. (2012). Prisoners in 2011. Washington, DC: Bureau of Justice Statistics.
Hockenberry, S. (2013). Juveniles in Residential Placement, 2010. Washington, DC: Office of Juvenile Justice and Delinquency Prevention.
Illinois Juvenile Court Act of 1899, 41st General Assembly Laws, Regular Session (Illinois 1899).
Knoll, C., & Sickmund, M. (2012). Delinquency Cases in Juvenile Court, 2009. Washington, DC: Office of Juvenile Justice and Delinquency Prevention.
Lipsey, M.W., Howell, J.C., Kelly, M.R., et al. (2010). Improving the Effectiveness of Juvenile Justice Programs: A New Perspective on Evidence‐Based Practice. Washington, DC: Center for Juvenile Justice Reform. Retrieved from http://www.cbjjfl.org/userfiles/files/documents/publications/1‐3‐11%20Updates/Center%20for%20JJ%20Reform% 20Improving%20Effectivenss%20of%20JJ%20Programs.pdf
Miller, N.A., & Najavits, L.M. (2012). Creating trauma‐informed correctional care: A balance of goals and environment. European Journal of Psychotraumatology, 3, 17246. doi:10.3402/ejpt.v3i0.17246
Minton, T.D. (2013). Jail Inmates at Midyear 2012 – Statistical Tables. Washington, DC: Bureau of Justice Statistics.
New York State Archives. (n.d.). New York House of Refuge: A Brief History. Retrieved from http://www.archives.nysed.gov/a/research/res_topics_ed_reform_history.shtml
O’Donnell, P.C., & Gross, B. (2012). Developmental incompetence to stand trial in juvenile courts. Journal of Forensic Sciences, 57(4), 989–996.
Puzzanchera, C.M. (2001). Delinquency Cases Waived to Criminal Court, 1989–1998. Washington, DC: Office of Juvenile Justice and Delinquency Prevention.
Puzzanchera, C., & Adams, B. (2011). Juvenile Arrests 2009. Washington, DC: Office of Juvenile Justice and Delinquency Prevention.
Singer, S.I. (2003). Incarcerating juveniles into adulthood: Organizational fields of knowledge and the back end of waiver, Youth Violence and Juvenile Justice, 1(2), 115–127.
Snyder, H.N. (2012). Arrest in the United States, 1990–2010. Washington, DC: Bureau of Justice Statistics.
Snyder, H.N., & Sickmund, M. (1999). Juvenile Offenders and Victims: 1999 National Report. Washington, DC: Office of Juvenile Justice and Delinquency Prevention.
0002477916.indd 13 3/24/2015 10:06:35 AM

14 Jodi Lane
Snyder, H.N., & Sickmund, M. (2006). Juvenile Offenders and Victims: 2006 National Report. Washington, DC: Office of Juvenile Justice and Delinquency Prevention.
Snyder, H.N., Sickmund, M., & Poe‐Yamagata, E. (1996). Juvenile Offenders and Victims: 1996 Update on Violence. Washington, DC: Office of Juvenile Justice and Delinquency Prevention.
Torbet, P., & Szymanski, L. (1998). State Legislative Responses to Violent Juvenile Crime: 1996–1997 Update. Washington, DC: Office of Juvenile Justice and Delinquency Prevention.
US Census Bureau. (2010). 2010 Modified Race Data File. Retrieved from http://www.census.gov/popest/research/modified.html
White, N., & Lauritsen, J.L. (2012). Violent Crime against Youth, 1994–2010. Washington, DC: Bureau of Justice Statistics.
0002477916.indd 14 3/24/2015 10:06:35 AM