justifying a gep stack height taller than the epa formula height
TRANSCRIPT
Justifying a GEP Stack Height Taller
than the EPA Formula Height
Ron Petersen, PhD, CCM, FASHRAE
Anke Beyer-Lout, MS
CPP, Inc.
Tom Emond
Expera Specialty Solutions
AWMA’s 108th Annual Conference and Exhibition, Raleigh, NC
Initial Polling Questions
• EPA allows GEP stack heights taller than 65m?
True, or
False
• EPA allows GEP stack heights taller than the formula height?
True, or
False
• Why would you want taller stacks?
Compliance versus non-compliance
Optimize fuel use
Minimize emission control
I wouldn’t they are too expensive
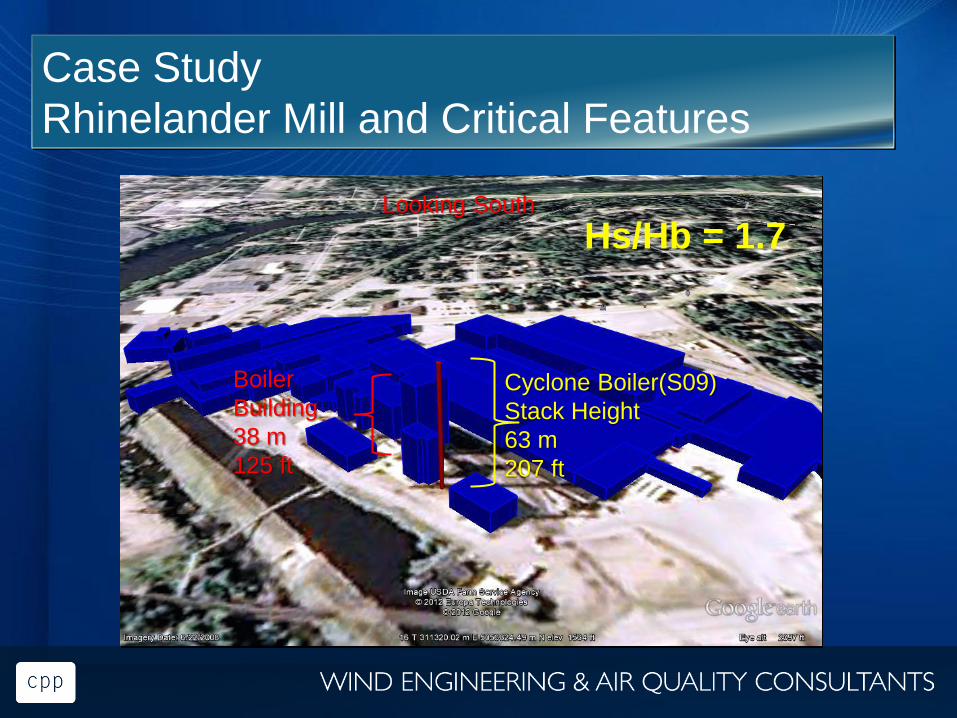
Case Study
Rhinelander Mill and Critical Features
Cyclone Boiler(S09)
Stack Height
63 m
207 ft
Boiler
Building
38 m
125 ft
Looking South
Hs/Hb = 1.7

Rhinelander Mill and Monitor
Looking Northeast
SO2 Monitor
Stack S09
Building Corner Upwind
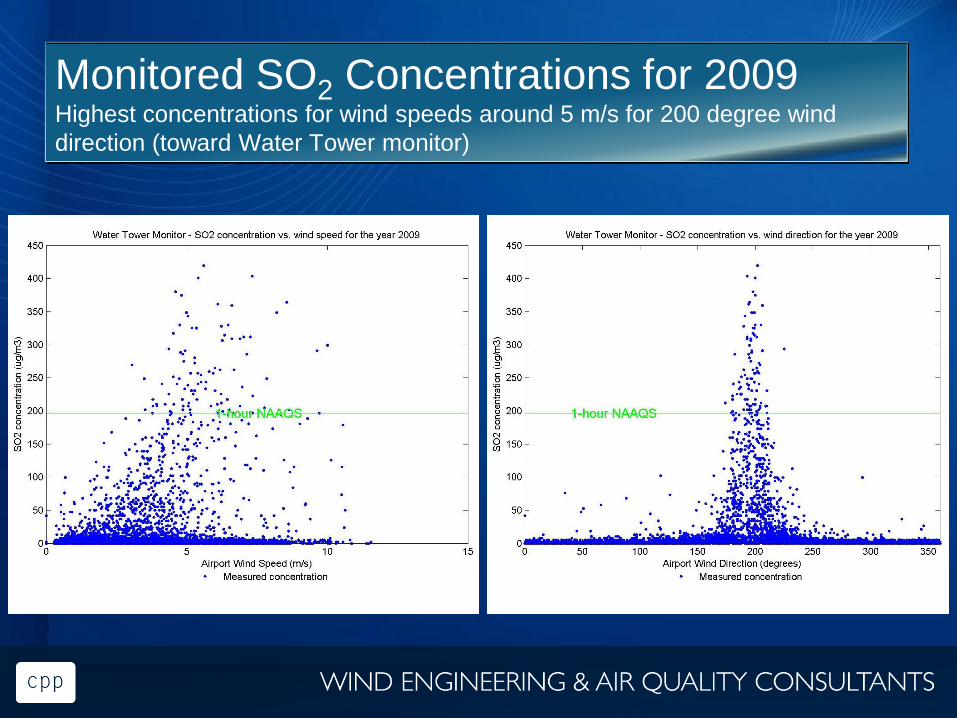
Monitored SO2 Concentrations for 2009 Highest concentrations for wind speeds around 5 m/s for 200 degree wind
direction (toward Water Tower monitor)
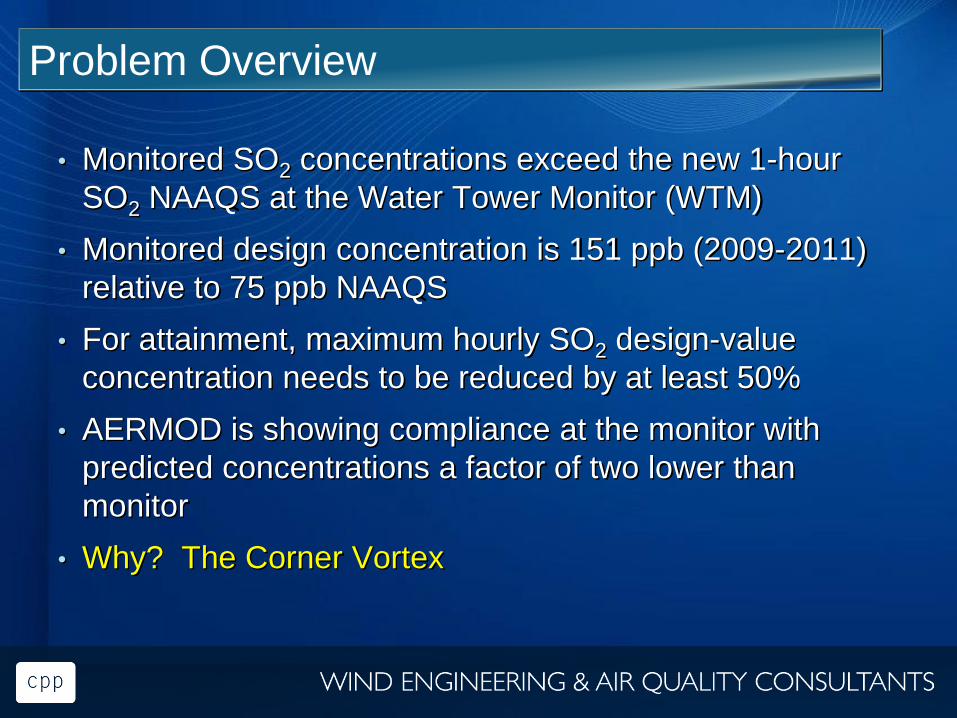
Problem Overview
• Monitored SO2 concentrations exceed the new 1-hour
SO2 NAAQS at the Water Tower Monitor (WTM)
• Monitored design concentration is 151 ppb (2009-2011)
relative to 75 ppb NAAQS
• For attainment, maximum hourly SO2 design-value
concentration needs to be reduced by at least 50%
• AERMOD is showing compliance at the monitor with
predicted concentrations a factor of two lower than
monitor
• Why? The Corner Vortex
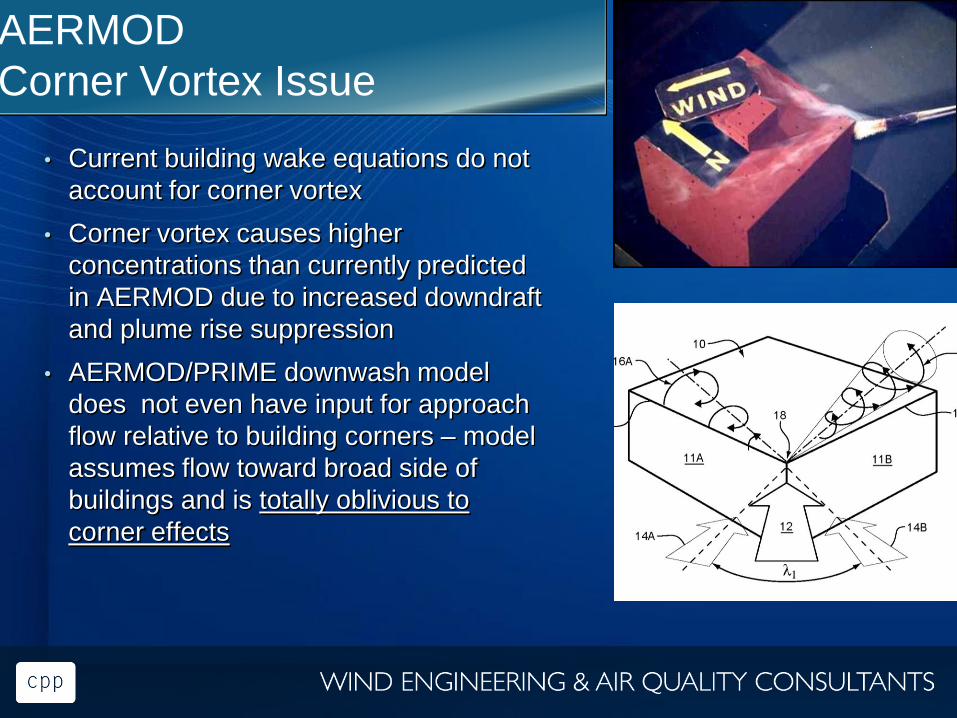
AERMOD
Corner Vortex Issue
• Current building wake equations do not
account for corner vortex
• Corner vortex causes higher
concentrations than currently predicted
in AERMOD due to increased downdraft
and plume rise suppression
• AERMOD/PRIME downwash model
does not even have input for approach
flow relative to building corners – model
assumes flow toward broad side of
buildings and is totally oblivious to
corner effects

Corner Vortex Issues – EPA Research
8
Note increased effect for 45º
approach flow
Hs/Hb

Possible Solutions
• Reduce emission by 50% based on monitored
results >> not a good solution
• Extend stack to formula GEP stack height of 75
m plus emission control: how do you determine
since AERMOD doesn’t work?
• Extend stack to actual GEP stack height plus
emission control if needed: how to determine
since AERMOD doesn’t work?
Issues for Consideration
• The need to find a tool, other than AERMOD, to
show compliance with the 1-hour SO2 standard
for the final design configuration (emission rate
and stack height)
• The need to develop a site-specific GEP stack
height given the excessive downwash caused
by the corner vortex.
Overall Plan
• Determine actual GEP stack height using wind
tunnel modeling >>>> Subject of this paper
• Demonstrate compliance for final design
configuration >>>> Future paper
• HYWINMOD (CPP model utilizing output from
wind tunnel + AERMOD) >> complete but EPA
approval pending
• AERMOD w/o downwash plus wind tunnel
downwash factor >> likely approval
11

40 CFR 51.110 (ii) Defines GEP stack
height to be the greater of:
• 65 meters;
• the formula height (Hb+1.5 L), or
• For a 40 m cube, GEP = 100 m > 65 m!!!
• The height determined by a wind tunnel modeling study – Will be taller than the formula!!
Up to 3.25 times the building height versus 2.5 for the formula
Typically 2 times the nearby terrain height
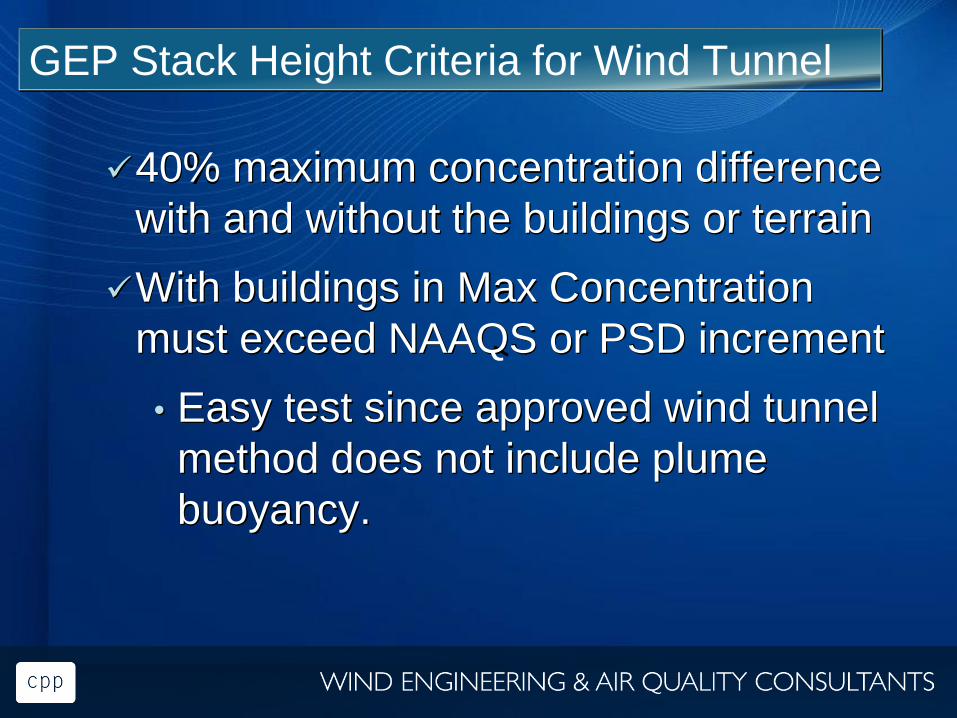
GEP Stack Height Criteria for Wind Tunnel
40% maximum concentration difference
with and without the buildings or terrain
With buildings in Max Concentration
must exceed NAAQS or PSD increment
• Easy test since approved wind tunnel
method does not include plume
buoyancy.
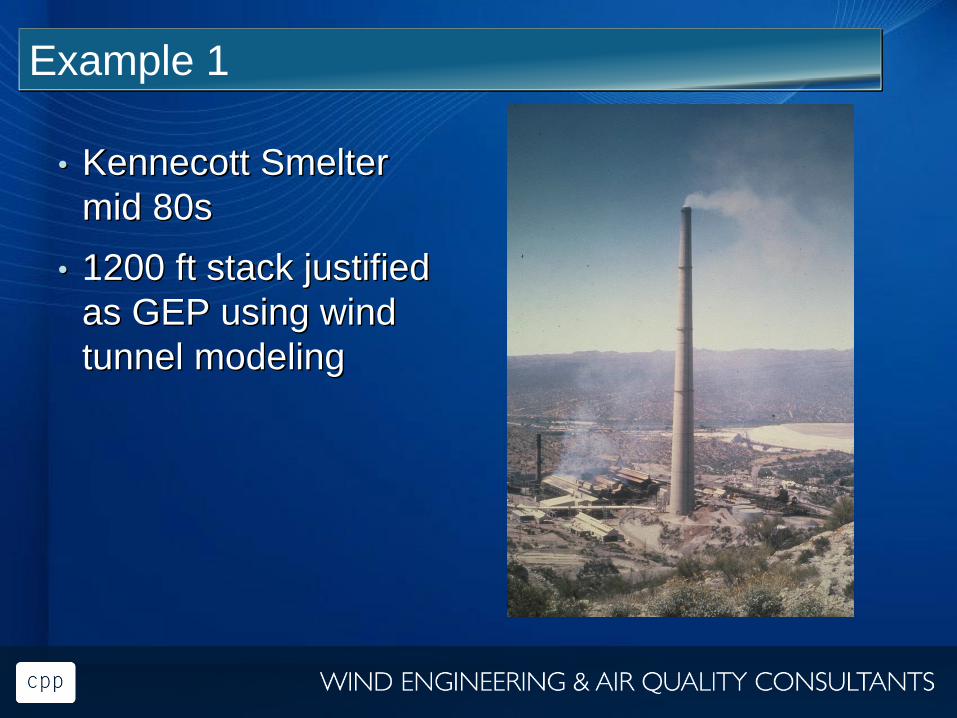
Example 1
• Kennecott Smelter
mid 80s
• 1200 ft stack justified
as GEP using wind
tunnel modeling

Example 2:
• Titus Generating Station, Schuylkill River about 3 km south of
Reading, Pennsylvania
• 175 m stack height justified as GEP using wind tunnel
modeling, 1995
175m
100m
65m
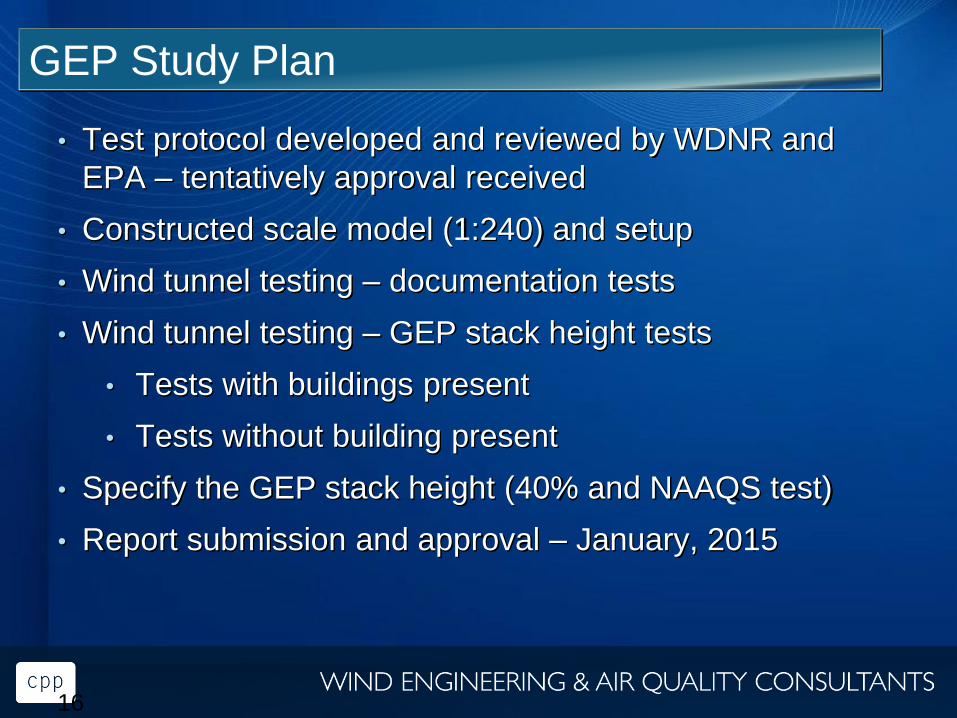
GEP Study Plan
• Test protocol developed and reviewed by WDNR and
EPA – tentatively approval received
• Constructed scale model (1:240) and setup
• Wind tunnel testing – documentation tests
• Wind tunnel testing – GEP stack height tests
• Tests with buildings present
• Tests without building present
• Specify the GEP stack height (40% and NAAQS test)
• Report submission and approval – January, 2015
16
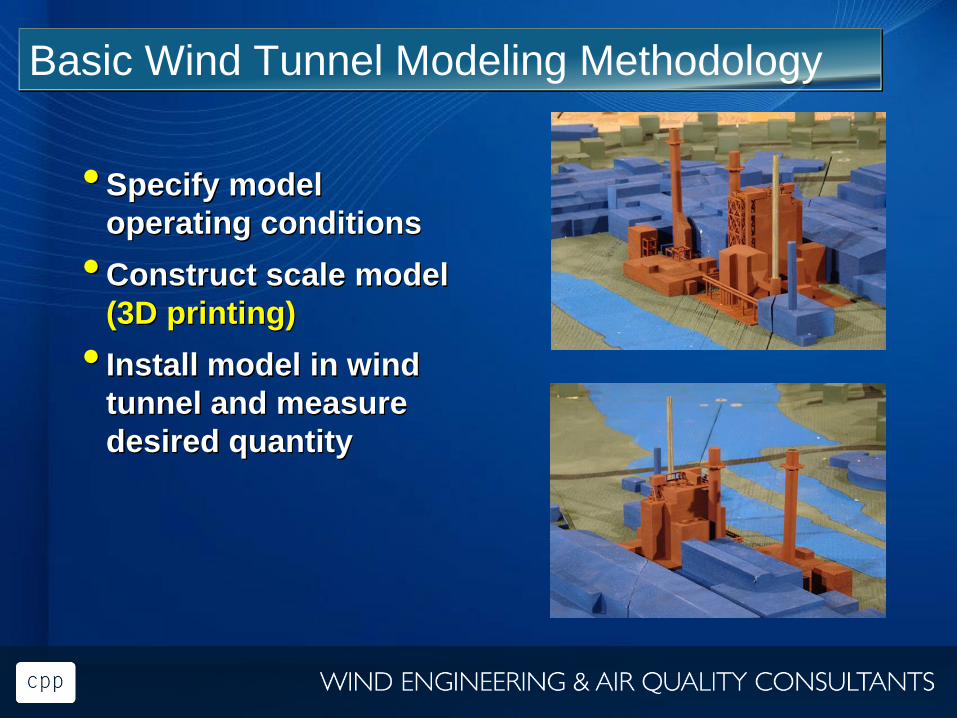
Basic Wind Tunnel Modeling Methodology
•Specify model
operating conditions
•Construct scale model
(3D printing)
• Install model in wind
tunnel and measure
desired quantity
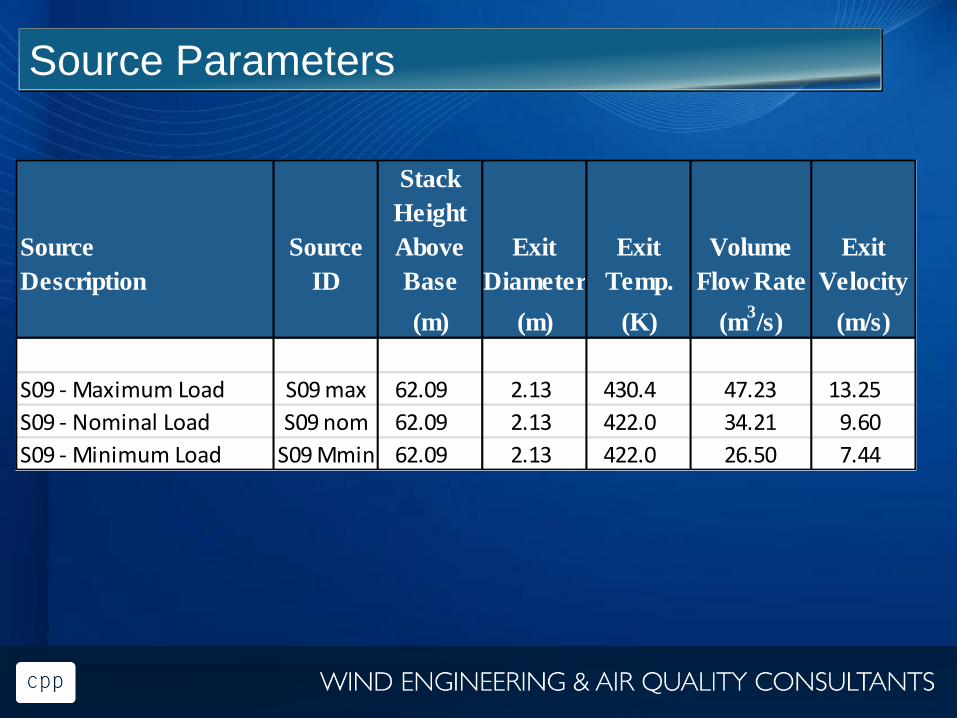
Source Parameters
Stack
Height
Source Source Above Exit Exit Volume Exit
Description ID Base Diameter Temp. Flow Rate Velocity
(m) (m) (K) (m3/s) (m/s)
S09 - Maximum Load S09 max 62.09 2.13 430.4 47.23 13.25
S09 - Nominal Load S09 nom 62.09 2.13 422.0 34.21 9.60
S09 - Minimum Load S09 Mmin 62.09 2.13 422.0 26.50 7.44
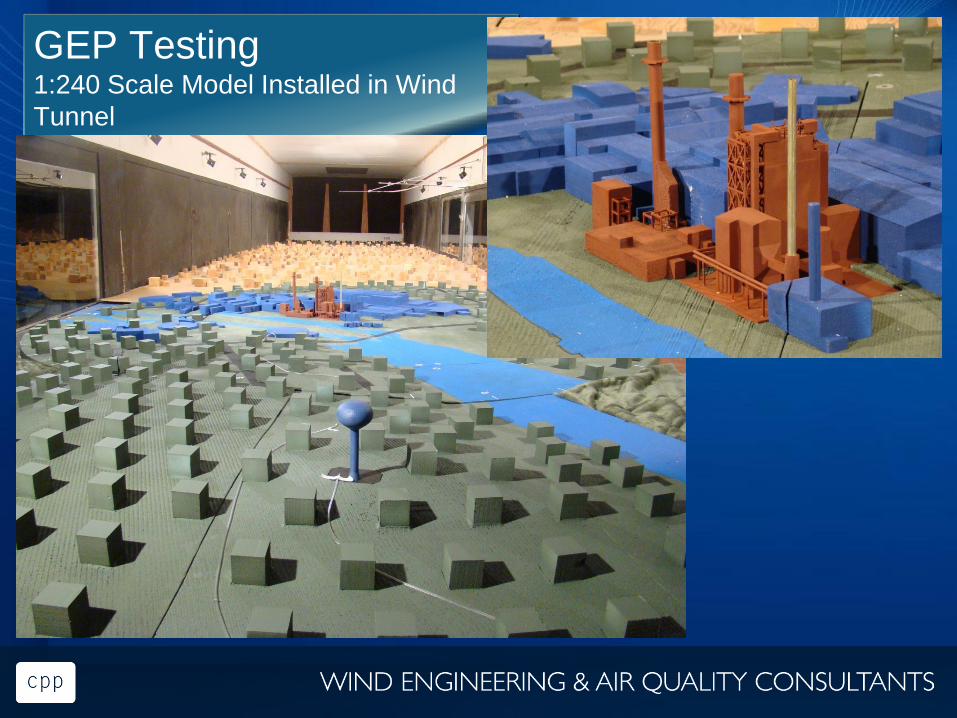
GEP Testing 1:240 Scale Model Installed in Wind
Tunnel

Measure Ground-level Concentrations
Tracer
from stack
Max ground-level concentrations measured versus x
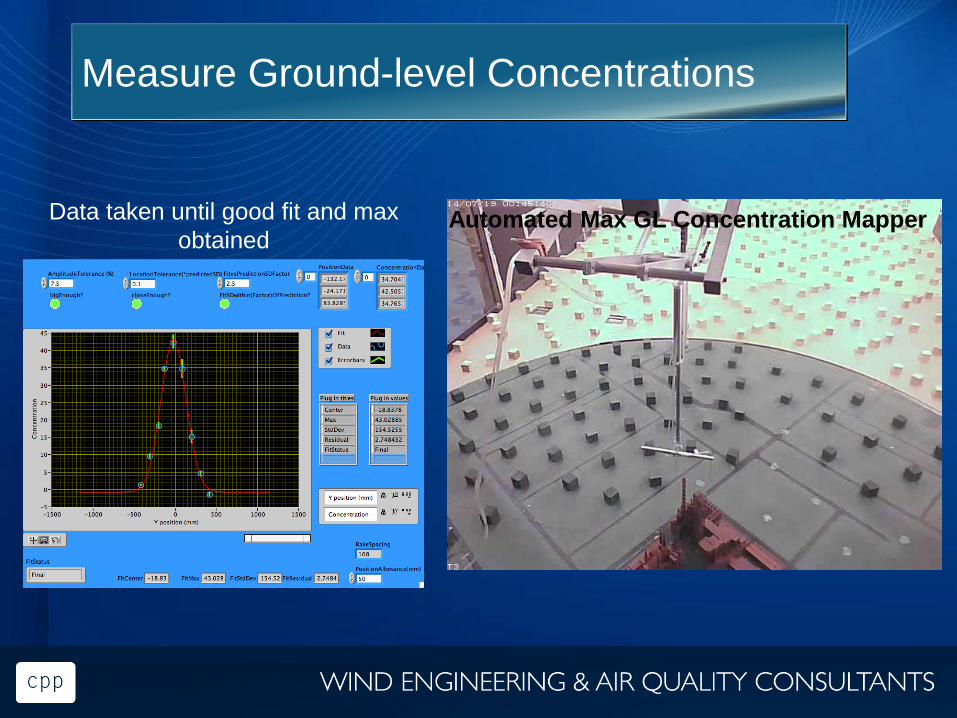
Measure Ground-level Concentrations
Data taken until good fit and max
obtained Automated Max GL Concentration Mapper

Buildings in
Buildings out

Documentation Tests
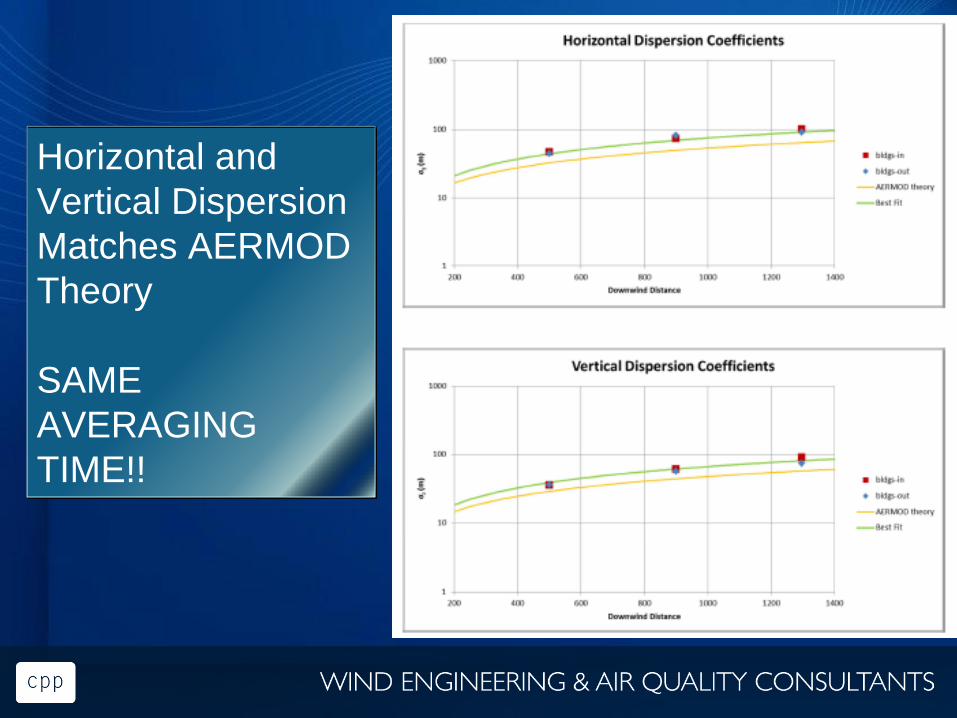
Horizontal and
Vertical Dispersion
Matches AERMOD
Theory
SAME
AVERAGING
TIME!!
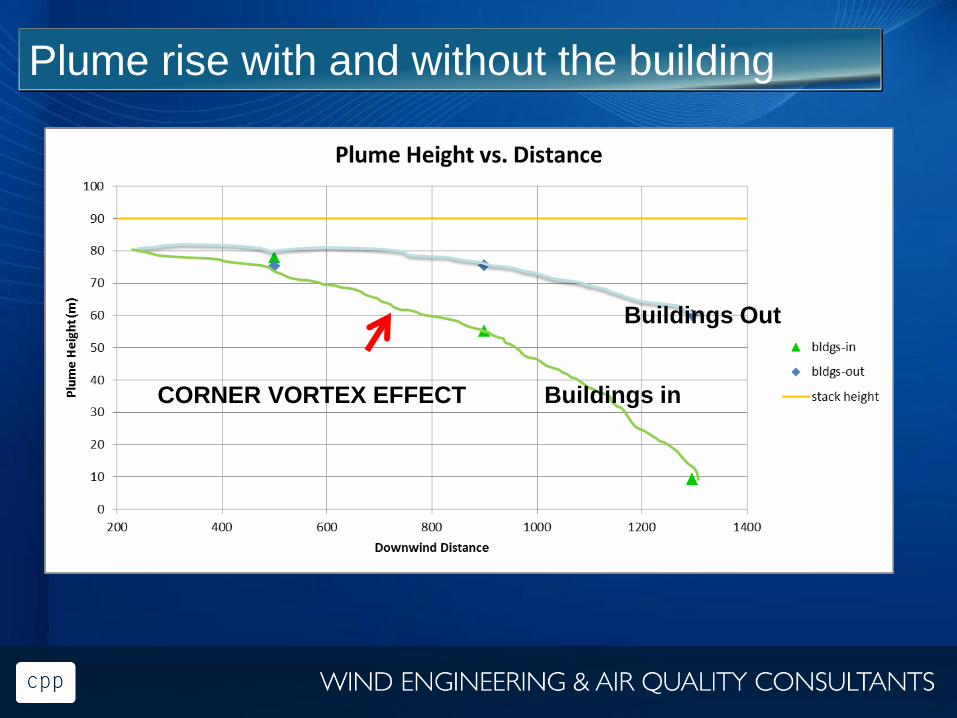
Plume rise with and without the building
Buildings in
Buildings Out
CORNER VORTEX EFFECT
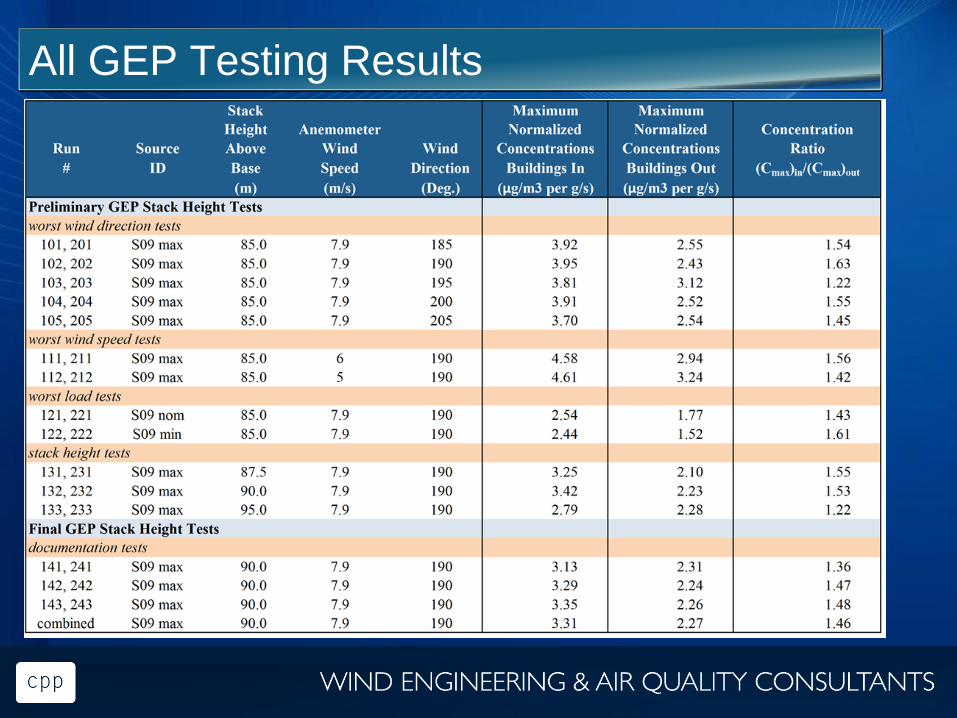
All GEP Testing Results

GL Concentration Profile W and W/0 Buildings
90 m stack height,
190 degree WD,
8 m/s wind speed
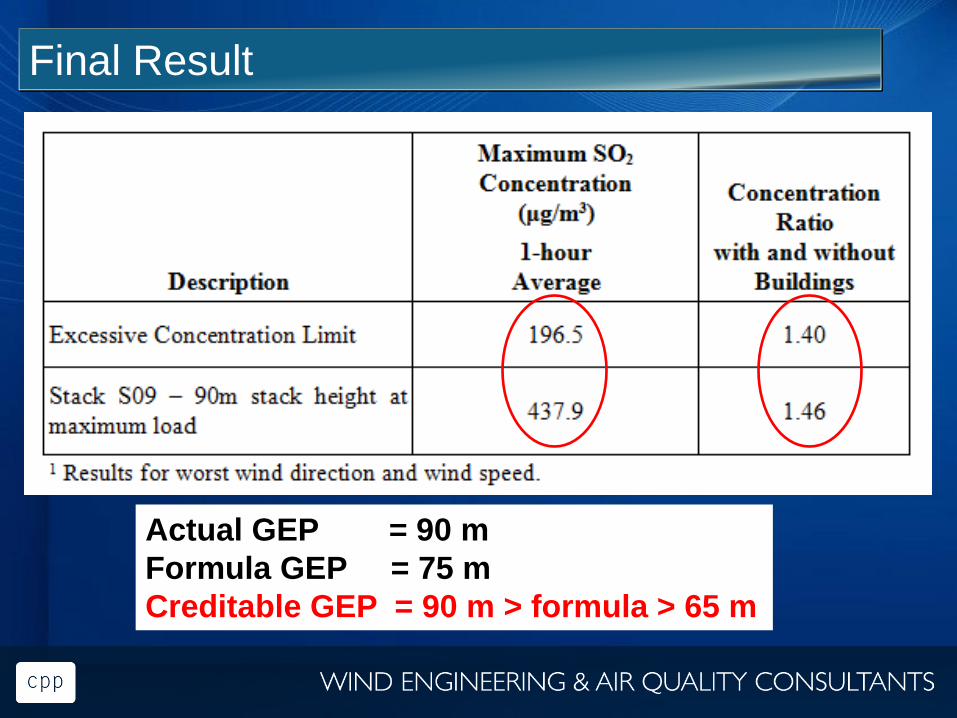
Final Result
Actual GEP = 90 m
Formula GEP = 75 m
Creditable GEP = 90 m > formula > 65 m
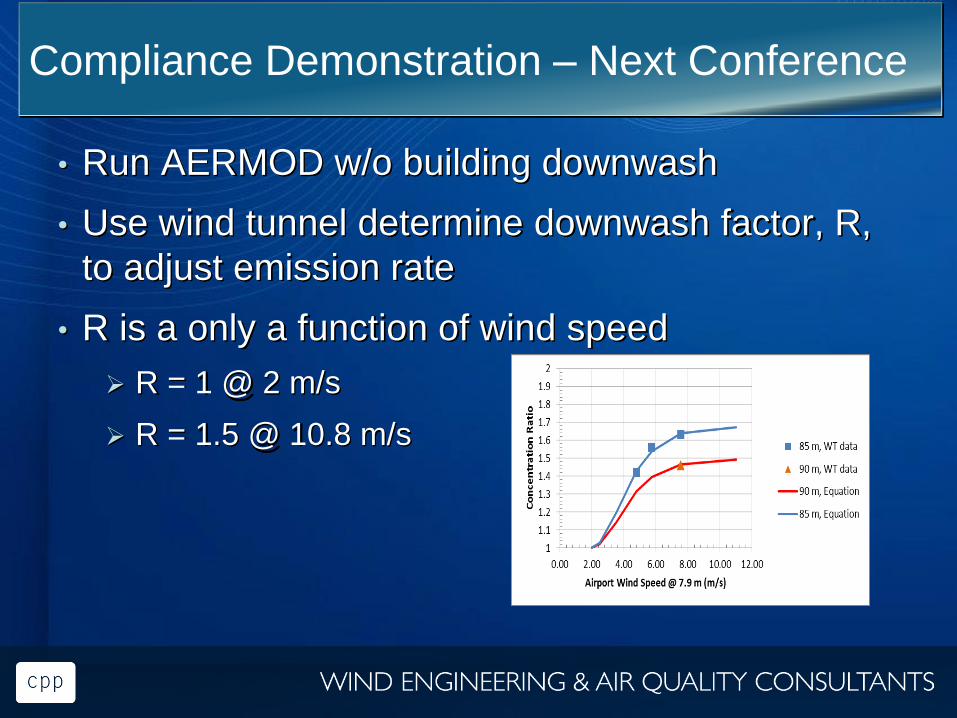
Compliance Demonstration – Next Conference
• Run AERMOD w/o building downwash
• Use wind tunnel determine downwash factor, R,
to adjust emission rate
• R is a only a function of wind speed
R = 1 @ 2 m/s
R = 1.5 @ 10.8 m/s
Final Polling Question Answers
• EPA allows GEP stack heights taller than 65m?
True, or
False
• EPA allows GEP stack heights taller than the formula height?
True, or
False
• Why would you want taller stacks?
Compliance versus non-compliance
Optimize fuel use
Minimize emission control
I wouldn’t they are too expensive

Questions?
Ron Petersen, Ph.D., CCM, FASHRAE
CPP, Inc
970 690 1344
1200 ft GEP Stack