justice reinvestment in pennsylvania - csg justice … reinvestment in pennsylvania justice...
TRANSCRIPT
JUNE 2017
Policy Framework
Justice Reinvestment in Pennsylvania
JUS
TIC
E R
EIN
VE
ST
ME
NT
IN P
EN
NS
YLV
AN
IA
Overview
Pennsylvania has the highest incarceration rate in the Northeast; there are approximately 50,000 people
incarcerated in state prisons, which cost the state about $2.4 billion in FY2015.1 People on supervision who recidivate account for a portion of this cost, with nearly one-third of prison beds occupied by people who have violated the conditions of their probation or parole.2 Insufficient county probation resources and inefficient use of parole resources limit the effectiveness of supervision and exacerbate recidivism.
In 2012, Pennsylvania employed a data-driven justice reinvestment approach to reduce corrections spending and reinvest savings in strategies to improve public safety. Following this effort, the General Assembly voted unanimously to enact legislation based on a justice reinvestment policy framework (Act 122 and Act 196),3
and as a result of these and other policy reforms, Pennsylvania has experienced a decrease in its state prison population and averted significant corrections costs.4
To build on prior efforts and address current challenges related to costs, supervision, and recidivism, state leaders have again embarked on a justice reinvestment approach to develop policies that will increase the state’s return on investment in corrections. By adopting these proposed policies, Pennsylvania is projected to reduce the state prison population by 1,032 people and avert at least $108 million in corrections costs between FY2018 and FY2022. This will enable the state to reinvest savings in strategies to improve public safety, including strengthening probation and parole supervision and increasing funding for alternatives to incarceration that have been shown to reduce recidivism.
The JusTice ReinvesTmenT WoRking gRoup
In October 2015, Pennsylvania Governor Tom Wolf, Chief Justice Thomas Saylor, Senate President Pro Tempore Joseph Scarnati, House Speaker Mike Turzai, Pennsylvania Commission on Crime and Delinquency (PCCD) Chairman Josh Shapiro, and Department of Corrections (DOC) Secretary John Wetzel requested support from the U.S. Department of Justice’s Bureau of Justice Assistance (BJA) and The Pew Charitable Trusts (Pew) to employ a justice reinvestment approach to build on prior efforts in the state. As public-private partners in the Justice Reinvestment Initiative (JRI), BJA and Pew approved the state’s request and asked The Council of State Governments (CSG) Justice Center to provide intensive technical assistance.
To study the state’s criminal justice system, Pennsylvania established the bipartisan, interbranch Justice Reinvestment Working Group under PCCD. The 37-member working group included state lawmakers and agency leaders, judiciary members, probation and county government officials, district attorneys and public defenders, and law enforcement representatives. The group met five times between March and December 2016 to review analyses conducted by the CSG Justice Center and discuss policy options.
On December 14, 2016, the group voted unanimously to support the policies detailed in this report and to include them in legislation. In addition to the policy framework presented in this report, members of the working group repeatedly discussed two issues that did not lead to the development of concrete policy options: (1) the impact of reinstating mandatory minimum punishments and (2) the lack of state funding for indigent defense. Discussion of both issues was prompted by recent decisions by the Supreme Court of Pennsylvania.5

2 Justice Reinvestment in Pennsylvania
WoRking gRoup memBeRs
ChairmanJosh Shapiro, Chairman, Pennsylvania Commission on Crime and Delinquency
Vice ChairmanJohn Wetzel, Secretary, Pennsylvania Department of Corrections
MembersRandy Albright, Secretary, Office of the BudgetSally Barry, Chief Probation Officer, Lebanon County The Honorable Bruce R. Beemer, Pennsylvania Attorney General Mark Bergstrom, Executive Director, Pennsylvania Commission on SentencingTyree Blocker, Commissioner, Pennsylvania State PoliceTheodore Dallas, Secretary, Pennsylvania Department of Human ServicesWilliam Danowski, Secretary of Legislative Affairs, Governor’s OfficeTom Darr, Court Administrator, Administrative Office of Pennsylvania CourtsLeo Dunn, Chairman, Pennsylvania Board of Probation and ParoleSarah E. Galbally, Secretary of Policy and Planning, Governor’s OfficeThe Honorable Stewart Greenleaf, State Senator, 12th Senatorial DistrictEllen Greenlee, Retired Chief, Defender Association of PhiladelphiaThe Honorable Jolene Grubb Kopriva, President Judge, Blair CountyMichael Hanna, Jr., Deputy Secretary of Legislative Affairs, Governor’s OfficeElliot Howsie, Esq., Director and Chief Public Defender, Allegheny CountyMary Isenhour, Chief of Staff, Governor’s OfficeRobert G. Jolley, President, Pennsylvania Chiefs of Police AssociationLinda Kelly, Court Administrator, Allegheny CountyThe Honorable Daylin Leach, State Senator, 17th Senatorial DistrictThe Honorable Ron Marsico, State Representative, 105th Legislative DistrictThe Honorable Edward Marsico, Jr., District Attorney, Dauphin CountyDerin Myers, Acting Executive Director, Pennsylvania Commission on Crime and DelinquencyLes Neri, President, Fraternal Order of Police—Pennsylvania State LodgeMavis Nimoh, Secretary, Pennsylvania Board of PardonsBrinda Carroll Penyak, Deputy Director of Government Relations, County
Commissioners Association of PennsylvaniaThe Honorable Joseph Petrarca, State Representative, 55th Legislative DistrictLinda Rosenberg, Parole Board Member, Pennsylvania Board of Probation and ParoleDenise Smyler, General Counsel, Office of General CounselRichard E. Steele, Executive Director, Juvenile Court Judges’ CommissionJennifer Storm, Victim Advocate, Office of the Victim AdvocateEdward Sweeney, Director of Corrections, Lehigh County Gary Tennis, Secretary, Pennsylvania Department of Drug and Alcohol ProgramsSeth Williams, District Attorney, Philadelphia CountyThe Honorable Sheila Woods-Skipper, President Judge, Philadelphia County
Policy Framework 3
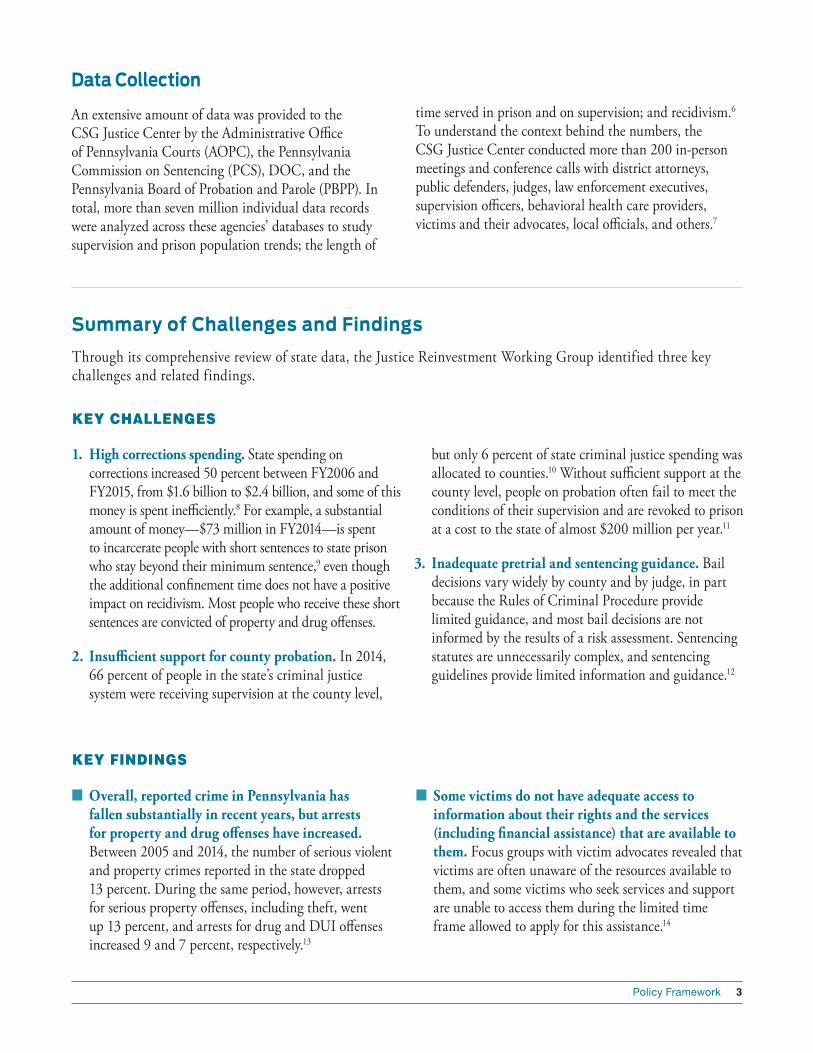
n Overall, reported crime in Pennsylvania has fallen substantially in recent years, but arrests for property and drug offenses have increased. Between 2005 and 2014, the number of serious violent and property crimes reported in the state dropped 13 percent. During the same period, however, arrests for serious property offenses, including theft, went up 13 percent, and arrests for drug and DUI offenses increased 9 and 7 percent, respectively.13
n Some victims do not have adequate access to information about their rights and the services (including financial assistance) that are available to them. Focus groups with victim advocates revealed that victims are often unaware of the resources available to them, and some victims who seek services and support are unable to access them during the limited time frame allowed to apply for this assistance.14
Summary of Challenges and Findings
Through its comprehensive review of state data, the Justice Reinvestment Working Group identified three key challenges and related findings.
1. High corrections spending. State spending on corrections increased 50 percent between FY2006 and FY2015, from $1.6 billion to $2.4 billion, and some of this money is spent inefficiently.8 For example, a substantial amount of money—$73 million in FY2014—is spent to incarcerate people with short sentences to state prison who stay beyond their minimum sentence,9 even though the additional confinement time does not have a positive impact on recidivism. Most people who receive these short sentences are convicted of property and drug offenses.
2. Insufficient support for county probation. In 2014, 66 percent of people in the state’s criminal justice system were receiving supervision at the county level,
but only 6 percent of state criminal justice spending was allocated to counties.10 Without sufficient support at the county level, people on probation often fail to meet the conditions of their supervision and are revoked to prison at a cost to the state of almost $200 million per year.11
3. Inadequate pretrial and sentencing guidance. Bail decisions vary widely by county and by judge, in part because the Rules of Criminal Procedure provide limited guidance, and most bail decisions are not informed by the results of a risk assessment. Sentencing statutes are unnecessarily complex, and sentencing guidelines provide limited information and guidance.12
KEY CHALLENGES
KEY FINDINGS
Data Collection
An extensive amount of data was provided to the CSG Justice Center by the Administrative Office of Pennsylvania Courts (AOPC), the Pennsylvania Commission on Sentencing (PCS), DOC, and the Pennsylvania Board of Probation and Parole (PBPP). In total, more than seven million individual data records were analyzed across these agencies’ databases to study supervision and prison population trends; the length of
time served in prison and on supervision; and recidivism.6 To understand the context behind the numbers, the CSG Justice Center conducted more than 200 in-person meetings and conference calls with district attorneys, public defenders, judges, law enforcement executives, supervision officers, behavioral health care providers, victims and their advocates, local officials, and others.7
4 Justice Reinvestment in Pennsylvania
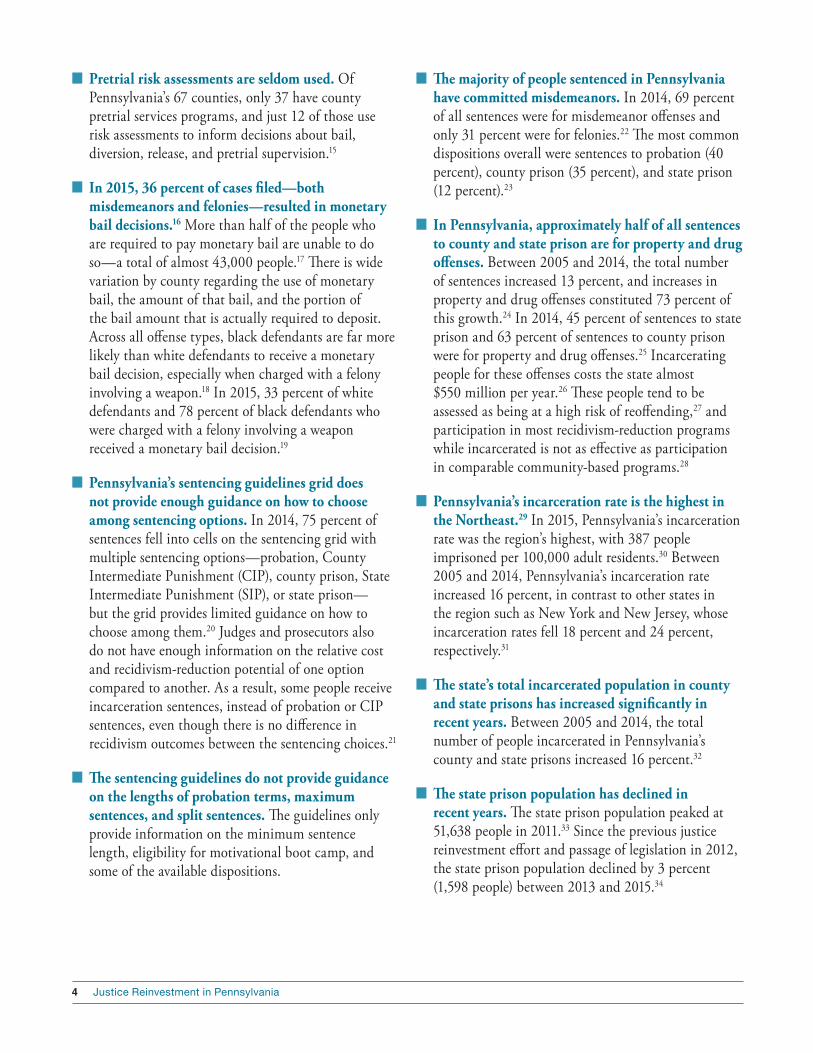
n Pretrial risk assessments are seldom used. Of Pennsylvania’s 67 counties, only 37 have county pretrial services programs, and just 12 of those use risk assessments to inform decisions about bail, diversion, release, and pretrial supervision.15
n In 2015, 36 percent of cases filed—both misdemeanors and felonies—resulted in monetary bail decisions.16 More than half of the people who are required to pay monetary bail are unable to do so—a total of almost 43,000 people.17 There is wide variation by county regarding the use of monetary bail, the amount of that bail, and the portion of the bail amount that is actually required to deposit. Across all offense types, black defendants are far more likely than white defendants to receive a monetary bail decision, especially when charged with a felony involving a weapon.18 In 2015, 33 percent of white defendants and 78 percent of black defendants who were charged with a felony involving a weapon received a monetary bail decision.19
n Pennsylvania’s sentencing guidelines grid does not provide enough guidance on how to choose among sentencing options. In 2014, 75 percent of sentences fell into cells on the sentencing grid with multiple sentencing options—probation, County Intermediate Punishment (CIP), county prison, State Intermediate Punishment (SIP), or state prison—but the grid provides limited guidance on how to choose among them.20 Judges and prosecutors also do not have enough information on the relative cost and recidivism-reduction potential of one option compared to another. As a result, some people receive incarceration sentences, instead of probation or CIP sentences, even though there is no difference in recidivism outcomes between the sentencing choices.21
n The sentencing guidelines do not provide guidance on the lengths of probation terms, maximum sentences, and split sentences. The guidelines only provide information on the minimum sentence length, eligibility for motivational boot camp, and some of the available dispositions.
n The majority of people sentenced in Pennsylvania have committed misdemeanors. In 2014, 69 percent of all sentences were for misdemeanor offenses and only 31 percent were for felonies.22 The most common dispositions overall were sentences to probation (40 percent), county prison (35 percent), and state prison (12 percent).23
n In Pennsylvania, approximately half of all sentences to county and state prison are for property and drug offenses. Between 2005 and 2014, the total number of sentences increased 13 percent, and increases in property and drug offenses constituted 73 percent of this growth.24 In 2014, 45 percent of sentences to state prison and 63 percent of sentences to county prison were for property and drug offenses.25 Incarcerating people for these offenses costs the state almost $550 million per year.26 These people tend to be assessed as being at a high risk of reoffending,27 and participation in most recidivism-reduction programs while incarcerated is not as effective as participation in comparable community-based programs.28
n Pennsylvania’s incarceration rate is the highest in the Northeast.29 In 2015, Pennsylvania’s incarceration rate was the region’s highest, with 387 people imprisoned per 100,000 adult residents.30 Between 2005 and 2014, Pennsylvania’s incarceration rate increased 16 percent, in contrast to other states in the region such as New York and New Jersey, whose incarceration rates fell 18 percent and 24 percent, respectively.31
n The state’s total incarcerated population in county and state prisons has increased significantly in recent years. Between 2005 and 2014, the total number of people incarcerated in Pennsylvania’s county and state prisons increased 16 percent.32
n The state prison population has declined in recent years. The state prison population peaked at 51,638 people in 2011.33 Since the previous justice reinvestment effort and passage of legislation in 2012, the state prison population declined by 3 percent (1,598 people) between 2013 and 2015.34
Policy Framework 5
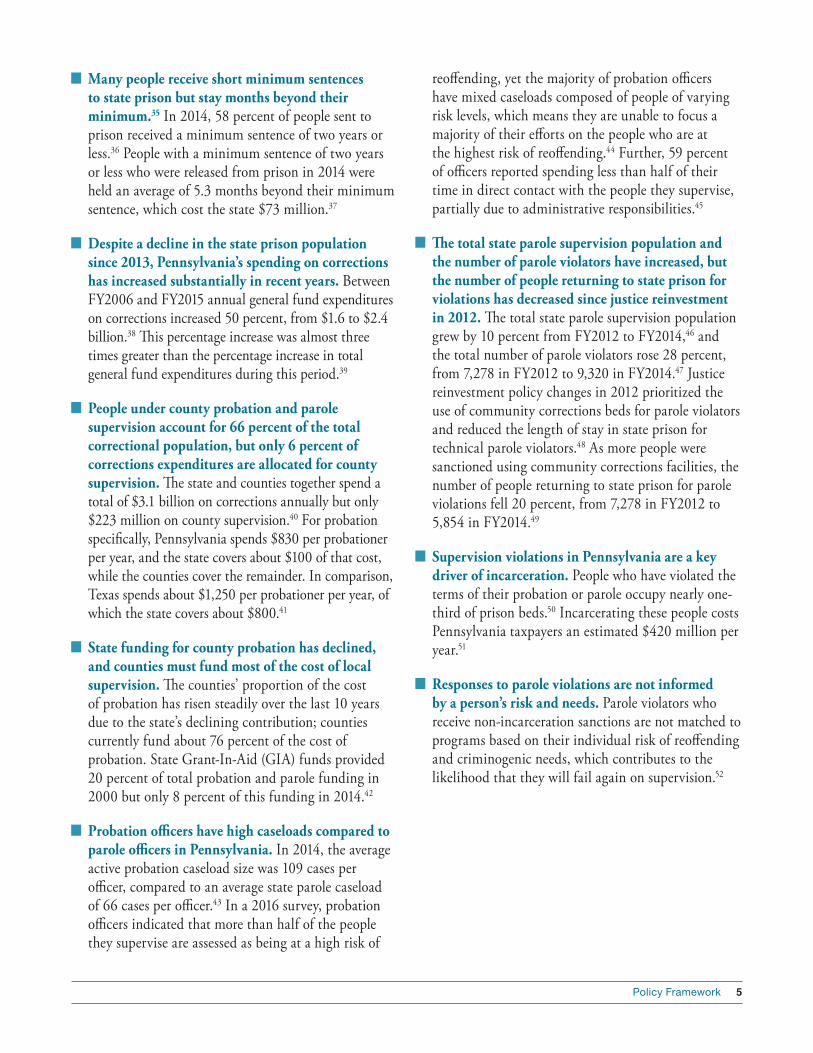
n Many people receive short minimum sentences to state prison but stay months beyond their minimum.35 In 2014, 58 percent of people sent to prison received a minimum sentence of two years or less.36 People with a minimum sentence of two years or less who were released from prison in 2014 were held an average of 5.3 months beyond their minimum sentence, which cost the state $73 million.37
n Despite a decline in the state prison population since 2013, Pennsylvania’s spending on corrections has increased substantially in recent years. Between FY2006 and FY2015 annual general fund expenditures on corrections increased 50 percent, from $1.6 to $2.4 billion.38 This percentage increase was almost three times greater than the percentage increase in total general fund expenditures during this period.39
n People under county probation and parole supervision account for 66 percent of the total correctional population, but only 6 percent of corrections expenditures are allocated for county supervision. The state and counties together spend a total of $3.1 billion on corrections annually but only $223 million on county supervision.40 For probation specifically, Pennsylvania spends $830 per probationer per year, and the state covers about $100 of that cost, while the counties cover the remainder. In comparison, Texas spends about $1,250 per probationer per year, of which the state covers about $800.41
n State funding for county probation has declined, and counties must fund most of the cost of local supervision. The counties’ proportion of the cost of probation has risen steadily over the last 10 years due to the state’s declining contribution; counties currently fund about 76 percent of the cost of probation. State Grant-In-Aid (GIA) funds provided 20 percent of total probation and parole funding in 2000 but only 8 percent of this funding in 2014.42
n Probation officers have high caseloads compared to parole officers in Pennsylvania. In 2014, the average active probation caseload size was 109 cases per officer, compared to an average state parole caseload of 66 cases per officer.43 In a 2016 survey, probation officers indicated that more than half of the people they supervise are assessed as being at a high risk of
reoffending, yet the majority of probation officers have mixed caseloads composed of people of varying risk levels, which means they are unable to focus a majority of their efforts on the people who are at the highest risk of reoffending.44 Further, 59 percent of officers reported spending less than half of their time in direct contact with the people they supervise, partially due to administrative responsibilities.45
n The total state parole supervision population and the number of parole violators have increased, but the number of people returning to state prison for violations has decreased since justice reinvestment in 2012. The total state parole supervision population grew by 10 percent from FY2012 to FY2014,46 and the total number of parole violators rose 28 percent, from 7,278 in FY2012 to 9,320 in FY2014.47 Justice reinvestment policy changes in 2012 prioritized the use of community corrections beds for parole violators and reduced the length of stay in state prison for technical parole violators.48 As more people were sanctioned using community corrections facilities, the number of people returning to state prison for parole violations fell 20 percent, from 7,278 in FY2012 to 5,854 in FY2014.49
n Supervision violations in Pennsylvania are a key driver of incarceration. People who have violated the terms of their probation or parole occupy nearly one-third of prison beds.50 Incarcerating these people costs Pennsylvania taxpayers an estimated $420 million per year.51
n Responses to parole violations are not informed by a person’s risk and needs. Parole violators who receive non-incarceration sanctions are not matched to programs based on their individual risk of reoffending and criminogenic needs, which contributes to the likelihood that they will fail again on supervision.52
6 Justice Reinvestment in Pennsylvania
Summary of Policy Options and Impacts
POLICY OPTIONS
1. Make time served for short sentences to state prison more predictable.
2. Improve the state’s approach to funding and supporting county probation.
3. Increase support for victims of crime.
4. Improve pretrial decision making.
5. Increase guidance provided by sentencing guidelines.
6. Improve parole supervision.
The policy options listed below are designed to achieve the following goals:
n Reduce release delays and incarceration costs for people serving short sentences to state prison.
n Focus state attention on improving county probation supervision.
n Increase notifications, provide greater access to compensation, and increase financial assistance for victims of crime.
n Improve the pretrial process to increase public safety and decrease county prison costs.
n Refine sentencing policies and guidelines to reduce recidivism and increase the state’s return on its investment in corrections.
n Improve the use of parole supervision resources.
Icons appear in the policy options section of this report to indicate which options will reduce the prison population, provide tools to reduce the county prison population, and increase public safety and reduce recidivism.
PROJECTED IMPACT
As a package, the policies described in this report have the potential to result in averted costs and lower recidivism for Pennsylvania. The effective implementation of the policies is projected to reduce the amount of time people serving short sentences spend in state prison, increase the use of SIP,
and result in the more efficient use of resources for technical parole violations. These changes will help the state reduce the prison population by an estimated 1,032 people and avert $108 million in associated operating costs between FY2018 and FY2022. (See Figure 1)
Operating cost estimates are based on 2016 DOC graduated per diem rates that increase from $16 to $100 per day based on the number of beds saved. The five-year impact projection utilizes historical sentencing and DOC admission and release data to simulate the status quo trajectories of specific subpopulations and compares them against assumed changes if the entire policy package was implemented as described in this report. Prison bed savings realized under the justice reinvestment policy package are additional beds saved, separate from the projected bed reductions already anticipated by the current DOC population forecast. Without the justice reinvestment policies, DOC projects a decline in the prison population of 2,232 people (Current Forecast in Figure 1). With the justice reinvestment policies, the population will be reduced by an additional 1,032 people, bringing the total reduction to 3,264 people (Impact Projection with Policy Options in Figure 1). The effective date for most of the impact model was assumed to be January 1, 2018. Impact assumptions, drivers, and results were vetted with the DOC, PCS, PBPP, and the Office of the Budget.
Policy Framework 7
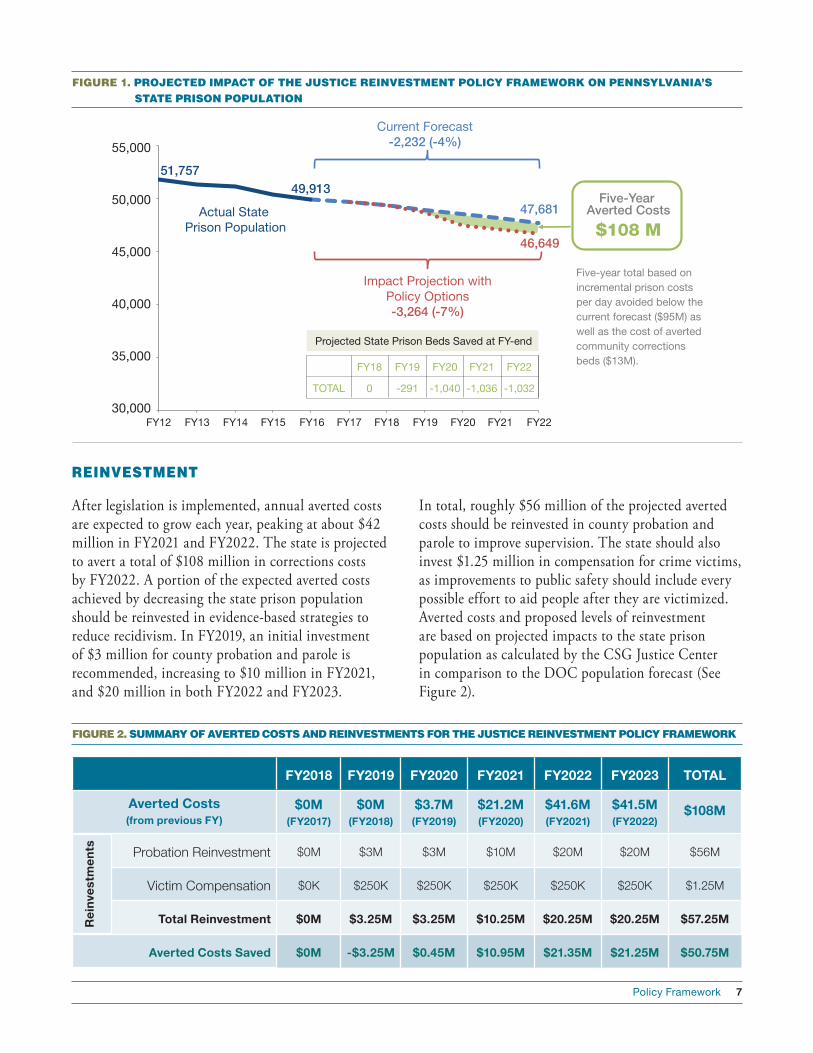
FIGURE 1. PROJECTED IMPACT OF THE JUSTICE REINVESTMENT POLICY FRAMEWORK ON PENNSYLVANIA’S STATE PRISON POPULATION
FIGURE 2. SUMMARY OF AVERTED COSTS AND REINVESTMENTS FOR THE JUSTICE REINVESTMENT POLICY FRAMEWORK
After legislation is implemented, annual averted costs are expected to grow each year, peaking at about $42 million in FY2021 and FY2022. The state is projected to avert a total of $108 million in corrections costs by FY2022. A portion of the expected averted costs achieved by decreasing the state prison population should be reinvested in evidence-based strategies to reduce recidivism. In FY2019, an initial investment of $3 million for county probation and parole is recommended, increasing to $10 million in FY2021, and $20 million in both FY2022 and FY2023.
In total, roughly $56 million of the projected averted costs should be reinvested in county probation and parole to improve supervision. The state should also invest $1.25 million in compensation for crime victims, as improvements to public safety should include every possible effort to aid people after they are victimized. Averted costs and proposed levels of reinvestment are based on projected impacts to the state prison population as calculated by the CSG Justice Center in comparison to the DOC population forecast (See Figure 2).
REINVESTMENT
FY2018 FY2019 FY2020 FY2021 FY2022 FY2023 TOTAL
Averted Costs (from previous FY)
$0M (FY2017)
$0M (FY2018)
$3.7M (FY2019)
$21.2M (FY2020)
$41.6M (FY2021)
$41.5M (FY2022)
$108M
Probation Reinvestment $0M $3M $3M $10M $20M $20M $56M
Victim Compensation $0K $250K $250K $250K $250K $250K $1.25M
Total Reinvestment $0M $3.25M $3.25M $10.25M $20.25M $20.25M $57.25M
Averted Costs Saved $0M -$3.25M $0.45M $10.95M $21.35M $21.25M $50.75M
Rei
nves
tmen
ts
Impact Projection withPolicy Options-3,264 (-7%)
Current Forecast-2,232 (-4%)
Five-Year Averted Costs
$108 M
51,75749,913
47,681
46,649
Actual State Prison Population
FY12 FY13 FY14 FY15 FY16 FY17 FY18 FY19 FY20 FY21 FY22
55,000
50,000
45,000
40,000
35,000
30,000
Five-year total based on incremental prison costs per day avoided below the current forecast ($95M) as well as the cost of averted community corrections beds ($13M).
Projected State Prison Beds Saved at FY-end
FY18
0
FY19
-291
FY20
-1,040
FY21
-1,036
FY22
-1,032TOTAL
8 Justice Reinvestment in Pennsylvania
POLICY OPTION 1:Make time served for short sentences to state prison more predictable.
Policy Options
In Pennsylvania, people who receive a minimum sentence of two years or less may serve that time in either county or state prison. In 2014, 58 percent of people committed to state prison, or about 6,000 people, had a minimum sentence of two years or less.53
On average, people who are sentenced to county prison serve close to the minimum length of time required for their sentences, then are released to county parole supervision. In contrast, people sentenced to state prison stay beyond their minimum sentence and experience months of delay before their release to state parole supervision. For example, people with a minimum sentence of two years or less who were released from state prison in 2014 were held an average of 5.3 months beyond their minimum sentence, which cost the state $73 million and occupied about 2,000 prison beds on any given day.54 Thus, two people who receive the same short minimum sentence may end up being incarcerated for markedly different lengths of time depending on whether they are sentenced to county or state prison.
Stakeholders indicate that people are often sentenced to state prison because every local alternative to incarceration has been exhausted, and the sentence is imposed in order to ensure that people receive the programming they need (e.g., substance use or cognitive behavioral treatment)
while incarcerated. Research shows, however, that greater impacts on recidivism are consistently achieved through appropriate interventions and programs delivered in the community, rather than while incarcerated.55 Further, research conducted in Pennsylvania as part of justice reinvestment showed that recidivism results are no better for people sentenced to short state prison sentences than they are for similar people sentenced to comparable county prison sentences.56
This policy option requires people serving short state prison sentences to be released to parole supervision after serving the minimum sentence. Presumptive parole would be granted to people serving state prison sentences of a minimum of two years or less, unless they are excluded from this policy by statute.
By requiring people to be released to parole after serving their minimum sentence, the state will save the money it typically spends to hold these people beyond their minimum sentence and will ensure that people receive supervision and programming in the community, where it has the greatest likelihood of reducing recidivism. This policy will also ensure that sentences to state prison and county prison are equitable because people will serve close to their minimum sentence regardless of which type of facility they are in.
POLICY OPTION 2:Improve the state’s approach to funding and supporting county probation.
A. Increase state funding for county probation. The state provides inadequate funding for county probation and uses an outdated formula to determine funding. These practices contribute to high probation caseloads, insufficient supervision to reduce recidivism, and a large number of people whose supervision is revoked, resulting in high incarceration costs for both county and state prisons.
In 2014, approximately 244,000 people in Pennsylvania were supervised by county probation and parole departments at an average cost of about $830 per person per year, with about 76 percent of this cost funded by counties,57 12 percent covered by grants and other revenue, and 12 percent covered by the state. By comparison, in Texas—which also has a large probation population supervised at the county level—the annual cost of
Increase public safety and reduce recidivism
Increase public safety and reduce recidivism
Reduce the state prison population
Policy Framework 9
supervision is about $1,250 per person per year, of which the state covers about 64 percent.58 In Pennsylvania, the state’s share of the cost has decreased significantly in the last 10 years due to reductions in state GIA funding.59
Pennsylvania’s current funding structure for county probation includes funding from the PBPP for GIA and funding from PCCD for CIP. The GIA formula was last amended in 1986 with the intention of covering 80 percent of salaries for county probation personnel, but the funding currently covers only about 18 percent of those salaries and has never come close to covering the intended 80 percent.60 PCCD uses the CIP funding to target more intensive services to people who are at a high risk of reoffending and provide grant funding for counties that use CIP to divert people from incarceration.
Insufficient funding and inefficient funding practices make it challenging for local departments to focus resources on high-risk populations and reduce recidivism. In 2014, it cost the state approximately $200 million to incarcerate people who were revoked for violating the conditions of their supervision. This group represented an estimated 17 percent of the state prison population that year.61
Because probation officers are overburdened and are not always able to effectively supervise people, judges and prosecutors in some counties have reported that they are not confident that people who are sentenced to probation will receive sufficient supervision or participate in appropriate recidivism-reduction programs. The less certain these decision makers are about the effectiveness of probation, the more likely they are to sentence someone to incarceration instead.
This policy option requires Pennsylvania to increase funding for county probation, update the state’s funding formula for probation, and change the GIA mechanism.
The new funding formula should be based on the number of people under supervision and the resources needed to improve their behavior. People who fall into higher levels on the sentencing grid tend to be at a high risk of reoffending or have committed a more serious offense. People in higher grid levels also tend to have greater treatment and programming needs, so increased resources
for these people would, in turn, help to reduce the likelihood of recidivism. More funding for people who fall into the higher levels on the grid would provide judges and prosecutors with greater assurance that these people are receiving effective monitoring and interventions.
To ensure that state funding for each county does not decline due to the funding formula change, the amount of GIA funding each county received for FY2016 would be the minimum amount each county would receive annually moving forward, even after the transition to the new funding formula. The funding allocated to counties would be based largely on the number of people sentenced to probation in the previous fiscal year.
B. Provide state support for local probation departments.
Currently in Pennsylvania, 65 separate county probation departments—which oversee both probation and parole at the county level—provide supervision for approximately 244,000 people.62 At the state level, PBPP provides GIA funding, as well as auditing and training, to these departments. Local departments also receive funding from PCCD, which administers funding for CIP. Neither agency provides sufficient constructive oversight or support to help improve adult probation and parole supervision practices.
This policy option creates a state-level governing body to provide oversight and support for county probation departments. This governing body would be operated by a board that includes criminal court judges as well as other stakeholders, such as chief probation officers. This body would not take over the responsibilities of the counties or take control of the operations executed at the local level, but instead would focus on guiding county probation and parole departments, managing state funding for those departments, selecting training and technical assistance providers, supporting data collection, and assisting in the implementation of a strategic plan to improve county probation supervision.
This policy option ensures that counties will receive the support they need to improve supervision, reduce recidivism, and decrease the number of revocations to prison.
10 Justice Reinvestment in Pennsylvania
Currently, crime victims in Pennsylvania are not always notified of their rights or the services they may be eligible to receive.
Under Pennsylvania’s Crime Victims Act (CVA), law enforcement agencies are required to provide crime victims with written notification of their rights and information about the services and compensation assistance that may be available to them. Victims must be given details about the Victim Compensation Assistance Program (VCAP), which provides financial assistance to cover medical expenses, counseling, loss of earnings, funeral costs, travel costs, child care, relocation, crime scene cleanup, and certain other expenses associated with the crimes against them. To be eligible for VCAP benefits, the victim must report the crime, cooperate with law enforcement, experience a loss of at least $100, and submit an application for benefits within two years of the crime. Victims do not always receive written notification from law enforcement about their rights and the services offered, and as a result, they are sometimes unaware of or unable to access services and compensation assistance to which they are entitled.63
Further, district attorneys in Pennsylvania are not required to notify the state’s Victim Advocate when a defendant is sentenced to state prison. Without this information, the
Advocate is not able to keep victims informed about their rights related to parole notifications.
This policy option increases notification to victims and improves access to VCAP. The state Victim Advocate, PCCD, and law enforcement leadership will work together to design a process whereby individual police officers, instead of law enforcement agencies, will be responsible for providing victims with written notification about their rights and any potential benefits, or, if they are unable to provide this notification, they must give an explanation as to why.
This policy option also requires the Victim Advocate and prosecutors to collaborate and develop a process for prosecutors to notify the Advocate on behalf of the victim when a defendant is sentenced to state prison so that the Advocate can ensure that the victim receives the parole notifications to which they are entitled.
Finally, this policy expands the eligibility requirements for VCAP to include people who apply within three years of a crime (instead of two) and allows the application deadline to be waived if the victim can demonstrate good cause for the delay. This policy also decreases the minimum loss requirement from $100 to $50.
POLICY OPTION 3:Increase support for victims of crime.
Increase public safety
In Pennsylvania, pretrial practices vary widely by county, and decisions related to bail, diversion, and pretrial supervision are made without complete or reliable information.
There are 67 different approaches to pretrial practices in Pennsylvania’s 67 counties, with local stakeholders and agencies determining each county’s pretrial practices.
Arrests are carried out by one of approximately 27,000 law enforcement officers employed by more than 1,100 law enforcement agencies,64 and the initial judicial decision to release, detain, or set bail for someone during the pretrial process is typically made by one of 553 magisterial district judges and municipal court judges.65 Release and bail decisions may occur in a police lock-up or a county prison, and may be conducted by videoconference.
POLICY OPTION 4:Improve pretrial decision making.
Increase public safety and reduce recidivism
Provide tools to reduce county prison population
Policy Framework 11
A. Request that the Supreme Court review court rules related to bail decisions.
Pretrial service programs, referred to as “bail agencies” in the Rules of Criminal Procedure, differ by county and may be operated by private organizations, a court or county agency, or most commonly, the county probation and parole department. Pretrial programs exist in 37 counties and offer a variety of services.66 Some of these programs conduct pretrial risk assessments prior to the bail decision process, provide pretrial supervision, make referrals to service providers, and collaborate with local problem-solving courts after bail decisions are made.
Most pretrial service programs do not conduct a pretrial risk assessment, however, so the majority of bail decisions are not informed by risk assessment results. Additionally these pretrial decisions are sometimes made without taking into account prior contact with the criminal justice system, for example, whether a protection from abuse (PFA) order has been issued against a person. Without this information, a judge might allow the pretrial release of someone who is at a high risk of reoffending and may go on to commit additional crimes. Alternatively, judges may also unnecessarily hold people who could safely be released or supervised in the community. Lastly, the fact that many defendants do not receive representation at their initial court appearance also impacts pretrial release decisions, as it decreases the likelihood that a defendant will be released.67
Analysis of statewide court data shows wide variation by county regarding the use of monetary bail, the amount of that bail, and the portion required to deposit. In 2015, for example, monetary bail was used in 76 percent of felony cases in Philadelphia County, but just 53 percent in Allegheny County, and closer to 50 percent of cases in other counties.68 Further, monetary bail is more likely to be required for black defendants than for white defendants who have been charged with similar offense types, but especially for felony offenses involving a weapon. An analysis of data from 2015 showed that 33 percent of white defendants charged with felony offenses involving a weapon received a monetary bail decision, compared to 78 percent of black defendants.69 Note that due to limited data availability, this comparison could not take into account other factors that likely play a part in bail decision making (e.g., pending charges/warrants, history of flight, public safety threat, etc.).70
This policy option recommends that the Supreme Court review court rules related to bail determination to encourage greater consistency in bail decisions. Additionally, this policy recommends that the court consider ways to increase the use of risk assessments to inform pretrial decisions, and also work to ensure defense representation at preliminary arraignments.71 Court rule changes and concerted efforts in each county to improve how pretrial decisions are made can help ensure that bail decisions are informed, fair, and consistent.
For domestic violence cases, pretrial decisions should be informed by a lethality assessment that predicts specific danger. The court can also help to ensure that existing information about defendants’ prior contact with the justice system is taken into account.
B. Establish a working group to improve pretrial practices.
Several entities are engaged in separate efforts to improve pretrial practices in Pennsylvania. The First Judicial District of Pennsylvania is trying to implement a pretrial risk assessment and is working to reduce the county prison population in Philadelphia.72 The County Commissioners Association of Pennsylvania (CCAP) is working with five counties on a pilot project to identify ways to make pretrial practices more effective. PCCD recently awarded pretrial service grants to seven counties interested in strengthening their programs.73 All of these efforts show a desire by counties to improve pretrial practices, but also present an opportunity for better coordination. A pretrial working group could promote and coordinate additional efforts to increase consistency and fairness in pretrial practices across the state.
This policy option establishes a core pretrial working group consisting of representatives from PCCD, the Administrative Office of Pennsylvania Courts (AOPC), and CCAP that will develop a strategy to improve pretrial practices. This group will coordinate with other key stakeholders—including law enforcement, judges, DOC, the Pennsylvania Pretrial Services Association, the Department of Health and Human Services, the County Chief Adult Probation and Parole Officers Association, prosecutors and defense attorneys—to develop a plan to inform potential court rule changes and provide counties with information and tools related to pretrial best practices.
12 Justice Reinvestment in Pennsylvania
The goals of this group will include increasing the use of risk assessments statewide, increasing referrals to programs that help to reduce recidivism, and reducing unnecessary pretrial detention.
Further, the working group will seek to improve data collection on pretrial populations, such as the proportion of the pretrial population with mental illnesses, the proportion awaiting a probation violation hearing, and the
lengths of stay in county prisons. None of this information is currently collected statewide.
The working group will also coordinate other efforts already underway that impact pretrial populations, including the work of the national Stepping Up initiative and the PCCD Mental Health Justice Advisory Committee (MHJAC), to reduce the number of people with mental illness in county prisons.
A. Include all disposition options in the state’s sentencing guidelines and highlight those that are most associated with lower recidivism and costs.
Pennsylvania’s sentencing statutes and advisory guidelines are extraordinarily complex, yet the amount of practical guidance they provide is limited. For 75 percent of sentences, Pennsylvania’s sentencing guidelines allow a wide range of dispositional options—probation, CIP, county prison, SIP, or state prison—but provide limited guidance on how to choose among them.74 Further, the guidelines are not explicit about when some dispositional options, such as Drug and Alcohol Restrictive Intermediate Punishment (D&A RIP) and SIP, are available to use. The guidelines only provide information on the minimum sentence length, eligibility for motivational boot camp, and a list of some of the available dispositions.
As a result of the limited guidance, a person may be more or less likely to receive a sentence to state prison, county prison, or probation, depending on the county where the person is sentenced. Sentencing decisions are also impacted by the variation in resources available for non-incarceration sentences, and the different degrees of confidence judges and prosecutors have in non-incarceration sentencing options. For example, in Allegheny County, 57 percent of felony property and drug cases result in sentences to probation, which is up to three times the probation disposition rate in other counties.75 Disparity in sentencing exists among people sentenced for the same offense as well. For example, within a single cell in the guidelines, where people with similar criminal histories were convicted of felony retail theft in 2014, 47 percent were sentenced to
county prison, 26 percent to probation, 18 percent to state prison, and 9 percent to CIP.76
The limited sentencing guidance also contributes to the potentially unnecessary incarceration of some people convicted of property and drug offenses. In 2014, people convicted of property and drug offenses made up 45 percent of sentences to state prison and 63 percent of sentences to county prison,77 which represents a cost to the state of almost $550 million per year.78 These people are often at a high risk of reoffending, in part due to significant substance use and behavioral health needs,79 which research shows are more effectively addressed through community-based programs instead of prison-based programs.
Information about which sentencing options are associated with better recidivism outcomes is available and may be beneficial to judges when deciding how to sentence someone. Original research conducted in Pennsylvania for the justice reinvestment initiative showed a number of salient comparisons between recidivism outcomes for comparable groups of people who received different sentences.80 For example, people sentenced to probation had recidivism outcomes comparable to those sentenced to county prison, and people sentenced to D&A RIP had better outcomes compared to people sentenced to CIP and probation.81
This policy option requires the legislature to direct the PCS to update the sentencing guidelines to include all disposition options and highlight those that are most associated with lower recidivism and costs. With more information on the sentencing options that are associated
POLICY OPTION 5:Increase guidance provided by sentencing guidelines.
Increase public safety and reduce recidivism
Reduce the state prison population
Policy Framework 13
with better recidivism outcomes, along with increased funding for these options, judges might sentence fewer people to incarceration and achieve better results. In order for these non-incarceration sentences to be most effective, increased funding would be needed to expand their capacity. Sentencing some people—for example, those convicted of certain property and drug offenses—to probation, CIP, or D&A RIP, instead of incarceration, can better address behavioral health issues and reduce recidivism. Research shows that investing in high-quality supervision and services targeted to a person’s risk and needs is a more effective way to reduce recidivism and expend resources than incarceration.82
B. Ensure that prior record scores accurately reflect risk of reoffending in the sentencing guidelines and reduce incarceration ranges in some guideline cells.
Each time someone is convicted of a crime in Pennsylvania, he or she is assigned a prior record score (PRS) based on his or her criminal history. As a person’s PRS increases, his or her potential minimum sentence increases as well. Currently the PRS has not been closely studied to determine whether it is an accurate indicator of a person’s risk of reoffending.
This policy option directs the PCS to study the PRS and explore reducing the recommended length of sentences to incarceration for people with higher prior record scores to reduce corrections costs and allow for future investment in better post-release community-based programming.
This policy option is consistent with the recent strategic planning discussions by the PCS.83 The PCS Strategic Planning Work Group’s final report advocates common-sense, objective sentencing score adjustments based on culpability, reduced use of incarceration, potential increased sentence lengths for very serious cases, and decreased emphasis on old offenses through modified PRS categories and policies.
The PCS should also look to implement incremental reductions in the minimum sentence recommendations in the guidelines. This change should not increase recidivism and would, over time, free up more state resources for reinvestment in effective interventions. For example, if minimum sentencing ranges in select cells were reduced slightly to decrease the average length of stay by two to three months, this would eventually save the state tens of millions of dollars annually.
C. Provide guidance on probation terms, maximum sentences, and split sentences within the sentencing guidelines.
Currently, the state’s sentencing guidelines do not provide any information or advice on probation term lengths, maximum sentences, or split sentences. Without guidance, the length of sentences to supervision may be longer than necessary, which leads to a strain on limited resources and an inability of probation and parole officers to provide effective supervision and improve recidivism outcomes.
Since the guidelines do not provide recommended probation term lengths, probation terms that are imposed do not reflect a person’s criminal history and may be either longer or shorter than would be advisable based on a person’s risk of reoffending.84
Also, the lack of guidance in the guidelines on maximum sentences impacts the length of parole terms. Parole terms are based on the difference between a person’s maximum sentence and his or her release date. For example, if someone receives a maximum sentence of 36 months and is released at 13 months, he or she will serve the remaining 23 months of the 36-month term on parole supervision. State law requires that the maximum sentence be at least twice as long as the minimum.85 In many cases, however, maximum sentences are three or four times longer than the minimum, and as a result, almost half of parole supervision terms are longer than three years, and one-fifth of parole terms are longer than five years.86
Split sentences, which add probation supervision on top of often lengthy parole supervision terms, are increasingly used in Pennsylvania. Between 2005 and 2014, the use of split sentences increased by 23 percent, from 13,318 to 16,346.87 A third of felony probation sentences and half of prison split sentences include probation terms that exceed three years, despite the fact that the likelihood of recidivism is highest in the first year on supervision and decreases substantially in each subsequent year.88
This policy option requires the PCS to study sentence lengths—specifically the length of sentences to probation, maximum sentences, and split sentences—to determine the most appropriate supervision term lengths. By studying sentence lengths, the PCS will glean information that will allow it to update the sentencing guidelines, while reducing unnecessarily long supervision terms, enabling probation and parole officers to focus their time on people who are at a high risk of reoffending.
14 Justice Reinvestment in Pennsylvania
D. Streamline the selection process for the SIP program.
The SIP program is a substance use treatment program for people sentenced to state prison who meet certain eligibility criteria (e.g., the crime they committed was motivated by substance use and was not a violent offense).89 The two-year program gradually moves the person from treatment while incarcerated to treatment while on supervision. SIP is a cost-effective disposition that is associated with better recidivism outcomes than incarceration in state prison.90
Stakeholders suggested that the legislature should streamline the cumbersome selection process for admissions to SIP in order to make it a more appealing sentencing option to judges. The current selection process for SIP requires the court to first determine a person’s eligibility, after which the DOC must conduct a comprehensive assessment to determine the person’s treatment needs. Finally, the judge sentences the person to SIP.
This policy option calls for converting SIP from a sentencing option to a DOC program, thereby streamlining the selection process so that more people can be served.
Under the new process, the court will be responsible for determining whether a person is eligible for SIP based on the requirements listed in statute, and after the person is sentenced to state prison, DOC will conduct a comprehensive assessment, as it currently does, and decide whether to place the person in the program.
The new process will eliminate the need for the court to send a person to be assessed (after determining their eligibility for SIP) and then have the person return for sentencing. DOC will handle both the assessment and placement decision, thereby making program selection more seamless, and increasing utilization.
In recent years, DOC and PBPP have devoted significant time and energy to improving the use of sanctions and community corrections resources—facilities that offer treatment and programs—for people on parole. Despite these efforts, recidivism remains high for people on parole in Pennsylvania, resulting in the state spending about $224 million per year to incarcerate people who are revoked to prison for violating the conditions of their parole supervision.91
A. Adopt admission criteria for community corrections facilities and use performance-based contracts for community corrections programs.
The state spends almost $132 million annually on residential community corrections facilities and $8 million annually on nonresidential programs that are intended to reduce recidivism for parolees. Even though the state spends money on a variety of facilities and programs for people on parole, the lack of structure and accountability for these
resources prevents them from having the maximum impact on recidivism.
More than half of the people released on parole in FY2015 were sent to a DOC Community Corrections Center (CCC) or a private Community Contract Facility (CCF) rather than assigned to a home plan, despite the fact that recidivism rates are higher for people released to these centers, regardless of their risk levels.92 Across risk levels, the recidivism rate for people released to a home plan was 33 percent as compared to 41 percent for those released to CCC or CCF facilities.93 The primary reason so many people are released to these centers is because they do not have a viable home plan to secure stable housing, and the parole board generally prefers not to release people to the community if they are likely to be homeless. Rather than using valuable space in centers for people without home plans, these people should be connected to resources that will help them secure stable housing sooner. For example, one of the resources available is the existing housing
POLICY OPTION 6:Improve parole supervision.
Increase public safety and reduce recidivism
Reduce the state prison population

Policy Framework 15
assistance program for people on parole, which subsidizes the cost of housing for people who need it.
Although PBPP has taken steps to improve supervision practices by sending people who violate parole to community corrections centers—CCCs, CCFs, and Contracted County Jails (CCJs)—rather than state prisons, there are no admission criteria to help prioritize assignments within these facilities based on their risk and needs. This means that people of all risk levels interact with one another at these facilities, providing opportunities for people who are at a low risk of reoffending to be negatively influenced by people who are at a higher risk of reoffending.
Nonresidential programs also lack clear criteria for prioritizing who should be assigned to them. These programs include a range of resources that parole officers can use to assist clients, including support for housing, employment, mentoring, mental health, sex offender treatment, and substance use treatment. Further, there are no mechanisms in place to track and monitor the quality of these programs or to hold service providers accountable for outcomes.
This policy option requires the development of community corrections facility admissions criteria based on the risk and needs of people on parole and the use of performance-based contracts for nonresidential community corrections programs.
People will be placed in a community corrections center if they are assessed as being at a high risk of reoffending and have treatment needs that can be addressed using available programing in the center. If residential centers are reserved for high-risk people, these facilities will be able to focus resources to yield a maximum impact for this population. This change would also allow the state to maximize its investment rather than expend valuable resources continuing to hold people who should be released from prison to home plans.
In 2013, DOC began using performance-based contracts for some residential CCFs.94 Expanding this approach to nonresidential programs will allow the DOC to increase its oversight of organizations that provide programming and ensure that they are delivering quality programs and improving outcomes for the people they serve. The DOC can hold these providers accountable by requiring them to adhere to standards established in their contracts in order to continue receiving funding.
B. Allow parole officers to use swift and certain sanctions in response to supervision violations.
Currently, if a person violates a condition of his or her parole, parole officers may respond in a variety of ways. For example, they can issue a written warning, impose a curfew, require participation in a treatment program, or revoke the person’s supervision and place him or her in a parole violator center. The parole officer’s response would depend on the seriousness and frequency of the violations. However, current statutes do not allow parole officers to use swift, certain, and proportionate confinement sanctions for technical parole violations. Without this option, parole officers are limited in their ability to help change the behavior of the people they supervise and reduce recidivism.
This policy option allows officers to use short sanctions of incarceration as a response to technical parole violations.
Research shows that using immediate sanctions of brief periods of incarceration in response to violations helps change the behavior of people on supervision better than lengthy sanctions imposed long after the violation. Swift, certain, and proportionate sanctions for violations can increase compliance with the conditions of supervision, because people on supervision see the response as a direct consequence of their behavior and are therefore more likely to change future behavior.95 If a sanction is carried out immediately after a violation, punishments as short as one or two days have been shown to improve behavior.96 As behavior improves, incarceration costs for people who violate their supervision decrease. For example, in 2011, North Carolina enabled its probation officers to respond to violations with short confinement sanctions. As a result, probation revocations to prison fell by more than half between 2011 and 2014.97
16 Justice Reinvestment in Pennsylvania
1. “U.S. Department of Justice, Federal Bureau of Investigation,” https://www.bjs.gov/ucrdata/Search/Crime/Crime.cfm; Prison Policy Intiative, “Correctional Control: Incarceration and supervision by state” press release, June 1, 2016; Brian Sigritz et al., State Expenditure Report Fiscal 2014-2016 ( Washington, DC: National Association of State Budget Officers, 2016); CSG Justce Center analysis of the Pennsylvania Department of Corrections annual jail statistics for 2014, August 18, 2016.
2. CSG Justice Center analysis of DOC Admission data, Pennsylvania Commission on Sentencing data, and Pennsylvania Board of Probation and Parole data, 2014.
3. Pennsylvania Crimes Code, Judicial Code, and Prisons and Parole Code Act 122 and 196 (2012).
4. Pennsylvania Office of the Governor “Pennsylvania State Prison Population Records Largest Decrease in 40 Years”, news release, January 16, 2016.
5. See Commonwealth v. Hopkins, 98 MAP 2013 (M.D. Pa 2015); Alleyne v. United States, 455 A. 2d 887 (D.D.C. 1983); Kuren et al. v. Luzerne County, 58 MAP 2015 (Pa. 2015).
6. CSG Justice Center analysis of Pennsylvania Department of Corrections, Pennsylvania Commission on Sentencing, Pennsylvania Commission on Crime and Delinquency, and University of Maryland recidivism data, 2009 and 2012.
7. CSG Justice Center Pennslyvania Monthly Activity Reports, January 30, 2017.
8. Brian Sigritz et al., State Expenditure Report Fiscal 2005-2015.
9. CSG Justice Center analysis of Pennsylvania Department of Corrections data, 2014.
10. CSG Justice Center analysis of Pennsylvania Department of Corrections Annual Statistical Report, 2014; CSG Justice Center analysis of the Pennsylvania Board of Probation and Parole, County Adult Probation and Parole Annual Statistical Report, 2014; Brian Sigritz et al., State Expenditure Report Fiscal 2014-2016.
11. CSG Justice Center analysis of DOC admission data and Pennsylvania Commission on Sentencing data, 2014.
12. CSG Justice Center analysis of Pennsylvania Commission on Sentencing data, 2014.
13. Crime in Pennsylvania Annual Uniform Crime Reports, 2005-2014.
14. CSG Justice Center focus group of superior and district court judges, August 2015.
15. CSG Justice Center analysis of the Pennsylvania Pretrial Services Association Survey Results, 2015.
16. CSG Justice Center analysis of the Administrative Office of Pennsylvania Courts data, 2015.
17. Ibid.
18. Ibid.
19. Ibid; Without controlling for any other factors that likely play a part in bail decision making (e.g., criminal history, pending charges/warrants, supervision status, behavioral health issues, history of flight, public safety threat, employment, housing).
20. CSG Justice Center analysis of Pennsylvania Commission on Sentencing data, 2014.
21. CSG Justice Center, Pennsylvania Department of Corrections, Pennsylvania Commission on Sentencing, Pennsylvania Commission on Crime and Delinquency, and University of Maryland analysis of recidivism data, 2009 and 2012.
22. CSG Justice Center analysis of Pennsylvania Commission on Sentencing data, 2014.
23. Ibid; “Sentencing volume” refers to the number of judicial proceedings and includes both misdemeanors and felonies, but does not include Philadelphia Municipal Court data.
24. CSG Justice Center analysis of Pennsylvania Commission on Sentencing data, 2005-2014.
25. CSG Justice Center analysis of Pennsylvania Commission on Sentencing data, 2014.
26. Ibid.
27. CSG Justice Center analysis of DOC admission data and Pennsylvania Commission on Sentencing data.
28. Lee, S et al., Return on investment: Evidence-based options to improve statewide outcomes (Olympia: Washington State Insititute for Public Policy, 2012).
29. “U.S. Census Bureau,” http://www.census.gov/ econ/census/help/geography/regions_and_divisions.html; Incarceration rate here is the state prison incarceration rate, as opposed to the total incarceration referenced above, which includes county and state prison. The northeastern states include Connecticut, Maine, Massachusetts, New Hampshire, New Jersey, New York, Pennsylvania, Rhode Island, and Vermont, as defined by the U.S. Census Bureau.
30. E. Ann Carson, Prisoners in 2015 (Washington, DC: U.S. Department of Justice, Bureau of Justice Statistics, 2015); In 2015 the national incarceration rate was 458 per 100,000 people, PA was ranked 23rd nationally and first in the
ENDNOTES
Policy Framework 17
Northeast. Individual state rates listed: PA 387, CT 312, NY 260, NJ 228, NH 217, VT 206, RI 204, MA 179, ME 132.
31. Ibid; Paige Harrison and Allen Beck, Prisoners in 2004 (Washington, DC: U.S. Department of Justice, Bureau of Justice Statistics, 2005).
32. “Pennsylvania Commission on Crime and Delinquency,” http://pacrimestats.info/trend_reports.aspx?p=\2013\ Prisons_and_Jails\County_Jail_Population; Paige Harrison and Allen Beck, Bureau of Justice Statistics Bulletin: Prisoners in 2004; E. Ann Carson, Prisoners in 2014 (Washington, DC: U.S. Department of Justice, Bureau of Justice Statistics, 2015); Danielle Kaeble et al., Correctional Populations in the United States (Washington, DC: U.S. Department of Justice, Bureau of Justice, 2014).
33. CSG Justice Center analysis of Pennsylvania Department of Corrections Annual Statistical Report, 2011.
34. CSG Justice Center analysis of Pennsylvania Department of Corrections Annual Statistical Report , 2013 and 2015.
35. The DOC defines short minimum sentences as those with less than a year remaining on the minimum sentence at intake, after taking time served into account.
36. CSG Justice Center analysis of Pennsylvania Department of Corrections data, 2014.
37. Ibid; Does not include people that were involved in an early release program (State Intermediate Punishment (SIP), Recidivism Risk Reduction Incentive (RRRI), Boot Camp).
38. Brian Sigritz et al., State Expenditure Report Fiscal 2005-2015.
39. Ibid.
40. Some county costs cannot be accounted for (e.g., county funding for CIP or community corrections).
41. Legislative Budget and Finance Committee, Funding of County Adult Probation Services (Harrisburg: Legislative Budget and Finance Committee , 2015); Texas Board of Criminal Justice, Operating Budget for Fiscal Year 2016 (Austin: Texas Board of Criminal Justice, 2015).
42. Ibid. p. 24, 46–59.
43. Pennsylvania Board of Probation and Parole, County Adult Probation and Parole Annual Statistical Report, (Harrisburg: Pennsylvania Board of Probation and Parole, 2014); Pennsylvania Board of Probation and Parole, Monthly Program Report, (Harrisburg: Pennsylvania Board of Probation and Parole, 2014).
44. CSG Justice Center survey of probation officers, October 2016.
45. Ibid.
46. CSG Justice Center analysis of the Pennsylvania Board of Probation and Parole, Monthly Statistics Reports, 2012 and 2014.
47. Ibid.
48. “Pennsyvania Department of Corrections: What is Community Corrections,” http://www.cor.pa.gov/Facilities/CommunityCorrections/Pages/What-is-Community-Corrections.aspx#.WLmi_rGZO8V. Community corrections resources are facilities that offer a range of treatment and programs to people on parole in order to help improve recidivism rates.
49. CSG Justice Center analysis of the Pennsylvania Board of Probation and Parole, Monthly Statistics Reports.
50. CSG Justice Center analysis of DOC Admission data, Pennsylvania Commission on Sentencing data and Pennsylvania Board of Probation and Parole data, 2014.
51. CSG Justice Center analysis of DOC Admission data and Pennsylvania Commission on Sentencing data, 2014.
52. CSG Justice Center staff, Conversation with Parole Board, June 29, 2016.
53. CSG Justice Center analysis of Pennsylvania Department of Corrections data, 2014.
54. Ibid.
55. Lee, S et al., Return on investment: Evidence-based options to improve statewide outcomes (Olympia: Washington State Insititute for Public Policy, 2012).
56. CSG Justice Center, Pennsylvania Department of Corrections, Pennsylvania Commission on Sentencing, Pennsylvania Commission on Crime and Delinquency, and University of Maryland analysis of recidivism data, 2009 and 2012.
57. Legislative Budget and Finance Committee, Funding of County Adult Probation Services.
58. Texas Board of Criminal Justice, Operating Budget for Fiscal Year 2016, p. 17.
59. Legislative Budget and Finance Committee, Funding of County Adult Probation Services, p. 46-59.
60. Ibid. p. S-4.
18 Justice Reinvestment in Pennsylvania
61. CSG Justice Center analysis of DOC admission data and Pennsylvania Commission on Sentencing data, 2014.
62. Pennsylvania Board of Probation and Parole, County Adult Probation and Parole Annual Statistical Report, 2014.
63. CSG Justice Center victim advocate focus groups in Harrisburg, Camp Hill, Philadelphia, Cranberry Township and State College, April-August 2016.
64. Brian Reaves, 2008 Census of State and Local Law Enforcement Agencies (Washington, DC: US Department of Justice, Office of Justice Programs, Bureau of Justice, 2011).
65. “The Unified Judicial System of Pennsylvania”, http://www.pacourts.us/learn.
66. CSG Justice Center survey of probation officers.
67. Tony Fabelo and Michael Thompson, “Reducing Incarceration Rates: When Science Meets Political Realities,” Issues in Science and Technology 32, no. 1 (Fall 2015).
68. CSG Justice Center analysis of Administrative Office of Pennsylvania Courts data, Percentage of Filed Court Cases with Monetary Bail by County Class and Lead Offense Level, 2015.
69. Ibid.
70. Without controlling for any other factors that likely play a part in bail decision making (e.g., criminal history, pending charges/warrants, supervision status, behavioral health issues, history of flight, public safety threat, employment, housing).
71. Rothgery v. Gillespie County, 554 U.S. 191 (U.S. 2008).
72. “Safety and Justice Challenge,” safetyandjusticechallenge.org/challenge-site/philadelphia/.
73. CSG Justice Center meeting with probation officers, October 2016.
74. CSG Justice Center analysis of Pennsylvania Commission on Sentencing data, 2014.
75. CSG Justice Center analysis of Pennsylvania commission on sentencing data, 2015.
76. Ibid.
77. Ibid.
78. CSG Justice Center analysis of Pennsylvania Commission on Sentencing data, 2014.
79. CSG Justice Center analysis of Pennsylvania Department of Corrections admission data and Pennsylvania Commission on Sentencing data, 2014.
80. While propensity score matching works to counteract the effects of selection bias, matched comparison rates only represent those cases that could be included in the matched groups, not the entirety of those sentenced to each option. The covariates used in the analysis are limited to those that the CSG Justice Center has access to in the data. For example, a substance abuse indicator would likely be very helpful for comparing sentencing options like SIP, CIP, and D&A RIP, but that data was not available. Overall recidivism measure could only be completed for five counties where we had access to county prison admission and release data. These five counties are not necessarily representative of the entire state. The county prison rearrest period is based on an estimated date of release from incarceration (the minimum date), therefore the three-year exposure period for recidivism will not always be entirely accurate. A small percentage of cases from sample cohorts were dropped for various reasons such as missing ID numbers, or conflicting release information. SIP and CIP recidivism events may be slightly under-counted because they are incarcerated in the first phase of the program and less exposed to rearrest/reincarceration. It is important to keep in mind the difference between statistical significance and practical significance. Statistical significance tests whether we can rule out chance as the explanation for any difference in outcomes, and is influenced by sample size. While a difference of one percentage point may be statistically significant, it is not a strong effect size, and practically speaking, it is not significant. The study attempts to compare subjects who are similar in terms of: age, race, sex, county class, sentencing level, offense type, offense gravity score, prior record score, prior arrest offense categories and age at first arrest.
81. CSG Justice Center, Pennsylvania Department of Corrections, Pennsylvania Commission on Sentencing, Pennsylvania Commission on Crime and Delinquency, and University of Maryland analysis of recidivism data, 2009 and 2012.
82. James Bonta and D.A. Andrews, Risk-Need Responsivity Model for Offender Assessment and Rehabilitation (Ottawa: Public Safety Canada, 2007),73; Christopher T. Lowenkamp, Edward J. Latessa, and Alexander M. Holsinger, The Risk Principle in Action: What Have We Learned From 13,676 Offenders and 97 Correctional Programs? (Cinncinatti: Crime and Delinquency, 2006).
83. Pennsylvania Commission on Sentencing, Strategic Planning Working Group Final Report (State College: Pennsylvania Commission on Sentencing, 2016).
84. CSG Justice Center analysis of Pennsylvania Commission on Sentencing data, 2014.
85. 42 Pa.C.S.§ 9756
86. CSG Justice Center analysis of Pennsylvania Commission on Sentencing data, 2014 and 2015; Kiminori Nakamura, Applying Redemption to the Length & Level of Parole Supervision (College Park: University of Maryland, Department of Criminology and Criminal Justice, 2016).
Policy Framework 19
87. CSG Justice Center analysis of Pennsylvania Commission on Sentencing data, 2005 and 2014.
88. CSG Justice Center analysis of Pennsylvania Commission on Sentencing data, 2014; Pennsylvania Department of Corrections, Recidivism Report (Mechanicsburg: Pennsylvania Department of Corrections, 2013).
89. Kristofer Bret Bucklen, Nicolette Bell, and Dean Lategan, State Intermediate Punishment Program: 2017 Performance Report (Mechanicsburg: Bureau of Planning, Research and Statistics, 2017).
90. CSG Justice Center, Pennsylvania Department of Corrections, Pennsylvania Commission on Sentencing, Pennsylvania Commission on Crime and Delinquency, and University of Maryland analysis of recidivism data, 2009 and 2012.
91. CSG Justice Center Justice analysis of DOC admission data and Pennsylvania Commission on Sentencing data, 2014.
92. CSG Justice Center analysis of Pennsylvania Board of Probation and Parole data, 2015.
93. Pennsylvania Department of Corrections analysis of community corrections recidivism data, Community Corrections Centers, Parolees, and Recidivism: An Investigation into the Characteristics of Effective Reentry Programs in Pennsylvania, May 2009.
94. “Pennsylvania Department of Corrections: What is Community Corrections.”
95. Eric Wodahl et al. “Responding to probation and parole violations: Are jail sanctions more effective than community-based graduated sanctions?” Journal of Criminal Justice 43 (2015): 242–250.
96. Angela Hawken and Mark Kleiman, Washington Intensive Supervision Program evaluation report (Seattle: Rand Corporation, 2011).
97. The Council of State Governments Justice Center, Justice Reinvestment in North Carolina: Three Years Later (New York: The Council of State Governments Justice Center, 2014).
20 Justice Reinvestment in Pennsylvania
The Council of State Governments (CSG) Justice Center is a national nonprofit organization that serves policymakers at the local, state, and federal levels from all branches of government. The CSG Justice Center provides practical, nonpartisan advice and evidence-based, consensus-driven
strategies to increase public safety and strengthen communities. Points of view, recommendations, or findings stated in this document are those of the authors and do not necessarily reflect the official position or policies of The Pew Charitable Trusts, The Council of State Governments Justice Center,
or The Council of State Governments’ members.
For additional information about Justice Reinvestment in Pennsylvania, please visit csgjusticecenter.org/jr/pa.
Research and analysis described in this report has been funded in part by The Pew Charitable Trusts public safety performance project. Launched in 2006 as a project of the Pew Center on the States, the public safety performance project seeks to help states advance fiscally sound, data-driven
policies and practices in sentencing and corrections that protect public safety, hold offenders accountable, and control corrections costs. To learn more about the project, please visit pewtrusts.org/publicsafety.
This project was supported by Grant No. 2015-ZB-BX-K001 awarded by the Bureau of Justice Assistance. The Bureau of Justice Assistance is a component of the Office of Justice Programs, which also includes the Bureau of Justice Statistics, the National Institute of Justice, the Office of
Juvenile Justice and Delinquency Prevention, the Office for Victims of Crime, and the SMART office. Points of view or opinions in this document are those of the author and do not necessarily represent the official position or policies of the U.S. Department of Justice. To learn more about the Bureau
of Justice Assistance, please visit bja.gov.
Patrick Armstrong, Esq.Senior Policy [email protected]
Project Contact: