justice brief the jail population
TRANSCRIPT

1
The City of New YorkMayor Bill de Blasio
Criminal JusticeElizabeth Glazer Director
Justice Brief
The Jail PopulationRecent declines and opportunities for further reductions

2
NOTE FROM ELIZABETH GLAZER, DIRECTOR OF THE MAYOR’S OFFICE OF CRIMINAL JUSTICE
Jails hold up a mirror to the fair functioning of society. Who goes in and how long they stay are the two barometers of the size of a jail population and reflect how the many different parts of the criminal justice system, and New Yorkers themselves, act. How many people commit offenses? What decisions do police officers make about arrest? How do prosecutors weigh the evidence? What determinations do judges make about bail and what options do they have to release or detain? Do New Yorkers serve as jurors or testify as witnesses? How quickly do courts, district attorneys and defenders move a case to conclusion? These are just some of the factors that affect the size and composition of our jail population. The complexity of reducing the jail population while ensuring the public is safe is deepened by the absence of any one “boss” of the criminal justice system and the intentional independence of various parts of government. The court system operates as a separate branch of state government. The District Attorneys—one for each county in New York City—are elected. The Police Department and the Department of Correction are Mayoral agencies. Defenders are dedicated by ethical canon to the zealous defense of their clients. Despite these complexities, New York, singularly among the nation’s large cities, has been successful in both keeping crime rates low and reducing the size of the jail population. Over the span of more than 20 years, crime has declined by 76% while the jail population has dropped by half. Over the last three years that trend has accelerated due to the partnership and focus of all the parts of the criminal justice system: as crime has gone down by 9%, the jail population has reduced by 18%, the single biggest drop since 2001. In the last three years —because of deliberate efforts to rethink policing strategy, expand alternatives to jail, and reduce case delay—fewer people are entering city jails and those who do enter are staying for less time. This has led to steep declines for some people admitted to jail: those detained on bail under $2,000, down 36%; detainees facing misdemeanor charges, down 25%; those serving city sentences, down 34%; people under 21, down 18%; and mental health service users, down 7%. And for the first time in decades, the average length of a Supreme Court case in New York City has shrunk by 18 days. How much further can we reduce the jail population? That is the question of the moment. Over the past twenty years, the number of people held on violent offenses has increased by 56%, while lower level offenses (in particular drug offenses) have dropped 51%. Today 91% of the pretrial population at Rikers is held on a felony charge (49% on violent felony charges), over half of the jail population is facing multiple cases and 69% are at medium or high risk of failing to appear in court, the primary basis on which a New York State judge can hold a defendant. As we look to the future, further reductions will depend upon the actions of New Yorkers themselves in reducing crime and on every part of the criminal justice system working together to ensure that we use jail as parsimoniously as possible while ensuring public safety.

3
New York City has the lowest incarceration rate of all large U.S. cities and is focusing its efforts on bringing that number still lower. This Justice Brief shows:
• what drives the size of the jail population; • how the composition of the jail population has changed over time; and • where the path lies to the sharpest reductions possible while still lowering crime.
NYC CONTEXT: DECLINING CRIME, DECLINING USE OF JAIL
New York CityNY
194
Los AngelesCA
263
ChicagoIL
281
Houston TX
294
Philadelphia PA
810
PhoenixAZ
302
San Antonio TX
312
San Diego CA
259
Dallas TX
368
San Jose CA
309
167 Estimated 2016 rate
NYC JAIL USE IS THE LOWEST AMONG LARGEST U.S. CITIES 2014 INCARCERATION RATE PER 100,000 PEOPLE
Source: Vera Institute of Justice, “Jail incarceration rate”, 2015; available at http://trends.vera.org/incarceration-rates.

4
Since 1993, major crime* in New York City has declined by 76%, and the average daily jail population has declined by 50%. That trend has accelerated in the last three years, with major crime declining by 9%, and the jail population by 18%, the single biggest drop since 2001.
BOTH MAJOR CRIME & THE SIZE OF THE JAIL POPULATION HAVE DROPPED DRAMATICALLY OVER TIME AVERAGE DAILY JAIL POPULATION; MAJOR CRIME IN NEW YORK CITY
NYC CONTEXT: DECLINING CRIME, DECLINING USE OF JAIL
Sources: The City of New York, Mayor’s Management Report (New York: Mayor’s Office of Operations’ Performance Management Team, 2016); New York Police Department CompStat Unit, Year-End Report 2016. *Major crime includes: murder, rape, robbery, assault, burglary, larceny, grand larceny automotive. **The average daily jail population has continued to decline. In 2017, the average daily population is 9400.
13,497
9,758
101,610
130,093
2006 2007 2008 2009 2010 2011 2012 2013 2014 2015 2016
9% decrease in major crime in the last
3 years
18% decrease in the jail
population in the last 3 years*
2006 2007 2008 2009 2010 2011 2012 2013 2014 2015 2016

5
JAIL POPULATIONS WITH STEEPEST DECLINES JAIL POPULATION REDUCTIONS OVER THE LAST THREE YEARS
POPULATION DECLINE REDUCTION STRATEGY
In the past three years, the following jail populations have shown the steepest size declines:
*These are individuals who have been convicted and are serving a sentence of one year or less. Sentences of longer than one year are served in State prison. Source: Mayor’s Office of Criminal Justice analysis of Department of Correction data.
Misdemeanor detainees
5600 fewer jail admissions (-25%)
Reduce number of people who enter jail
(Supervised Release, bail reform, enforcement strategy)
City-sentenced population*
3900 fewer jail admissions (-34%)
Reduce number of people who enter jail
(alternatives to incarceration)
Non-violent felony detainees
2530 fewer jail admissions (-13%)
Reduce number of people who enter jail
(Supervised Release, bail reform, enforcement strategy)
Mental health service users
297 fewer in custody on an
average day (-7%)
Reduce number of people who enter jail (diversion)
and reduce length of stay (enhanced programming and services in custody to avoid
decompensation and case delay)
Detainees with bail up to $2,000
244 fewer in custody on an
average day (-36%)
Reduce number of people who enter jail
(Supervised Release, bail reform, enforcement strategy)
People in custody for longer
than one year
110 fewer in custody on an
average day (-8%)
Reduce length of stay (shortening case processing times)
Adolescents (16-to-17) and young adults
(18-to-21)
64 fewer adolescents in custody on an average day
(-30%); 233 fewer young adults in custody on an
average day (-18%)
Reduce number of people who enter jail (diversion) and reduce
length of stay (shortening case processing times)
� �
� �
� �
� �
� �
� �
� �
NYC CONTEXT: DECLINING CRIME, DECLINING USE OF JAIL

6
People enter jail because of a series of decisions made by police, judges, prosecutors, defenders, and defendants at different points in the criminal justice system. At each decision point, an individual is either directed away from or to jail: a police officer may make an arrest or not; a prosecutor may bring charges or not; and the judge may at any time dismiss a case, set bail, remand to jail, or release with either no conditions or some conditions.
WHAT DRIVES THE SIZE OF THE JAIL POPULATION?
ONLY A VERY SMALL PROPORTION OF POLICE ENCOUNTERS RESULT IN JAIL ADMISSION
Held on remand
ARREST394K
ARRAIGNMENT306K
DISPOSITION244K
Jail
46K
Probation
Prison
6,400
Case dismissed
Acquitted
POLICE ENCOUNTER
674K
Summons No formal action taken
Custodial arrest
Desk appearance
ticket
SENTENCING
Non- incarcerative
Disposed at arraignment
Bail set, not made
37K
Released
2,100
Key steps
Summons or desk request
Dismissal or non-incarcerative
Path to Jail
Incarcerative
121K
Convicted
���
�
�
Sources: Annual data published by the New York Police Department, NYC Criminal Justice Agency, and NYS Division of Criminal Justice Services.
�

7
1. CRIME TRENDS Crime drives jail: without crime there would be no jail, even though not every arrest results in a person entering jail. As crime rates have fallen, so has the number of people held in custody on any given day. The total number of the seven major crimes2 in New York City has fallen 76% since 1993, from 429,486 in 1993 to 101,610 in 2016. Arrests for offenses most likely to result in the individual being jailed have dropped dramatically since 1993: murder is down 82%, robbery 80%, and felony assaults 68%.
120000
100000
80000
60000
40000
20000
0 Murder Rape Robbery Felony Assault Burglary Grand Larceny Grand Larceny Auto
EVERY TYPE OF MAJOR CRIME HAS DECLINED IN THE LAST 20 YEARS TOTAL NUMBER OF 7 MAJOR CRIMES IN NEW YORK CITY
New York Police Department CompStat Unit, Year-End Report 2016.
1993 2014 2016
WHAT DRIVES THE SIZE OF THE JAIL POPULATION?
82%DECLINE
94%DECLINE
81%DECLINE
85%DECLINE
68%DECLINE
80%DECLINE
49%DECLINE
8
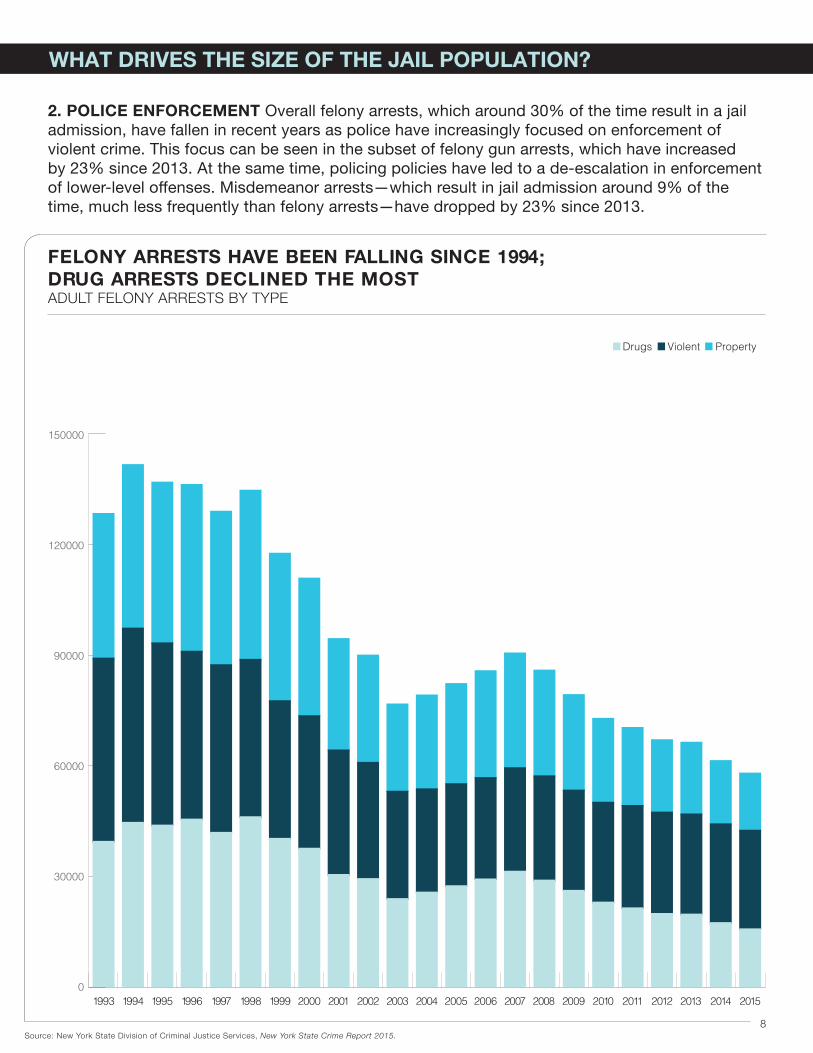
2. POLICE ENFORCEMENT Overall felony arrests, which around 30% of the time result in a jail admission, have fallen in recent years as police have increasingly focused on enforcement of violent crime. This focus can be seen in the subset of felony gun arrests, which have increased by 23% since 2013. At the same time, policing policies have led to a de-escalation in enforcement of lower-level offenses. Misdemeanor arrests—which result in jail admission around 9% of the time, much less frequently than felony arrests—have dropped by 23% since 2013.
FELONY ARRESTS HAVE BEEN FALLING SINCE 1994; DRUG ARRESTS DECLINED THE MOST ADULT FELONY ARRESTS BY TYPE
2014201320122011201020092008200720062005200420032002200120001999199819971996199519941993 2015
150000
120000
90000
60000
30000
0
Source: New York State Division of Criminal Justice Services, New York State Crime Report 2015.
Drugs Violent Property
WHAT DRIVES THE SIZE OF THE JAIL POPULATION?

9
3. PROSECUTORIAL ACTIONS After an arrest, prosecutors decide whether to charge an individual with a crime. At the first court appearance, called arraignment, prosecutors can recommend to the judge that an individual be released with or without conditions, have bail set, or be remanded to jail.
4. JUDGES’ DECISIONS Judges decide whether to release an individual at arraignment. To assist in this decision, the City’s pre-trial services agency interviews the defendant and uses a scientific risk assessment instrument to determine the likelihood of a person returning for future court dates. Except in limited circumstances, the law forbids judges from considering the danger a person poses to the community. In New York City, of all the cases that continue past arraignment (that is, they are not dismissed or defendants do not take a plea), judges release 70% of people without setting any conditions (known as release on recognizance or ROR); set bail in 29% of cases (8% pay bail at arraignment); and remand 1% to custody (ordered held with no bail) for the length of their case. Those who do not pay bail at arraignment enter jail. Judges are more likely to release a defendant without conditions or set low bail in cases where people are charged with lower level offenses or present a lower risk, while they are more likely to set higher bail in cases with more serious charges or risk. The majority of remands are for violent felony charges.3
CASES IN BROOKLYN AND MANHATTAN RESULT IN THE MOST JAIL ADMISSIONS CASES BY BOROUGH
Source: New York City Criminal Justice Agency, Inc. Annual Report 2015.
24%BROOKLYN
33%MANHATTAN
19%QUEENS
19%BRONX
3%STATEN ISLAND
WHAT DRIVES THE SIZE OF THE JAIL POPULATION?

10
FOUR OUT OF EVERY 10 CASES ARE DISPOSED AT ARRAIGNMENT; FOR THOSE CONTINUED, 78% ARE RELEASED AT ARRAIGNMENT; 22% ARE TAKEN INTO DEPARTMENT OF CORRECTION CUSTODY CRIMINAL COURT ARRAIGNMENT OUTCOMES
70%
ROR
21% BAIL SET, NOT MADE
8%
BAIL SET, MADE
1%REMAND
48%DISMISSED/
ADJOURNMENT IN CONTEMPLATION
OF DISMISSAL52% PLED
GUILTY
OTHER<1%
60% CASE CONTINUED
CASE DISPOSED40%
�
�
Source: New York City Criminal Justice Agency, Inc. Annual Report 2015.
WHAT DRIVES THE SIZE OF THE JAIL POPULATION?

11
JAIL SERVES THREE MAIN PURPOSES:
1. Detention of those facing criminal charges. 75% of the New York City jail population are people charged with a misdemeanor or felony who are held without bail (remand) or have bail set but have not paid it. These individuals can be released within a few days or stay for longer periods of time while their case (or cases) resolves.4
2. Punishment for those convicted of an offense, sentenced to one year or less of incarceration. 13% of the New York City jail population is serving a sentence of one year or less. Sentences of over one year are served in state prisons.
3. Incarceration holds required by law. 12% of the New York City jail population is either detained on court warrants or state parole violations, or awaiting transfer to state custody or another jurisdiction.
WHO IS IN JAIL?
Pre-trial
22
75
111
46
17
Parole Violators
Non-violent Felony Detainees
City Sentenced
Misdemeanor Detainees
Violent Felony Detainees
Other*
600
2910
3420
600
1300
570 55
WHO IS IN JAIL AND HOW LONG THEY STAY (2017) 75% OF THE AVERAGE DAILY POPULATION ARE PRE-TRIAL DETAINEES; 25% ARE JAILED FOR OTHER REASONS
CATEGORIES OF PEOPLE IN NYC JAIL ON AN AVERAGE DAY
AVERAGE LENGTH OF STAY (DAYS)
*Other includes warrants and state holds. Source: The Mayor’s Office of Criminal Justice analysis of New York City Department of Correction Data, 2017.

12
AGE
SEX
RACE
25%
15%22–25
16%50+
14%26–29
2% 16–17
11% 18–21
30-39
17%40-49
Note: More information available at Department of Correction stats page and Mayor’s Office of Criminal Justice Knowledge project. Numbers are rounded to nearest whole number.
7%Female
93%Male
54%African- American 34%
Hispanic
2%Asian 7%
White
3%Other
MENTAL HEALTH DIAGNOSES
58%No Diagnosis
42%Confirmed Diagnosis
RISK OF RECIDIVISM
24%Medium-high
34%
21%Medium-low
14%Low
5%High
3%Missing
Medium
DEMOGRAPHICS OF THE CURRENT JAIL POPULATION
WHO IS IN JAIL?

13
Over the past 20 years, the composition of the jail population has shifted as it has decreased in size. Changes in police enforcement and an expansion of diversion programs have reduced the number of people held on misdemeanor and non-violent felony charges (such as drug possession). As the population becomes smaller, a greater percentage are held on serious or violent charges or a judge has determined that they pose a high risk of missing a court appearance.
• Mirroring the pattern of arrests, the number of people held on drug charges has fallen by 51% since 1996.
• Over the same period, the proportion of people held on violent charges has increased by 56%.
• 69% of today’s jail population ismedium or high risk of missing future court appearances.
• Approximately 51% of the average daily jail population has multiple cases. For some, a warrant may keep them in custody even though they are eligible for release or have bail on another case. For others, there may be multiple serious charges against them, resulting in a longer stay in custody while each case is resolved.
FEWER INDIVIDUALS IN JAIL FOR DRUGS, MORE FOR VIOLENT OFFENSESJAIL POPULATION BY CHARGE TYPE
1996 2000 2006 2011 2016
100
80
60
40
20
011% 15% 18% 18% 18%
27%30%
34% 41% 42%
9%
10%
11%
14% 14%
37%
34%
29%
19% 18%
16%
11%8% 8% 9%
Other* Warrants Drugs Property Violent Offenses
*Top other charges include larceny and criminal contempt. Source: The Mayor’s Office of Criminal Justice analysis of New York City Department of Correction data, 2016.
WHO IS IN JAIL?

14
As the composition shifts towards a population primarily composed of those charged with violent crimes or at risk of not returning to court, further reduction is challenging though not impossible. Two strategies can reduce the number of people in jail: 1. Reduce the number of people who are admitted to Rikers: There were approximately 61,000 admissions into DOC custody in 2016. About half of these people were out in fewer than nine days. This population tends to have lower-level charges and most make bail after a few days in jail, while others plead guilty to low-level offenses and receive short jail sentences. Often this population has a history of chronic returns to jail. Identifying programs that could interrupt this cycle could reduce the number of people admitted. 2. Reduce time spent in custody: In fiscal year 2016, the average length of time spent in custody was 57 days, with violent felony detainees averaging 111 days and misdemeanor detainees averaging 22 days. Even within these groups there is a variance in length of stay. Those who stay the longest are homicide defendants, who stay an average of 390 days. By shortening the amount of time these groups of people spend in jail, the daily population could decrease further.
While there are thousands of jail admissions every month, in 2017 the average daily population was around 9,400. Half of the people admitted leave in under nine days but account for a very small number of beds on an average daily basis. Those staying for longer periods of time occupy more beds on an average daily basis.
HOW TO FURTHER REDUCE THE SIZE OF THE JAIL POPULATION
*Other includes warrants and state holds. Sources: The Mayor’s Office of Criminal Justice analysis of New York City Department of Correction data, 2016.
CURRENT 9400
Below is a visual summarizing the strategies’ projected effect on each segment of the City’s jail population. Additional details on each strategy follows.
State Parole Violators 570
Non-violent Felony Detainees 2910
City Sentenced 1300
Misdemeanor Detainees 600
Violent Felony Detainees 3420
Other* 600
Reduce Admissions
Reduce Admissions
Reduce time in custody
Reduce time in custody
Reduce Admissions
State Parole Violators 400
Non-violent Felony Detainees 1700
City Sentenced 900
Misdemeanor Detainees 300
Other* 600
Violent Felony Detainees 3100

15
SUMMARY OF INTERVENTIONS CURRENTLY IN PROGRESS
STRATEGY ONE: REDUCE ADMISSIONS Diverting misdemeanor and non-violent felony detainees, and those serving a city sentence, could reduce the average daily population over the coming years.
1. Improve risk assessment5 Populations reduced: Misdemeanor and non-violent felony detainees System point: ArraignmentPossible reduction: 710 beds
Providing an updated aid to judges to assist in their assessment of a defendant’s risk of flight could further reduce the jail population. The City’s pre-trial services agency interviews all arraigned individuals and provides an assessment to the courts on that person’s likelihood of returning for future court dates. This type of assessment has been in use since the 1960s. The City is currently working to update the instrument using more recent data and new technology that will allow for more accurate assessments, which could reduce the average daily population in city jails.

16
Felony Misdemeanor Other15000
12000
9000
6000
3000
0
0-6 days 7-13 days 14-30 days 31-90 days 91-180 days 181-365 days Over 1 year
OVER 75% OF PEOPLE WHO POST BAIL DO SO IN UNDER 1 WEEK LENGTH OF TIME INDIVIDUALS ARE DETAINED BEFORE POSTING BAIL
Source: Mayor’s Office of Criminal Justice analysis of New York City Department of Correction data, 2016.
2. Reform the bail system
Populations reduced: Misdemeanor and non-violent felony detainees System point: ArraignmentPossible reduction: 200 beds
A. Help post bail when it is unaffordable. Each year approximately 14,000 people with bail set at $2,000 or below are unable to post it at arraignment and are taken into DOC custody. For some defendants and their families, low amounts of bail can be out of reach financially. The City has launched a new citywide charitable bail fund. Created by the City Council with public funds, the new fund will pay bail in amounts of $2,000 or below for low-and medium-risk misdemeanor defendants.6
Three programs that perform the same service have been in place in the Bronx and Brooklyn since 2012 and have achieved returns to court of 97%.
B. Reduce inefficiencies in the bail payment process. Approximately 75% of people who pay bail do so within seven days of arraignment. To avoid these unnecessary days in jail, the City is working to make it easier for defendants to pay the bail a judge has set. An online bail payment system and ATMs in every courthouse will be in place by summer 2017. Additionally, the City anticipates expanding the number of “bail expediters” citywide, staff who can assist defendants in identifying who could help them post bail, contact those people to let them know that bail has been set, and ensure that defendants are held at courthouses, not in jail, until bail has been posted. Currently, bail expediters help approximately 1,000 people per year to avoid a jail admission and could assist additional individuals after the expansion.
SUMMARY OF INTERVENTIONS CURRENTLY IN PROGRESS

17
14 MONTHS OF SUPERVISED RELEASE INTAKES BY BOROUGH (3.2016-5.2017)NUMBER OF INDIVIDUALS DIVERTED FROM JAIL THROUGH SUPERVISED RELEASE
Source: Mayor’s Office of Criminal Justice analysis of New York City Department of Correction data, 2016.
0 500 1000 1500 2000 2500
Brooklyn
Bronx
Manhattan
Queens
Staten Island
Total
Non Violent Felony
3. Increase pre-trial diversion Populations reduced: Misdemeanor and non-violent felony detainees System point: ArraignmentPossible reduction: 500 beds
New York City has multiple diversion options that judges can use instead of setting bail at arraignment. Currently, approximately 12,000 New Yorkers are diverted from jail every year through these alternatives to detention. One of the newest and largest options, which started in March 2016, is called Supervised Release. Crafted by judges, prosecutors, and defenders, Supervised Release is a program that gives judges the option at arraignment to release low-and medium-risk defendants, with modest mechanisms in place to ensure their return to court. To date, the program has served 3,700 people with a 92% success rate in defendants returning to court. Expanding this intervention could reduce the average daily jail population.
Misdemeanor
SUMMARY OF INTERVENTIONS CURRENTLY IN PROGRESS

18
50
40
30
20
10
0
0 days 1-15 days 16-30 days 31-60 days 61-90 days 91-180 days 181+ days
3%
12%
44%
14%
10%
8% 9%1970
7249
22691643
581
1402 1551
TOTAL TIME SPENT IN JAIL FOR THOSE RECEIVING A CITY JAIL SENTENCE DISTRIBUTION OF CITY SENTENCES
Source: Mayor’s Office of Criminal Justice analysis of New York City Department of Correction data, 2016.
4. Replace short jail sentences with programs that can reduce returns to jail
Population reduced: City sentenced System point: Disposition and sentencing Possible reduction: 300 beds Over the course of a year, there are approximately 9,000 admissions to jail on sentences of less than 30 days. Because the stays are short, there are few in custody on any given day. Many of these individuals have had multiple short stays in jail over the course of their adult lives—a pattern often exacerbated by homelessness and behavioral health needs. To help change this pattern and prevent future returns to jail, the City is rolling out new alternatives to short jail sentences beginning in the summer of 2017. Judges will have the option to assign individuals to short-term programs that can include community service, vocational training, case management, and health treatment. Research has shown that this approach reduces future returns to jail.7 Programs will be specifically tailored to individuals’ risks and needs and will help address some of the issues—such as chronic homelessness or substance abuse—that could be leading to repeated jail stays, providing instead a pathway to stability.
SUMMARY OF INTERVENTIONS CURRENTLY IN PROGRESS

19
STRATEGY TWO: REDUCE THE LENGTH OF STAY
5. Continue close coordination with all parts of the criminal justice system to reduce the amount of time it takes a case to get to conclusion Populations reduced: Violent felony detainees and parole violators System point: In jailPossible reduction: 620 beds
Today, the average length of stay for individuals facing violent felony charges is 111 days and 390 days for those facing homicide charges. If the average time it took for a non-homicide violent felony case to get to conclusion were 20 days shorter than it currently is, there would be 450 fewer people in New York City jails today. For parole violators, the average length of stay is 55 days. If the average time it took to process a parole violation case were 11 days shorter, there would be 170 fewer people in New York City jails today.
Reducing case length is possible only with the participation of every part of the criminal justice system and every New Yorker:
• The Department of Correction must get people to court on time so that they do not miss scheduled appearances;
• Judges must be leaders in setting high expectations for using each court appearance productively, and in setting adjournment dates that are no longer than necessary;
• Prosecutors and defenders must be ready for each court session; and
• Every New Yorker must answer the call to serve as a juror, grand juror, and witness.
SUMMARY OF INTERVENTIONS CURRENTLY IN PROGRESS

20
5000
4000
3000
2000
1000
0
NUMBER OF PEOPLE JAILED ON CASES OVER 3 YEARS OLD IS DOWN 41% SINCE LAST YEAR JAILED DEFENDANTS WITH PENDING SUPREME COURT CASES
For the last two years, Mayoral agencies, the courts, prosecutors, and defenders have been working together to address case delay through a project called Justice Reboot. To date, this project has cleared 96% of the 1,427 cases that were more than a year old when Justice Reboot was announced, reduced the average length of Supreme Court cases by 18 days—the first reduction in decades, and cut the number of severely delayed cases (older than three years) in half. Reducing case delay further will require shortening time between court appearances and ensuring that each court appearance meaningfully advances the case.
This work to address further the systemic causes of case delay is underway and could reduce the average daily population.
Total cases 0-1 years old 1-2 years old 2-3 years old 3+ years old
2015 2016
Source: Mayor’s Office of Criminal Justice analysis of New York City Department of Correction data, 2016.
SUMMARY OF INTERVENTIONS CURRENTLY IN PROGRESS

21
As we implement the strategies we have outlined above, we are also developing new approaches to shrink the number of people coming into jail, with a particular focus on groups that are discrete because of their small numbers and/or unique needs. Below are the demographics of three of these populations—adolescents, mental health service users, and women—along with an analysis of some options to reduce their numbers in jail.
ADDITIONAL OPPORTUNITIES
POPULATION FACTS: There are approximately 150 adolescents (ages 16-17) in custody on an average day in 2017. Approximately 75% are detained on violent felonies, and 3% are detained on misdemeanors. Almost half (48%) have bail set at over $10,000. Similar to the overall jail population, 50% of adolescents who enter custody leave within one week.
POTENTIAL INTERVENTIONS: The majority of adolescents detained in custody on an average day are charged with violent felonies, making it difficult to divert them through existing diversion programs. However, for the 50% of adolescents who stay longer than one week, shortening the length of stay can help reduce the size of this population. Currently, the City has in place a program that pairs every young adult in city jails with a “case expediter” who ensures that cases move efficiently through the court system and advocates to place young people who are doing well in jail programming into alternative to jail programs. This program began in late 2016 and is expected to produce some modest reductions in the number of adolescents in city custody. Additionally, interrupting a cycle of offending in young people is a longer-term strategy to reduce the number of young people in city jails. The City is currently working to move 16-and 17-year-olds into a dedicated, developmentally appropriate facility and provide modern educational facilities as well as expanded programming and educational space. Research shows this approach is effective in reducing recidivism, however, these reductions in recidivism are unlikely to appear for a number of years.8
2016 ADOLESCENTS
48%Not designated
52%Designated
Detainee Violent Felony 73%
Detainee Non-violent Felony 14%
City Sentenced 6%
Detainee Misdemeanor 3%
Technical Parole Violators 1%
Other* 3%
AVERAGE DAILY POPULATIONMENTAL HEALTH DESIGNATION
*Other includes warrants and state holds. Source: Mayor’s Office of Criminal Justice analysis of New York City Department of Correction data, 2016.

22
POPULATION FACTS: There are approximately 4,300 people using mental health services in custody on an average day. Women are more likely to be mental health service users than men. Mental health service users are more likely to be detained on a violent felony, compared to the total population. Almost half (46%) are in on a warrant, have been remanded until their case is resolved, or are serving a city sentence. This population tends to include frequent users of hospitals and homeless shelters when not in jail.
POTENTIAL INTERVENTIONS: Given the characteristics of this population, opportunities to significantly reduce this population are constrained, either because of the cost of interventions or the lack of interventions supported by evidence. For those who frequently cycle between jail and shelter, permanent supportive housing is an effective intervention, and has been shown to reduce hospital, jail, and shelter use. However, locating supportive housing units in the City is an ongoing challenge. It is also one of the most expensive interventions, costing approximately $25,000 per year per participant. To adequately meet the need, we must both identify the housing and the resources to support the pro-gram. Beyond supportive housing, there are few proven interventions that address cycles of offending, homelessness, and hospital use and assist individuals in achieving stability in their lives. This issue is one that we, together with cities across the country, face and are continuing to seek solutions.9
2016 MENTAL HEALTH SERVICE USERS
11%Female
89%Male
Detainee Violent Felony 45%
Detainee Non-violent Felony 29%
City Sentenced 10%
Technical Parole Violators 5%Other* 6%
Detainee Misdemeanor 5%
SEX
AVERAGE DAILY POPULATION
*Other includes warrants and state holds. Source: Mayor’s Office of Criminal Justice analysis of New York City Department of Correction data, 2016.
ADDITIONAL OPPORTUNITIES

23
POPULATION FACTS: There are approximately 630 women in custody on an average day. Similar to the overall jail population, 50% of women who enter custody leave within one week. Approximately 75% of women in jail use mental health services while in custody, compared to 42% for the jailed population as a whole. The most common diagnoses are depression, anxiety, adjustment disorder, and personality disorders. A limited survey of women in New York City jail found a high need for housing and employment upon release. Women in jail are often caregivers and many have experienced domestic violence.10
POTENTIAL INTERVENTIONS: Dramatically reducing the number of women in jail will be difficult. The high incidence of both housing need and mental health issues among women in jail signal that supportive housing would be a viable intervention that could reduce future incarceration. However, locating available supportive housing is a challenge in New York City and requires an investment of approximately $25,000 per year per participant. Another opportunity to reduce the number of women in jail would be to ensure that existing alternatives to detention and incarceration are effectively serving women, who are sometimes passed over because they do not have a stable place to live. Offering temporary supportive housing could potentially bridge that gap and provide an entry point into a community-based alternative to jail program.
2016 WOMEN
26%Not designated74%
Designated
Other* 7%
Detainee Non-violent Felony 35%
Detainee Violent Felony 31%
Detainee Misdemeanor 8%
City Sentenced 15%
Technical Parole Violators 4%
AVERAGE DAILY POPULATION
MENTAL HEALTH DESIGNATION
*Other includes warrants and state holds. Source: Mayor’s Office of Criminal Justice analysis of New York City Department of Correction data, 2016.
ADDITIONAL OPPORTUNITIES

24
CONCLUSION
The strategies outlined here, if robustly supported by every part of the criminal justice system and every New Yorker, could continue to shrink the jail population in the coming years.
As the size of the jail population shrinks, further reductions will become harder because the jail population will be increasingly comprised of a greater percentage of individuals charged with serious violent crimes or who pose a risk of flight. Releasing these individuals pre-trial may require a seismic shift in culture and expectations by New Yorkers and the justice system. While research has demonstrated that individuals charged with more serious offenses often have the lowest re-offending rates and typically return for their court appearances,11 will judges and prosecutors be confident enough to release these individuals while they await trial? And while there is broad agreement that jail is not the right response for chronic low-level offending, we do not yet have, but are dedicated to developing, interventions that work and that judges can rely on as alternatives to jail.
Over the coming years, New York City is committed to continuing to work with partners across the criminal justice system to implement the reduction strategies outlined in this Justice Brief and to identify new opportunities to shrink the size of the jail population still further.
25
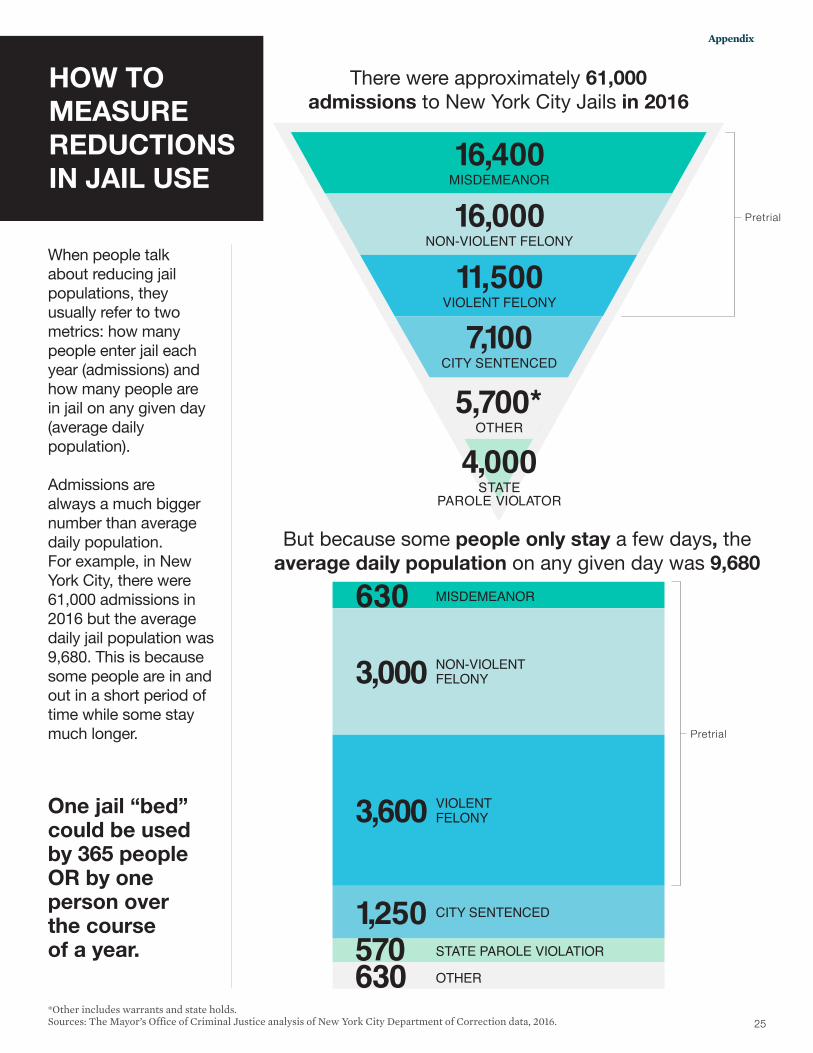
There were approximately 61,000 admissions to New York City Jails in 2016
HOW TO MEASURE REDUCTIONS IN JAIL USE
When people talk about reducing jail populations, they usually refer to two metrics: how many people enter jail each year (admissions) and how many people are in jail on any given day (average daily population). Admissions are always a much bigger number than average daily population. For example, in New York City, there were 61,000 admissions in 2016 but the average daily jail population was 9,680. This is because some people are in and out in a short period of time while some stay much longer.
4,000
16,400
16,000
11,500
7,100
MISDEMEANOR
NON-VIOLENT FELONY
VIOLENT FELONY
CITY SENTENCED
STATE PAROLE VIOLATOR
5,700*OTHER
But because some people only stay a few days, the average daily population on any given day was 9,680
One jail “bed” could be used by 365 people OR by one person over the course of a year.
630 MISDEMEANOR
3,000 NON-VIOLENT FELONY
3,600 VIOLENT FELONY
1,250 CITY SENTENCED
570 STATE PAROLE VIOLATIOR
630 OTHER
Pretrial
Pretrial
*Other includes warrants and state holds. Sources: The Mayor’s Office of Criminal Justice analysis of New York City Department of Correction data, 2016.
Appendix

26
How are beds calculated?
([number of individuals affected] * [their average length of stay])/365 = # beds
There is not a 1 to 1 correlation between people diverted from the system and beds reduced. For example: 3,300 people served annually by Supervised Release would not translate to 3,300 beds saved in city jails. Using an average 15-day stay for misdemeanors and 50-day stay for felonies (calculated using eligibility requirements for Supervised Release), the estimated bed savings is 330 in one year. Over five years, as more people are diverted, the total estimated bed savings is 500.
Both reducing admissions and length of stay affect bed days, to varying degrees. Interventions that aim to keep people out of city jails all together tend to focus on populations that cycle in and out of jail quickly. This means that more people would have to be diverted in order to save one bed.
Interventions that aim to reduce length of stay tend to focus on individuals with more complex cases who spend months or years in city custody.
WHAT IS A “BED”?
anywhere in between
anywhere in between
To save 1 bed annually, the system would need to divert or release, on average:
3 Violent felony detainees
Average length of stay: 111 days
21 City sentenced individuals
Average length of stay: 17 days
5 5 Non-violent felony detainees
Average length of stay: 75 days
6 State Technical Parole Violators
Average length of stay: 55 days
16 Misdemeanor detainees
Average length of stay: 22 days
We measure the effect of our jail population reduction strategies by estimating their effect on the number of beds.
The daily jail population is a measure of beds occupied on any given day. To reduce the jail population, we need to reduce the number of beds occupied. Specifically, to close Rikers Island, we will need to shrink the size of the jail population so that just 5,000 beds are occupied on any given day.
�
If one person is in jail for 365 days, that equals one bed. If two people are in jail, each for six months, that is also one bed.
If 365 people are in jail for one day each, that is also one bed.
��
�1 365
Appendix
27
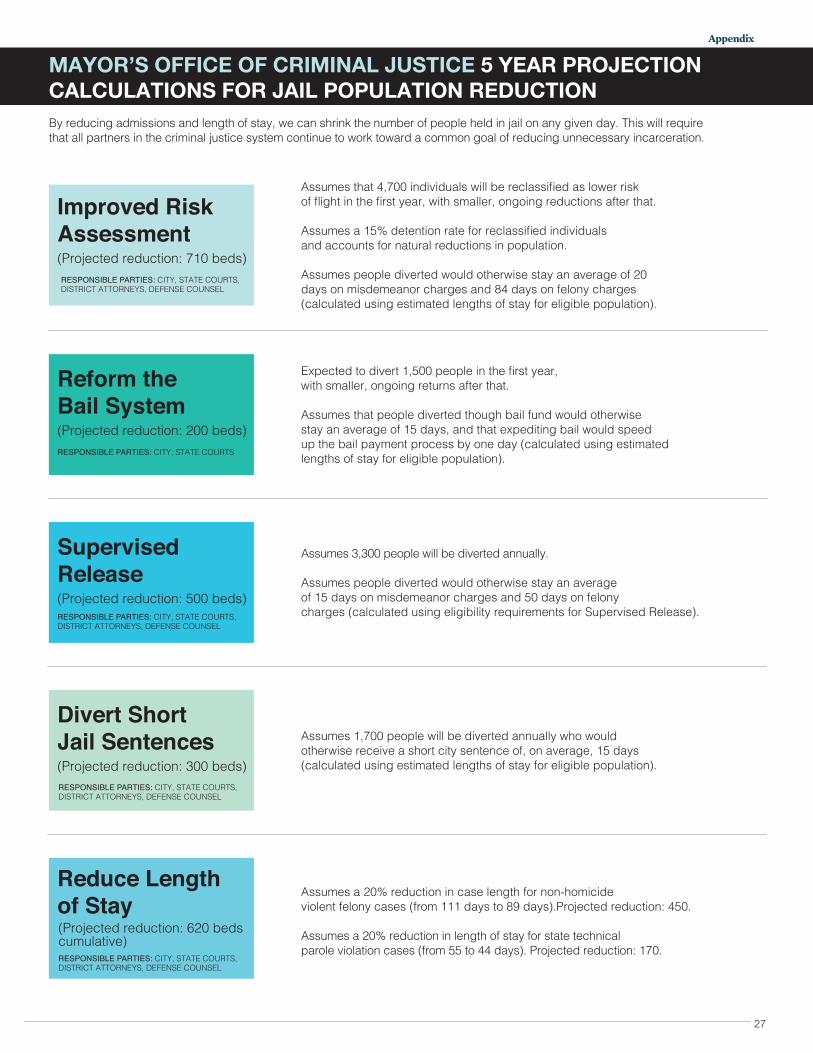
MAYOR’S OFFICE OF CRIMINAL JUSTICE 5 YEAR PROJECTION CALCULATIONS FOR JAIL POPULATION REDUCTIONBy reducing admissions and length of stay, we can shrink the number of people held in jail on any given day. This will require that all partners in the criminal justice system continue to work toward a common goal of reducing unnecessary incarceration.
Assumes that 4,700 individuals will be reclassified as lower risk of flight in the first year, with smaller, ongoing reductions after that.
Assumes a 15% detention rate for reclassified individuals and accounts for natural reductions in population.
Assumes people diverted would otherwise stay an average of 20 days on misdemeanor charges and 84 days on felony charges (calculated using estimated lengths of stay for eligible population).
Improved Risk Assessment (Projected reduction: 710 beds)RESPONSIBLE PARTIES: CITY, STATE COURTS, DISTRICT ATTORNEYS, DEFENSE COUNSEL
Expected to divert 1,500 people in the first year, with smaller, ongoing returns after that.
Assumes that people diverted though bail fund would otherwise stay an average of 15 days, and that expediting bail would speed up the bail payment process by one day (calculated using estimated lengths of stay for eligible population).
Reform the Bail System (Projected reduction: 200 beds)RESPONSIBLE PARTIES: CITY, STATE COURTS
Assumes 3,300 people will be diverted annually.
Assumes people diverted would otherwise stay an average of 15 days on misdemeanor charges and 50 days on felony charges (calculated using eligibility requirements for Supervised Release).
Supervised Release (Projected reduction: 500 beds)RESPONSIBLE PARTIES: CITY, STATE COURTS, DISTRICT ATTORNEYS, DEFENSE COUNSEL
Assumes 1,700 people will be diverted annually who would otherwise receive a short city sentence of, on average, 15 days (calculated using estimated lengths of stay for eligible population).
Divert Short Jail Sentences (Projected reduction: 300 beds)RESPONSIBLE PARTIES: CITY, STATE COURTS, DISTRICT ATTORNEYS, DEFENSE COUNSEL
Assumes a 20% reduction in case length for non-homicide violent felony cases (from 111 days to 89 days).Projected reduction: 450. Assumes a 20% reduction in length of stay for state technical parole violation cases (from 55 to 44 days). Projected reduction: 170.
Reduce Length of Stay (Projected reduction: 620 bedscumulative)RESPONSIBLE PARTIES: CITY, STATE COURTS, DISTRICT ATTORNEYS, DEFENSE COUNSEL
Appendix

28
1. The following are unlikely to result in jail admission: summonses, summons warrants, and stop and frisk encounters.
2.The seven major crimes, called “Index Crimes,” include: murder, rape, robbery, felony assault, burglary, grand larceny and grand larceny automotive.
3. Under the current state statute, judges can remand only defendants charged with felonies, with limited exceptions allowing remand of misdemeanor defendants (e.g. for a mental health examination or when a defendant charged with a domestic violence offense violates an order of protection). CPL § 530.40; CPL § 530.12(11)(a)).
4. Subramanian, Ram, Ruth Delaney, Stephen Roberts, Nancy Fishman, and Peggy McGarry. Incarceration’s Front Door: The Misuse of Jails in America. Report. Vera Institute for Justice. February 2015. https://storage.googleapis.com/vera-web-assets/downloads/Publications/incarcera-tions-front-door-the-misuse-of-jails-in-america/legacy_downloads/incarcerations-front-door-report_02.pdf.
5. There are two large categories of risk: risk to public safety and risk of not returning to court (also known as risk of flight or failure to appear). New York is one of only four states that prohibit judges from considering public safety when making decisions about release, with a few narrow exceptions. NY CPL § 510.30. The City supports a change in state law to allow judges to consider public safety risk as well as a person’s risk of flight.
6. New York State law mandates an upper limit of $2000 on the amount of bail charitable bail funds can post. NY Ins L § 6805 (2012).
7. Bonta, James L., and D. A. Andrews. Risk-need-responsivity model for offender assessment and rehabilitation. Ottawa, Ont.: Public Safety Canada, 2007. http://www.pbpp.pa.gov/Information/Documents/Research/EBP7.pdf.
8. See, United States De¬partment of Health and Human Services, “Effects on Violence of Laws and Policies Facilitating the Transfer of Youth from the Juvenile to the Adult Justice System: A Report on Recommendations of the Task Force on Community Preventive Services”, U.S. Dept. of Health and Human Services, Centers for Disease Control and Prevention, Morbidity and Mortality Weekly Report (MMWR), MMWR 2007; 56 [No. RR-9]: 1-11, 2007. http://www.cdc.gov/mmwr/pdf/rr/rr5609.pdf.
9. Data-Driven Justice Playbook: How to Develop a System of Diversion. Report. The Data-Driven Justice Initiative, National Association of Counties. 2016. http://www.naco.org/sites/default/files/documents/DDJ%20Playbook%20Discussion%20Draft%2012.8.16_1.pdf.
10. Internal surveys conducted by the Department of Corrections and the Mayor’s Office of Criminal Justice, 2016.
11. Durose, Matthew, Alexia Cooper, PhD, and Howard Snyder, PhD. “Recidivism of Prisoners Re-leased in 30 States in 2005: Patterns from 2005 to 2010.” Bureau of Justice Statistics (BJS). April 22, 2014. Accessed May 17, 2017. https://www.bjs.gov/index.cfm?ty=pbdetail&iid=4986.
FOOTNOTES:

29