june month in review
DESCRIPTION
HTW Month in ReviewTRANSCRIPT

JUN
E
We advise. You decide.
- Property Advice and Valuations
- Tax Depreciation Schedules
- Research reports and other services
- Quantity Surveying
The month in
2010
review

�
The month in review
Page Topic
3 Feature - Who has the power? “Buyers in Profile”
4 - 15 Commercial – Retail
16 - 33 Residential
34 Contacts
35 - 41 Rural
42 - 58 Market Indicators
Contents
Peace of mind for your property decisions.
CoN
TEN
TS

�
The month in review
It wasn’t so long ago that there was a full scale panic setting in around the financial capitals of the globe. Late 2008 had all the hallmarks of a “War of The Worlds” scenario as investment bankers started heading off to form lines at soup kitchens and media prophets began working on catchy acronyms to described what some were touting as the next great depression.
It was within this grey foreshadow of August 2008 that we asked our contributors to take a look at their markets and see who the brave souls willing to operate in a market with some possible downside were. The August 2008 issue is salient frieze of the times if you care to check it out at our website.
The results have been catastrophic for many but there is also no denying that we in the magical land of oz felt far less pain in the shakeout that followed (and as we all know, a pain in the shakeout can be very uncomfortable when horse riding!) our problem is that we have all been feeling maybe a little too chuffed with our performance during 2009 and 2010 to date. The past few months have demonstrated globally that perhaps we (me included) have been a little too quick to declare the road to recovery is well lit before us. I sometimes wonder if the people of Europe are gazing back with romantic whimsy about just how good things looked back in August 2008? At least then it hadn’t yet completely fallen.
of course the past few months have demonstrated that laurels are not for resting upon. our stock market has taken a sudden turn southward as sovereign debt becomes a dirty word for some major economies.
Sidebar - It is strange to observe how the long term thinking has disappeared from the real estate market in many cases. We have become heavily press corp driven i.e. as soon as the headlines blare that interest rate rises and a collapse in the price of feta and olives are combining to bring on the four horseman of the apocalypse, everyone bails out and real estate agents are left with tumbleweeds blowin’ past their doors. This is usually remedied by the next headline screaming vast undersupply for the hordes galloping into our cities and suddenly the buyers have the wherewithal to step on top of each other getting to “bargains” like it was a Boxing Day sale. But I digress.
This month we are taking a look at who is driving the demand in the current market which many describe as a little unstable. We have sought to find where the money, if any, is coming from in the various markets throughout the nation and attempted to compare the observations to those made by our offices almost two years ago.
The results are compelling and the pages of this issue can quickly draw the parallels, perpendiculars and antonyms to late 2008 for the followers of the Month In Review.
For our commercial readers, we are providing the final instalment of our trilogy on prime property by taking a look at the retail sector. Whilst no Star Wars in terms of special effects, this month’s contributions provide a sharp focus on the level of confidence operating in the sector which, arguably, trades more on the back of assurance than just about any other real estate.
So enjoy some time seeing if history repeats, but don’t just rely on the archives. Call your local HTW keepers of brilliant things. They will be able to drill down and sift through the shale surrounding your investment decisions, hopefully finding the gold seam and avoiding any super tax.
Kieran ClairCertified Practising Valuer1 June 2010
Who has the Power?“Buyers in Profile”
FEAT
URE

�
The month in review
In the last of our three part series on blue ribbon commercial property around Australia, we are shining a light on the high end retail sector. Like other sectors these retail properties are seen as the most resilient when there is a general economic downturn. By observing how those operating in the market are reacting to the ups and downs, we can paint the picture of overall confidence and gauge where things might be heading in the future. The prime retail sector provides a perfect foil to secondary property which is generally far more prone to market fluctuations.
Sydney
The Sydney Retail sector showed strong signs of resilience during the global recession, with government stimulus coupled with positive labour market outlooks dampening the full impact of recession on the retail property market.
For this month’s MIR we have highlighted the strongest performing CBD retail property market in Australia. During the economic downturn the Sydney CBD retail property market did not experience the same impacts on vacancy and returns as other property groups. This is contributed to a number of factors that included record low vacancy due to withdrawal of a large portion of super prime retail stock.
The Sydney CBD retail property market has approximately 250,000sqm of retail which represents approximately 6% of the retail stock contained within the Sydney Metropolitan Area.
The super prime retail precinct is located in mid town and is focussed around the Pitt Street Mall where Westfields has the largest stock holdings. This retail precinct is in the process of redevelopment.
Current supply levels in the Sydney CBD retail property market are fairly stagnant. The CBD has not seen a large injection of supply since the completion of the World Square shopping centre into the CBD southern retail sector in 2005.
The Sydney CBD retail market is in a very strong position. The market has a strong appeal with retailers and demand is heavily outweighing supply. The demand for retail property, particularly prime and super prime retail property within the CBD has risen exponentially. This has resulted in vacancy rates for strata title retail property throughout the CBD to be sitting at approximately 0.6%.
Sydney CBD rental values and yields are categorised into three classes. Achievable rentals and yields for these sectors are:
• Super-Prime - $4700 to $13,000 per sqm with yields in the range of 6% to 7%.,
• Prime - $950 to $4500 per sqm and yields in the range of 5.5% to 7.5%. and
• Secondary - $530 to $2300 per sqm and yields in the range of 6.75% to 8.5%.
A significant period in the Sydney CBD retail property market’s lifecycle will be seen in 2011. This year will see the completion of the Pitt Street Mall redevelopment. With approximately 40,000sqm of retail stock returning to the marketplace, the issue arises as to whether the market will be able to absorb that amount of floor space without driving rentals down and vacancy rates up throughout the city.
The most significant retail development currently is the redevelopment of Pitt Street Mall.
The aim of this project is to rejuvenate and strengthen the Pitt Street Mall retail precinct.
The Westfield’s development plans to create a high-end retail experience by integrating Westfield’s Centrepoint, Skygarden and the Imperial Arcade into one large retail complex.
Commercial overview
CoM
MER
CIA
L

�
The month in review
This development will have a retail and office component with a total GLA of over 100,000 sqm. (retail approximately 40,000sqm).
The estimated cost of the Westfield’s development is approximately $600 million.
Canberra
Since the last update few changes have occurred in the retail marketplace, with the market generally experiencing low levels of tenancy turnover in the leasing market and low volume of sales.
The Property Council of Australia has indicated that Canberra currently has close to zero space in the pipeline for construction of retail centres which is not surprising considering the amount of retail recently constructed.
The lack of retail construction in the pipeline for the ACT means any vacancy increases will be most likely because of negative absorption as tenant demand shrinks, and not due to supply issues.
All asset classes have seen a softening of market yields, but retail property with potential for increases in pedestrian traffic and re-development and/or expansion potential should command stronger yields.
Blue-chip tenancy is still the key and good real estate will do really well in a cycle like this that might be a bit testy for the next few years.
....the Property Council of Australia has indicated that Canberra currently has close to zero space in the pipeline for construction....
The ACT retail market offers prospective purchasers better opportunities in 2010 due to vendors now realising that yields achieved in 2007 are no longer realistic.
Recent Sale
MANUKA TERRACE, MANUKA ACT
This property was sold in March 2010 for $29.7 million, and in conjunction with the Mile End Homemaker Centre in Adelaide for a total consideration of $69.8 million. The analysis is based on an apportioned price. The purchaser was Charter Hall Retail REIT from ING Retail Property Fund.
The sale shows an initial yield of circa 9.75% and a GLAR (total 6,561sqm) of approximately $4525 per sqm.
It includes a three-level part-enclosed neighbourhood shopping centre which opened in late 2000 and is anchored by a Coles Supermarket. There is basement car parking for approximately 585 vehicles and the centre includes a terrace area with seating for the bar and restaurants within the complex. The property is situated in Manuka’s main strip retail area which includes a mix of boutique fashion shops and cafes.
Central, North & West NSWDUBBo
As has been the case for some time, the prime retail space outside of the CBD is the orana Mall shopping centre located well east of the city. Local planning policy has restricted the potential for the area surrounding the mall to be developed for retail space and as such created a tight supply situation in this precinct, which keeps retail rental rates relatively high. The rates obtained in this centre are generally higher than the peak rates in the CBD. In the event that planning policy was to change to allow additional retail development in the area surrounding the orana Mall it would undoubtedly be the area of the city to attract the most interest.
Additional development in retail space in the Dubbo CBD appears to have stalled in recent years. Flooding restrictions to the west of the CBD and the potential rental returns in relation to development costs has resulted in limited activity. There are several sites that are suitable for redevelopment but at this stage the economics of development do not appear to stack up without having a secure pre-construction tenant in place.
BATHURST
The retail property market in Bathurst is dominated by three shopping centres. Bathurst Marketplace is the newest and largest centre and was completed in early 2009. A number of tenants relocated from existing strip retail areas together with a proportion of tenants from the Metro Plaza shopping centre. The result has seen a slight shift in the retail flow of pedestrians from the north of Howick Street to the south
There has also been an increase in retail vacancies in the fringe areas. Consequently there has been little growth in rental levels with increasing incentives on offer. Yields have also remained flat with reduced sales activity reflecting both limited demand and supply.
oRANGE
The orange retail property market remains strong, with very few vacancies in the CBD. Those shops that are vacant are generally in fringe locations.
CoM
MER
CIA
L

�
The month in review
Currently there is a DA before orange City Council to undertake a major expansion of an existing shopping centre (The Summer Centre). This is the second attempt to obtain approval after the initial proposal was revised by the developers due to the impending GFC. The media has reported that the council is divided over the current proposal and it remains to be seen whether the project will obtain council approval.
Retail property activity is subdued due to a shortage of stock available for sale. The few properties that have sold reflect yields in the order of 6% to 7.5%, which is about two percentage points stronger than current commercial yields.
Southern NSW & Northern Vic
ALBURY
The retail market has been fairly stable for the past few years with few sales. The rentals achieved are dependent upon location, size, condition etc, and range from $85 per sqm to about $400 per sqm. The central retail locales have been experiencing a very low rate of vacancy for many years; however, secondary retail locales do have both a higher vacancy and a higher turnover of tenants.
WAGGA
Vacancy rates within the main retail area of Wagga Wagga, which is in the main street, have remained at static levels over the past few months. The current vacancy levels are higher than this time a year ago and we have definitely seen a slow down in the retail market. JB HiFi has moved to Wagga Wagga to take up some space just off the main street and Wagga Wagga has its first 24 hour convenience store, which opened in the main street in the past two months. There have been few sales of retail buildings with a market soft in sales as well as rents.
Melbourne
The retail market is heavily influenced by the level of consumers’ disposable income which in turn impacts on retailers’ turnovers and their ability to pay rent. In 2008 and 2009, the Global Financial Crisis (GFC) initially reduced
economic activity by reducing consumers’ willingness to maintain current debt levels that were underpinning retail spending. Nevertheless, although tenants’ turnovers may have softened over the GFC, investors have been relentless in competing for prime retail premises, forcing yields down to record lows.
This month we have focused on The Prime Street Suburban Strip Shopping sector of the retail market. In Melbourne these generally consist of Burke Road, Camberwell; Church Street, Brighton; and Chapel Street, Windsor to South Yarra.
We will look at each of these areas and tell you where the big money is spent, what yields are being achieved, what the rental rates are and what the vacancy levels are.
The Melbourne Prime Strip Shopping tenancy mix is dominated by clothing retailers (30%), restaurant and food outlets (34%), and gifts, cards, accessories, cosmetics and jewellery retailers (10%).
Burke Road, Camberwell in Melbourne’s eastern suburbs has a retail mix comprising upmarket fashion, restaurants, and cafes. A Safeway supermarket and Target anchor the precinct. However, a new development named ‘The Well’ at 793 Burke Road is anchored by a Cole’s Supermarket and a JB HiFi outlet. The development contains 27 specialty retailers. of the 212 shops on Burke Road Camberwell, there are nine vacant, indicating a vacancy rate of 4.2%. Net rents in Burke Road range from $800 to $1200 per sqm. An example of a recent vacant possession sale is 610-612 Burke Road Camberwell, which sold in April 2010 for $6.146 million. The 400 sqm two-level retail building achieved a building rate of $15,365per sqm. A recent investment sale in this precinct was the December 2009 sale of 787 Burke Road Camberwell, a two-level retail building leased to Florsheim Shoes, which sold for $3.7 million on a sharp yield of 3.44%.
....the retail market is heavily influenced by the level of consumers’ disposable income....
Church Street, Brighton is located in the affluent south eastern Bayside suburb of Brighton. A Safeway and Cole’s Supermarket anchor the precinct at either end of the street. The area features the refurbished Dendy Plaza which contains a mix of specialty retailers such as The Dendy Deli, Palace Cinemas, and a Cole’s Supermarket. Net rents in Church Street range from $400 to $800 per sqm. of the 176 shops on Church Street, three are vacant indicating a vacancy rate of 1.7%. A recent investment sale in the precinct was the November 2009 sale of 85 Church Street. The single level retail building leased to Freedom Farms Free Range Poultry sold for $2.360 million on a sharp yield of 3.7%.
Chapel Street spans three suburbs namely Windsor, Prahran and South Yarra, with rents becoming more expensive as one moves northwards towards South Yarra. Chapel Street is a well known fashion shopping precinct located in the inner south eastern suburbs. The South Yarra end of Chapel Street is dominated by upmarket fashion, cafés and restaurants. This end attracts the highest rentals in the strip. The Windsor end of Chapel Street is made up of home wares, pawnbrokers, and cheap junk shops with lower rents, but is slowly becoming more
CoM
MER
CIA
L

�
The month in review
fashionable. The Prahran or Central area of Chapel Street contains the funky Greville Street Precinct with a number of cafés, specialty retail shops, bars and night clubs. Net rents in Chapel Street range from $1000 to $1500 per sqm depending on the address. of the 631 shops on Chapel Street, 25 are vacant indicating a vacancy rate of 4.%, partly reflecting the more volatile fashion segment. Most of the 25 vacant shops are situated in arcades which do not have a street frontage. A recent investment sale in the precinct was the october 2009 sale of 1/450-460 Chapel Street, South Yarra. The fully leased retail building sold for $2.8 million on a sharp yield of 4.64%.
Outlook
Property in Prime Retail Strips is generally tightly held and highly sought after. However these properties are still dependant on average disposable income which affects the tenant’s ability to pay rent. Nevertheless, investors continue to strongly compete, resulting in very tight yields. The market is clearly dominated by wealthy private investors, prepared to pay a premium for prime locations.
Regional Vic
ECHUCA
As always, the market for retail space is relatively stable with the market being only thinly traded. Like with most regional centres, the line between commercial and retail premises is often blurred with buildings commonly being used interchangeably depending on demand at the time of letting. one local developer has nearly completed construction of a building which will see an additional 425sqm of office/retail space come onto the market in Annesley Street, while 197 Annesley Street was auctioned on the 15th May 2010. The property at 197 Annesley Street comprises a historical landmark church built in 1864 on approximately 1095sqm and is zoned Business 1. It is located close to the recently opened Aldi (April 2010) and subject to a Heritage overlay. Several smaller shops are also available for lease at the time of writing with asking prices of $120 to $240 per sqm for secondary locations and buildings. Rates of 350 to $450 per sqm are not uncommon for prime buildings with national tenants in the main retail areas of Echuca.
....one local developer has nearly completed construction of a building which will see an additional 425sqm of office/retail space come onto the market....
MILDURA
The Langtree Mall is Mildura’s prime retail area and there are presently six shops vacant, probably the largest number for more than 10 years. A couple of vacancies have occurred where tenants have decided to move to lesser positioned sites to reduce the rental.
Also the ‘bulky goods’ area fronting Fifteenth Street now sees a higher number of premises vacant than at any
recent period, but this hasn’t curtailed a number of large proposed developments proceeding.
The fast food industry seems to be prospering. A third McDonalds restaurant has recently opened in Mildura, and a new KFC restaurant opened three weeks ago and appears already to be too small for the demand.
Adelaide
The retail market sector performed reasonably well through 2009 after two years of very good growth. The impact of the Global Financial Crisis (GFC) has undoubtedly changed the dynamics of the market with private investors becoming more prevalent in the market place, as larger institutional players are forced to dispose of assets.
Retail property generally remains relatively resilient to market changes in the commercial sphere, especially where the income stream from the property is supported by ‘non-discretionary’ spending such as for food. In contrast, bulky goods, fashion, jewellery and electrical retailers which rely more on discretionary spending, have suffered as the level of household income has stabilised or fallen.
The supply of retail space remains reasonably constant also with completion of major projects such as the Gepps X Home Maker Centre, Hallet Cove Shopping Centre and the Bayside Shopping Centre which were started before the effects of the GFC were felt. Subsequent to the GFC however, property owners have found that access to finance for the purpose of extending or renovating their property has become more difficult, which has slowed the creation of space in this sector.
We note that in recent months, approval has been granted for development of the troubled LeCornu site (retail with upper level apartments) in the near city suburb of North Adelaide – a process which has taken a decade of negotiation.
Through 2009, face rentals in most areas appear to have shown steady (if unspectacular) growth peaking, as always, in the Rundle Mall precinct. Generally speaking, retail rentals further from the larger regional and neighbourhood centres are more variable as is the quality of this space. The volume of commercial sales generally also has declined over the past 12 months however the market appears to be improving since Christmas.
In conclusion, the retail property sector in South Australia has survived 2009 relatively well for the most part.
CoM
MER
CIA
L

�
The month in review
Demand for properties may well have abated somewhat as evidenced by the lower volume of sales however private investors are increasingly active in the sector as the larger institutions seek to reduce their exposure. There is expected to be a development hiatus in 2010 after a number of projects were completed late in 2009, while others were shelved pending easier access to finance. Face rentals have generally shown some growth over the period albeit underpinned by incentives which are estimated to be in the order of 10%.
Brisbane
The Brisbane retail sector has remained resilient during the past 12 months with the economic downturn less severe than originally anticipated. Even so, Brisbane experienced a drop in retail turnover toward the end of 2009, which is likely a knee-jerk reaction to the government retracting their monetary stimulus into the population, and the Reserve Bank of Australia increasing interest rates. Retail property within Brisbane has, by and large, continued to be more resilient to the economic downturn than the other property sectors, with purchasers remaining eager to secure safe retail investment assets.
The heart of retailing in Brisbane lies within the Queen Street Mall precinct in the CBD, providing a concentrated span of street front shops and further incorporating five prime shopping centres and four arcades. This prime retail area is the most highly sought after retail destination and is the largest shopping precinct in Brisbane. The precinct includes a number of enclosed, multi-level shopping centres, however, the Myer Centre and Queens Plaza shopping centres are considered to be the benchmark properties.
There is strong tenant demand for retail space within the precinct with good exposure to large volumes of pedestrian traffic. There are also a number of significant retail additions and refurbishments underway in the Brisbane CBD, which has been a further driver of activity over the preceding 12 months and has resulted in higher than normal levels of tenant relocation. These works include the completion of the Q&A Centre development last year, the major refurbishment at MacArthur Central and the refurbishment and redevelopment of the Wintergarden complex.
Rental rates in the precinct vary greatly depending on the size of the tenancy and its particular location within the Queen Street Mall. The net rental rates range between
$2500 and $4500 per square metre per annum for prime retail space and between $4,500 and $7,000 per square metre per annum for super prime retail accommodation. Incentives currently remain stable at under 5%.
on the whole, vacancy rates in the precinct have eased with the major centres and arcades recording an average vacancy rate 6% and other retail properties fronting the Queen Street Mall recording an average vacancy rate of 4.5%.
There have been limited sales within the precinct of late with only three major retail transactions taking place in the past 12 months, however the yields are still very keen, sitting between 5.5% and 7.5%. Capital values are in the order of $50,000 and $80,000 per square metre for smaller shops fronting the Queen Street Mall and between $10,000 and $25,000 per sqm for larger, mixed use buildings in the precinct.
The suburban regional shopping centres are the leading retail assets outside of the Brisbane CBD, with some of the more prominent developments within this class including Westfield Garden City, Indooroopilly Shopping Centre, Westfield Carindale and Westfield Chermside.
....retail property within Brisbane has, by and large, continued to be more resilient to the economic downturn than the other property sectors....
The turnover of department stores in Brisbane – and the rest of Queensland – is currently in an unstable condition as Myer and David Jones compete for market share. Specialty stores are also in an unstable condition after the low retail turnover experienced at the end of last year, and like the department stores, are being forced to offer discounts to move stock with the result being a tightening of profit margins. Notwithstanding the depressed retailing market, regional shopping centres continue to experience low levels of vacancy with tenant demand remaining strong.
The regional shopping centres generally achieve the highest rental rates outside of the CBD with net rental rates for specialty tenants ranging between $1000 and $1500 per square metre per annum, with the average being toward the upper end of this scale. Face rents have increased slightly over the past 12 months by about 3%; however, incentives have also increased to approximately 5% with the outcome of effective rents remaining stable or declining.
There have been no recent sales of regional shopping centres in Brisbane, with the last transaction recorded in 2007. H; however analysed yields currently tend to sit within $6.50% and 7.50%, with capital values of between $6,500 and $10,000 per sqm.
The outlook for the Brisbane retail sector is positive. Consumer and business confidence is increasing and current economic forecasts indicate that retail turnover in Queensland will continue to grow at a rate higher than the Australian average and second only to Western Australia. Rental rates and incentives within prime retail properties in Brisbane are expected to remain stable and yields are anticipated to continue firming.
CoM
MER
CIA
L

�
The month in review
Gold Coast & Tweed Coast
As discussed in the last Retail edition of our Month in Review, the Gold Coast retail market is typified by localities such as Surfers Paradise, Main Beach, Broadbeach and Burleigh Heads. Retail properties in these areas are tightly held and generally reflect firm yield levels that are underpinned by a high under lying land value.
Surfers Paradise is recognised as the retail CBD to the booming tourism market. The retail core is anchored by centres such as Centro Surfers Paradise (formerly the Paradise Centre), Chevron Renaissance and Circle on Cavill, along with numerous other retail shops that line Surfers Paradise Boulevard, Elkhorn Avenue, orchid Avenue and Cavill Mall.
Soon to be completed developments such as Soul and Hilton, will add to the dynamics of this retail precinct and help create better synergy between the beachfront Esplanade, Cavill Mall and Surfers Paradise Boulevard.
Rental rates within Surfers Paradise vary dramatically and have witnessed strong increases, as development activity over the past 10 years, along with upgrading of the streetscape by Gold Coast City Council, acted as a catalyst.
....surfers Paradise is recognised as the retail CBD to the booming tourism market....
It is a well known fact that Cavill Mall achieves some of the highest rental rates in Australia with some smaller shops achieving rates of $4500 to $5000 per sqm. obviously this rate is not maintained for larger holdings, with those tenancies being slightly removed from the Mall, achieving around $1500 to $2500 per sqm.
The managers of larger shopping centres such as Centro, Chevron Renaissance and Circle on Cavill, are generally fairly tight lipped and do not give away specific rental information very lightly. We are of the understanding that specialty stores within the main arcade of Centro are achieving average rental rates of around $2000 per sqmuare metre, whilst centres such as Chevron Renaissance and Circle on Cavill are a step below at circa $1500 per sqm due to their position, which is slightly removed from the retail hype.
Not surprisingly, rental deals to date within the Soul retail development are a step above these averages due to its superior location and ultra modern design.
However, if we want to talk about the best of the best, we need to move out of the Surfers Paradise retail precinct. Whilst Surfers may thrive on its tourism catchment, when it comes to locals, it is no competition for the likes of Pacific Fair and Robina Town Centre.
Both of these regional shopping centres have been established on the Gold Coast for many years. Progressive
upgrades and extensions to both of these centres have cemented their reputation as the Gold Coast’s two premiere retail centres.
Pacific Fair was originally opened in 1977 and now comprises some 300 specialty stores, a Myer department store, Coles supermarket, Target, K-mart and cinema complex. The main arcade comprises a two-level, covered mall at the eastern end of the centre, whilst the western end is open air and single level, providing opportunity for future extensions and refurbishment. This centre has been noticeably quieter since the onset of the GFC and opening of the new Robina Town Centre, but the vacancy rate appears to be maintained at a low level. A degree of tenant turnover has been witnessed, but it is still rare to see a shop sitting vacant for an extended period of time.
Robina Town Centre was originally developed in 1996 with progressive refurbishments leading up to a major overhaul that was completed in late 2009. This centre is hands down the most impressive retail experience on the Gold Coast, boasting over 200 specialty stores, David Jones, Myer (soon to be completed), two Woolworths supermarkets, Coles, Big W, K-mart, dining precinct and cinema complex. Whilst the centre was not fully occupied upon re-launch in 2008, the vacant shops have progressively been taken up and the centre appears to be approaching full capacity.
Robina Town Centre has definitely provided some stiff competition to its toughest competitor, Pacific Fair. Whilst finding a car park at Pacific Fair on the weekends used to be an absolute nightmare, it has now become a much less daunting experience. Conversely, Robina Town Centre appears to be ‘choc-a-block’ all day every day, with people from all over the Gold Coast flocking to see the Coast’s latest and greatest shopping centre.
Whether these patrons are emptying their wallets is another story, as we have heard reports that retailers are not trading as well as they initially expected.
Moving away from these regions, the Gold Coast retail market is in the midst of an exciting time, with two major retail holdings, Centro Surfers Paradise and Marina Mirage, currently on the market in Expressions of Interest campaigns. Marina Mirage is a newly refurbished centre which is littered with top end boutique retailers and first class restaurants. The centre will provide a great test for the market, particularly considering that it has no major anchor tenant.
Taking another step down the food chain, the most recent top end retail sales comprise two sub-regional shopping centres; Centro Nerang - Centro Southport.
CoM
MER
CIA
L

10
The month in review
Centro Nerang is reported to have sold earlier this year for $38.5 million reflecting an initial yield close to 9.0%. We have analysed this sale to reflect 8.75% after making allowances for permanent vacancy, sundry income, balance land and lease up costs. Centro Southport sold about 15 months earlier for $68 million reflecting an initial yield of 7.96% and an analysed yield of 7.42%. Whilst the Southport centre is considered a superior holding, the large variations in yield levels indicate that this market segment continued to soften over the course of 2009.
In overview, the Gold Coast retail market in general has definitely come back from the dizzying heights witnessed in 2007, which is probably no surprise to many of our readers. Whilst rental rates have remained flat, or even softened in some instances, most retailers appear to be hanging on and have kept their doors open. Yield levels have softened, which has resulted in reduced capital values in most sectors, however it looks as if we have hit a plateau and the worst is behind us.
The ongoing battle now turns to keeping outgoings down, which has been a major problem over recent years due to increasing land tax and council rates. Whilst the Department of Environment and Resource Management released heavily reduced statutory land values (for most properties) earlier this year, the oSR has not yet released next year’s land tax rates. our advice to owners is not to count their chickens before they hatch.
Sunshine Coast
The retail market on the Sunshine Coast has begun to note an overall slowing. We have seen vacancy rates increase in prime locations. However, also in the barometer regions such as Brisbane Road and Aerodrome Road, we are noting increasing vacancies and tenant turnover. These regions are typically quite stable during strong market periods, however in downturns we note the conditions that are currently being displayed.
We have noted strong sales in the new retail development at Coolum Beach known as ‘C Coolum’. We have noted rental levels being achieved in this complex from $1050 per sqm to $1500 per sqm depending on the size of the tenancy and the exposure. These rental levels have increased from about $350 per sqm to $450 per sqm approximately five years ago and even up from a peak of about $900 per sqm, noted in the most recent development before the ‘C Coolum’ development known as ‘Element on Coolum’.
Sales in this complex have generally ranged from about 6.2% to about 6.7%, which is market leading for the
location and current market conditions. We note that there are still several vacancies in the complex and several stratas still to be sold.
....we would therefore recommend that if you were looking at a retail investment on the Sunshine Coast, the beachside retail precincts would appear to be the strongest locations, rather than exposed traditional retail type strips....
other sales of note have been occurring in the Mooloolaba Esplanade precinct within the ‘oceans’ complex. These sales have been achieved at yield levels around 6.5% to 7% with overall value levels up to $25,000 per sqm, which are considered to be market leading for the location.
We would therefore recommend that if you were looking at a retail investment on the Sunshine Coast, the beachside retail precincts would appear to be the strongest locations, rather than exposed traditional retail type strips.
Southern Queensland
TooWooMBA
Retail investment properties in Toowoomba are generally tightly held with a limited number of recent transactions. Sales of properties within the CBD are more common, but many are made on a vacant possession basis.
Retail rentals in Toowoomba appeared to have stagnated during 2008-2009 which was a reflection of the Australian economy and reductions in retail spending. There are a number of new retail developments planned for construction in Toowoomba during 2010, where new rental benchmarks could be set. Seeking higher rentals in a new development is a common occurrence and is often a reflection of the increases in construction and land costs. The planned new developments in Toowoomba are:
• ‘“The Glen’” Shopping Centre – a Coles-anchored neighbourhood convenience centre located in the western suburb of Glenvale. This centre is to include a 3000 sqm Coles supermarket and up to 19 specialty stores.
• ‘“High Street Plaza’” – a major redevelopment of an existing Supa IGA- anchored centre in the eastern suburb of Rangeville. The centre will include a 2600 sqm supermarket and 22 specialty tenancies.
• ‘“Red Edge’” – a smaller convenience centre located in a hospital support precinct on the fringe of Toowoomba’s CBD. This centre is to include a 400sqm IGA and 12 specialty shops.
The recent introduction of Sunday trading in Toowoomba could also affect rentals. An increase in retailers’ turnover could result in higher rentals, as well as centre owners seeking to recoup increased operational costs. Alternatively, smaller convenience centres may experience
CoM
MER
CIA
L

11
The month in review
a decrease in turnover due to increased competition on Sundays.
Retail yields appeared to have firmed slightly in late 2009 after significant softening during late 2008 and early 2009. The recent increases in interest rates however could force retail yields to increase again in the near future.
Central Queensland
RoCKHAMPToN
2010 has begun with mixed emotions in the Rockhampton retail sector. Despite strong opposition, Sunday trading was introduced in Rockhampton at the end of January. From all reports trading has been a success with all major shopping centres in town following suit.
Many major projects are also pencilled and underway including Stage Two of the Stockland redevelopment, with the opening of a further 15 specialty stores and three mini-majors planned in the coming months. Stage one of the development opened in August 2009, with a fanfare of activities and great support of the city’s residents. The redevelopment granted 40 new and newly relocated stores, plus Coles and Kmart via a retail bridge over Moores Creek. The redevelopment has been an asset to the retail activity of the city and to residents of the Central Queensland Region. The Mirvac City Centre Plaza, which is anchored by Coles and Target has also undergone refurbishment over the past 12 months and vacancy levels are low at present.
....despite strong opposition, Sunday trading was introduced in Rockhampton at the end of January....
The City Centre and the East Street retail precinct in particular boast very low vacancies and current market rents range from approximately $220 to $270 per square metre gross for older style tenancies in East Street. The CBD has also seen completion of construction of a new single level, strip retail complex at the corner of William and Bolsover Street, comprising four retail tenancies. The complex has opened its doors to ‘Sexie Coffee’ which fronts William Street. There are still a couple of available tenancies in the complex.
The fast food market in Rockhampton is also set for a new addition in the form of Hungry Jacks who are reportedly constructing a new $6 million store on the highway at the corner of George and Denham Streets. Their current store located, in Aquatic Place on the City’s north side, will also undergo a $500,000 upgrade.
Construction is set to start in the coming weeks on the proposed Frenchville Plaza on Dean Street. in the coming weeks. The project is a purpose-targeted retail complex comprising a 1500sqm IGA Supermarket and four speciality shops, with a further 400sqm of retail floor space. The centre will have parking for 75 vehicles.
In Yeppoon, retail take up in the newly constructed Echelon complex has been slow. However, retail spaces are beginning to fill with the addition of food tenants fronting Anzac Parade. Vacancies are low in the James Street precinct. There is still speculation surrounding the Keppel Bay Plaza/Railway Hotel redevelopment which was purchased in as joint venture between State Development Corp and the Ray White Invest Keppel Bay Plaza Property Trust in 2007. Redevelopment plans are reportedly still being revised.
BUNDABERG
The three main retail precincts in Bundaberg are the City Centre, Sugarland Shoppingtown and Hinkler Central precincts.
There has been very limited sales activity in any of these precincts. A retail property was under contract in late 2009 for $3.5 million, reflecting a yield rate in the order of 8.5%, near Sugarland Shoppingtown, however the sale did not proceed. The Sam’s Warehouse property sold by receivers for $3.43 million in November 2009, reflecting a 9.75% yield rate and $1012 per sqm of floor area. A bulky goods retail property at 2 Stancer Court with a floor area of approximately 9,00sqm is also on the market by receivers, but has not yet sold.
Vacancy rates in the city centre for small shops in the prime locations are reasonably low. Vacancies in secondary locations and/or larger tenancies however, are increasing and some areas have been vacant for an extended period.
While vacancies within Sugarland Shoppingtown and Hinkler Central are minor, vacancies in the precincts surrounding them have been escalating and most of these have been vacant for an extended period.
Landlords have in general been holding asking rents, preferring to have a vacancy than decrease rental rates. There is evidence however, that they are now becoming more prepared to reduce asking rents to obtain a tenant.
our research indicates that there is in the order of 2300 square metres of vacant retail shops vacant and available for lease and approximately 7000 square metres of retail showroom/bulky goods space.
HERVEY BAY
Prime retail is predominantly focused around the CBD, Boat Harbour Drive, Pialba Place and Centro Shopping Centres.
The recent announcement by Stockland that they are in due diligence to purchase Centro Hervey Bay has
CoM
MER
CIA
L

1�
The month in review
lifted some confidence in the retail sector. Additionally, development of the proposed extension to Centro may commence soon to meet planning guidelines and infrastructure discounts.
Hervey Bay generally has an unemployment rate above the state average and this, coupled with increasing interest rates over the past few months, appears to have slowed discretionary spending which is placing some pressure on retail tenants and business owners.
There has been very little local sales activity to indicate a yield trend for prime retail product however historically premises with nationally branded tenants generally attract up to a 0.75% yield premium compared to other investment property.
The main prime retail complexes include Eli Waters (for sale), Centro Hervey Bay, Pialba Place, Bay Plaza and Urangan Central. Rental rates within these complexes can range as high as $900 per sqm for less than 50sqm, down to low $200s per sqm for large anchor supermarket brands. These rates are generally insular and not achievable in secondary locations or strip shops.
Currently vacant rates appear stable, however if the Centro expansion proceeds, a short term oversupply may occur placing downward pressure on rates with attractive leasing incentives to entice tenants.
MACKAY
Work commenced this month on the much-anticipated $210 million expansion of Canelands Central Shopping Centre, which will include a two-level 12,000sqm Myer store. The expansion will add a further 23,500sqm of space to accommodate Myer, an IGA grocery store and a further 100 specialties.
Canelands Central is currently the best performing shopping centre in the Australian Prime Property Fund portfolio, performing significantly above market benchmarks and is a major competitor to the CBD and Mt Pleasant Shopping centre located on the north side.
The commencement of the Canelands Central expansion coincides this month with the introduction of seven-day trading for shopping centres in Mackay.
The council has also approved Stages Three and Four of the Northern Beaches Central shopping centre to include a discount department store, two supermarkets, specialty stores and other facilities to progressively take this centre to a total 45,000sqm.
The combination of a significant expansion of the retail footprint and seven-day trading will most likely continue to draw trade from the traditional city retail strips to the major centres, and as a consequence, is expected to flatten out retail rental levels outside of the major centres in the longer term. This will not be a positive outcome for the city centre, as landlords require rental growth to allow for re-investment back into maintenance and upgrade of city centre property, which has been struggling to compete with the major centres for the past 20 years.
Cairns
The Cairns retail market had been strengthening slowly but steadily for a number of years. However while this trend started fading out at the start of 2008 and continued to fade during 2009, we now perceive the Cairns retail market to be at or near the bottom of the cycle. It must be also said that retail property sales in Cairns are extremely sporadic, and there have been no retail properties of significance changing hands for some time. Most sales involving retail property have been of mixed use retail/office buildings or tenant buyouts of single premises.
Despite the economic downturn that has presumably led to a reduction in consumer and tourism spending, vacancy levels in the prime retail sector have remained stable, with high exposure CBD space near fully occupied. However there are vacancies in lesser exposure locations and/or on the CBD fringe. Rents as a general rule have been static, showing ranges of $600 to $1500 per square metre per annum for prime CBD space, and $1000 to $2500 per square metre per annum in key tourist precincts such as the Cairns Esplanade.
The new Cairns Square complex, a total redevelopment of the former Tropical Arcade, has seen good demand and premium rents paid for the ground floor outlets which have frontage along either Abbott or Shields Streets. In addition, the new Coles-anchored Sugarworld retail complex in Edmonton, which opened in early May, has been almost fully leased with rents achieved in line with market levels.
....despite the economic downturn that has presumably led to a reduction in consumer and tourism spending, vacancy levels in the prime retail sector have remained stable....
Yields for commercial properties in general in Cairns have eased back by about 10% from the record low levels observed at the start of 2008. Though true retail sales are rare in the Cairns market, we believe yields for retail premises have been steady in the 7.5% to 8.5% range, compared to the 6.75% to 7.25% range that prevailed at the start of 2008.
CoM
MER
CIA
L
1�
The month in review
Townsville
Townsville’s retail sector continues to transform both within the CBD, the major shopping centres and the neighbourhood shopping precincts.
Townsville’s three major shopping centres have, or will this year, undergo major expansions. Willows Shoppingtown completed its 13,000sqm expansion in october last year and Castletown is currently undertaking its 11,000sqm expansion. Stockland is also set to undertake its $180 million dollar expansion this year to incorporate a 12,000sqm Myer store over two levels.
Throughout 2009 and continuing into 2010 there has been a flurry of new suburban retail shopping complexes and neighbourhood sub-regional shopping centres changing the landscape of suburban retail. These complexes vary from strip style developments in prime localities, offering tenancy mixes including convenience stores, video stores and take-away outlets. The larger sub-regional centres are incorporating a supermarket and bakery, newsagency, bottle shop, cafe style tenancy mix.
Townsville’s northern corridor is currently experiencing an upsurge in this sub-regional style development as its population continues to expand rapidly. There are several centres being constructed within the modern established suburbs of Townsville, which are currently serviced by smaller local centres.
....throughout 2009 and continuing into 2010 there has been a flurry of new suburban retail shopping complexes and neighbourhood sub-regional shopping centres changing the landscape of suburban retail....
There are currently a number of sites on the market, however sales have been limited due to the disparity between buyers and sellers.
Rental rates within the retail market range from between $350 per sqm gross to $450 per sqm gross for the average quality retail stock to $450 per sqm gross to $650 per sqm gross for the strategically located and premium retail stock. Vacancy rates in this premium stock are currently low with the majority of developments being modern and well designed offering good tenancy mixes and catchments.
The CBD retail is currently being heavily impacted by the Mall Redevelopment, which is due for completion March 2011.
overall the retail landscape in Townsville is changing with major growth particularly in the northern beaches corridor expected throughout 2010/2011 and expansion projects/redevelopments both underway and due to commence in 2010.
Darwin
When it comes to retail, Darwin comes to Casuarina Square. opened in october 1973 and refurbished in 1998, this 51,600sqm centre is a behemoth for a city of only about 120,000 people. It attracts over twice the population of Darwin every week. It is situated in the northern suburbs, which is home to just under 50,000 people – the largest residential concentration in town. It has an annual sales turnover about $35 million south of $400 million, and has been valued (by another firm) at a similar distance north of $400 million. With specialty sales turnovers of over $10,000 per sqm, 100% retail occupancy, 2400 car parking spaces (vitally for Darwin, almost all under cover), another 1100sqm of offices and a service station, key tenants such as Kmart, Big W, Woolworths, BBC Cinemas and Coles, and possibly Myer in the short to medium term, it is almost game, set and match as far as Darwin’s retailing is concerned.
Almost. There are plans for improving retailing in the CBD, both around the Smith Street Mall and elsewhere. At least one potential mixed development in the CBD could have an end value in excess of Casuarina Square’s, and there are other proposals in addition to these. While retail would only be a component of any such development, we note that rental values in the CBD are nowhere near those in Casuarina Square (there being only a few prime positioned tenancies in the CBD being worth over the $1000 per sqm level; many of the specialty shops in Casuarina pay well in excess of that amount).
Even at those lower rentals, retailing in the CBD attracts higher yields – and hence lower values – for properties. While even the best CBD retail properties may require yields of 7.5%-plus to attract buyers, the capitalisation rate used in the abovementioned valuation of Casuarina Square is over a full percentage point lower than that. Moreover, the CBD and surrounds contains only a bit over a third of the residential population of the northern suburbs, and unlike Casuarina Square there are vacancies in the CBD retail area, some quite long term. Palmerston, which is Darwin’s third population node, houses just over half the population of the northern suburbs, and is relatively self contained from a retail perspective. However, a major new retailing development is about to being at Coolalinga, beyond Palmerston, towards the proposed new satellite suburb of Weddell. This could shake things up a bit out there as much as the emerging proposals could in the CBD.
CoM
MER
CIA
L

1�
The month in review
Underpinning the values of all such properties is Darwin’s high level of retail spending compared to the rest of the country, as shown in the following chart from this month’s Territory Economic Review:
In turn, such retail turnover depends on employment growth, which Access Economics predicts will also be the highest in the country out to 2013-2014. It also predicts that the unemployment rate will be the lowest in the country through the same period.
All of this is positive for future retail development. But while the latest business confidence indicators such as the ANZ Job Advertisement Series and the Sensis Business Index have the NT at or near the highest of any state or territory, the impact of the recent announcements of Woodside not coming to Darwin and Inpex further delaying works well into the medium term is yet to be determined. So while Darwin retail is sitting pretty, it won’t stay pretty by sitting.
Perth
Prime retail property purchases continue to be dominated by large institutional buyers and sellers. In Perth, the recent sales of the Armadale Shopping Centre ($120 million) and Harbour Town Shopping Centre ($134.5 million) started the year off with an impression that an active market was in store. The buyer, Lend Lease, is keenly acquiring properties within the ING Retail Property Fund portfolio which has an estimated combined value of $1.4 billion. Lend Lease is currently in negotiations with ING to purchase their 50% stake in the Lakeside Joondalup Shopping Centre, which has an estimated value is estimated to be $450 million. The other 50% is owned by Future Fund which is a sovereign wealth fund established by the Federal Government in 2006 to assist the Federal Government meet the cost of public sector superannuation liabilities. Most Australians who belong to a superannuation fund will likely find that part of their fund’s investments hold similar assets. Private investors can also purchase shares in a retail property fund that may hold such assets as well. Regional shopping centres are large complex structures which require significant skills in managing such facilities by keeping them appearing new and fresh, ensuring a good tenancy mix.
These types of assets, although still affected by economic circumstances, fluctuate significantly less than their industrial and office counterparts. The reasons are quite obvious in that its income stream is drawn from many tenancies and sources, and their leases tend to favour owners commonly including covenants such as ratchet clauses.
....the buyer, Lend Lease, is keenly acquiring properties within the ING Retail Property Fund portfolio which has an estimated combined value of $1.4 billion....
In the CBD premium retail market there have been no major transactions since the sale of David Jones, in November 2009 for $114 million at a passing yield of 7.75%. The buyer, Permanent Investment Management Ltd is a wholly owned subsidiary of Trust Company Ltd. Both companies offer a range of financial and investment retail products.
However, individual investors have recently had another option - to invest directly and thereby wholly owning a prime retail property of their own, by acquiring a strata titled retail shop. one such development is ‘160 Central’ located at 160 St George’s Terrace, Perth. The nine-storey office building was recently refurbished and Strata Titled, which offered investors either retail and office units. The building’s ground floor incorporates a central arcade linking St George’s Terrace to Hay Street. our analyses reveal that the individual units could expect to return between 7.25% and 9%. Buyer interest has been solid with almost all of the 24 units reportedly sold. Sale prices reveal rates ranging from approximately $6500 per sqm to a little over $34,000 per sqm, for floor areas ranging from 17sqm to 67sqm. The average sale price of the 15 confirmed sales on the Landgate database is a little under $475,000.
Retail vacancies in the Perth CBD are at present approximately 8%, which is likely to increase with the addition of approximately 10,000sqm of new space following the completion of Raine Square later this year. Retail sales growth has also been sluggish with total retail turnover growth in the 12 months from March 2009 to March 2010 a little under 4%. The figure in itself might suggest otherwise, however March 2009 was approaching the height of the GFC gloom and the intervening period included the Federal Government’s stimulus package and the commencement of the $43 billion Gorgon project. In addition the state maintained strong mineral and petroleum exports and unemployment rose only to a modest 5.7%. Currently the unemployment rate in Western Australia is 4.9% (seasonally adjusted). of course the Reserve Bank has lifted rates on six occasions
CoM
MER
CIA
L

1�
The month in review
since April 2009. Consumer sentiment has not only been curtailed by the successive rate rises as the European Debt Crisis, poor recovery of the US economy, uncertainty regarding China’s continuing growth in the face of a looming property market bubble, uncertainty regarding the Federal Government’s proposed Resources Super Profit Tax have all undoubtedly diminished the recent optimism gained from the perception of having recovered from the GFC.
As indicated prime retail property has historically tended not to display the volatility of other commercial property asset markets, except turnovers are impacted significantly. Towards late 2009 and for the first quarter of 2010, there has been a significant increase in institutional buyer and seller activity. The current global uncertainties are mostly a continuation of the GFC where bad debts have merely transferred from banks to government having led to sovereign insolvency in Greece. Europe represents China’s second largest customer of its goods and has its own concerns regarding a looming property bubble, which is a large enough threat to severely impact its economy. Recently the factors referred to previously as being responsible for our declining consumer sentiment have been referred to as elements forming a perfect storm. However, what is becoming increasingly apparent is that the longer these elements remain the more likely it is that Australia suffers a direct hit which would undoubtedly result in a protracted recovery. Under these circumstances it will be of interest whether prime retail property can maintain the resilience it displayed following the GFC.
South Western WA
Bunbury has a strong retail presence being the main administrative and commercial centre of the rapidly growing south west region of WA.
Bunbury has a diversified economy based on resources, timber and agricultural exports through the Port of Bunbury, as well as its service role to resources activities in the South West region. It is also a gateway centre for the tourism industry in the region. Retailing, education, health and construction are also important activities.
The retail market for CBD properties has been characterised by limited supply. Properties in this segment are tightly held with few made available either for sale or lease. Consequently there have only been several sales over the past 12 months, with values and rentals remaining steady. Construction of new CBD retail premises has been constrained mainly to the Marlston Hill and Marlston Waterfront precincts. These have generally been timed well to meet demand with an orderly take up rate.
....the volume of new showrooms and bulky goods premises have been growing steadily, even through the Global Financial Crisis, with leasing take up rates reasonably steady....
There is an under-supply of shopping centre retail space with few new premises made available since
the redevelopment of Crosslands/Parks Centre, and construction of Eaton Fair some years ago. However the Bunbury Forum is currently under expansion, there is a planned expansion of Eaton Fair, plus new district shopping centres planned for Treendale in Australind and later for Dalyellup. Developers in this segment will likely be watching each other closely to ensure they do not create an over-supply situation in the near future.
The volume of new showrooms and bulky goods premises have been growing steadily, even through the Global Financial Crisis, with leasing take up rates reasonably steady. Again these properties are tightly held with few sales. of note, the property on the corner of Blair and Strickland Streets Bunbury, comprising the former Retravision premises, is currently for sale. This is a modern prominent building with 1600 sqm of retail floor space plus additional storage and office space leased to Ranger outdoor for 10 plus 10 years presently on the market, with an asking price of $4.5 million.
overall the retail property market in Bunbury is steady, albeit with limited sales transactions. A small amount of speculative activity continues and sound demand appears to underpin the leasing market. The retail market has faired better than similarly located warehouse/workshop/factory type properties through the mixed business precincts that have been influenced by the emerging over supply in the light industrial market.
CoM
MER
CIA
L

1�
The month in review
Residential overview
one of the primary keys to real estate success is to identify your buyer. Unless you know who is going to pick up your property, you are on a fast track to failure. In the current environment where so many players are unsure of what the future holds, it can be difficult to determine who is parting with their money and investing in bricks and mortar.
This month our offices have put together their observations on which buyers are driving demand in their markets and how that demographic has changed since we last addressed this issue in August 2008. By pinpointing these participants, we can gauge who is most confident about the upside potential in markets across Australia and where there tipping point is.
Sydney
Zetland, Rosebery and Waterloo
The types of property found in the inner city suburbs of Zetland, Rosebery and Waterloo are predominantly comprised of modern medium-density unit development. The purchaser demographic in these areas mainly consists of young professionals and international investors, with the appeal of such areas offering an attractive lifestyle within close proximity to the city, airport and other sought after amenities.
The type of buyer investing in property around Zetland, Rosebery and Waterloo has remained consistent since 2008, dominated by young professionals and overseas investors, particularly from Asia. It is likely that these types of investors will remain the dominant buyer in this market given the supply and demand factors for this type of property. The main factor, which may impact on this market in the near future, is that of the Chinese economy. A slowing economy in China would likely see
Asian investors become less active and possibly reduce property holdings in the market.
Bondi
The housing market of Bondi has experienced strong growth during the past 12 months, particularly for properties priced between $1 million and $2 million. The buyer profile for Bondi predominantly consists of established medium to high-income earners, particularly families. In spite of the global credit crunch of 2008, the buyer profile for Bondi has remained relatively constant and is forecast to remain unchanged in the near future.
one particular trend worth noting in the Bondi housing market is the purchasing of older, ‘rundown’ dwellings with renovation potential. Thus, investors can take advantage of a rising market and potentially make a relatively significant profit in a short time frame.
Dee Why
The property market of the northern beaches suburb of Dee Why has experienced significant growth in the past 12 months, which has been largely contributed to the first home-owners grant initiated by the Federal Government. The type of property most prominent in the Dee Why vicinity is predominantly medium density unit developments. There has been exponential growth in the construction of new unit complexes; with developers seizing the opportunity to take advantage of the massive potential the area has to offer.
The buyer profile in Dee Why mainly consists of younger professionals and first homeowners, which has remained relatively unchanged in recent years. They are attracted by the area’s relative affordability, its proximity to beaches, shops, public transport and other sought after amenities. Despite the expectation that rising values in the area will plateau due to interest rate rises, the buyer profile is not expected to deviate too significantly in the near future.
Annandale
The suburb of Annandale in Sydney’s inner west has experienced increased market activity in recent times,
RESI
DEN
TIA
L

1�
The month in review
which hasn’t slowed despite recent increases to mortgage interest rates. The suburb is characterised by mainly semi-detached and terrace style period dwellings which are generally the most sought-after by purchasers, especially the owner-occupier market.
Predominantly established purchasers upgrading their place of residence are driving the strong market conditions in this area. Buyers are generally professionals and young families looking to secure their piece of real estate in what is becoming one of the inner west region’s most sought-after suburbs, thanks mainly to its proximity to the CBD and abundance of period era homes.
The remaining dwellings in original condition are being purchased at a premium price by buyers who are seeking to capitalise on properties in need of renovations, however there may be greater overall value for money in already renovated properties due to less demand comparatively.
Westmead
The suburb of Westmead in Sydney’s west has experienced increased market activity in recent times, which hasn’t slowed despite recent increases to mortgage interest rates. The suburb is characterised by mainly freestanding dwellings and medium density development, comprising of mainly units with townhouse and duplex development. Freestanding dwellings are generally the most sought-after by the owner-occupier market, whilst the medium density properties of predominantly units are investors and owner-occupier driven.
....there has always been a constant level of activity in the medium density market of Westmead, with unit buildings ranging in age from the 1960s-built to recently-built unit complexes....
The strong market conditions in this area for freestanding dwellings are being driven by predominantly established purchasers upgrading their place of residence. Buyers are generally professionals and young families looking to secure their piece of real estate in what is becoming one of the region’s most sought-after suburbs, thanks mainly to the suburb’s proximity to the Parramatta CBD, good public transport and easy access to the M4 Motorway, which then provides easy access to the Sydney Metro area.
The remaining dwellings in original condition are being purchased at a premium price by buyers who are seeking to capitalise on properties in need of renovations or to rebuild, however there may be greater overall value for money in already renovated properties due to less demand comparatively.
There has always been a constant level of activity in the medium density market of Westmead, with unit buildings ranging in age from the 1960s-built to recently-built unit complexes. Unit developments that have been built within the past two years and nearing completion have been well received in the market place and have benefited from increased market values for the past 16 months, as well as satisfactory rental returns.
Despite the expectation that rising values in the area will plateau due to eventual effect of interest rate rises, the buyer profile is not expected to deviate too significantly in the near future.
Blackheath
The town of Blackheath in the upper Blue Mountains has seen increased market activity in the past six months, due largely to the fact that the town caters to a wide range of buyers. The town is typically characterised by older, character style dwellings interspersed with pockets of 1980s and 1990s brick veneer dwellings.
The older style dwellings, which are usually on well- landscaped and manicured allotments typically, attract two types of purchasers. The first comprises investors from Sydney looking to purchase on idyllic mountains cottage, to be utilised jointly as a weekender style holiday location, as well as short team leasing to other people looking to use it for the same thing. This way they are receiving some return on their investment as well as having a weekend and school holiday getaway.
The second type of buyer attracted to this style of dwelling is the retired couple and tree changers. Blackheath provides a sleepy mountain lifestyle whilst still providing most necessary amenities as well as a golf course, railway station and loads of nearby bushwalking tracks.
The newer style brick veneer dwellings provide affordable options for local first home-buyers or families looking to purchase their second home. Blackheath is serviced by a primary school. The nearest secondary school is situated approximately 10 minutes drive to the east at Katoomba.
Blackheath, as is the case with most upper mountain villages, can tend to be quite cyclical, however after an extended period of inactivity it could be expected that this trend may continue into the second half of this year subject to interest rate rises and the looming Federal Election.
Canberra
The Canberra market is still performing quite well for 2010 and generally the buyer power lies with the second or third home-buyers. This type of purchaser is the same as reported in the Month in Review August 2008.
overall the attitude has remained consistent with intending purchasers opting for quality homes in a good location and on a decent size block or units in a prime
RESI
DEN
TIA
L

1�
The month in review
location with quality finishes. In April, Canberra recorded its highest sale on record for a manor style house in the inner south suburb of Red Hill on a heritage listed block of 11,353sqm. It recorded a price of $7.3 million.
The workforce in Canberra is largely dominated by the public sector, whereby employees appear to have the potential to earn slightly higher base wages than in the private sector. Coupling this with significantly high rents throughout the capital it created a consistent demand for housing in the ACT. As a result we have seen a sustained boom in new developments in and around Canberra.
New development taking place is commonly of a higher density than in the past with smaller block sizes and townhouse style residences close to local amenities. This is particularly evident in northern Canberra. This style suits the first home-buyer or an investor looking for an affordable option with attractive yields. This has allowed previous renters the opportunity to seek affordable housing in emerging precincts. Whilst the younger age sector of first home buyers appear to have backed out of the market, there still appears to be demand from the more mature aged, first home-buyers.
In the established inner north and south suburbs of Canberra, high prices mean the buyer type with the most power is the cashed up investor or family looking to upgrade.
The availability of online services such as ‘Allhomes’ and ‘actmapi’, has empowered the astute buyer to research and ascertain a fair idea of market conditions and information pertaining to properties of interest. Allhomes has been able to take a strong hold on the Canberra residential market, being the most predominantly used advertising and research basis for buyers in the ACT.
It will be interesting to see over the next month or so if the interest rate hike will soften the residential market in Canberra but for now the market has remained quite resilient with established investors looking for opportunities of possible capital gain and rental returns, families upgrading and potential buyers looking for affordable options on the outskirts of Canberra.
Wollongong
During the past 12 months there has been a significant shift in the property market, from a ‘buyers’’ market to a ‘sellers’’ market throughout the Illawarra region. Due to rising interest rates and uncertainty throughout the economy in 2008 and into early 2009, this has made the market thinly traded and has limited values achievable in the area. However, in recent months there has been an
injection of confidence back into the property market, which is having some positive results.
Throughout 2010 the Illawarra property market has generally been dominated by owner-occupiers, predominantly Mum and Dad buyers looking to secure the family home in the mid-tier price range. This has not always been the case during the past 12 to 18 months. In 2009 there was strong market dominance by first home-buyers in the ‘lower’ tier price ranges. The suburbs and property type that most benefited from the first home buyer demographic throughout 2009 were older units in Wollongong CBD and the more affordable Southern suburbs such as Dapto, Unanderra, Berkeley and Lake Illawarra areas. With the focus changing to the mid-tier price range in 2010 the benefits have been seen generally across the board, from Helensburgh through to Kiama. This mid-tier price range is made up of families looking to upgrade their homes as a result of the flurry of first home-buyers purchasing their previous properties, thus changing the dynamic of the market.
This change in market dynamic has meant that vendors are achieving stronger prices for their properties in shorter periods of time and more stock is coming onto the market. This trend has kept local agents rather busy of late.
....throughout 2010 the Illawarra property market has generally been dominated by owner-occupiers, predominantly Mum and Dad buyers looking to secure the family home in the mid-tier price range....
The strengthening of market conditions has encouraged many investors back into the market over the past six to 12 months. Renewed confidence in the economy, coupled with strong rental returns, has seen investors coming back to the area. They have predominantly focused on the inner CBD areas of Wollongong and fringe suburbs of the CBD such as Gwynneville, Keiraville and Fairy Meadow. This is due to the close proximity of these suburbs to the university, which allows a strong tenant profile for investors, good rental returns and low vacancy rates in these areas.
The strengthened demand throughout the Illawarra region has also encouraged a number of developers to return to the market and/or bring projects back on-line that they had previously been shelved.
Sales of development sites have been scarce throughout 2006-2009, as developers have not had enough demand for their projects to undertake any new developments on a large scale. This is particularly the case with new units in Wollongong CBD. The lack of demand coupled with oversupply of new prestige units over the past few years has seen this market sector really soften from 2005 to 2009. However, this oversupply appears to have been absorbed of late and the few new unit developments that are being offered for sale in Wollongong CBD appear to be going strong. Now that the over supply has been absorbed, it is hoped that the prestige unit market will continue to strengthen and there will continue to be buyers returning to this market sector.
RESI
DEN
TIA
L

1�
The month in review
It has also been evident that the prestige property market throughout the Northern Illawarra suburbs is starting to enter a phase of recovery. Although this market sector is still volatile, there are more buyers entering this market sector. Beachfront properties over the $1 million mark are starting to see higher turnover and stronger prices being achieved than that of the past few years. There was recently a sale of a beachfront property in Wombarra, bordering Thirroul, for $3 million.
So what will the next 12 months hold, I hear you ask? This is always a tricky question to answer, especially when we have been in such a volatile property market for the past few years. I imagine that if interest rates stay on hold and the global economy continues to stabilise, we will see more recovery and stability return to the property market throughout all market sectors in the Illawarra area. However, if interest rates rise or the economy sees any more major hurdles, this may just dampen any hopes of immediate market growth and will likely have a plateau effect on market values.
Central, North & West NSW
DUBBo
Low cost sales volumes have increased significantly, with buyers being predominantly first home buyers and local investors who are returning to the market place after showing low levels of interest in the property market during the past six to 12 months. Mid cost value levels have stabilised after a period of increase throughout 2009. The increased First Home owners Grant had the effect of increasing sales volumes and value levels during 2009, however now that the grant has reduced, prices and sales volumes are beginning to return to normal levels. This compares with August 2008, when the demand in this price range had softened over the previous six to 12 months. There had been no obvious downturn in prices, but the marketing period for these properties had lengthened due to the increase in the number properties on the market and increased competition from the new housing construction market.
Demand and sale prices for high cost homes has increased slightly over the past six months, depending on the location and appeal, in contrast with 2008, when demand for high cost homes had softened after a period of downward pressure. This was a result of the increased competition from the new home construction market.
MUDGEE
Potential buyers in the Mudgee market range from coal miners to tree changers, young professionals through to
retirees and many more. Luckily Mudgee provides a good range of different property types to suit the needs of these buyers. The traditional allotments in close proximity to the town centre are generally older style double brick dwellings, which are often renovated which suit retirees with the convenience of being able to walk to the shops. The unit market is attractive to young professionals and non-local investors alike due to the low maintenance and good rental return. The rural residential market is relatively strong with a lot of miners interested in living out of town.
Generally the market has performed quite well so far in 2010. Activity has dropped slightly on results seen in the second half of 2009 but with good rainfall and a strong local economy the market should continue to perform throughout the year.
BATHURST/oRANGE
Within the Bathurst/orange area there is still a good mix of buyers active in the market including first, second and third home-buyers, executive/rural residential buyers, and investors. The first home-buyers’ market took a distinctly backward step in early 2010, yet still has a moderate level of activity given the reductions in the first home-buyers grant. First home-buyers are expected to further retreat with rising interest rates.
Second and third home-buyers have slightly increased in activity as most of them have sold to the first home-buyers. This includes quite a good level of new dwelling construction, particularly in Bathurst.
....the first home-buyers’ market took a distinctly backward step in early 2010, yet still has a moderate level of activity given the reductions in the first home-buyers grant....
Executive and rural residential properties are selling, however there is a mix of purchasers. Some are looking for a bargain and searching for a vendor under financial duress who is willing to negotiate, as well as purchasers willing to offer and pay slightly above the market price to secure their dream property.
The orange area is experiencing a good level of new dwelling construction in response to the increase in activity at the Cadia gold mine. As fast as new three and four-bedroom dwellings and duplexes can be constructed they are selling and being owner occupied and or tenanted. There is evidence of these dwellings selling for between $365,000 and $410,000 and being tenanted for $420 to $460 per week on six to 12-month leases.
Since our report in August 2008, the first home-owners have come and gone from the market to a certain degree, and activity has increased in the middle and high-end markets. Rents in 2008 were static, resulting in investors exiting the market. Now in 2010, there is a severe shortage of rental properties putting upward pressure on rents. on the strength of these shortages, investors are returning to the market albeit cautiously.
RESI
DEN
TIA
L

�0
The month in review
Newcastle
In 2008, we described the Newcastle residential market as a ‘mixed bag’, with the market facing differing challenges in different suburbs. Two years down the track, this is still the case. The first homebuyers’ scheme has come and gone and left the typical mortgage belt suburbs showing signs of what can be best described as being in slightly more solid position to that at the beginning of 2009. There is still some hesitation evident in buyers with no notable leaders emerging in the ‘preferred Suburb’ stakes.
We imagine that any region across the country, interest rate movements are the hot topic – will they, won’t they rise. This uncertainty has resulted in the number of properties listed for sale still exceeding the number of purchasers actively seeking property.
....there is still some hesitation evident in buyers with no notable leaders emerging in the ‘preferred Suburb’ stakes....
Stable activity has been noted for the mortgage belt suburbs, which are generally located in the outer areas some 10 to 20 kilometres from the city centre.
The inner city suburbs are still in demand with a steady number of sales occurring and this seems to be the more popular choice of buyers.
But there doesn’t seem to be any standout suburbs at present.
Holiday areas such as Nelson Bay have been the worst affected areas, post economic downturn and at this stage, the recovery of these areas seems to be some way into the future.
It will be very interesting to see how the future unfolds for areas like Singleton and Muswellbrook, which are popular with the mining personnel for real estate investment, as the effects of the Federal Government’s proposed mining tax strategy are felt.
NSW Mid North Coast
So who are the buyers? The main regional centres along the Mid North Coast of NSW have significantly lower median house prices in comparison with the major cities of Australia. our research has found the median house
price in Port Macquarie to be approximately $385,000; Taree approximately $240,000 and Forster approximately $380,000. Being more affordable, the region hence remains attractive to wide range of local first home-buyers and families, retirees relocating to the area, and investors.
2010 has seen sales volumes weaken, with our research indicating falls over the past quarter of approximately 20% for Port Macquarie and approximately 33% for both Taree and Forster. Please note that total sales volume for the past quarter is still incomplete as some exchanged sales are yet to be recorded, but when complete they will still show a significant decrease. This slowing can be part attributed to the reduction of the First Home Buyers grant, though overall most buyers are remaining more cautious following rising interest rates and the speculation of more to come.
Who is active? The local rental market remains tight with vacancy rates typically around 2%. Investors most often target the lower end of the market (sub $300,000 in Port Macquarie and Forster; sub $200,000 in Taree) where higher yields are usually obtainable coupled with lower capital outlay. A recent sale in Port Macquarie saw an investor purchase a house for $210,000 with a tenant now in place paying $285 pw. Investor activity for no permanently occupied holiday income property remains weak.
Despite a weakening in sales volume, a wide range of buyers continue to be active in 2010, which has seen the median price level remain steady to most market sectors within the main regional centres including that of the prestige house market, typified by recent sales such as a $1.03 million house overlooking Lighthouse Beach at Port Macquarie, and $1.425 for a house on Dumaresq Island, Taree.
NSW Central Coast
In our daily work life, we analyse the emerging sales evidence coming through which in part involves discussions and interviews with those behind the scenes of, but responsible for the goings on in real estate world. This includes real estate agents, investors and banks.
With the first home buyers’ scheme now well and truly behind us, the market seems to have settled down to a more orderly pace, but there is an underlying sentiment that is coming through – there is no real identifiable buyer profile at present.
Market segments that rise and fall during the normal cycle seem to be in a state of convergence and at the same time separation. Buyers, including investors, are out there and making their presence felt, but there is some hesitation across the board. We are still seeing activity in the first homebuyer and investor market. But this is subdued, as is the activity in the second and subsequent homebuyer markets.
The underlying, but clearly audible sentiment is that the people are anxious about interest rate changes and what the banks are going to do next. Buyers clearly long to hear some calming news from the banks. This may come
RESI
DEN
TIA
L

�1
The month in review
about in the fullness of time as the overall economy settles down.
In the meantime, life continues on the Central Coast, but symptomatic of the overall market, there is no standout suburb or market segment at present. The mortgage belt areas are trading quite well with vacant land considered to represent good buying in areas like Hamlyn Terrace and Woongarrah. There are examples of developers in these areas who have purchased land in bulk and are building affordable homes with first buyers and investors being targeted. Some good and solid purchases are being seen here.
The beach and waterfront locations like Terrigal, Avoca Beach, MacMasters Beach, Forresters Beach and The Entrance are steady, but the impending news on how the local councils will be treating these properties in response to their respective interpretations of sea level rises has the potential to affect these markets.
Interestingly, after an extended absence, we are seeing a trickle of new unit developments coming out of the ground with more enquiries of late from developers. This type of enquiry usually occurs when the developers are getting ready for the next round - welcome back.
Southern NSW & Northern Vic
ALBURY
Throughout Albury – Wodonga and like many other regional centres across Australia we have seen a significant change to our local residential markets during the past 12 months. This change has been evident across the board in residential units, dwellings, rural-residential properties and vacant land allotments. These market changes have been attributed to major economic change in the form of the economic crisis which our nation has been through during the past six to 12 months - however, we are seeing the light at the end of the tunnel. As we are all aware this crisis brought increased interest rates, increased borrowing, a downturn in new construction and a major decline in consumer confidence.
Popular areas are considered to be Central Albury and South Albury, due to the attractive distance from the CBD. owners are continuing to refurbish, repair and update within their financial perimeters.
other suburbs that have become attractive to the market have been Thurgoona, which is located about 5km from the CBD. Thurgoona’s median price has increased in recent times due to the new major shopping centre being constructed, proximity to schools and universities, and the continuation of new land sub-divisions. This precinct of Thurgoona has seen an increase in investors seeking house and land packages, due to reasonable returns on investments. Typical yields received in these areas are between 4% and 6%, compared to yields of 3.5% to 5% in established suburbs.
Buyers within our local markets are still extending credit to obtain properties. The first home-owners have decreased due to the reduction in government grants. This has affected both new home construction and sales across the board.
WAGGA WAGGA
In 2008 we looked at the prestige market, rural residential holdings and the unit market in Wagga, all three of which were fairly flat. We have seen various changes in these markets since 2008 with the strongest performing sector of the three being the unit market. The first home-buyer market has definitely been the star performer throughout 2009 with a very high volume of transactions taking place, although this market has slowed dramatically over the past few months due to the reduction in the FHBG and a lack of available stock.
2009 was a good year in the Wagga prestige market with the highest residential sale ($1.2 million) taking place. The top end of this market tends to be dominated by retirees and well established local business owners/empty nesters who are looking to stay in these dwellings for a prolonged period of time. However, the $500,000 to $700,000 price range generally attracts a younger/middle-aged buyer looking for space and modern accommodation. This market has been quite active during the past 12 months, particularly in Tatton where the quality of the housing is high and demand for land is very strong. There are few investors in this market with the exception of The Defence Housing Authority, and most dwellings are owner occupied. Agents are, however, reporting that enquiry levels have dropped off significantly in the past few months, as has the volume of sales coming through in this sector.
....2009 was a good year in the Wagga prestige market with the highest residential sale ($1.2 million) taking place....
The rural residential market has remained relatively flat during the past year, although over the past two months we have noted an increased level of sales in this owner-occupier-dominated market. Generally TBE valuations have been on the increase in this sector, which is a positive sign for the year ahead. The buyer profile for this sector hasn’t changed and is typically young families that appear to be relying on bank credit to purchase/build.
As always in Wagga our units are very sought after, providing strong returns and low vacancy rates. This market historically has been investor dominated, however we have been seeing some owner-occupiers enter the
RESI
DEN
TIA
L

��
The month in review
market with the assistance of the FHBG. There has been a lack of available stock in this sector during the past six months, which has resulted in a slight increase in prices. A two-bedroom unit in central Wagga will generally fetch between $230,000 and $265,000 with a rental return of 5% to 6%.
LEEToN/GRIFFITH
At present there is no one distinct market segment that has the play. During the past few months the greatest number of sales has been in the $200,000to- $300,000 price bracket, but the volume has not by any means been significant. our market has become dominated by fence sitters and tyre kickers. Uncertainty and fear regarding affordability, employment stability and local economic conditions have caused a significant number of prospective buyers to put their dreams of home ownership in the too hard basket for the time being. The market appeared to have bottomed out 12 months ago, but, unfortunately, unless our buyers get a confidence revival we are in for some new lows.
Melbourne
Melton
Melton is generally considered an outer Melbourne suburb approximately 36km northwest of the Melbourne CBD.
There is an increasing level of ‘Land Banking; occurring by local investors as opposed to the tracts of undeveloped subdivision land purchased over the past 10 years by several large companies in the western suburbs such as Tarneit, Point Cook and Williams Landing. Some current estimates put future land reserves at 15 to 20 years.
Apart from lower priced existing houses in Melton ($200,000 to $300,000) there is good demand at present for new housing ($300,000 to $350,000). Recent changes to the First Home owners Grant (FHoG) has increased the demand for the construction of new houses but reduced demand for existing properties. This is leading to some falls in value when new properties are relisted and sold.
....relaxation of the Foreign Investment Review Board conditions saw an influx of buyers from China and Hong Kong....
The new Deer Park by-pass has slightly reduced travel times to Melton from the CBD and outer lying industrial and commercial areas where many of the Melton population work.
The recent completion of the T.A.B. Corporate Park (the new home of Equestrian riding) should generate a new type of buyer, (more than $500,000) to the area. It is predicted that the overall profile of the area will be lifted and rural residential house sites will gain popularity.
In essence there is a risk of new home oversupply if the FHoG is reduced or cancelled, however these long-term
infrastructure developments will soften the effects. The market is expected to remain predominantly first home-buyer and those looking toward the lower price bracket for Melbourne.
Doncaster
Closer into Melbourne, Doncaster (which is generally considered an upper mid socio-economic area) is located 14km east of the Melbourne CBD with access directly off the Eastern Freeway.
It is a well-serviced area with a recently refurbished and extended regional shopping centre, bus/car park interchange and many well regarded schools and scenic parks. Prices for houses typically range from $700,000 to $1 million, although exceptions do exist.
This area has seen rapid price growth since January 2009 with some properties increasing by 30%. Relaxation of the Foreign Investment Review Board conditions saw an influx of buyers from China and Hong Kong. Due to the sudden availability of freehold land and good returns, demand remained very high until the recent tightening of the FIRB conditions. There are common stories from local real estate agents of more than 100 people turning up to an auction.
Small townhouse complex development appears to have slowed and while demand remains good there is a lack of land and suitably price houses for redevelopment.
Apartments in three-storey complexes being developed along Doncaster Road have nearly all pre-sold off the plan or soon after construction has commenced. Several larger high rise apartment towers (opposite the Westfield Doncaster Shopping Centre) now have a high percentage of presales following a collapse in demand and oversupply in the market for high rise developments a few years ago.
Demand has definitely gone off the boil but demand is expected to remain steady. Higher interest rates are affecting existing owners, however properties are expected to remain tightly held.
Kew
Kew is an attractive, older inner eastern suburb approximately 6km from the heart of the CBD. It has a high proportion of owner-occupiers and is well serviced by buses and trams, while providing easy access to the city via a network of main roads and the Eastern Freeway.
Few would argue that Kew is one of Melbourne’s more affluent suburbs. However, as with Doncaster, until earlier this month offshore buyers often priced local buyers out of the market. In addition to the premium prices being
RESI
DEN
TIA
L

��
The month in review
paid there have been reports of foreign (cash) buyers competing with other foreign buyers at auction. This has had the effect of rapidly increasing prices of both properties for sale and rentals. The well-publicised FIRB reintroduction of harder compliance measures has had a dramatic affect coupled with increasing interest rates.
owners in these suburbs often have large share portfolios that assist in buying and financing their properties.
While it is less sensitive to interest rate increases, recent global financial turmoil is expected to further soften the upper end of this market.
Regional Vic
ECHUCA
Loosely speaking, ‘local’ buyers are the mainstay driving demand in the local market place, with a small but not insignificant influence from out of town buyers (mostly Melbourne) who seem to place a floor in the market. The term ‘local’ has been used to cover a broader group including:
• Those who relocating within the Echuca-Moama township.
• Those who are relocating from more remote/satellite centres/regions (e.g. coming into town off farms).
• Those originally from Echuca after living away for a period of time.
The demand appears to come at varying levels of value - from first home buyers (mostly from existing Echuca/Moama residents) through to higher end properties for those returning who may have had exposure to stronger residential markets elsewhere, and whose purchasing power is consequently significantly stronger in the Echuca-Moama Market place relative to where they have come from.
MILDURA
A quiet month for the real estate agents has been evident in Mildura – is this winter coming early and buyers going into hibernation or economic circumstances? Cautious is the present description of the buyers in the market. Certainly the rapid increase in interest rates has slowed the energy of both owner-occupiers and investors.
The most active buyers in the market have been focussed towards the lower mid range of the market and most inquiry is in the $220,000 to $350,000 price range. The
low-end market has been noticeably quieter and this is where the interest rate rises have panicked the buyers.
The dramatic first home buyer activity in 2009 has resulted in only limited numbers of first home buyers left in the market now and the psyche is despondent due firstly to the interest rates but secondly the perception that they have missed the boat for the generous amounts that were available. In reality there has now been only a relatively minor drop in the grant in Victoria.
Some out-of-town (many internet) buyers have been active predominantly in the $300,000 price range where $280 to $300 per week is the common rental.
SALE
The Gippsland residential market continues to be strong with varying degrees of buyer interest over the past 12 months.
The First Home Buyers Grant ensured an initial surge at the lower end of the market for both established properties and new dwellings. The decrease in government funding, as well as rises in interest rates has now slowed first homebuyer interest.
Demand continues to be steady at the affordable end of the market with a noticeable decline at the higher end, possibly due to the increased interest rates.
Land values have risen quite significantly throughout the region as a result of lack of supply, encouraging greater interest from developers.
....East Gippsland is showing a strong demand for new housing with new construction activity declining due to limited availability of vacant land and prices increasing accordingly....
With the increase in interest rates and reduction in the First Home Buyers Grant, investor confidence has returned to the market over recent months with rental returns continuing to be strong throughout the region.
Local agents have advised that retirees are returning to the area with improved levels of enquiry from cashed up purchasers leaving the Melbourne market.
Coastal and Lake Areas are showing a thinly traded market with a reduction in property values and sales.
Latrobe Valley continues to be very strong with affordable areas of Morwell, Moe and Churchill showing a gradual increase in property prices.
East Gippsland is showing a strong demand for new housing with new construction activity declining due to limited availability of vacant land and prices increasing accordingly. Agents have indicated however that house and land packages are showing a greater appeal to the younger demographic.
RESI
DEN
TIA
L

��
The month in review
Adelaide
In broad terms the Adelaide residential property market has continued to steadily move ahead during times of uncertainty caused by the Global Financial Crisis (GFC), interest rate increases and a lower volume of transactions.
Many were predicting a slump in demand for residential properties, especially in the outer or newly developed areas, after the First Home owners Grant Boost was removed in late 2009. However this does not appear to have occurred. While much of the demand for housing was ‘brought forward’ in order to beat the october cut off for the boost, demand levels and property values appear to have remained stable. A good example of this is the suburb of Morphett Vale to the south of Adelaide. Within this suburb there are a large number of entry point properties and demand for the lower priced properties is strong from first home-buyers. Rents for properties within the suburb have also increased. As the rental returns increase it is likely that investors will again enter the market looking at less risky investments, particularly given the recent share market turmoil.
....developers are generally doing their homework and constructing dwelling types that are in demand....
Possibly of more immediate concern to residential property owners is the future of interest rates. The perception is that many buyers, including recipients of the Home owners Boost, have extended themselves fully in order to secure the best possible property, making themselves vulnerable to increased borrowing costs. At this time the evidence of is only anecdotal, however further interest rate rises are likely to result in a number of these properties being offered to the market as the mortgage pressure becomes unmanageable.
There are signs of optimism returning to the residential property market. There is a growing perception that the worst of the GFC is behind us and that it is safe to come out of hiding. There is lingering unease as economic woes continue in the Euro Zone and locally with the RBA predicting further interest rate rises.
Developers are generally doing their homework and constructing dwelling types that are in demand. Competitive pressure on land values has seen developers increase dwelling densities to make projects more profitable. For example, south of the Adelaide CBD in suburbs such as Sturt, Dover Gardens and Seacombe Gardens there have been high levels of redevelopment, and developers who are active in these areas are building products to meet the market needs.
Historically developers constructed mostly single level dwellings, while recently two storey dwellings are becoming more popular. This is really a combination of a number of factors such as increased demand for land in prime locations, and acceptance by the market. There have been a few developments where the dwellings are
not suitable for the area, however where this has occurred it is mainly due to dwellings being over priced.
The $1.5 million-plus market pretty much stopped through 2008 and the volume of sales were also down on previous years, while the $700,000 to $1.3 million saw a small correction through this time. There were a smaller number of buyers active in the market and selling periods were longer than had previously been experienced. In recent times, demand for good properties within upper price bracket has returned and is just as strong as pre-2008, generally in prestige locations to the inner suburbs of Adelaide, including Unley and North Adelaide and the coastal strip from Semaphore to Seacliff. Some of these properties have exceeded value expectations when selling at auction.
Brisbane
Well Brisbane is undergoing a reactionary real estate market akin to the swings and roundabouts usually reserved for the stock exchange. We in the Brisbane market have become heavily press driven. In this sort of environment it is sometimes difficult to pick who has the dollars and is driving demand – so let’s take a level headed big picture look and see if we can gaze beyond the hype.
A recent set of numbers shows that the Brisbane auction clearance rate is down about 50% compared to the same week last year. It has raised the eyebrows of some observers and, as stated, the recent rate rise does make the populace jumpy. our valuers have confirmed that they are seeing far less first home buyer activity across the board and that many investors are a touch toey… but it’s also fair to say Brisbane has overall had a nice steady market performance in comparison to many other capitals this year.
one big area of oversupply is the unit market on the Redcliffe Peninsula. Most of these properties were sold to out of town investors – (many still are actually and we would encourage any investors to seriously think about calling our office before they commit to a purchase) – and plenty of resale attempts are coming home to roost. Local buyers won’t touch them unless they are cheap as chips and local agents would be more than pleased to see a cashed up purchaser come through the door. The same can’t be said about mid priced property in the area where
RESI
DEN
TIA
L

��
The month in review
owner occupiers in the $500,000 to $700,000 are driving the market to perform well. The first home buyers here are generally nowhere to be seen with almost all heading to North Lakes and getting some new stock on small lots for under $330,000.
outer established suburbs such as Strathpine have also been media reactionary and agents there say that first home owners are very rare whilst investors are shy of any rate rises. Enquiry is down but the lower end properties still have a floor price that has not drifted south.
In the city, first home owners are again missing in action but there are no investors coming in to pick up the slack. The bright patch appears to be the high end stuff and according to our man on the ground, it is here that the buyer profile demonstrates how our city has come of age. In a recent example a new multi million dollar per unit project has seen just short of half the stock sold. The silver lining is that not too long ago, the buyers would have been mostly out of towners looking to relocate to the Sunshine State. Not so now as our own retirees find the dollars to lay down a couple of million on their weekday city pad with enough change left over to spend on the weekender at the coast… nice if you can get it!
The one constant is the prestige sector in the good areas within 5 km of the CBD. These buyers seem to be unaffected by rate rises and homes continue to trade well. Cheap properties sell quickly and the floor price has risen throughout the year so far. our valuer does think that there are signs this sector will slow in the medium term so vendors must be cautious not to overprice because 2nd and 3rd homebuyers will be gun-shy, but long term prospects always look good.
So compared to 2008? Well in a nutshell there are some similarities although they are somewhat reversed. It is now the first home buyers that have gone missing whilst investors are a bit slow to pick up the slack.
Finally for some tales from the road. Actual conversation:
Agent and valuer standing outside recently purchased home – sold approximately $1,600,000
Valuer: “Beautiful home… what sort of buyer did you find for this?”
Agent: “First home buyer”
Valuer: “First home buyer?!? How the hell will they get finance?!?”
Agent: “oh they should be right… they have $1,000,000 deposit…”
True story – God Bless capitalism!
Gold Coast & Tweed Coast
House/Land Estates
At the northern end of the coast, feedback from developers and real estate agents is that most sales activity in the local house and land estates i.e. Riverstone Crossing and Highland Reserve, within the past month or two has predominantly been from second homebuyers from the local area. However, there have been a small number of investors as well.
....buyers are looking for value for money with most purchasers looking for a well-presented, modern style dwelling on useable land with good landscaping....
We have seen a small flurry of sale activity from domestic investors residing in mining towns, particularly at Highland Reserve, which offers more affordable opportunities. First home buyer activity within this area has significantly decreased and even stopped in some areas. Information gathered from recent sales lists of new estates has indicated that there has been limited investment from foreign buyers also. Developers have pointed out that their target market is second home buyers with families.
Acreage Housing
Also, in Tallebudgera and Currumbin Valley prestige housing market it seems a majority of buyers are families relocating from the closer Gold Coast residential suburbs looking for space, privacy and a better family environment. Many properties in the valleys are overpriced as the odd emotional purchase does give vendors hope of a premium price. Buyers are looking for value for money with most purchasers looking for a well-presented, modern style dwelling on useable land with good landscaping in the lower $1 million price bracket. over $1.5 million, the market is thin.
Prestige Housing
Cashed up locals and interstate investors are in the box seat - whether it be a beachfront house or penthouse, riverfront mansion or country retreat. As many a high profile vendor falls over, a quiet achiever steps in for the bargain.
Most vendors of prestige property are praying for the cashed up Sydney or Melbourne buyer looking to relocate or a naïve overseas buyer to save them. In a few cases this has happened, but for the most part not. Very few sales occur at auction, although most occur in the days following as the ‘conditioned vendor’ meets the market with a thud.
New Lowrise Units
In the Robina low rise market the most active buyer of new product is still the investor, however, at quite
RESI
DEN
TIA
L

��
The month in review
reduced levels of activity. Investors require a certain return, which with higher interest rates and falling rental prices has resulted in some developments taking literally years to sell out. This has led to some developers finding themselves in ‘mortgagee in possession’ position. Buildings targeting owner-occupiers appear to have faired better, as these units are generally larger, better located and more liveable. There doesn’t appear to be a new type of buyer emerging and the level of overseas buyers in the area seems steady.
Sandrift Gold Coast
Prices of older style units in beachside suburbs such as Tugun and Broadbeach have remained relatively unchanged and in some instances have improved through the global economic crisis. More recently (in the past two to three months) local agents advise of a slow down in sales enquiry and activity for this market segment and a general decrease in investor sentiment due largely to the scaling back of the first home owner grant, the continuation of tight credit policy and increasing interest rates.
Highrise Units
Most active buyers in the highrise Broadbeach market under $500,000 are investors, in buildings such as Bel Air. over $500,000 there are limited investors and therefore the market is very slow. The market has changed since 08/08 with less investors, as a cause of continued nervousness and increasing interest rates. Also, most building managers are reporting relatively low occupancy levels which impacts on returns. The dominant buyer demographic includes owner-occupiers and interstate investors.
Q1 Gold Coast
Conclusion
There is no- urgency to buy. The Gold Coast survives off the back of tourism and development industries, each of which is having more than a bad case of the flu.
Interest rate increases aimed at slowing Sydney, Melbourne and Perth have severely dented confidence, buyer enquiry, sales activity and the economy of the Gold Coast.
Buyer sentiment seems to be ‘why buy when prices will fall’ or ‘why buy when another property becomes available next week or even next year, possibly mortgagee in possession, at greatly reduced price and improved return on outlay’.
Sunshine Coast
The residential property market on the Sunshine Coast has continued to remain patchy. Activity can vary significantly from month to month and week to week. At present agents report that there has been a significant slowdown in most sectors since the latest interest rate rise.
Certainly the most active purchasers within the current climate are owner-occupiers. Within the prestige markets, a large portion of these purchasers are moving to the coast and have the ability to manage their business interests remotely. In the middle sector of the market place, they still tend to be second and third home buyers upgrading. The first home-buyers have basically dropped out of the marketplace, given decreasing affordability and interest rate increases.
....what is common with all buyers, whether they be owner-occupiers or investors, is that they are only interested in purchasing a property at what they consider to be a ‘perceived good buy’....
With the opening up of mines and coal seam gas in the Surat Basin, a big driver in the owner occupied sector of the market is the transient workforce. Some early stats indicate that a significant portion of the Sunshine Coast workforce is now employed in the mining sector (30% to 35%). This has helped to inject some much-needed cash into the local economy.
Activity by investors on the Sunshine Coast has also dried up with the unit market remaining subdued. This is expected to continue for the foreseeable future until economic confidence and activity can improve. When this is, is anyone’s guess.
What is common with all buyers, whether they be owner-occupiers or investors, is that they are only interested in purchasing a property at what they consider to be a ‘perceived good buy’. This includes properties that have had significant reductions in list prices and/or a decline in
RESI
DEN
TIA
L

��
The month in review
values below their previous purchase prices. If this is not present then buyers can move on to the next property, as there is plenty on the market.
Southern Queensland
TooWooMBA
Generally, owner-occupiers are the most active buyer group in Toowoomba followed by local investors and non-local investors.
These owner-occupiers are looking for eastern suburb colonials, generally in areas close to the CBD, where there is limited stock. Buyers start to consider alternative localities depending upon their price range.
This buyer type has not changed during the past number of years with good steady growth generated in these eastern suburbs as a result.
overall buyer sentiment in Toowoomba is considered to be cautious with consecutive rate rises reducing activity.
The dominant buyer demographic at the moment is considered to be buyers between the ages of 30 to 50, with families, looking to upsize or relocate. Prior to the reduction of the first homebuyers grant and the GFC, the dominant buyer demographic was the 20 to 30 age group bracket. This segment generated good growth in the sub $350,000 price bracket whereas more recently we are seeing a reduction in activity from this group.
Those buyers who are more cashed up appear to be more active in the market place at present, being less susceptible to interest rate rises. In comparison, many first home-buyers are progressively finding it harder to enter the market.
Agents are reporting a lift in activity in the western suburbs for both rentals and buyers looking for new four-bedroom two-bathroom brick homes. This could indicate a number of interesting factors coming to fruition, including a lack of affordable housing and an increase in wages for blue-collar workers. This could be a result of the mining and energy industry either paying more for
qualified workers or local employers having to pay more to keep employers from the mining and energy industry poaching their employees.
Inter and intra state investors are not a dominant buyer group here locally in Toowoomba but make up a large share of the property transactions in towns such as Dalby and Chinchilla, which are heavily influenced by the mining and energy sectors.
Some developers are focussing their end product on the investor segment, building on ground slab constructed dwellings. Local buyers prefer pier and beam-constructed homes due to the volatile soil types. Investors looking to buy an investment property are getting more bang for their buck with an on ground slab constructed home where the tenant is happy in either construction type.
WARWICK/STANTHoRPE
Buyer sentiment in residential property on the Southern Darling Downs is generally cautious with investors adopting a ‘wait and see’ attitude to the property market and availability of credit.
In Warwick, residential property priced at less than $250,000 is in demand and generally short supply, supporting short selling periods but having only moderate levels of capital growth. At present this market sector is considered to be the most buoyant. Buyers in this market sector are predominantly first home buyers with demand from investors shrinking in recent months.
Residential property in excess of $350,000 in Warwick is experiencing extended selling periods and limited demand. At this stage vendors are not reducing prices and regression in values is not evident. However, continued increases in interest rates will create pressure in this sector and may result in a regression in value. In the longer term, should market conditions stabilise and interest rates plateau, a return of confidence is likely in this sector and disposal rates are likely to increase. Limited capital growth in the near term is expected for this sector.
....at present this market sector is considered to be the most buoyant....
Vacant land in Warwick is still showing signs of steady capital growth at limited rates. Supply is at levels to meet demand but available land, yet to be released, has the potential to out strip supply and result in negative pressure on values. Current activity in the land market indicates purchasers are opting to build rather than purchase existing stock.
An increasing level of investor activity is occurring in newly developed estates with investors purchasing house and land packages for the rental market. Activity levels in this market have the potential to result in an oversupply to the rental market for properties in the $300 to $350 per week range. Rentals at the lower end of $200 to $250 per week range are limited at present with investment in this rental market representing a better option for rental demand.
Rural lifestyle property on the Southern Darling Downs is displaying limited activity, with property in excess of
RESI
DEN
TIA
L

��
The month in review
$500,000 experiencing limited demand. Factors affecting this market sector at present include the price of fuel, availability of credit for this asset class and generally high capital value of properties. Proximity to a township and work place are becoming increasingly more prevalent determining factors in this sector with the increasing cost of fuel adding to the cost of the ‘lifestyle choice’. Lenders are in general shying away from this asset class with the majority of lenders requiring a deposit/equity in excess of what would be required for a residential property in a township. Investment in this asset class during the past five years has seen substantial dwellings constructed or renovated on rural lifestyle blocks, resulting in a limited pool of purchasers for this type of property.
IPSWICH
The residential market in Ipswich is favouring buyers and prices have eased over the previous three months. The greatest movement is in the lower end of the market under $325,000. The limited activity from investors and first home-buyers in the lower sector has had significant impact.
Buyers at present have a larger array of choice in the market and properties that lack in presentation or require maintenance are selling at reduced prices and stay longer on the market. Properties in more sought after suburbs that have been well maintained have not been affected and are achieving good prices, which indicates that owner-occupiers are driving the majority of activity. Buyers have great bargaining power at present, however we recommend that they research the market thoroughly before purchasing.
Central Queensland
RoCKHAMPToN
The Global Financial Crisis during 2007-2008 had a major effect on the Rockhampton and surrounding economy. Property values declined and the volume of sales also reduced during this period. Federal and State Government incentives and lower interest rates helped to stabilise the market during late 2008 and through 2009, with first homebuyers dominating the market.
The Federal Government First Home owners Boost ceased to exist as of January 1, 2010. Early indications suggest that this factor, in conjunction with the Reserve Bank increasing interest rates in late 2009 and early 2010, has led to a decline in the volume of sales throughout the beginning of this year.
on a more positive note, confidence in the nearby Bowen Basin mining industry is still considered to be strong and rental property vacancy rates have remained steady at low levels. These factors appear to have encouraged investors back into the residential market. We are seeing a boost in buyers’ interest in the developing stage of a residential estate in north Rockhampton, and an associated increase in building activity during the past few months.
....federal and State Government incentives and lower interest rates helped to stabilise the market during late 2008 and through 2009, with first homebuyers dominating the market....
Residential sale volumes of established homes are still declining with a large number of properties listed for sale. Some prices are becoming more realistic to achieve a sale. We note that a number of existing home-owners are taking the opportunity to upgrade if a bargain is evident. They then must make the decision to sell or rent their original home. With the existence of low rental vacancy rates, renting out the home now with the possibility of capital growth over coming years is an avenue some are considering.
Ann increase in supply of prestige units on the Capricorn Coast has also generated interest over recent months. A number of buyers still have the confidence to spend, as we are aware of a number of prestige units selling in the range of $1.5 million to $2.5 million. one of these sales included a marina berth.
BUNDABERG
First home-buyers have all but disappeared from the market. This has been caused by the easing of the first home-buyers grant and the rise in interest rates. Investors however appear to be re-entering the market and homebuyers looking to upgrade have also become more active. Volumes however remain low. April in particular appears to have been a very slow month in Bundaberg.
Bundaberg is in the fortunate position of having the most affordable houses in Queensland and a strong rental market which all makes for a good return on investment.
opportunities for developers in the current market are limited with the market being static. Property values are holding, however there are good value properties available to be purchased.
There are less out–of-town developers active in the market. Developments are now mostly being completed by established local property developers. The government injection of funds for affordable housing is also keeping some local builders/developers busy building units.
The high-rise coastal unit development market has been affected by anoversupply and softening of sale prices
RESI
DEN
TIA
L

��
The month in review
originating from the boom time in 2003 to 2008. With the market originally strongly supported by out-of-town purchasers, there has been a trend back to local purchasers for both occupation and investment.
HERVEY BAY
Hervey Bay currently has a substantial quantity of residential housing stock on the market. Agents have reported properties in the sub $300,000 range to be the most difficult to sell at the moment, due largely to decreased demand in this sector. Competition between older homes in superior locations, and newer homes in inferior areas, present a varied choice for prospective buyers with individual preferences.
A large proportion of Hervey Bay buyers have been reportedly consisting of cashed up retirees looking to purchase low maintenance property in the $450,000-plus range. These ‘sea change’ buyers are moving to the region from the capital cities, including Perth, Melbourne and Brisbane. There have also been a few smaller unit sales in the $200,000 range with investors taking advantage of purchasing through Self Managed Superannuation Funds.
First homebuyers are now scarce, with interest rates playing a big role in the current economic environment, as well as tightened lending conditions. one agent recounted burning a lot of fuel for little or no consequent result, reinforcing the fact that buyers are carefully assessing all options available before making a commitment. Many prospective buyers also have to sell their property first before they can purchase another property.
....a large proportion of Hervey Bay buyers have been reportedly consisting of cashed up retirees looking to purchase low maintenance property in the $450,000-plus range....
one real estate agency in the Dundowran Beach region noted that most of their sales lately have occurred from large vacant land home sites of approximately 2000sqm. Land sales have been achieving a sale price between $170,000 and $208,000. The buyer profile consists of young families looking to build in the near future.
River Heads Property Sales have reportedly had a bumper month, reaching $2 million in sales. Demand appears to be drawing from large cities once again, including Darwin, Sydney and Brisbane. one of these sales was a prestige property with sweeping river/ocean/island views, accomplishing a $990,000 price tag.
MACKAY
The Mackay market at the present is fairly static. As stated in previous editions, the market has been fuelled by the fortunes associated with the Bowen Basin coal industry, to the point where the median value is one of the highest in regional Queensland. Since the reduction in first home-owner’s incentives, and rising interest rates, the market across the board appears to have slowed. Agents currently report a easing in sales volumes across all market sectors.
Due to these high house prices, Mackay has a real affordability issue with low and middle-income earners trying to enter the market. To try and alleviate this, the Queensland Government and Mackay Regional Council have recently announced an Urban Development Area in Andergrove. The 22ha former council depot will be developed into around 180 homes on lots ranging from 250sqm to 640sqm. This community will include stand-alone homes, town houses and duplexes. It is expected that two thirds of the lots created will be sold below the median house value.
GLADSToNE
The Gladstone residential market has slowed since the historical highs of 2006/2007. The median price in the first quarter of 2009 was $362,500, with a total of 234 house sales. The median price in the 1st quarter of 2010 was $390,000, with a total of 102 sales, showing a sharp decrease in the number of sales in the quarter, however with a slight increase in the median price. Residential vacancies are 3% to 4%, with some agents reporting very recent lows of 1.5%, mainly due to the influx of people with regards to the multi-billion dollar Gladstone LNG developments.
There do seem to be an increased number of non-local buyers, and a number of these seem to be investors, particularly with regard to new dwellings being built. It would appear that these are destined for the rental market, what with the expected increase in population with the LNG work in the medium to long term.
The recent proposal by the Federal Government for the introduction of a resource unit tax could however adversely affect further investment in LNG and coal mining, both of which are important to the Gladstone City economy. This could flow on to the Gladstone real estate market in the form of reduced demand for housing. The final nature and effect of the tax is not known and will not be for some time.
Cairns
The Cairns residential property market is experiencing slow demand at present, as the economy experiences a slow recovery from the economic downturn. Agents are reporting a distinct shortage of potential buyers for houses in market segments under $350,000 and for sub-$250,000 units, due to the absence of first home buyers. Investor activity in the Cairns market is also slow, as the
RESI
DEN
TIA
L

�0
The month in review
perceived potential for (quick) capital gains in the Cairns market has evaporated. Higher priced properties on the market, which largely appeal to local buyers, are said to be attracting plenty of interest and getting plenty of lookers, but at present there are few takers.
The slowness of the market complicates analysis of buyer profiles. The proportion of property sales taken up by buyers from out-of-town has changed from 2008 when 13% of houses and 73% of new units were sold to out-of-town buyers. Thus far during 2010, around 18% of house sales, and about 60% of new apartment sales, have been to out-of-town buyers.
Tourist apartments, which are primarily investor stock, are also proving difficult to move in the current market environment. A number of tourist apartments in the Cairns CBD have been taken off the market or are being only passively marketed, whilst for others prices have been reduced by up to 30% in order to attract buyers.
Townsville
The residential property market in Townsville is starting to see a return of investors across some sectors, as confidence and general buyer sentiment continues to stabilise.
The sub $400,000 established residential house market was predominately driven by first home-buyers during the first half of 2009. This market saw strong competition for product, placing some upward pressure on value levels. We are now seeing some examples of first home-buyers experiencing the effects of continual interest rate rises, and now needing to exit the market. Many are finding that they can’t afford to sell, but can’t afford to keep the property either as they struggle to cover their current level of debt. This sector is not as hot as it was during the first half of 2009 with value levels now stabilised. The current buyer profile in this area is cashed up investors and renovators looking for bargains.
The $500,000 plus market is predominately being driven by the upgraders or second/third home-buyers. These buyers appear well informed and are willing to shop around to find the product that best suits their needs. Activity within this market has increased since the earlier half of 2009 as confidence continues to improve.
The inner city unit market appears to be attracting a mix of investor and owner-occupier demand. The sub $500,000 product was the predominant mover throughout 2009 with our inner city Unit Survey revealing that over 70% of all new unit sales within the inner city were for units priced under $500,000. During the March 2010 quarter this revealed a slight shift with the under $500,000 price bracket accounting for 60%. Sale volumes are still low, with our unit survey revealing movement of just 13 units for the March 2010 quarter.
our graph showing the proportion of buyers from outside of Townsville indicates that the proportion of unit buyers from ‘out of town’ has declined over the 2008/2009 period, whilst the proportion for houses has increased over the 2008/2009 period. This decrease in ‘out of town’ buyers in the unit market could be attributed to compositional changes in buyer, whilst the increased level of activity in the housing sector by ‘out of town’ buyers indicates the growing level of confidence in our local market.
Tasmania
HoBART
The CBD/inner/near city is still in demand for both investors and owner-occupiers. The mix of properties in this locale ranges from unit development to more traditional older style accommodation. The inner/near city dwellings, such as in the suburbs of Battery Point, Sandy Bay, North Hobart and West Hobart have seen a slowing in the market somewhat, from where it was positioned say a year to eighteen months ago. Despite this, the area still remains the pick of the crop within Hobart. The buyer profile still remains as diverse as do the values but the profile of these buyers has not changed in recent times. The inner city still has a higher proportion of owner-occupiers. This is of course due to amenities provided and proximity to the workplace.
....the inner/near city dwellings, such as in the suburbs of Battery Point, Sandy Bay, North Hobart and West Hobart have seen a slowing in the market somewhat....
Focusing on established areas within the mortgage belt, suburbs such as Kingston and Blackmans Bay in the south and Moonah and Glenorchy in the north, the majority of purchasers are still owner occupiers, however there seems
RESI
DEN
TIA
L

�1
The month in review
to be a small but growing proportion of investors buying in these areas. Buyers range from first home-buyers to families looking to upgrade, to investors. Managing real estate agents are reporting strong demand in these locations with a shortage of clean and reasonable stock.
The outer lying rural residential areas are seeing a slow number of transactions recorded. The buyer profile here is generally for owner-occupiers, however many mainland investors are purchasing in these areas for the affordable lifestyle characteristics on offer. Several local investors are still searching for their ‘shack’, however with prices still relatively firm, the reality of finding that cheap investment or holiday home may simply be a pipe dream.
It is interesting to note that the feedback from local real estate agents is that investors have become less active in the market in recent months. This may be due to the increasing interest rate environment, coupled with only fair returns the residential market is offering. This may see investors keep away from the market even more so if interest rates increase in coming months.
LAUNCESToN
We have seen a significant change in the buyer profile for the northern region of the state.
The mining expansion of the west coast resulted in many families buying in Burnie so that the children could attend these schools. The working partner commuted to the mine and stayed in more basic rented/mine accommodation during their shift as opposed to the family living permanently in these more remote locales. This has now withdrawn from the market.
The mainland speculator has also appeared to withdraw from the market, especially from the Tamar Valley surrounding George Town and the proposed pulp mill site.
Launceston has seen a reduction in the percentage of first home-buyers in the market. This may be a result of the inflated previous grant ‘pushing forward’ buyers into the market, who otherwise may not have been ready to participate. We are seeing however a return (albeit cautious) of investors who, despite a rising interest rate environment are encouraged by housing stress pressures/low vacancies and rising rental levels.
That said, the ‘middle market’ continues to soften - extended days on market and in suburbs like ‘Richings’ we continue to see an over supplied market.
Darwin
The question ‘who are the buyers’ within our residential markets continues, largely to be governed by a number of government policies dealing with but not exclusively:
En globo land releases.
Affordable housing initiatives.
Tax cuts and concessions to support home ownership as announced within the 2010 NT Budget.
To understand, who are the buyers and how they are affected by current government policies, and other factors affecting demand and supply (including interest rates and the cost of building construction) within our various residential sub markets it must be understood what state our market is currently in.
....another buyer segment active within the market includes those purchasing established apartments within Palmerston....
With broad brushstrokes, some points about Darwin, Palmerston and Darwin rural locations:
• Sales transactions across all sub markets have decreased, some by up to 40%.
• Despite decreased market transactions, all residential sub markets experienced capital growth between 8% and 25%.
• Rental vacancy rates have softened slightly but remain under 2.5%, whilst yields have slightly tightened.
• Limited vacant land availability underpins steady capital growth across each of our major residential locations.
Given the above, buyers we see as active within our markets include:
• First and second home-buyers purchasing vacant land within new land releases of Bellamack. Already some 200 lots have been sold with a total of 678 lots to be released. These buyers have been buoyed by recent government initiatives that address stamp duty concessions and purchase price caps for Homestart NT. Beyond this initial land release will then be the suburbs of Johnston and Zuccoli. These further land releases will include medium density developments, which are currently undergoing tendering by the NT Government. overarching this will be the inclusion of 15% of future land releases for affordable housing.
• Another buyer segment active within the market includes those purchasing established apartments within Palmerston, which are priced between $350,000 and $500,000. To date in 2010, we note, that within this sub market, approximately 75% of all apartment sales are occurring within this price bracket. No doubt we will see continuing strong demand levels due to the adjustment of the Homestart NT price cap (from
•
•
• RESI
DEN
TIA
L

��
The month in review
$420,000 to $475,000) and stamp duty concessions introduced in the recent 2010 NT Budget.
• Developers within the Darwin CBD have recently had ‘the dust settle’ with regards to planning laws governing building setbacks and volumetric controls. With limited vacant land parcels on offer, our office has noticed increased activity by developers to now (a) attempt to land bank potential development sites (b) resubmit DAs to address new planning requirements or on sell the site, or (c) are resubmitting DAs for developments which previously had a heavy weighting of three-bedroom apartments. In doing so we see developers addressing the current oversupply of executive style apartments or apartments priced above $700,000 within the CBD and surrounding inner Darwin suburbs. Such reconfigured larger developments we are aware of include ‘Wharf 2’ at the Darwin Waterfront which has seen strong buyer demand for one and two-bedroom stock released to market to date; and ‘The Avenue’ which has approximately 10% of its 139 apartments within its mixed commercial/residential development configured as three-bedroom apartments. Although the developers in this case, after conducting market research, went to market with this configuration. This resulted in strong buyer demand for the one and two-bedroom stock, especially within the $300,000 to $600,000 price bracket.
And as we indicated two years ago, the burgeoning gas exploration occurring within the seas off the NT and WA will continue to be one of the main drivers of the NT economy. The potential $12 billion INPEX LNG investment decision was recently delayed until 2011, which has caused concerns to some prospective purchasers. Whilst the NT economy remains strong, buoyed by continuing strong retail trade turnover and employment growth, and underpinned by positive population growth, the INPEX investment announcement does appears to be creating a holding pattern for local investment. In light of this there will be buyers in the market looking for the opportunities that result when sellers are unsure of future macro market directions.
Perth
The past 12 months have seen a significant change in buyer profiles throughout the Perth metropolitan area, and a mixed bag of activity through each sector. Let’s
follow the theme from 12 months ago and work from the CBD outwards and see what changes have occurred.
The CBD apartment market remains static. Considerable supply is available with more under construction. Whilst there was some speculator interest 12 months ago, this interest has waned and will more than likely continue to do so as interest rates rise.
The inner belt of suburbia was one of the first markets to recover after the lull of 2008/2009. Young professionals flocked to trendy suburbs such as Leederville and Mount Hawthorn, while Mums and Dads took the opportunity to downsize into premium locations such as South Perth, Victoria Park and Como. The initial demand created a shortage of properties, with multiple competing offers driving values up.
Turnover of properties within prestige locations such as Applecross, the western suburbs and the coastal strip remains low, although there has been some price growth due to a lack of supply. It is yet to be seen whether the increase in activity in other sectors will have a ripple effect and kick start the prestige market. There are certainly many areas where values remain below the peak of 2006-2007.
With the first home owners grant in full swing 12 months ago, there was a perfect opportunity for buyers to trade up into more desired suburbs. This has stripped supply from the market and led to positive growth in many sought after areas. These markets quickly returned to almost overheated conditions, and created a flow on effect to the neighbouring suburbs. In some cases, the price paid for properties was hard to justify with sales from the previous quarter – as they were now out of touch with the market.
once the First Home owners Boost disappeared, the focus for this sector returned to location, rather than the dream of a large, new house. Previously undesired suburbs such as Coolbellup benefit from a good location, larger style lots and dated small dwellings ripe for renovation or redevelopment.
....young professionals flocked to trendy suburbs such as Leederville and Mount Hawthorn, while Mums and Dads took the opportunity to downsize into premium locations such as South Perth, Victoria Park and Como....
Newly developing suburbs are witnessing a variety of results. Well-presented developments with good-sized lots are commanding a solid premium, whilst inferior estates are struggling to a certain extent. The buyer profile mainly comprises of people who are returning to ‘new home’ living now that their existing dwelling has dated, with many relocating to adjacent suburbs.
Further out in the urban fringe, first home-buyer activity has retracted considerably and growth is currently static. There are serious supply issues in some areas and limited growth prospects in the short term.
Generally, properties that are reasonably located and well presented are commanding and achieving premium sale
RESI
DEN
TIA
L

��
The month in review
prices. Some areas have overheated as high confidence buyers return to the market and stock levels have returned to more normal levels, although we note that according to REIWA, listings jumped by 20% in the first quarter.
Its worth noting that recent interest rate rises combined with the Federal Governments proposed super tax on resource companies has had a profound effect on investor confidence in WA. Recent discussions with real estate agents reveal that home open attendance numbers have noticeably eased in recent weeks which may signify a softening of activity/values in the short to medium term. Numerous multi- billion-dollar projects have reportedly been shelved for the time being and we nervously wait to see how the proposed tax will play out.
South Western WA
What is happening in the markets of the southwest of Western Australia? This seems to be the question of the hour. on the face of it, everything appears to be on the up and up with the median house price rising steadily, particularly since December. There was a flurry of sales activity as 2009 came to a close, with discussion about a new boom and the hope that it wouldn’t distort the market again.
(See Sales & Growth Chart below)
It seemed that normality had returned, but it is worth looking a little closer at what is happening behind the numbers. The most obvious thing is the first homebuyers’ market came to a rapid and abrupt halt at the end of the government boost, leaving the market almost entirely to investors and buyers moving up the scale. Inevitably this class of buyer are purchasing higher valued properties, and with no first homebuyers at the bottom of the market, the effect is an increase in the median house price (that often quoted headline given as proof of a rising market).
Initially this was a reasonable reading of the situation, as with the low interest rates, confidence returning to the job market, a recovering world economy and large infrastructure projects on the go both locally and state wide, purchasers returned to the market in substantial numbers and properties that had been on the market for up to two years sold, if at a discount to the peak of the market.
In the past couple of months however, the number of sales has been on a downward trend (see Sales & Growth chart)
and anecdotally there seems to be a direct correlation between the Reserve Bank interest rate rises and the number of purchasers in the market. As valuers, we tend to see our work flowing approximately a month behind the sales in the market. The past couple of months have seen two steady weeks and two quiet weeks, with sales slowing considerably for two weeks after a rates rise and then returning after a period of re-evaluation.
As we have been told repeatedly, interest rates are only now at average levels, however the cumulative weight of so many rises over a relatively short period of time seems to have had had a significant negative effect on sentiment and confidence. It appears to be ‘rate rises by water torture’, i.e. one drip at a time, but combining to slow the market more than would be expected. Given that the rates, in historical terms, are only at moderate levels, an outside observer - looking in with no background information - may wonder what is causing the uncertainty?
....as valuers, we tend to see our work flowing approximately a month behind the sales in the market....
So how does this set of situations affect the buyers in the market? The trend appears to be fairly consistent across all value ranges with a steady volume of buyers looking to move to the next level, or purchase the next investment property, albeit in a fairly cautious manner and only after a thorough investigation of the market. There are still bargain hunters waiting for a great buy. The investors are somewhat ambivalent as the rental returns are on the increase and looking like getting back to the old standard of $1 of rent per week for every $1000 of purchase price, e.g. a $300,000 house renting for $300 per week. This is better than it has been but the down side is that capital gains have been limited and so the overall return has not been great. Investment decisions are not made lightly as a consequence.
other buyers have remained largely the same as in previous years, with migration from both overseas and interstate bringing a steady stream of new buyers and renters to the area. This is likely to be the most important driver of the market over the long term. With a possible shortage of land looming and continued rapid population growth, supply and demand may well drive prices up in spite of all the uncertainty. But, for now, it appears as though many people are prepared to sit and wait for that special property that is just right to come along, before being prepared to commit to a purchase which may well be a wise thing to do for now.
RESI
DEN
TIA
L

��
The month in review
CoN
TAC
TS
Office Phone Email
Abu Dhabi, UAE +971 02 4173581 [email protected], SA 08 8231 6818 [email protected]/Wodonga, NSW/VIC 02 6041 1333 [email protected] Bairnsdale, VIC 03 5152 6909 [email protected], NSW 02 6334 4650 [email protected] Bendigo, VIC 03 5480 2601 [email protected] Commercial, QLD 07 3002 0900 [email protected] Brisbane Residential offices, QLD 07 3353 7500 [email protected] Brisbane – Rural Queensland, QLD 0417 753 446 [email protected], WA 08 9791 6204 [email protected]/Wide Bay, QLD 07 4154 3355 [email protected] Busselton, WA 08 9754 2982 [email protected], QLD 07 4057 0200 [email protected] Canberra, ACT 02 6273 9888 [email protected] Darwin, NT 08 8941 4833 [email protected] Deniliquin, NSW 03 5881 4947 [email protected], NSW 02 6884 2999 [email protected] Echuca, NSW 03 5480 2601 [email protected], QLD 07 4980 7738 [email protected] Gladstone, QLD 07 4972 3833 [email protected] Gold Coast, QLD 07 5584 1600 [email protected] Goondiwindi, QLD 07 4671 5300 [email protected] Gosford, NSW 1300 489 825 [email protected] Griffith, NSW 02 6964 4222 [email protected] Bay, QLD 07 4124 0047 [email protected], TAS 03 6244 6795 [email protected], QLD 07 3282 9522 [email protected] Launceston, TAS 03 6334 4997 [email protected], NSW 02 6953 8007 [email protected], QLD 07 4957 7348 [email protected] Melbourne, VIC 03 9642 2000 [email protected] Mildura, VIC 03 5021 0455 [email protected], NSW 02 6372 7733 [email protected] Newcastle, NSW 02 4929 3800 [email protected], NSW 02 8882 7100 [email protected], WA 08 9388 9288 [email protected] Port Macquarie, NSW 1300 489 825 [email protected], QLD 07 4927 4655 [email protected] Roma, QLD 07 4622 6200 [email protected] Sale, VIC 03 5143 1880 [email protected] Highlands 02 4221 0205 [email protected] Coast (Mooloolaba), QLD 07 5444 7277 [email protected] Sydney, NSW 02 9221 8911 [email protected] Tamworth, NSW 02 6766 9898 [email protected] Toowoomba, QLD 07 4639 7600 [email protected] Townsville, QLD 07 4724 2000 [email protected] Tralagon, VIC 03 5176 4300 [email protected] Heads, NSW 07 5523 2211 [email protected] Wagga Wagga, NSW 02 6921 9303 [email protected], QLD 07 4948 2157 [email protected], NSW 02 4221 0205 [email protected], NSW 02 6382 5921 [email protected]
Visit us at www.htw.com.au for past issues of this publication
Contacts
The information contained in this report is provided in good faith and has been derived from sources believed to be reliable and accurate. However, the report is not intended to be comprehensive or render advice and neither Herron Todd White nor any persons involved in the preparation of this report, accepts any form of liability for its contents.
This report is Copyright, and cannot be reproduced without written permission of Herron Todd White.
© Herron Todd White Copyright 2010

��
The month in review
quality) reselling at values close to 2007/08 peak levels. In most cases it is only those vendors that ‘must sell’ and who are prepared to ‘meet the market’, that are achieving a sale result. In the meantime, many just ‘hang in there’, hoping that in time the market improves. If a sufficient volume of these sales occurs during the next six to 12 months, it is those sales/values that will greatly influence the new value benchmarks. At the same time, due to the restricted supply and usually lower dependency on debt finance, the very top end of the market for larger scale enterprises, is expected to be largely insulated from the downward value pressures faced by many smaller less viable enterprises.
As always in agriculture, there remain new challenges and opportunities resulting from external factors. For example, the Australian beef industry may benefit from the recent foot and mouth episode in Japan, whilst our live cattle export sector is facing considerable uncertainty following Indonesia’s review of import permits. It is too early to say what impacts will flow from either of these events.
Robin Gardiner Ph: (02) 6766 9898
1 June 2010
NoRTHERN NSW
Whilst some parts of the North West have experienced a reasonably good autumn, there are many parts which are dire and in poor shape heading into winter. The first few frosts on the slopes and tablelands have certainly taken their toll. The last reasonable fall of around 20mm on Anzac Day, for those that got it, seems a long time ago. Let’s hope that the forecast of a wet winter eventuates.
Whilst southern Queensland and the west of NSW benefited greatly from the tremendous rainfall earlier in the year, unfortunately the water storages in the northwest of NSW did not benefit greatly. The following current water storage levels of our major irrigation dams tell the story:
Looking back, this time 12 months ago in our Rural Month In Review I wrote the following:
“Most of our offices around Australia generally report a ‘subdued’ market for rural property and this appears likely to continue in the months ahead. A strengthening Aussie Dollar, a softening of many rural commodity prices, tighter credit, variable seasons (from drought to floods), changing government policy (e.g. vegetation law in QLD and the recent budget federally) together with the well publicised problems in the rural MIS sector and of course the multi layered impact of the global financial crisis, are all combining to dampen investor confidence”.
Twelve months later, while not all of the above market factors have remained in play, many have. The rural property market remains very subdued in most regions; the impact of the GFC (and now the Euro debt crisis) is still washing through the rural economy; government policy remains quite ‘fluid’; a Federal Election is due; and the fallout of the collapse of the MIS sector is still being felt. In the meantime the Aussie Dollar has peaked at US94c and has recently fallen sharply to about US83c, and equity markets around the world are reflecting considerable investor uncertainty. There is no doubt that finance to purchase rural property has become even more difficult to obtain (at higher interest rates), and small to medium investor confidence remains fragile.
In most sectors of the rural property market there is uncertainty as to the direction of property values, which results in buyers being even more inclined to ‘sit on their hands’. Rebounding cotton, beef and milk prices, together with very strong lamb and sheep prices and a depreciating Aussie Dollar, have given some real hope that investor confidence levels may ultimately recover. However there is usually an extended time lag between significant movements in commodity prices and movements in property values.
Whilst there are isolated, but increasing instances of properties reselling at 20% to 50% below 2007/08 sale prices, there are other examples of properties (usually top
Rural – Market Directions
RURA
L

��
The month in review
Chaffey Dam (Tamworth): 86% (53GL)
Copeton Dam (Inverell); 6.2% (102GL)
Keepit Dam (Gunnedah): 26.1% (116GL)
Pindari Dam (Ashford): 22.7% (74GL)
Split Rock Dam (Manilla): 2.7% (14GL)
Between them, the above five public dams which serve the Namoi, Gwydir and Peel Valleys, currently hold only about 359GL in storage or 12% of their storage capacity.
The ‘Water Sharing Plan for the Peel Valley Regulated, Unregulated, Alluvial and Fractured Rock Water Sources 2010’ was gazetted by the NSW Government in April and comes into affect in July 2010. The full impact of the new Water Sharing Plan is yet to be full analysed by the marketplace/licence holders. We will provide our observations in a later report.
The cotton harvest for the Namoi Valley is nearing completion with around 350,000 bales expected to be picked with a total gross value of in excess of $165 million. Strengthening cotton prices, if sustained, and a lower Australian Dollar are likely to increase the demand for irrigated cotton country, particularly land with secure underground irrigation water entitlements.
It is indeed a difficult time to be valuing rural properties, with a scarcity of sales and very mixed results. Whilst several recent auctions have resulted in no bids and little buyer interest, two auctions in April did give some market direction, for better quality property at least. These include:
Colly Plains North, near Quirindi on the edge of the Liverpool Plains sold at auction for $6 million. This 1548ha first class mixed farming property last sold in June 2006 for about $5.1 million (bare of plant and equipment). After allowing for considerable expenditure carried out by the vendors, the most recent sale indicates a holding/firming of values. With reportedly two of the bidders having been sellers of their properties to the coal mine sector at inflated prices, one wonders if this strong sale price would have been obtained without that positive influence.* Mount Mill, near Coolah sold just after auction for slightly higher than the highest bid of $3.1 million. This is a good quality 1245ha basalt mixed farming/cattle property which last sold in January 2007 for $3.5 million, suggesting a reduction in value of around 10% over the three-year period.
Contact:
Robin Gardiner Ph: (02) 6766 9898
SoUTHERN NSW
ALBURY
The late summer/early autumn rains have provided the best start to the season for many years. This has injected early confidence into the livestock markets and buoyed expectations of better yields from cereal crops than has been achieved for a long time. However, this early start
is reliant on good follow up rains, and so far those rains have been very patchy. Most areas in southern NSW and northern Victoria have received little rain, and cereals that have been planted are now looking for a serious drink in many areas. The Upper Murray (not a significant cereal growing area) is faring much better and has continued to receive regular rainfall. These areas are looking the best they have for many years.
....demand for rural lifestyle properties remains strong for properties that are located close to the major centres....
The rural property market in southern NSW and northern Victoria is proving to be challenging due to a number of factors including the current high value of the $AU, the GFC and the world wide glut of cereal grains, particularly wheat. It is anticipated that rural property values in lower rainfall country will, at best, remain static in the short to medium term, but values in the higher rainfall country may increase in the medium to long term due to very strong lamb and mutton prices. More recently, cattle prices have improved and this may add further strength to the value of higher rainfall country. In addition, dairy is now on the recovery trail and this will further underpin property values in the more sought after higher rainfall areas.
other than the Four Arrows properties that have recently sold there have been few large holdings placed on the market. There have been a reasonable number of smaller properties offered for sale in this area, with mixed responses. Responses vary from being withdrawn from auction just prior due to lack of interest from potential purchasers, to selling prior to auction, and everything between these two extremes. Those properties that have sold have transacted at prices equivalent to the strong prices achieved in the past, with no signs of prices dipping.
Demand for rural lifestyle properties remains strong for properties that are located close to the major centres and these types of properties have increased in value during the past six months or so. Values for rural lifestyle properties located further from major centres have remained static and in some cases have been dropping.
Many areas of southern NSW and northern Victoria are at a fork in the road - if we get follow up rain fairly soon we may see the season develop into the best we have seen for a long time. But if the follow up rains do not arrive soon it may turn into the same story that we have experienced in the past six or eight years - a start but then the season peters out.
RURA
L

��
The month in review
RURA
L
WAGGA WAGGA
More rain is needed in all areas surrounding Wagga Wagga at the moment. Some rain was received over the Anzac Day long weekend but we have not received much since. A number of sales have occurred in the past few months in areas surrounding Wagga Wagga like Bethungra, Tumut, Tumbarumba, Coolamon and Borambola. This shows that properties in tightly held areas and properties that are priced realistically are still selling, while values are generally remaining static.
LEEToN
The markets have remained subdued with little follow up rain since good rains in early autumn. It is definitely a buyer’s market at present with a wide selection of property types being offered throughout the Riverina and MIA. Continued uncertainty over Federal Government moves to further restrict water licences through the Murray Darling Basin has created a reserved attitude among any prospective buyers looking at irrigated holdings.
The downturn in the wine industry caused by a worldwide oversupply has seen a lot of local vineyards listed. officially none have sold at this time but within the wider region analysis of sales of larger holdings greater than 100ha planted indicates properties have sold for near to bare land value.
Looking back at my column a year ago I noted a number of large Riverina properties listed including Tubbo Station Narrandera, Toronga Station Hay and Dellapool Narrandera. As many readers will already know, both Tubbo and Toronga have now sold, although Dellapool remains listed for sale. Local buyers purchased both sold properties and it is a positive indicator for large grazing properties in the Riverina in general.
....the downturn in the wine industry caused by a worldwide oversupply has seen a lot of local vineyards listed....
There have been a number of Mortgagee in Possession auctions during the past month. These properties, mainly dryland cropping and grazing, have been passed in. While the banks are keen to dispose of many of these properties and there are interested purchasers, unfortunately, with ongoing dry conditions, low levels of buyer equity and tightened finance conditions for rural lending no one has the cash to splash.
So what are my predictions for the next six months you ask?
Unless there is a significant turnaround in seasonal conditions in the next six weeks I expect we will continue as we are until early 2011. Dryland cropping properties will remain on the market unsold. If there is a break and things start to look good come spring we will see more listings come on in the hope the seasonal conditions will be enough to tempt buyers in coming out from their slumber.
Demand for grazing properties with decent stock facilities and access to stock water will remain steady and may improve in the latter part of the year given the outlook
that demand for meat products will continue to outstrip supply.
Large viticulture properties will be the hardest hit in the global grape glut. As we are seeing, the current trend of pushing out these large areas and returning them to grazing, I believe will continue. Investors will be looking for answers as to why their ‘too good to be true’ tax dodge investments are falling over and not offering any returns.
Contact:
David Shuter Ph: (02) 6041 1333
Regional Vic
ECHUCA
As always, local dryland farmers are waiting for a genuine ‘autumn break’ to start the cropping season off in earnest. Increases to the irrigation season and forecasts for improvements in the milk price for the coming season saw larger numbers of irrigators start up annual pastures at the end of the irrigation season. Sales activity has been relatively steady on the land front though there has been some movement of smaller irrigation properties to district farmers where they dovetail into existing operations. Results from Round Two of the Federal Government’s water tender are summarised below (Source: National Water Lodgement Service).
Area Class Average $
Vic
Goulburn High Reliability $1953
Murray Below Choke High Reliability $1954
Murray Above Choke High Reliability $1700
NSW
Lower Darling General Security $949
Murrumbidgee General Security $864
Murray Below Choke General Security $926
Murray Below Choke High Security $2050
Murray Above Choke General Security $796
SA
Murray River High Reliability $1928
Contact:
David Leeds Ph: (03) 5480 2601

��
The month in review
MILDURA
The good rainfall recorded in March and April has not been followed up with any significant falls since, however the cooler weather and frosty mornings have had an impact on the locust plague which now appears to have passed (until spring at least). This has resulted in dryland farmers working around the clock to sow their winter crops. With June fast approaching it is becoming quite critical to have crops sown with the hope that forecast rains eventuate.
The sheep, lamb and mutton market remains very strong in the area with recent sales in ouyen providing more record prices. The latest sale saw pens of five to six year old merino wethers being sold for around $150 per head, which had some of the old timers shaking their heads in disbelief.
on a negative note was the recent collapse of the table grape and citrus exporting company ‘Jakfruit’, which has gone into voluntary administration with reported debts of $10 million. Whilst the company also operates out of New Zealand, the 100 or so local Sunraysia growers are reported to have been caught out with unpaid fruit delivered and exported by Jakfruit.
The citrus harvest has commenced with reports of early navel varieties being of good size and quality and receiving good prices, noting however that yields are also reported to be down.
Following on from last month’s report, the wine grape industry remains in the doldrums with recent reports showing the average prices paid in the recently completed vintage in the Murray Valley for chardonnay at below $200 per tonne on average and around $300 per tonne for shiraz. It is interesting to note that growers in 1999 (11 years ago) were paid an average $758 per tonne for chardonnay and $1146 per tonne for shiraz. one industry expert recently commented: ‘After several years of below cost prices there will continue to be an exodus of growers out of the industry as sure as night follows day’.
on the sales front the listed agricultural company, Tandou Limited, auctioned its Menindee horticultural property earlier in the month. The property was passed in without a genuine bid. The selling agents advise of some interest in the property on a ‘dry’ basis, however it is likely that Tandou will continue to farm and operate the property and adopts a wait and see approach. The company hopes for improved seasonal and economic conditions which will instil confidence back into the sector before marketing the property again.
There have been two significant recent sales of larger horticultural holdings in the Colignan area (50km south
of Mildura), one of which comprises a large 158ha ‘corporate’ style property developed with citrus, wine grapes and almonds. This property sold without any water entitlement for a little under $2 million, but inclusive of plant, equipment and citrus crop. on analysis the ‘dry’ values for the plantings show $7500 per hectare for the citrus and $11000 per hectare for the almonds.
Contact:
Shane Noonan: (03) 5021 0455
SALE
The Macalister irrigation district is showing very thin trading in dairy farms as a result of the downturn of the dairy export.
Contact:
Craig McMillan (03) 5143 2890
RURA
L

��
The month in review
SoUTHERN QLD
Having just finished a western trip out through Roma, Augathella, Charleville and Adavale, let me tell you that over the past 20 years, I have not seen such a large cross section of country looking better.
The excellent January/February rains have been a real benefit to both the country and the underground water tables. This benefit is likely to last through much of the winter, although follow-up rain will assist.
We note a couple of recent sales, which partly help to put the current state of the market in perspective. The recent successful auction of ‘Lynwood Station’, west of Adavale, on the May 13 for $700,000, is a real point in case. We understand there was a fair degree of anxiousness on the part of the vendor, who acquired the holding in 2007 for approximately $1.45 million. At the time, although it was regarded as a strong sale, the resale reflects a reduction of
in excess of 50% on the original sale.
Whilst no-one is suggesting that this is now where the market is at (i.e. back 50% off the peaks of 2007/2008), we think the message to come out of this is that, if you do not have to sell, it may be wise to sit and wait for a period until such times as there is more ‘sustainable’ evidence to confirm our beliefs of where the market is currently positioned.
At present, it is a genuine buyer’s market. With prospective buyers having multiple holdings to choose from, they are becoming very discerning in their choice. Top quality holdings will stand out above the rest and therefore have a better change of maintaining values going forward. Those ‘fringe’ or second class properties have the potential to be adversely affected to the greatest degree.
In the coming weeks, we will see the auctioning of a number of top class properties in some of the more desirable areas of southern Queensland. Expectations of the vendors in general, are still quite high, but it will be interesting to see whether the buyers agree.
Contact:
Doug Knight Ph: (07) 4339 2119
RURA
L
NoRTHERN QLD
The rural sector in the region remains quiet. Several grazing properties have gone to auction recently (Lancewood, Gregory Range, Bullock Creek) and could best be described as ‘duress sales’. The result of the sales campaigns was that none of the properties sold at auction but offers and negotiations are continuing.
Goldsborough at Pentland has also passed in at auction. The positive of this auction is that potential buyers did bid on the property. We are aware that negotiations are continuing.
Advice from certain agents are that in the present market there is reluctance by prospective purchasers to take an interest in any property with high input costs. As a result, there is little interest in properties in the poorer to transitional type country types. Interest still persists for better quality grazing land but completed sale numbers remain very limited.
....duress sales as they are transacted should be fully analysed prior to any application as to representing the state of the market. If there are enough successful duress sales transacted then because of the sheer numbers, these types of sales may set the market levels....
Has the market gone down and by what sum? This appears to be on the lips of all parties with interests in grazing lands. The number of Downs sales that have transacted continue to reflect a beast area value range close to the 2007–2008 levels. For other type grazing lands we still await empirical evidence to follow or predict any trend.
Duress sales as they are transacted should be fully analysed prior to any application as to representing the state of the market. If there are enough successful duress sales transacted then because of the sheer numbers, these types of sales may set the market levels. The effect of this could and will adversely affect the equity of all landholders. It is for this reason that empirical evidence reflects the true picture of market trends and not some calculated estimate arrived at by questionable assumptions.
It is time for a cautious approach and the world economy is not as rosy as one would hope. An offer to purchase today is one that may not be around tomorrow. Vendors must decide. Some of the few sales transacted in recent times have been for properties that have been listed with agents for around two years.
Following is a graph of the Queensland Cattle Market Index (historic trend) to current time in 2010. The trend does reflect a reasonably stable trading range for the past four years to date, between 170 points and 180 points. The year to date shows a similar index rate as 2007, at
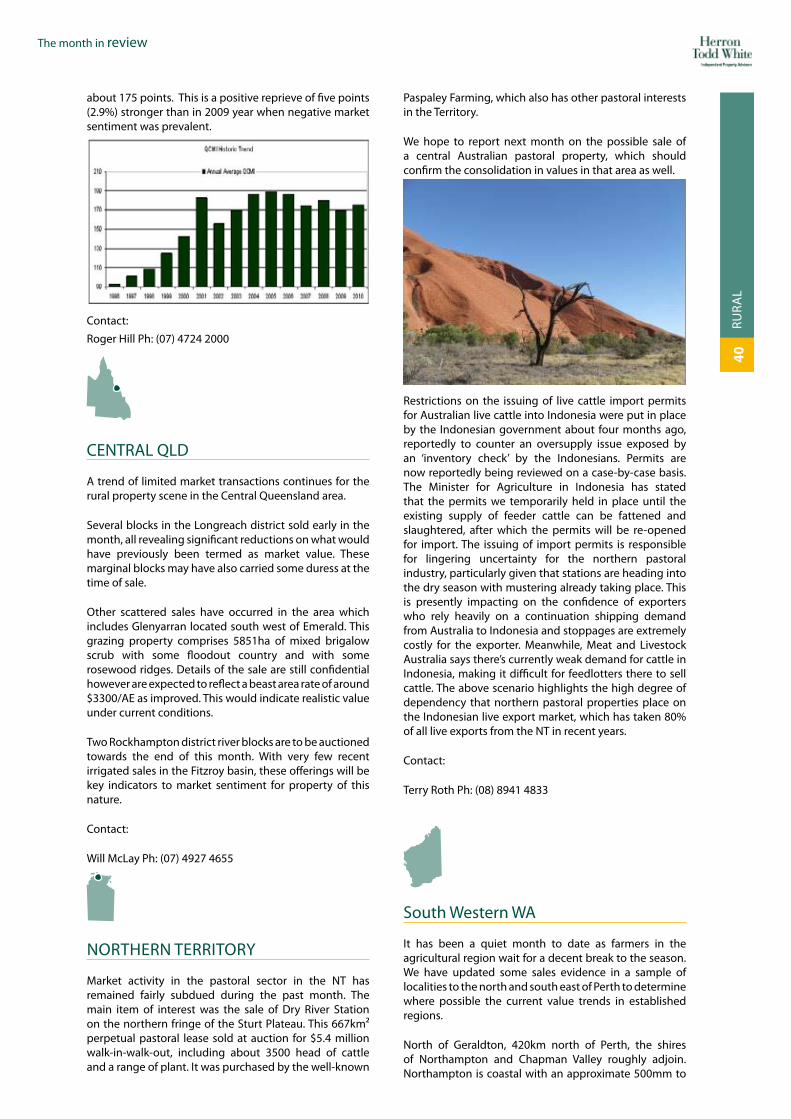
�0
The month in review
RURA
L
about 175 points. This is a positive reprieve of five points (2.9%) stronger than in 2009 year when negative market sentiment was prevalent.
Contact:
Roger Hill Ph: (07) 4724 2000
CENTRAL QLD
A trend of limited market transactions continues for the rural property scene in the Central Queensland area.
Several blocks in the Longreach district sold early in the month, all revealing significant reductions on what would have previously been termed as market value. These marginal blocks may have also carried some duress at the time of sale.
other scattered sales have occurred in the area which includes Glenyarran located south west of Emerald. This grazing property comprises 5851ha of mixed brigalow scrub with some floodout country and with some rosewood ridges. Details of the sale are still confidential however are expected to reflect a beast area rate of around $3300/AE as improved. This would indicate realistic value under current conditions.
Two Rockhampton district river blocks are to be auctioned towards the end of this month. With very few recent irrigated sales in the Fitzroy basin, these offerings will be key indicators to market sentiment for property of this nature.
Contact:
Will McLay Ph: (07) 4927 4655
NoRTHERN TERRIToRY
Market activity in the pastoral sector in the NT has remained fairly subdued during the past month. The main item of interest was the sale of Dry River Station on the northern fringe of the Sturt Plateau. This 667km² perpetual pastoral lease sold at auction for $5.4 million walk-in-walk-out, including about 3500 head of cattle and a range of plant. It was purchased by the well-known
Paspaley Farming, which also has other pastoral interests in the Territory.
We hope to report next month on the possible sale of a central Australian pastoral property, which should confirm the consolidation in values in that area as well.
Restrictions on the issuing of live cattle import permits for Australian live cattle into Indonesia were put in place by the Indonesian government about four months ago, reportedly to counter an oversupply issue exposed by an ‘inventory check’ by the Indonesians. Permits are now reportedly being reviewed on a case-by-case basis. The Minister for Agriculture in Indonesia has stated that the permits we temporarily held in place until the existing supply of feeder cattle can be fattened and slaughtered, after which the permits will be re-opened for import. The issuing of import permits is responsible for lingering uncertainty for the northern pastoral industry, particularly given that stations are heading into the dry season with mustering already taking place. This is presently impacting on the confidence of exporters who rely heavily on a continuation shipping demand from Australia to Indonesia and stoppages are extremely costly for the exporter. Meanwhile, Meat and Livestock Australia says there’s currently weak demand for cattle in Indonesia, making it difficult for feedlotters there to sell cattle. The above scenario highlights the high degree of dependency that northern pastoral properties place on the Indonesian live export market, which has taken 80% of all live exports from the NT in recent years.
Contact:
Terry Roth Ph: (08) 8941 4833
South Western WA
It has been a quiet month to date as farmers in the agricultural region wait for a decent break to the season. We have updated some sales evidence in a sample of localities to the north and south east of Perth to determine where possible the current value trends in established regions.
North of Geraldton, 420km north of Perth, the shires of Northampton and Chapman Valley roughly adjoin. Northampton is coastal with an approximate 500mm to

�1
The month in review
550mm rainfall, while Chapman Valley averages about 450mm. Property sizes typically range between 500ha and 1000ha, often made up of numerous titles, with usages mixed for grazing and cropping. A sample of sales from late 2009 and early 2010 indicate values ranging between $2200 to $2500 per hectare for useable land (ex buildings) in the Northampton region, to about $1500 to $2000 per hectare in Chapman Valley.
In the shires of Coorow and Carnamah, about 250km north of Perth, there is a body of evidence for country being largely sand plain over light loam bases within a 400mm rainfall belt. These areas indicate an average of $1000 to $1100 per hectare for arable land, and residual values of about $250 per hectare for bushland. Property sizes are typically in the vicinity of 1000ha-plus.
Within the central southern wheatbelt, the Shire of Lake Grace is a well established farming area with a strong emphasis on cropping, especially during the preceding decade. Fairly uniform rainfall of about 350mm exists with property sizes usually in excess of 1000ha. Values again have been quite consistent, with a good level of transactions in the central part of this shire indicating a range of $1000 to $1100 per hectare for arable land.
....potentially some lifestyle influences could be occurring as this region is within three hours’ drive of Perth, 90 minutes north of Albany on the coast, and comprises some attractive undulating land....
Kojonup and Katanning are adjoining shires about 300km south of Perth within a 480mm to 550mm rainfall range. A small number of transactions have occurred recently, with total property sizes much smaller than for the other areas noted, generally less than 500ha. This area is also known for its wool production and a large number of sheep stud farms are located in this region.
Analysed sales show values between $3500 and $4400 per hectare, however again we note a very limited number of transactions have occurred and property sizes are small. Potentially some lifestyle influences could be occurring as this region is within three hours’ drive of Perth, 90 minutes north of Albany on the coast, and comprises some attractive undulating land.
The trend noted north of Geraldton is largely repeated in the Shire of Esperance, about 750km south east of Perth on the south coast. Properties within a reasonable radius of the coast, having a relatively higher rainfall, indicate values in the vicinity of $2000 per hectare, compared to sales for properties about 50km inland with lower rainfall
RURA
L
being about $1500 per hectare. overall property sizes vary but show consistency in values on analysed rates.
Contact:
Peter Lee-Steere Ph: (08) 9791 6204

��
The month in review
MA
RKET
IND
ICAT
oRS
Comparative Property Market Indicators - June 2010
Comparative Analysis of Capital City Property Markets
To discuss the applicability of the Capital City indicators to individual properties or situations, contact your local Herron Todd White office:
Sydney (02) 9221 8911Melbourne (03) 9642 2000Brisbane Commercial (07) 3002 0900Brisbane Residential (07) 3353 7500Adelaide (08) 8231 6818Perth (08) 9388 9288Hobart (03) 6244 6795Darwin (08) 8941 4833Canberra (02) 6273 9888
Comparative Analysis of New South Wales/ACT Property Markets
To discuss the applicability of the NSW/ACT indicators to individual proper-ties or situations, contact your local Herron Todd White office:
Albury (02) 6041 1333Bathurst (02) 6334 4650Canberra/Queanbeyan (02) 6273 9888Dubbo (02) 6884 2999Gosford 1300 489 825Griffith (02) 6964 4222Leeton (02) 6953 8007Mudgee (02) 6372 7733Newcastle/Central Coast (02) 4929 3800Norwest (02) 8882 7100Southern Highlands (02) 4221 0205Sydney (02) 9221 8911Port Macquarie 1300 489 825Tamworth (02) 6766 9898Tweed Coast (02) 5523 2211Wagga Wagga (02) 6921 9303Wollongong (02) 4221 0205Young (02) 6382 5921
Comparative Analysis of Victorian/Tasmanian Markets
To discuss the applicability of the Victorian/Tasmanian indicators to individual properties or situations, contact your local Herron Todd White office:
Gippsland (Sale/Traralgon/Bairnsdale) (03) 5143 1880/ 03 5176 4300/ (03) 5152 6909Bendigo (03) 5480 2601Melbourne (03) 9642 2000Murray Mallee (Swan Hill) (03) 5032 1620Murray outback (Mildura) (03) 5021 0455Murray Riverina (Echuca/Deniliquin) (03) 5480 2601/ (03) 5881 4947Wodonga (02) 6041 1333Hobart (03) 6244 6795Launceston (03) 6334 4997
The following pages present a generalised overview of the state of property markets in Capital City, New South Wales/ACT, Victoria/Tasmania, Queensland, South Australia/Northern Territory/Western Australia & MENA locations using financing risk-rating scales. They are not a guide to individual property assessments.
For further information contact Richard Jenkins, Research Director, Herron Todd White, on (03) 9642 2000, or by email on [email protected]

��
The month in review
MA
RKET
IND
ICAT
oRS
Comparative Analysis of Queensland Property Markets
To discuss the applicability of the Queensland indicators to individual properties or situations, contact your local Herron Todd White office:
Brisbane Commercial (07) 3002 0900Brisbane Residential (07) 3353 7500Bundaberg/Wide Bay (07) 4154 3355Cairns (07) 4057 0200Emerald (07) 4980 7738Gladstone (07) 4972 3833Gold Coast (07) 5584 1600Hervey Bay (07) 4124 0047Ipswich (07) 3282 9522Mackay (07) 4957 7348Rockhampton (07) 4927 4655Sunshine Coast (Mooloolaba) (07) 5444 7277Toowoomba (07) 4639 7600Townsville (07) 4724 2000Whitsunday (07) 4948 2157
Comparative Property Market Indicators - June 2010
Herron Todd White acknowledges the assistance of, Roger Cussen Property Specialist (Warrnambool) in compiling these pages.
Comparative Analysis of South Australia/Northern Territory/Western Australian Property Markets
To discuss the applicability of the South Australian/Northern Territory and Western Australian indicators to individual properties or situations, contact your local Herron Todd White office:
Adelaide (08) 8231 6818South West WA (Bunbury/Busselton) (08) 9791 6204/ (08) 9754 2982Perth (08) 9388 9288Darwin (08) 8941 4833
The following pages present a generalised overview of the state of property markets in Capital City, New South Wales/ACT, Victoria/Tasmania, Queensland, South Australia/Northern Territory/Western Australia & MENA locations using financing risk-rating scales. They are not a guide to individual property assessments.
For further information contact Rick Carr, Research Director, Herron Todd White, on (07) 4057 0200, or by email on [email protected]

© Herron Todd White Copyright 2009No responsibility is accepted to any third party that may use or rely on the whole or any part of the content of this publication.
markeT iNdiCaTors
The month in review
Capital City Property Market Indicators as at May 2010 – Houses
44
Capital City Property Market Indicators as at May 2010 – Houses Factor Sydney Melbourne Brisbane Adelaide Perth Hobart Darwin Canberra
Rental Vacancy Situation Shortage of available property relative to demand
Balanced market Balanced market Shortage of available property relative to demand
Balanced market Severe shortage of available property relative to demand
Severe shortage of available property relative to demand
Balanced market
Rental Vacancy Trend Steady Steady Steady Steady Increasing Steady Steady Tightening
Demand for New Houses Fair Strong Fair Fair Fair Fair Strong Strong
Trend in New House Construction Steady Steady Steady Steady Declining Declining Steady Increasing
Volume of House Sales Increasing Steady Steady Increasing Steady Declining Declining Steady
Stage of Property Cycle Rising market Peak of market Start of recovery Rising market Rising market Declining market Peak of market Rising market
Are New Properties Sold at Prices Exceeding Their Potential Resale Value
Occasionally Frequently Occasionally Occasionally Occasionally Almost never Occasionally Almost never
Red entries indicate change from previous month to a higher risk-rating Blue entries indicate change from previous month to a lower risk-rating
Demand for New Houses
0
1
2
3
4
5
6
Sydney
Melbourne
Brisbane
Ade laidePerth
Hobart
Darwin
Canberra
Very Soft
Soft
Fair
Strong
Very Strong
Rental Vacancy Trend
0
1
2
3
4
5
6
Sydney
Melbourne
Brisbane
AdelaidePerth
Hobart
Darwin
Canberra
Increasing Sharply
Increasing
Steady
Tightening
Tightening Sharply
Stage of Property Cycle
0
1
2
3
4
5
6
Sydney
Melbourne
Brisbane
Ade laidePerth
Hobart
Darwin
Canberra
Declining M arket
Peak of M arket
Rising M arket
Bottom of M arket
Start o f Recovery

© Herron Todd White Copyright 2009No responsibility is accepted to any third party that may use or rely on the whole or any part of the content of this publication.
markeT iNdiCaTors
The month in review
Capital City Property Market Indicators as at May 2010 – Units
45
Capital City Property Market Indicators as at May 2010 – Units Factor Sydney Melbourne Brisbane Adelaide Perth Hobart Darwin Canberra
Rental Vacancy Situation Shortage of available property relative to demand
Balanced market Balanced market Shortage of available property relative to demand
Balanced market Shortage of available property relative to demand
Over-supply of available property relative to demand
Shortage of available property relative to demand
Rental Vacancy Trend Steady Steady Steady Steady Increasing Steady Steady Tightening
Demand for New Units Fair Strong Fair Fair Fair Fair Fair Strong
Trend in New Unit Construction Steady Steady Steady Steady Declining Steady Steady Increasing
Volume of Unit Sales Increasing Steady Steady Increasing Steady Declining Declining Steady
Stage of Property Cycle Rising market Peak of market Peak of market Rising market Rising market Declining market Peak of market Rising market
Are New Properties Sold at Prices Exceeding Their Potential Resale Value
Frequently Frequently Occasionally Occasionally Occasionally Almost never Occasionally Almost never
Red entries indicate change from previous month to a higher risk-rating Blue entries indicate change from previous month to a lower risk-rating
Rental Vacancy Trend
0
1
2
3
4
5
6
Sydne
y
Melbou
rne
Brisba
ne
Adelaid
ePert
hHob
art
Darwin
Canbe
rra
Increasing Sharply
Increasing
Steady
Tightening
Tightening Sharply
Stage of Property Cycle
0
1
2
3
4
5
6
Sydne
y
Melbou
rne
Brisba
ne
Adelaid
ePert
hHob
art
Darwin
Canbe
rra
Declining M arket
Peak o f M arket
Rising M arket
Bottom of M arket
Start of Recovery
Demand for New Units
0
1
2
3
4
5
6
Sydney
Melbourne
Brisbane
Ade laidePerth
Hobart
Darwin
Canberra
Very Soft
Soft
Fair
Strong
Very Strong
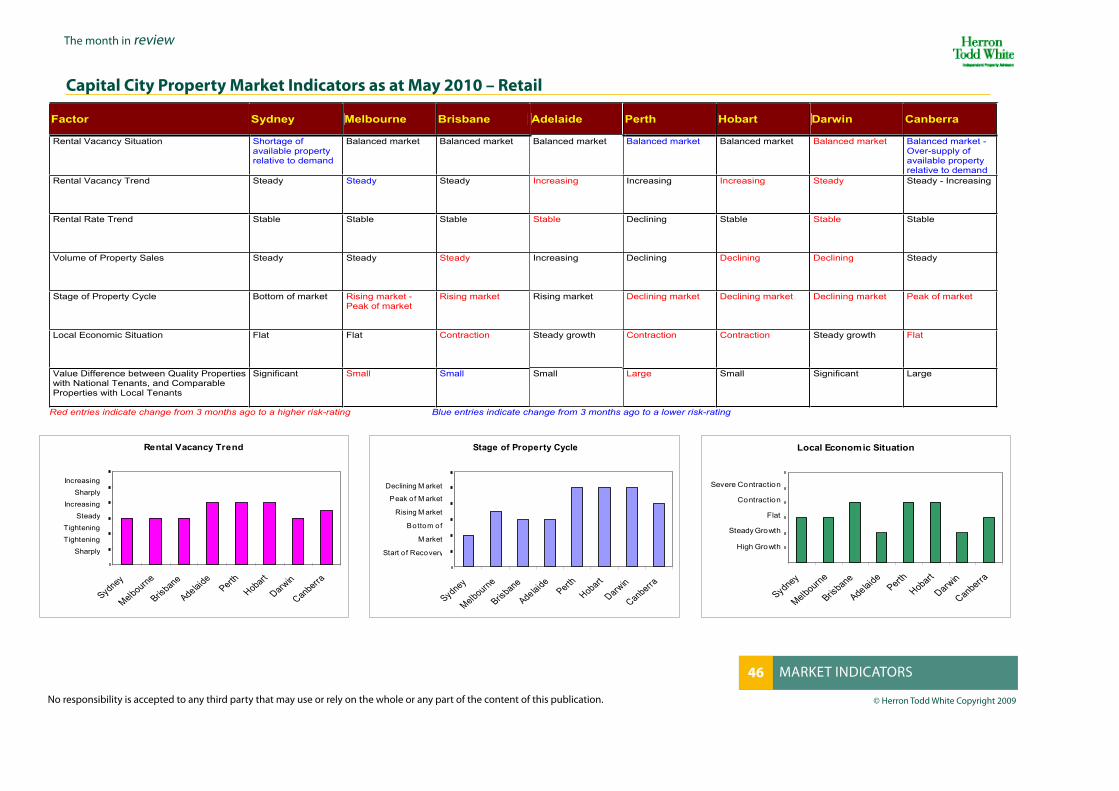
© Herron Todd White Copyright 2009No responsibility is accepted to any third party that may use or rely on the whole or any part of the content of this publication.
markeT iNdiCaTors
The month in review
1
Capital City Property Market Indicators as at May 2010 – Retail
46
Capital City Property Market Indicators as at May 2010 – RetailFactor Sydney Melbourne Brisbane Adelaide Perth Hobart Darwin Canberra
Rental Vacancy Situation Shortage of available property relative to demand
Balanced market Balanced market Balanced market Balanced market Balanced market Balanced market Balanced market - Over-supply of available property relative to demand
Rental Vacancy Trend Steady Steady Steady Increasing Increasing Increasing Steady Steady - Increasing
Rental Rate Trend Stable Stable Stable Stable Declining Stable Stable Stable
Volume of Property Sales Steady Steady Steady Increasing Declining Declining Declining Steady
Stage of Property Cycle Bottom of market Rising market - Peak of market
Rising market Rising market Declining market Declining market Declining market Peak of market
Local Economic Situation Flat Flat Contraction Steady growth Contraction Contraction Steady growth Flat
Value Difference between Quality Properties with National Tenants, and Comparable Properties with Local Tenants
Significant Small Small Small Large Small Significant Large
Red entries indicate change from 3 months ago to a higher risk-rating Blue entries indicate change from 3 months ago to a lower risk-rating
Local Economic Situation
0
1
2
3
4
5
6
Sydney
Melbourne
Brisbane
AdelaidePerth
Hobart
Darwin
Canberra
Severe Contraction
Contraction
Flat
Steady Growth
High Growth
Rental Vacancy Trend
0
1
2
3
4
5
6
Sydney
Melbourne
Brisbane
AdelaidePerth
Hobart
Darwin
Canberra
Increasing
Sharply
Increasing
Steady
Tightening
Tightening
Sharply
Stage of Property Cycle
0
1
2
3
4
5
6
Sydney
Melbourne
Brisbane
Ade laidePerth
Hobart
Darwin
Canberra
Declining M arket
Peak of M arket
Rising M arket
Bottom of
M arket
Start o f Recovery

© Herron Todd White Copyright 2009No responsibility is accepted to any third party that may use or rely on the whole or any part of the content of this publication.
markeT iNdiCaTors
The month in review
New South Wales Property Market Indicators as at May 2010 – Houses
47
New South Wales Property Market Indicators as at May 2010 – Houses Factor Albury Bathurst
Can-berra/Q’beyan
Central Coast Dubbo Griffith Mudge
eNew-castle Orange Sydney Tam-
worth Tweed Coast
Wagga Wagga
Wollon-gong
Rental Vacancy Situation Balanced market
Shortage of available property relative to demand
Balanced market
Balanced market
Shortage of available property relative to demand
Shortage of available property relative to demand
Shortage ofavailable property relative todemand
Shortage of available property relative to demand
Shortage ofavailable property relative to demand
Shortage of available property relative to demand
Shortage of available property relative to demand
Balanced market
Shortage of available property relative to demand
Shortage ofavailable property relative to demand - Balanced market
Rental Vacancy Trend Steady Tightening Tightening Steady Tightening Tightening Tightening
Tightening Tightening Steady Tightening Steady Tightening Tightening - Steady
Demand for New Houses Fair Strong Strong Fair Fair Soft Fair Soft Strong Fair Soft - Fair Fair Fair Fair
Trend in New House Construction Steady Increasing Increasing Steady Declining Declining Steady Steady Increasing Steady Declining - Steady
Steady Steady Steady
Volume of House Sales Steady Increasing Steady Steady Steady Declining Steady Steady Increasing Increasing Steady Declining Increasing Increasing - Steady
Stage of Property Cycle Rising market
Rising market
Rising market
Bottom of market - Rising market
Rising market
Declining market
Rising market
Bottom of market
Risingmarket
Rising market
Rising market - Peak of market
Start of recovery
Peak of market
Rising market
Are New Properties Sold at Prices Exceeding Their Potential Resale Value
Occasion-ally
Occasion-ally
Almost never
Occasion-ally
Occasion-ally
Occasionally Almost never
Almost never
Occasion-ally
Occasion-ally
Occasion-ally
Occasion-ally
Frequently Occasion-ally
Red entries indicate change from previous month to a higher risk-rating Blue entries indicate change from previous month to a lower risk-rating
Rental Vacancy Trend
0
1
2
3
4
5
6
Albury
Bathurst
C'berra/ Q'beya
n
Central Coa
st
DubboGriff
ith
Mudgee
Newcastle
Orange
Sydney
Tamworth
TweedCoast
Wagga Wagga
Illawarra
Increasing Sharply
Increasing
Steady
Tightening
Tightening Sharply
Stage of Property Cycle
0
1
2
3
4
5
6
Albury
Bathurst
C'berra/ Q
'beyan
Central C
oastDubbo
Griffith
Mudgee
NewcastleOrange
Sydney
Tamworth
Tweed Coast
Wagga Wagga
Illawarra
Declining M arket
Peak of M arket
Rising M arket
Bottom of M arket
Start o f Recovery
Demand for New Houses
0
1
2
3
4
5
6
Albury
Bathurst
C'berra/ Q
'beyan
Central Coast
DubboGriffi
th
Mudgee
NewcastleOrange
Sydney
Tamworth
Tweed Coast
Wagga Wagga
Illawarra
Very Soft
Soft
Fair
Strong
Very Strong

© Herron Todd White Copyright 2009No responsibility is accepted to any third party that may use or rely on the whole or any part of the content of this publication.
markeT iNdiCaTors
The month in review
New South Wales Property Market Indicators as at May 2010 – Units
48
New South Wales Property Market Indicators as at May 2010 – Units Factor Albury Bathurst
Can-berra/Q’beyan
Central Coast Dubbo Griffith Mudgee New-
castle Orange Sydney Tam-worth
Tweed Coast
Wagga Wagga
Wollon-gong
Rental Vacancy Situation Balanced market
Shortage of available property relative to demand
Shortage ofavailable property relative to demand
Balanced market
Shortage of available property relative to demand
Over-supply of available property relative to demand
Shortage ofavailable property relative to demand
Balanced market
Shortage ofavailable property relative to demand
Shortage of available property relative to demand
Shortage of available property relative to demand
Balanced market
Shortage of available property relative to demand
Shortage ofavailable property relative to demand - Balanced market
Rental Vacancy Trend Steady Tightening Tightening Steady Tightening Steady Tightening
Steady Tightening Steady Tightening Steady Tightening
Tightening - Steady
Demand for New Units Fair Fair Strong Soft Fair Soft Fair Very soft Soft Fair Soft - Fair Soft Fair Fair
Trend in New Unit Construction Steady Steady Increasing Declining Declining Declining significant-ly
Steady Declining Steady Steady Declining - Steady
Declining significantly
Steady Declining - Steady
Volume of Unit Sales Steady Increasing Steady Steady Steady Declining Steady Steady Increasing Increasing Steady Declining Steady Increasing - Steady
Stage of Property Cycle Rising market
Rising market
Rising market
Bottom of market
Rising market
Declining market
Rising market
Bottom of market
Risingmarket
Rising market
Rising market - Peak of market
Bottom of market
Peak of market
Start of recovery
Are New Properties Sold at Prices Exceeding Their Potential Resale Value
Occasion-ally
Occasion-ally
Almost never
Occasion-ally
Occasion-ally
Almost never
Almost never
Almost never
Occasion-ally
Frequently Occasion-ally
Very frequently
Frequently
Occasion-ally
Red entries indicate change from previous month to a higher risk-rating Blue entries indicate change from previous month to a lower risk-rating
Rental Vacancy Trend
0
1
2
3
4
5
6
Albury
Bathurs
t
C'berra
/ Q'be
yan
Centra
l Coa
st
Dubbo
Griffith
Mudgee
Newca
stle
Orange
Sydne
y
Tamwort
h
Tweed C
oast
Wagga W
agga
Illawarr
a
Increasing Sharply
Increasing
Steady
Tightening
Tightening Sharply
Stage of Property Cycle
0
1
2
3
4
5
6
Albury
Bathurs
t
C'berra
/ Q'be
yan
Centra
l Coa
st
DubboGriff
ith
Mudgee
Newca
stle
Orange
Sydne
y
Tamwort
h
Tweed Coa
st
Wagga Wag
ga
Illawarr
a
Declining M arket
Peak of M arket
Rising M arket
Bottom of M arket
Start o f Recovery
Demand for New Units
0
1
2
3
4
5
6
Albury
Bathurst
C'berra/ Q
'beyan
Central C
oast
DubboGriff
ith
Mudgee
Newcastle
Orange
Sydney
Tamworth
Tweed Coast
Wagga Wagga
Illawarra
Very Soft
Soft
Fair
Strong
Very Strong

© Herron Todd White Copyright 2009No responsibility is accepted to any third party that may use or rely on the whole or any part of the content of this publication.
markeT iNdiCaTors
The month in review
New South Wales Property Market Indicators as at May 2010 – Retail
49
New South Wales Property Market Indicators as at May 2010 – Retail Factor Albury Bathurst
Can-berra/Q’beyan
Central Coast Dubbo Griffith Mudgee New-
castle Orange Sydney Tam-worth
Tweed Coast
Wagga Wagga
Wollon-gong
Rental Vacancy Situation Balanced market
Over-supply of available property relative to demand
Balanced market - Over-supply of available property relative to demand
Over-supply of available property relative to demand
Shortage ofavailable property relative to demand - Balanced market
Over-supply of available property relative to demand
Balanced market
Balanced market
Balanced market
Shortage of available property relative to demand
Balanced market - Over-supply of available property relative to demand
Balanced market
Balanced market - Over-supply of available property relative to demand
Over-supply of available property relative to demand
Rental Vacancy Trend Steady Increasing Steady - Increasing
Steady Steady Increasing Steady Steady Steady Steady Steady Steady Steady - Increasing
Steady
Rental Rate Trend Stable Declining Stable Declining Stable Stable Stable Declining significantly
Stable Stable Stable Stable Stable Stable
Volume of Property Sales Declining Declining Steady Steady Increasing - Steady
Declining significant-ly
Steady Increasing Steady Steady Declining Declining significantly
Steady - Declining
Steady
Stage of Property Cycle Bottom of market
Declining market
Peak of market
Bottom of market
Start of recovery
Declining market
Start of recovery
Rising market
Start of recovery
Bottom of market
Rising market - Peak of market
Declining market
Declining market
Bottom of market
Local Economic Situation Flat Flat Flat Flat Flat Contrac-tion
Flat Steady growth
Steady growth
Flat Steady growth
Flat Flat Flat
Value Difference between Quality Properties with National Tenants, and Comparable Properties with Local Tenants
Significant Significant Large Small Small - Significant
Large Significant
Nil Small Significant Significant Significant Significant Significant - Large
Red entries indicate change from 3 months ago to a higher risk-rating Blue entries indicate change from 3 months ago to a lower risk-rating
Rental Vacancy Trend
0
1
2
3
4
5
6
Albury
Bathurst
C'berra/Q'beyan
Central C
oast
DubboGriff
ith
Mudgee
Newcastle
Orange
Sydney
Tamworth
Tweed Coast
Wagga Wagga
Illawarra
Increasing Sharply
Increasing
Steady
Tightening
Tightening Sharply
Stage of Property Cycle
0
1
2
3
4
5
6
Albury
Bathurst
C'berra/Q'beyan
Central C
oastDubbo
Griffith
Mudgee
NewcastleOrange
Sydney
Tamworth
Tweed Coast
Wagga Wagga
Illawarra
Declining M arket
Peak of M arket
Rising M arket
Bottom of M arket
Start o f Recovery
Local Economic Situation
0
1
2
3
4
5
6
Albury
Bathurst
C'berra/Q'beyan
Central C
oastDubbo
Griffith
Mudgee
NewcastleOrange
Sydney
Tamworth
Tweed Coast
Wagga Wagga
Illawarra
Severe Contractiont
Contraction
Flat
Steady Growth
High Growth

The month in review
© Herron Todd White Copyright 2009No responsibility is accepted to any third party that may use or rely on the whole or any part of the content of this publication.
markeT iNdiCaTors
Victoria/Tasmania Property Market Indicators as at May 2010 – Houses
50
Victorian and Tasmanian Property Market Indicators as at May 2010 – Houses Factor Bendigo Echuca Gippsland Melbourne Mildura Wangaratta Warrnam-
boolWodonga Burnie -
Devonport Hobart Launceston
Rental Vacancy Situation Balanced market
Shortage of available property relative to demand
Shortage of available property relative to demand
Severe shortage - Shortage of available property relative to demand
Balanced market
Balanced market
Balanced market
Shortage of available property relative to demand - Balanced market
Balanced market
Severe shortage of available property relative to demand
Severe shortage of available property relative to demand
Rental Vacancy Trend Steady Tightening Tightening Tightening sharply
Steady Tightening Steady Tightening Steady Steady Steady
Demand for New Houses Fair Fair Fair Strong Strong Fair Fair Fair - Strong Fair Fair Fair
Trend in New House Construction Steady Steady Steady Steady - Increasing
Steady Steady Steady Steady Steady Declining Declining
Volume of House Sales Steady Steady Increasing Steady Steady Declining Steady Steady Steady Declining Declining
Stage of Property Cycle Start of recovery
Rising market Start of recovery
Rising market Peak of market Start of recovery
Rising market Rising market Rising market Declining market
Declining market
Are New Properties Sold at Prices Exceeding Their Potential Resale Value
Almost never Almost never Occasionally Almost never Frequently Occasionally Occasionally Almost never Occasionally Almost never Almost never
Red entries indicate change from previous month to a higher risk-rating Blue entries indicate change from previous month to a lower risk-rating
Rental Vacancy Trend
0
1
2
3
4
5
6
Bendig
o
Echuc
a
Gippsla
nd
Melbou
rne
Mildura
Wangara
tta
Warrnam
bool
Wodong
a
Burnie-
Devonp
ort
Hobart
Laun
cesto
n
Increasing Sharply
Increasing
Steady
Tightening
Tightening Sharply
Stage of Property Cycle
0
1
2
3
4
5
6
Bendig
o
Echuc
a
Gippsla
nd
Melbou
rne
Mildura
Wangara
tta
Warrnam
bool
Wodong
a
Burnie-
Devonp
ort
Hobart
Laun
cesto
n
Declining M arket
Peak o f M arket
Rising M arket
Bottom of M arket
Start o f Recovery
Demand for New Houses
0
1
2
3
4
5
6
Bendig
o
Echuc
a
Gippsla
nd
Melbou
rne
Mildura
Wangara
tta
Warrnam
bool
Wodong
a
Burnie-
Devonp
ort
Hobart
Laun
cesto
n
Very Soft
Soft
Fair
Strong
Very Strong

© Herron Todd White Copyright 2009No responsibility is accepted to any third party that may use or rely on the whole or any part of the content of this publication.
markeT iNdiCaTors
The month in review
Victoria/Tasmania Property Market Indicators as at May 2010 – Units
51
Victorian and Tasmanian Property Market Indicators as at May 2010 – Units Factor Bendigo Echuca Gippsland Melbourne Mildura Wangaratta Warrnam-
boolWodonga Burnie -
Devon-port Hobart Laun-ceston
Rental Vacancy Situation Balanced market
Balanced market
Shortage of available property relative to demand
Shortage of available property relative to demand
Balanced market
Balanced market
Balanced market
Shortage of available property relative to demand - Balanced market
Balanced market
Shortage of available property relative to demand
Shortage of available property relative to demand
Rental Vacancy Trend Steady Steady Tightening Tightening sharply
Steady Tightening Steady Tightening Steady Steady Steady
Demand for New Units Strong Fair Fair Fair Strong Fair Fair Fair - Strong Fair Fair Fair
Trend in New Unit Construction Increasing Steady Steady Steady Steady Steady Steady Steady Steady Steady Steady
Volume of Unit Sales Steady Steady Increasing Steady Steady Declining Steady Steady Steady Declining Declining
Stage of Property Cycle Start of recovery
Rising market Start of recovery
Rising market Peak of market
Start of recovery
Rising market Rising market Rising market Declining market
Declining market
Are New Properties Sold at Prices Exceeding Their Potential Resale Value
Almost never Almost never Occasionally Almost never Frequently Almost never Occasionally Almost never Occasionally Almost never Almost never
Red entries indicate change from previous month to a higher risk-rating Blue entries indicate change from previous month to a lower risk-rating
Rental Vacancy Trend
0
1
2
3
4
5
6
Bendig
o
Echuc
a
Gippsla
nd
Melbou
rne
Mildura
Wangara
tta
Warrnam
bool
Wodong
a
Burnie-
Devonp
ort
Hobart
Laun
cesto
n
Increasing Sharply
Increasing
Steady
Tightening
Tightening Sharply
Stage of Property Cycle
0
1
2
3
4
5
6
Bendig
o
Echuc
a
Gippsla
nd
Melbou
rne
Mildura
Wangara
tta
Warrnam
bool
Wodong
a
Burnie-
Devonp
ort
Hobart
Laun
cesto
n
Declining M arket
Peak of M arket
Rising M arket
Bottom of M arket
Start o f Recovery
Demand for New Units
0
1
2
3
4
5
6
Bendig
o
Echuc
a
Gippsla
nd
Melbou
rne
Mildura
Wangara
tta
Warrnam
bool
Wodong
a
Burnie-
Devonp
ort
Hobart
Laun
cesto
n
Very Soft
Soft
Fair
Strong
Very Strong

© Herron Todd White Copyright 2009No responsibility is accepted to any third party that may use or rely on the whole or any part of the content of this publication.
markeT iNdiCaTors
The month in review
Victoria/Tasmania Property Market Indicators as at May 2010 – Retail
52
Victorian and Tasmanian Property Market Indicators as at May 2010 – Retail
Factor Bendigo Echuca Gippsland Melbourne Mildura Wangaratta Warrnam-bool
Wodonga Burnie -Devon-port Hobart Laun-
ceston Rental Vacancy Situation Balanced
market Balanced market
Balanced market
Balanced market
Over-supply of available property relative to demand
Balanced market
Balanced market
Balanced market
Balanced market
Balanced market
Balanced market
Rental Vacancy Trend Steady Steady Steady - Increasing
Steady Steady Steady Steady Steady Increasing Increasing Increasing
Rental Rate Trend Stable Stable Stable Stable Declining Stable Stable Stable Stable Stable Stable
Volume of Property Sales Declining Steady Steady Steady Declining Declining Steady - Declining
Declining Declining Declining Declining
Stage of Property Cycle Bottom of market
Rising market Start of recovery
Rising market - Peak of market
Bottom of market
Bottom of market
Bottom of market
Bottom of market
Declining market
Declining market
Declining market
Local Economic Situation Flat Steady growth Steady growth Flat Contraction Flat Steady growth Flat Contraction Contraction Contraction
Value Difference between Quality Properties with National Tenants, and Comparable Properties with Local Tenants
Significant Significant Significant Small Significant Significant Small Significant Small Small Small
Red entries indicate change from 3 months ago to a higher risk-rating Blue entries indicate change from 3 months ago to a lower risk-rating
Rental Vacancy Trend
0
1
2
3
4
5
6
Bendigo
Echuca
Gippsland
Melbourne
Mildura
Wangaratta
Warrnambool
Wodonga
Burnie-DevonportHobart
Increasing Sharply
Increasing
Steady
Tightening
Tightening Sharply
Stage of Property Cycle
0
1
2
3
4
5
6
Bendigo
Echuca
Gippsland
Melbourne
Mildura
Wangaratta
Warrnambool
Wodonga
Burnie-DevonportHobart
Declining M arket
Peak o f M arket
Rising M arket
Bottom of M arket
Start o f Recovery
Local Economic Situation
0
1
2
3
4
5
6
Bendigo
Echuca
Gippsland
Melbourne
Mildura
Wangaratta
Warrnambool
Wodonga
Burnie-DevonportHobart
Severe Contraction
Contraction
Flat
Steady Growth
High Growth

© Herron Todd White Copyright 2009No responsibility is accepted to any third party that may use or rely on the whole or any part of the content of this publication.
markeT iNdiCaTors
The month in review
Queensland Property Market Indicators as at May 2010 – Houses
53
Queensland Property Market Indicators as at May 2010 – Houses Factor Cairns Towns-
ville Whit-sunday Mackay Rock-
hampton Emerald Glad–stone
Bunda-berg
Hervey Bay
Sun-shine Coast
Brisbane GoldCoast Ipswich Too-
woomba Rental Vacancy Situation Balanced
market Balanced market
Balanced market
Balanced market
Balanced market
Balanced market
Balanced market
Shortage of available property relative to demand
Balanced market - Over-supply of available property relative to demand
Balanced market
Balanced market
Shortage of available property relative to demand
Balanced market
Shortage of available property relative to demand
Rental Vacancy Trend Increasing Steady Steady Steady Steady Tightening Steady Steady Steady Steady Steady Steady Steady Tightening
Demand for New Houses Fair Fair Fair Soft - Fair Fair Strong Soft Soft - Fair Fair Soft Fair Fair Soft Fair - Strong
Trend in New House Construction
Steady Steady Steady Declining Steady Increasing Steady Steady Steady - Increasing
Declining Steady Steady Declining Steady - Increasing
Volume of House Sales Steady - Declining
Steady Steady Declining Declining Increasing Steady Steady - Declining
Steady - Declining
Declining Steady Increasing Declining Steady
Stage of Property Cycle Bottom of market
Start of recovery
Start of recovery
Peak of market
Bottom of market
Rising market
Bottom of market
Start of recovery
Start of recovery
Bottom of market
Start of recovery
Rising market
Bottom of market
Rising market
Are New Properties Sold at Prices Exceeding Their Potential Resale Value
Occasion-ally
Occasion-ally
Almost never
Almost never
Occasion-ally
Occasion-ally
Almost never
Occasion-ally
Occasion-ally
Occasion-ally
Occasion-ally
Occasion-ally
Frequently Occasion-ally
Red entries indicate change from previous month to a higher risk-rating Blue entries indicate change from previous month to a lower risk-rating
Rental Vacancy Trend
0
1
2
3
4
5
6
Cairns
Townsville
Whitsunday
Mackay
Rockhampton
Emerald
Gladstone
Bundaberg
Hervey B
ay
Sunshine Coast
Brisbane
Gold Coast
Ipswich
Toowoomba
Increasing SharplyIncreasing
Steady
Tightening
Tightening Sharply
Stage of Property Cycle
0
1
2
3
4
5
6
Cairns
Townsville
Wh itsundayMackay
RockhamptonEmerald
G ladstone
Bundaberg
Hervey Bay
Sunshine Coast
Brisbane
Gold Coast
Ipswich
Toowoomba
Declining M arket
Peak of M arket
Rising M arket
Bottom of M arket
Start o f Recovery
Demand for New Houses
0
1
2
3
4
5
6
Cairns
Townsvil le
Wh itsundayMackay
RockhamptonEmerald
G ladstone
Bundaberg
Hervey Bay
Sunshine CoastBrisbane
Gold CoastIpswich
Toowoomba
Very Soft
Soft
Fair
Strong
Very Strong

© Herron Todd White Copyright 2009No responsibility is accepted to any third party that may use or rely on the whole or any part of the content of this publication.
markeT iNdiCaTors
The month in review
Queensland Property Market Indicators as at May 2010 – Units
54
Queensland Property Market Indicators as at May 2010 – Units Factor Cairns Towns-
ville Whit-sunday Mackay Rock-
hampton Emerald Glad-stone
Bunda-berg
Hervey Bay
Sun-shine Coast
Brisbane GoldCoast Ipswich Too-
woomba Rental Vacancy Situation Balanced
market Balanced market
Balanced market
Balanced market
Shortage of available property relative to demand
Balanced market
Balanced market
Balanced market
Balanced market - Over-supply of available property relative to demand
Balanced market
Balanced market
Balanced market
Balanced market
Shortage of available property relative to demand
Rental Vacancy Trend Tightening Steady Steady Steady Steady Tightening Steady Steady Steady Steady Steady Steady Steady Tightening
Demand for New Units Soft Fair Fair Fair Fair Strong Soft Soft Very soft Soft Fair Soft Soft Fair - Strong
Trend in New Unit Construction
Declining Steady Steady Steady Steady Increasing Declining Declining Declining significantly
Declining Steady Declining significantly
Declining Steady
Volume of Unit Sales Steady - Declining
Steady Steady Declining Steady Increasing Steady 3.4 Declining - Declining significantly
Declining Steady Declining Declining Steady
Stage of Property Cycle Bottom of market
Start of recovery
Start of recovery
Peak of market
Bottom of market
Rising market
Bottom of market
Start of recovery
Declining market
Bottom of market
Peak of market
Bottom of market
Bottom of market
Rising market
Are New Properties Sold at Prices Exceeding Their Potential Resale Value
Occasion-ally
Occasion-ally
Almost never
Almost never
Almost never
Occasion-ally
Almost never
Occasion-ally
Occasion-ally
Occasion-ally
Occasion-ally
Very frequently
Frequently Occasion-ally
Red entries indicate change from previous month to a higher risk-rating Blue entries indicate change from previous month to a lower risk-rating
Demand for New Units
0
1
2
3
4
5
6
Cairns
Townsville
Wh itsundayMackay
Rockhampton
Emerald
Gladstone
Bundaberg
Hervey Bay
Sunshine Coast
Brisbane
Gold Coast
Ipswich
Toowoomba
Very Soft
Soft
Fair
Strong
Very Strong
Rental Vacancy Trend
0
1
2
3
4
5
6
Cairns
Townsv
ille
Whitsund
ay
Mackay
Rockha
mpton
Emerald
Gladsto
ne
Bunda
berg
Hervey
Bay
Sunshi
ne Coa
st
Brisba
ne
Gold Coa
st
Ipswich
Toowoo
mba
Increasing Sharply
Increasing
Steady
Tightening
Tightening Sharply
Stage of Property Cycle
0
1
2
3
4
5
6
Cairns
Townsville
Whitsunday
Mackay
Rockhampton
Emerald
Gladstone
Bundaberg
Hervey Bay
Sunshine Coast
Brisbane
Gold Coast
Ipswich
Toowoomba
Declining M arket
Peak of M arket
Rising M arket
Bottom of M arket
Start o f Recovery

© Herron Todd White Copyright 2009No responsibility is accepted to any third party that may use or rely on the whole or any part of the content of this publication.
markeT iNdiCaTors
The month in review
Queensland Property Market Indicators as at May 2010 – Retail
55
Queensland Property Market Indicators as at May 2010 – Retail Factor Cairns Townsville Mackay Rock-
hampton Gladstone Bundaberg Hervey Bay
Sunshine Coast Brisbane Gold Coast Too-
woomba Rental Vacancy Situation Balanced
market - Over-supply of available property relative to demand
Balanced market
Balanced market
Balanced market
Over-supply of available property relative to demand
Over-supply of available property relative to demand
Balanced market - Over-supply of available property relative to demand
Balanced market - Over-supply of available property relative to demand
Balanced market
Over-supply of available property relative to demand
Balanced market - Over-supply of available property relative to demand
Rental Vacancy Trend Steady Steady Steady Steady Steady Increasing Steady - Increasing
Increasing Steady Increasing Steady
Rental Rate Trend Stable Stable Stable Stable Stable Declining - Stable
Declining - Stable
Declining - Stable
Stable Declining - Stable
Stable - Increasing
Volume of Property Sales Declining significantly
Steady Steady - Declining
Steady Steady Steady - Declining
Declining Increasing - Steady
Steady Declining Declining
Stage of Property Cycle Bottom of market
Bottom of market
Stable Rising market Peak of market Declining market
Declining market
Declining market
Rising market Bottom of market
Peak of market - Declining market
Local Economic Situation Flat Flat Steady growth Steady growth Flat Steady growth - Flat
Flat Contraction Contraction Contraction Flat
Value Difference between Quality Properties with National Tenants, and Comparable Properties with Local Tenants
Small Significant Small Significant Significant Small - Significant
Significant Significant Small Significant - Large
Significant
Red entries indicate change from 3 months ago to a higher risk-rating Blue entries indicate change from 3 months ago to a lower risk-rating
Local Economic Situation
0
1
2
3
4
5
6
Cairns
Townsville
Mackay
Rockhampton
Gladstone
Bundaberg
Hervey Bay
Sunshine Coast
Brisbane
Gold Coast
Toowoomba
Severe Contraction
Contraction
Flat
Steady Growth
High Growth
Rental Vacancy Trend
0
1
2
3
4
5
6
Cairns
Townsville
Mackay
Rockhampton
Gladstone
Bundaberg
Hervey Bay
Sunshine Coast
Brisbane
Gold Coast
Toowoomba
Increasing Sharply
Increasing
Steady
Tightening
Tightening Sharply
Stage of Property Cycle
0
1
2
3
4
5
6
Cairns
Townsville
Mackay
Rockhampton
Gladstone
Bundaberg
Hervey Bay
Sunshine Coast
Brisbane
Gold Coast
Toowoomba
Declining M arket
Peak o f M arket
Rising M arket
Bottom of M arket
Start o f Recoveryv

The month in review
© Herron Todd White Copyright 2009No responsibility is accepted to any third party that may use or rely on the whole or any part of the content of this publication.
markeT iNdiCaTors
Northern Territory, South Australia & Western Australia Property Market Indicators as at May 2010 – Houses
56
SA, NT and WA Property Market Indicators as at May 2010 – Houses Factor Adelaide Adelaide
Hills Barossa Valley Iron Triangle Alice Springs Darwin South West
WA Geraldton Perth
Rental Vacancy Situation Shortage of available property relative to demand
Shortage of available property relative to demand
Shortage of available property relative to demand
Balanced market Severe shortage of available property relative to demand
Severe shortage of available property relative to demand
Shortage of available property relative to demand
Balanced market Balanced market
Rental Vacancy Trend Steady Tightening Tightening Steady Steady Steady Tightening Tightening Increasing
Demand for New Houses Fair Fair Fair Fair Strong Strong Fair Fair Fair
Trend in New House Construction Steady Steady Steady Declining Steady Steady Declining Steady Declining
Volume of House Sales Increasing Increasing Increasing Steady Declining Declining Declining Increasing Steady
Stage of Property Cycle Rising market Rising market Rising market Bottom of market Peak of market Peak of market Start of recovery Rising market Rising market
Are New Properties Sold at Prices Exceeding Their Potential Resale Value
Occasionally Occasionally Occasionally Occasionally Occasionally Occasionally Almost never Occasionally Occasionally
Red entries indicate change from 3 months ago to a higher risk-rating Blue entries indicate change from 3 months ago to a lower risk-rating
Rental Vacancy Trend
0
1
2
3
4
5
6
Ade laide
Adelaide Hills
BarossaValley
Iron Tria
ngle
Alice Springs
Darwin
South West W
A
GeraldtonPerth
Increasing Sharply
Increasing
Steady
Tightening
Tightening Sharply
Stage of Property Cycle
0
1
2
3
4
5
6
Adelaide
Adelaide Hills
Barossa Valley
Iron Tria
ngle
Alice Springs
Darwin
South West W
A
Gera ldtonPerth
Declining M arket
Peak of M arket
Rising M arket
Bottom of M arket
Start of Recovery
Demand for New Houses
0
1
2
3
4
5
6
Ade laide
Ade laide Hills
BarossaValley
Iron Tria
ngle
Alice Springs
Darwin
South West W
A
Gera ldtonPerth
Very Soft
Soft
Fair
Strong
Very Strong

© Herron Todd White Copyright 2009No responsibility is accepted to any third party that may use or rely on the whole or any part of the content of this publication.
markeT iNdiCaTors
The month in review
Northern Territory, South Australia & Western Australia Property Market Indicators as at May 2010 – Units
57
SA, NT and WA Property Market Indicators as at May 2010 – Units Factor Adelaide Adelaide
Hills Barossa Valley Iron Triangle Alice Springs Darwin South West
WA Geraldton Perth
Rental Vacancy Situation Shortage of available property relative to demand
Shortage of available property relative to demand
Shortage of available property relative to demand
Balanced market Over-supply of available property relative to demand
Over-supply of available property relative to demand
Shortage of available property relative to demand
Balanced market Balanced market
Rental Vacancy Trend Steady Tightening Tightening Steady Steady Steady Tightening Tightening Increasing
Demand for New Units Fair Fair Fair Fair Fair Fair Fair Fair Fair
Trend in New Unit Construction Steady Steady Steady Declining Steady Steady Declining Steady Declining
Volume of Unit Sales Increasing Increasing Increasing Steady Declining Declining Declining Increasing Steady
Stage of Property Cycle Rising market Rising market Rising market Bottom of market Peak of market Peak of market Start of recovery Rising market Rising market
Are New Properties Sold at Prices Exceeding Their Potential Resale Value
Occasionally Occasionally Occasionally Occasionally Occasionally Occasionally Almost never Occasionally Occasionally
Red entries indicate change from 3 months ago to a higher risk-rating Blue entries indicate change from 3 months ago to a lower risk-rating
Rental Vacancy Trend
0
1
2
3
4
5
6
Adelaid
e
Adelaid
e Hills
Barossa
Valley
Iron T
riang
le
Alice Spri
ngs
Darwin
South
West W
A
Geraldto
nPert
h
Increasing SharplyIncreasing
SteadyTightening
Tightening Sharply
Stage of Property Cycle
0
1
2
3
4
5
6
Ade laide
Ade laide Hills
Barossa Valley
Iron Tria
ngle
Alice Springs
Darwin
Sou thWest W
A
Gera ldtonPerth
Declining M arket
Peak of M arket
Rising M arket
Bottom of M arket
Start of Recovery
Demand for New Units
0
1
2
3
4
5
6
Ade laide
Ade laide Hil ls
Barossa Valley
Iron Triangle
Alice Springs
Darwin
Sou th West W
A
Gera ldtonPerth
Very SoftSoftFair
Strong
Very
Strong

© Herron Todd White Copyright 2009No responsibility is accepted to any third party that may use or rely on the whole or any part of the content of this publication.
markeT iNdiCaTors
The month in review
Northern Territory, South Australia & Western Australia Property Market Indicators as at May 2010 – Retail
58
SA, NT and WA Property Market Indicators as at May 2010 – Retail Factor Adelaide Adelaide Hills Barossa
Valley Iron Triangle Alice Springs Darwin South West WA Geraldton Perth
Rental Vacancy Situation Shortage of available property relative to demand
Balanced market Balanced market Balanced market Balanced market Balanced market Balanced market Balanced market Balanced market
Rental Vacancy Trend Steady Steady Steady Steady Steady Steady Steady Tightening Increasing
Rental Rate Trend Stable Stable Stable Stable Stable Stable Stable Increasing Declining
Volume of Property Sales Steady Steady Steady Steady Declining Declining Declining Steady Declining
Stage of Property Cycle Bottom of market Bottom of market Bottom of market Peak of market Declining market Declining market Bottom of market Declining market Declining market
Local Economic Situation Flat Contraction Contraction Flat Steady growth Steady growth Steady growth Steady growth Contraction
Value Difference between Quality Properties with National Tenants, and Comparable Properties with Local Tenants
Small Nil Nil Small Significant Significant Small Nil Large
Red entries indicate change from 3 months ago to a higher risk-rating Blue entries indicate change from 3 months ago to a lower risk-rating
Rental Vacancy Trend
0
1
2
3
4
5
6
Ade laide
Adelaide Hills
Barossa Valley
Iron Tria
ngle
Alice Springs
Darwin
SouthWest W
A
Gera ldtonPerth
Increasing Sharply
Increasing
Steady
Tightening
Tightening Sharply
Stage of Property Cycle
0
1
2
3
4
5
6
Adelaide
Adelaide Hills
BarossaValley
Iron Tria
ngle
Alice Springs
Darwin
South West W
A
Gera ldtonPerth
Declining M arket
Peak o f M arket
Rising M arket
Bottom o f M arket
Start o f Recovery
Local Economic Situation
0
1
2
3
4
5
6
Adelaide
Adelaide Hills
Barossa Valley
Iron Tria
ngle
Alice Springs
Darwin
South West W
A
GeraldtonPerth
Severe Contraction
Contraction
Flat
Steady Growth
High Growth