june 2015 investor deck 5.22 - s2.q4cdn.com · * do it yourself ecommerce only. europe -market...
TRANSCRIPT

June 2015 Investor Presentation
as of 6/1/2015

Statements and information included in this presentation that are not purely historical are forward-looking
statements within the meaning of the Private Securities Litigation Reform Act of 1995 and are made pursuant to the
“safe harbor” provisions of such Act .
Forward-looking statements include, but are not limited to statements regarding our expectations, intentions,
beliefs and strategies regarding the future, including statements regarding trends, cyclicality and changes in the
markets we sell into; strategic direction; changes to procurement processes; the cost of compliance with
environmental and other laws; expected tax rates; planned capital expenditures; liquidity positions; ability to
generate cash from continuing operations; the potential impact of adopting new accounting pronouncements;
Forward Looking Statement
generate cash from continuing operations; the potential impact of adopting new accounting pronouncements;
expected financial results, including revenue and profitability; obligations under our retirement plans; savings or
additional costs from business integrations and cost containment programs; and the adequacy of accruals.
All forward-looking statements we make are based on information available to us at the time the statements are
made, and we assume no obligation to update any forward-looking statements, except as may be required by law.
The potential risks and uncertainties that could cause actual results to differ from the results predicted or implied
by our forward-looking statements include, among others, changes in federal or state laws or regulations that affect
our business, changes in the types of replacement parts that insurance carriers will accept, fluctuations in the prices
of metals, as well as the risks and uncertainties included under the captions “Risk Factors” and “Management’s
Discussion and Analysis of Financial Condition and Results of Operations” in our Annual Report on Form 10-K for the
year ended December 31, 2014 and any of our subsequent Quarterly Reports on Form 10-Q. These reports are
available on our investor relations website at lkqcorp.com and on the SEC website at sec.gov.
2

Company Overview

LKQ’s Evolution
July 1998Wholesale Salvage
February 2004Aftermarket Collision
February 2004Self Serve
January 2006Refurbished Wheels
October 2007Keystone / Paint
March 2008Heavy Duty
November 2010Reman
October 2011EUROPE-UK
January 2014Keystone Specialty
May 2013EUROPE-Benelux
August 2013Australia JV
18%
12%
10%
4
2003
Total Revenue
$328MM
2007
Total Revenue
$1.11B
2011
Total Revenue
$3.27B
* as of 3/31/2015
29%
2%2%
27%
2015*
Total Revenue
$6.88B

Market Leading Positions in Key Markets
�Alternative parts distributor to the collision repair industry in US and Canada
#1 or #2 in Key Markets
2014 LTM(as of 3/31/2015)
5 Year CAGR*
Revenue (in millions) $6,740 $6,888 27%
Net Income (in millions) $382 $384 25%
Earnings Per Share $1.25 $1.25 23%
5* As of 12/31/2014
�Distributor of refurbished wheels, bumper covers and lights to the US collision repair market
�Heavy-duty truck recycling / disposal in the US
�Paint distributor to the US collision repair market
�Remanufactured and recycled engines and recycled transmissions to the US mechanical repair market
�Self service auto parts yards
�Mechanical and collision alternative parts, and paint distributor in the UK
�Mechanical parts for the automotive aftermarket industry in the Benelux
�Specialty aftermarket automotive equipment and accessories in North America
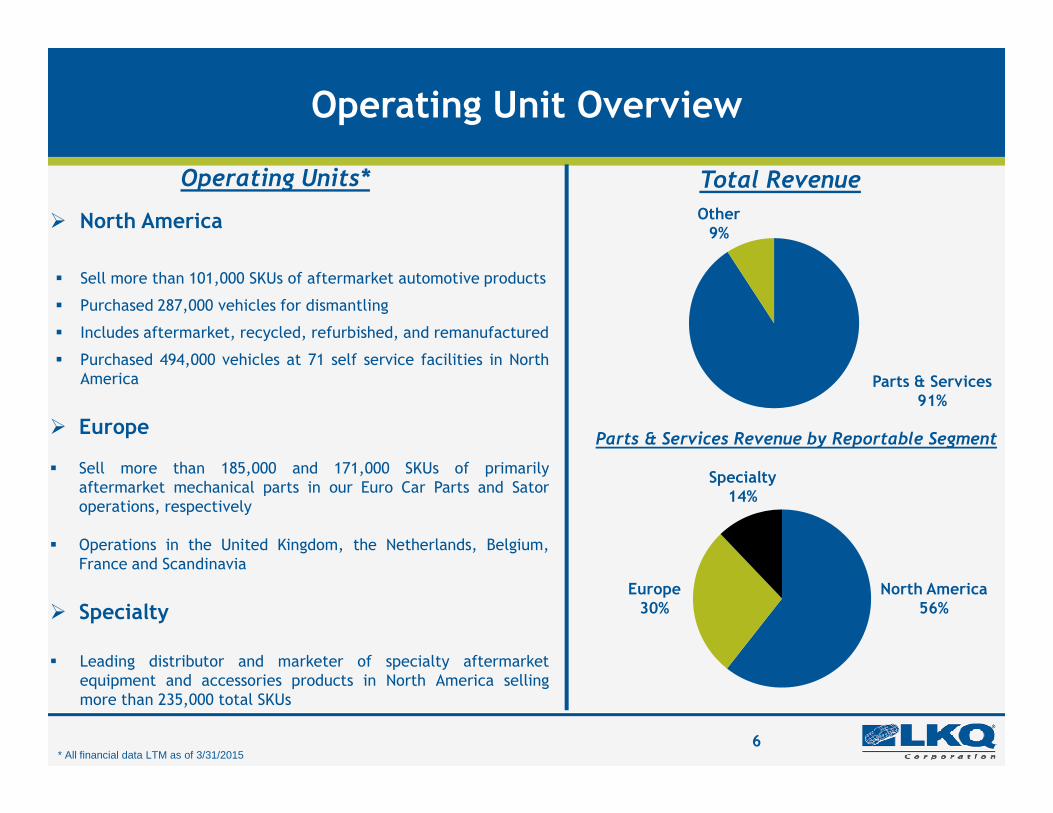
Operating Unit Overview
Operating Units*
� North America
� Sell more than 101,000 SKUs of aftermarket automotive products
� Purchased 287,000 vehicles for dismantling
� Includes aftermarket, recycled, refurbished, and remanufactured
� Purchased 494,000 vehicles at 71 self service facilities in NorthAmerica
Total Revenue
Parts & Services91%
Other9%
� Europe
� Sell more than 185,000 and 171,000 SKUs of primarilyaftermarket mechanical parts in our Euro Car Parts and Satoroperations, respectively
� Operations in the United Kingdom, the Netherlands, Belgium,France and Scandinavia
� Specialty
� Leading distributor and marketer of specialty aftermarketequipment and accessories products in North America sellingmore than 235,000 total SKUs
Parts & Services Revenue by Reportable Segment
91%
North America56%
Europe30%
6* All financial data LTM as of 3/31/2015
Specialty 14%

North America

New OEM
Recycled OEM
Front Door
$1,376
$805
Engine
$3,458
$1,125
Rear Bumper
$531
$237
High quality products at lower cost than OEM replacement products
Clear Value Proposition
Recycled OEM
…and improved cycle time for repairs
Recycled OEM
Savings
$805
41%
$1,125
67%
$237
55%
New OEM
Aftermarket
Savings
Fender
$209
$163
22%
Door Mirror
$160
$92
43%
Hood
$446
$307
31%
8
Aftermarket
Parts price only-excludes labor

Automotive Repair Market
$213 bn
Do It For Me (DIFM)
$165 bn
Collision
$40 bn
Mechanical
$125 bn
DIY*
$48 bn
Retail
Price
US Automotive Repair Industry
$40 bn
Collision Parts
$22 bn
Collision
(Wholesale)
$15 bn
Markup
$7 bn
Labor
$18 bn
$125 bn
Mechanical Parts
$68 bn
Mechanical
(Wholesale)
$46 bn
Markup
$22 bn
Labor
$57 bn
Source: AAIA Factbook, 24rd Edition 2014; 2014 data is estimated, excludes tires2014 Collision Trends
Price
Parts &
Labor
Market Opportunity – $61 billion
9
* Do It Yourself

Repair ShopNew OEM
Manufacturers
Insurance Companies (Indirect Customers)
64%
Collision Products, a $15 Billion Industry
Aftermarket
Recycled OEMRefurbished & Optional OE
Products
18%
Source: CCC Information Services –Crash Course 2015
Alternative parts = 36% of parts costs
12%6%
10
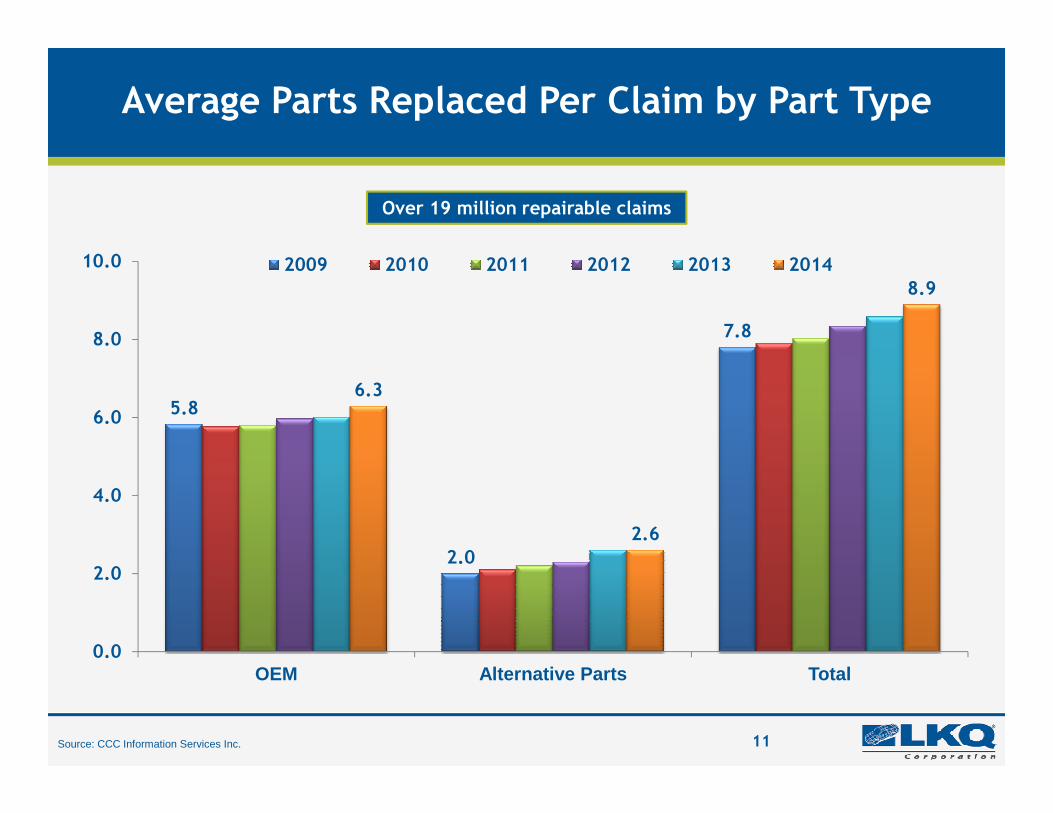
Average Parts Replaced Per Claim by Part Type
5.8
7.8
6.3
8.9
6.0
8.0
10.0 2009 2010 2011 2012 2013 2014
Over 19 million repairable claims
Source: CCC Information Services Inc. 11
5.8
2.02.6
0.0
2.0
4.0
6.0
OEM Alternative Parts Total

Regional Distribution Improves Fulfillment
Mid-Atlantic Region-Transfer Routes
12
Salvage/AM
Salvage
Aftermarket
Cross Dock

Locations Provide Strategic Advantage
13
Next day delivery leveraging regional distribution infrastructure

4 year timehorizon
Age & Size of US Car Parc Improving
112 114 115 117 119 118 117 113
107 102
97 95 94 94 98
105
67 68 68 67 67 67 66 63 63
66 25
30
35
40
45
50
80
100
120
140
Num
ber
of
Vehic
les
(millions)
14Sources: Sales & Production-Wards; Projections-Bank of America Merrill Lynch, 1/06/2015
Data assumes oldest vehicles are retired first in each year (not a precise assumption)
2003 2004 2005 2006 2007 2008 2009 2010 2011 2012 2013 2014 2015 2016 2017 2018
New 17 17 17 17 16 13 10 12 13 14 16 17 17 17 18 18
3-10 years 112 114 115 117 119 118 117 113 107 102 97 95 94 94 98 105
3-7 years 67 68 68 67 67 67 66 63 56 51 48 49 54 59 63 66
17 17 17 17 16
13
10 12
13 14
16 17 17 17 18 18
67 67 67 67 66 63
56 51
48 49 54
59 63
66
-
5
10
15
20
25
-
20
40
60
Num
ber
of
Vehic
les
(millions)

Crash Avoidance Systems Growing….But Impact will Be Very Slow
Source: CCC Information Services Inc.
Projections based on annual rate of change between 2010 & 2013 – Impact may increase on market adoption & system improvements 15
CCC estimates less than 4% impact to losses in next 10 years

Europe

Automotive Repair Market
€198 bn
Do It For Me (DIFM)
€188 bn
Collision
€30 bn
Mechanical
€158 bn
DIY*
€10 bn
Retail
Price
European Automotive Repair Industry
€30 bn
Collision Parts
€22 bn
Collision
(Wholesale)
€14 bn
Markup
€8 bn
Labor
€8 bn
€158 bn
Mechanical Parts
€120 bn
Mechanical
(Wholesale)
€78 bn
Markup
€42 bn
Labor
€38 bn
Source: 2014 Datamonitor; Management EstimatesAll € in millions; Excludes VAT and sales taxes
Price
Parts &
Labor
Market Opportunity – €92 billion
17* Do It Yourself ecommerce only

Europe - Market Observations
� Large car parc
� Fragmented industry
� Dominated by country champions
� In transition from 3 step to 2 stepdistributiondistribution
� Professional repairer focused
� Segmented by the suppliers
� Focused on mechanical parts
� Low penetration of alternative collisionparts with ~7% APU across Europe
18
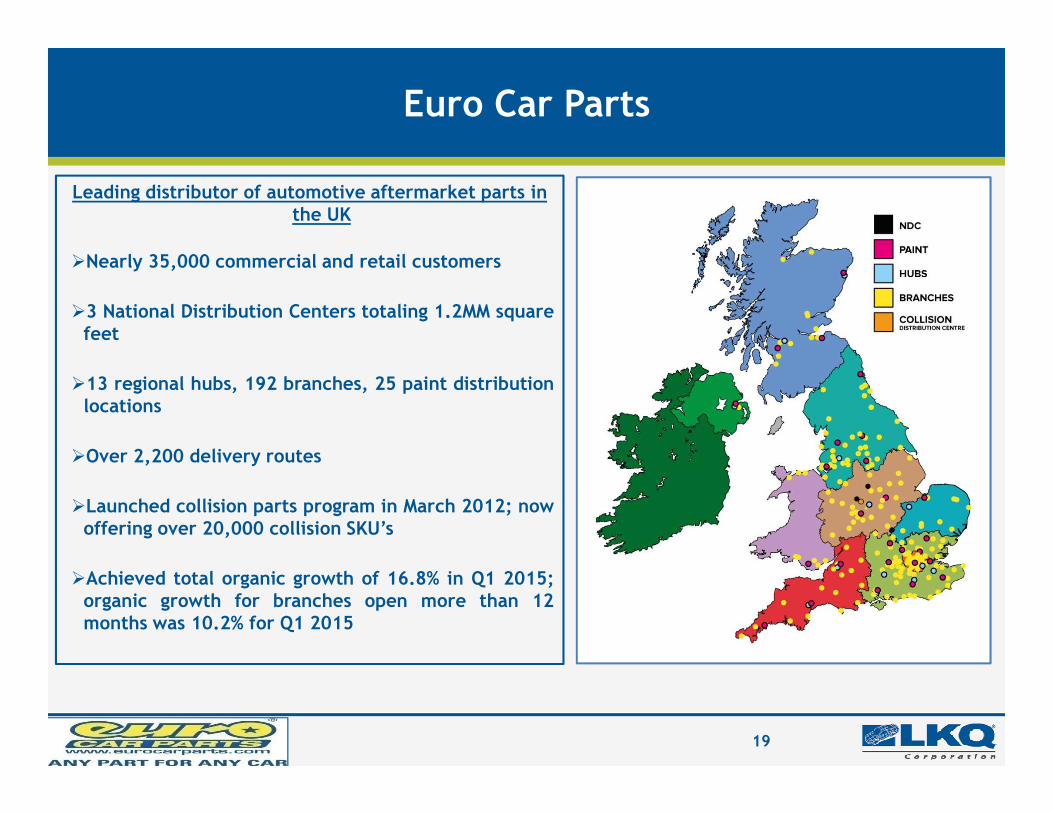
Euro Car Parts
Leading distributor of automotive aftermarket parts in the UK
�Nearly 35,000 commercial and retail customers
�3 National Distribution Centers totaling 1.2MM squarefeet
�13 regional hubs, 192 branches, 25 paint distributionlocations
19
locations
�Over 2,200 delivery routes
�Launched collision parts program in March 2012; nowoffering over 20,000 collision SKU’s
�Achieved total organic growth of 16.8% in Q1 2015;organic growth for branches open more than 12months was 10.2% for Q1 2015

Benelux Markets-Sator
�Leading distributor of automotive aftermarketmechanical parts in the Benelux offering morethan 171,000 SKUs
�Proprietary, best-in-class online ordering technology for local distributors & repair shops
�Opportunity for meaningful purchasing synergies with Euro Car Parts
20
with Euro Car Parts
�Serve more than 9,500 repairers and 450 local wholesale customers with overnight & daily delivery service
�11 distribution centres & 67 branches
�LKQ converting from 3 step to 2 step distribution model

Specialty

Keystone Specialty
Keystone’s Directly Addressable Market * Keystone Overview
� Leading distributor and marketer of specialtyaftermarket equipment, accessories, and products inNorth America
� Critical link between 800+ suppliers and approximately17,000 customers selling over 235,000 total SKUssupported by a highly technical sales force
� Diverse product segments: truck and off-road; speedand performance; recreational vehicle; towing;
Performance Products
$2.140%
RV ,Trailer &Other$1.121%
Wheels & Tires$0.58%
and performance; recreational vehicle; towing;wheels, tires and performance handling; andmiscellaneous accessories
� Best-in-class logistics and distribution network withapproximately 800,000 annual deliveries and ability toserve over 99% of jobber customers next-day
� Management and infrastructure in place to aggressivelypursue growth organically and through strategicacquisitions
� Achieved Q1 2015 revenue of $240MM
22* Management estimates based on AAIA Factbook, SEMA and other industry research; data $ in billions
Accessory & Appearance Products$1.631%
North American Distribution Footprint

Financial Overview

Acquisition Strategy
• Seek markets where we can be #1or #2
• Keep discipline on return metrics
• Criteria in new markets� Among the leaders in the market
Strong Brands
Among the leaders in the market
� Well run companies
� LKQ culture
� Ability to achieve synergies
� Attractive Returns of Capital
� High fulfillment rates
• Criteria in existing markets� “Tuck in” companies
� High synergies
� Additional capacity
� Examples: Cross Canada, Stag-Parkway
2424

Unique Combination of Strong Organic & Acquisition Revenue Growth
20%
25%
30%
21.3%
23.6%
27.8%
Acquisition Revenue Growth Rates*Organic Revenue Growth Rates*
* Parts and services only 25
0%
5%
10%
15%
2009 2010 2011 2012 2013 2014 Q1-'15
6.1%6.6%
7.9%6.0%
11.0%9.0%
7.5%
4.0%
8.3%
13.7%
8.2%

Historical Financials
Revenue Earnings Per Share($ in millions)
$0.87
$1.02
$1.25
$1.00
$1.20
$1.40
$4,123
$5,063
$6,740
$5,000
$6,000
$7,000
26
$0.57
$0.71
$-
$0.20
$0.40
$0.60
$0.80
2010 2011 2012 2013 2014
$2,470
$3,270
$4,123
$-
$1,000
$2,000
$3,000
$4,000
2010 2011 2012 2013 2014

2015 2014 % Change
Revenue $1,774 $1,626 9.1%
Earnings Per Share $0.35 $0.34 2.9%
EBITDA $213 $203 4.8%
First Quarter 2015 Results
EBITDA Margin 2015 2014
North America 14.3% 14.2%
Europe 9.5% 9.8%
Specialty 10.5% 10.1%
27($ in millions excluding EPS)

First Quarter 2015 Revenue Growth
Acquisition Organic
Foreign
Exchange % Change (1)
North America 1.4% 4.6% (0.9%) 5.1%
Europe 12.7% 14.0% (10.7%) 16.0%
Specialty 31.2% 6.3% (1.5%) 36.0%
28(1) The sum of the individual revenue change components may not equal the total percentage change due to rounding.
Specialty 31.2% 6.3% (1.5%) 36.0%
Parts and Services 8.2% 7.5% (3.8%) 11.9%
Other 0.6% (17.7%) (0.3%) (17.4%)
Total 7.5% 5.1% (3.4%) 9.1%

Operating Cash Flow & CAPEX
Cash Flow & Leverage
Debt & Leverage Multiple (a)
$428
$371 $400
$500
Operating Cash Flow Capital SpendingDebt Leverage
$1,306
$1,864
$1,600
$2,000
a) EBITDA FY on a Reported Basis (i.e. not per bank covenant definitions) * All data in millions
29
$159
$212 $206
$61
$86 $88 $90
$141
$-
$100
$200
$300
2010 2011 2012 2013 2014
$601
$956
$1,118
1.8x
2.3x 2.2x 2.1x2.4x
$-
$400
$800
$1,200
2010 2011 2012 2013 2014

Amount
Capitalization and Liquidity
($ in millions) %
Debt 1,735 38%
2,780
Total capitalization
62%
$ 4,515 100%
Stockholders’ equity (book)
Capitalization
Liquidity
$
Debt Maturity Profile(a)
(b)
(b)
$2,000
$2,500
Term Loan A Senior NotesRevolver ARS FacilityOther Debt Revolver Availability
$2,122
Debt/LTM EBITDA 2.2X
Moody’s
Cash and cash equivalents $175Availability under credit facilities 1,232
Total liquidity $1,407
Ba1(a) As of 3/31/2015(b) Includes our senior secured credit agreement borrowings, our receivables securitization facility
and senior notes
Amount
30
S&P BB+
Liquidity
Credit Ratings
($ in millions)
Stable
Stable $0
$500
$1,000
$1,500
2015 2016 2017 2018 2019 2020 2023
$56 $33$122
$28
$606
Revolver Availability $1,232
$547
$343

Guidance 2015 (effective only on the date issued: April 30, 2015)
Organic revenue growth, for parts & services
Net Income
Full Year2014
Actual
Full Year2015
Guidance (a)
$382
6.5% to 9.0%
$420 to $450
9.0%
($ in millions excluding EPS)
31
(a) Guidance for 2015 is based on current conditions and excludes the impact of restructuring and acquisition related expenses, losses on debtextinguishment, and gains or losses (including changes in fair value of contingent consideration liabilities) and capital spending related toacquisitions or divestitures. Organic revenue guidance refers only to parts and services revenue. LKQ reiterated its February 2015 guidance onApril 30, 2015, and it is only effective on the date of issuance. It is LKQ’s policy to comment on its annual guidance only when the companyissues its quarterly press releases with financial results. LKQ has no obligation to update this guidance.
Diluted EPS
Cash flow from operations
Capital expenditures
$1.25
$371
$141 $150 to $180
$1.36 to $1.46
~$425

Alternative Parts Usage is Expanding
LKQ – Compelling Investment
� Increasing availability of quality aftermarket and recycled products
� Distribution network and inventory levels allow higher fulfillment rates
� Expanding number of vehicles/”sweet spot” in our target market
Products Offer Clear Value Proposition
� Insurers focused on controlling repair costs
� Alternative products offer savings of 20% - 50% of OEM parts repairs
� LKQ represents the best partner for the insurance companies
Market Leader Growing Market Demonstrated Performance
Market Leadership
� Scale provides purchasing leverage and depth of inventory
� National footprint
� European & specialty expansion drives geographic growth and diversification
� Opportunities for new locations & adjacent markets remain in all segments
Solid Financial Metrics
� Strong FCF generation supports growth
� Limited near-term debt repayments & ample liquidity
� Diversified capital structure
� History of delivering consistent acquisition & organic revenue growth, EPS & net income
32
Appendix

EBITDA Reconciliation
(In thousands) LTM as of 3/31/15
Net Income $ 383,961
Depreciation and amortization 127,044
Interest expense, net 62,736
Loss on debt extinguishment*Provision for income taxes 210,341
$ 784,082
Earnings before interest, taxes, depreciation and
amortization (EBITDA)
*Loss on debt extinguishment is considered a component of interest in calculating EBITDA, as the write-off of debt issuance costs is similarto the treatment of debt issuance cost amortization.
We provide a reconciliation of Net Income to EBITDA as we believe it offers investors, securities analysts and other interested partiesuseful information regarding our results of operations because it assists in analyzing our performance and the value of our business. EBITDAprovides insight into our profitability trends, and allows management and investors to analyze our operating results with and without theimpact of depreciation, amortization, interest and income tax expense. We believe EBITDA is used by securities analysts, investors, andother interested parties in evaluating companies, many of which present EBITDA when reporting their results. EBITDA should not beconstrued as an alternative to operating income, net income or net cash provided by (used in) operating activities, as determined inaccordance with accounting principles generally accepted in the United States. In addition, not all companies that report EBITDAinformation calculate EBITDA in the same manner as we do and, accordingly, our calculation is not necessarily comparable to similarlynamed measures of other companies and may not be an appropriate measure for performance relative to other companies.
34

Adjusted EPS Reconciliation
2015 2014
(In thousands, except per share data)
Net income 107,095$ 104,653$
Adjustments:
Restructuring and acquisition related expenses, net of tax 4,211 2,192
Loss on debt extinguishment, net of tax - 214
Change in fair value of contingent consideration liabilities 151 (1,222)
Adjusted net income 111,457$ 105,837$
The following unaudited table reconciles Net Income and Diluted Earnings per Share
to Adjusted Net Income and Adjusted Diluted Earnings per Share, respectively:
Three Months Ended
March 31,
35
Weighted average diluted common shares outstanding 306,961 305,514
Diluted earnings per share 0.35$ 0.34$
Adjusted diluted earnings per share 0.36$ 0.35$
We provide a reconciliation of Net Income and Diluted Earnings per Share ("EPS") to Adjusted Net
Income and Adjusted Diluted EPS as we believe it offers investors, securities analysts and other
interested parties useful information regarding our results of operations because it assists in
analyzing our performance and the value of our business. Adjusted Net Income and Adjusted
Diluted EPS are presented as supplemental measures of our performance that management
believes are useful for evaluating and comparing our operating activities across reporting periods.
In 2015 and 2014, the Company defines Adjusted Net Income and Adjusted Diluted EPS as Net
Income and Diluted EPS adjusted to eliminate the impact of restructuring and acquisition related
expenses, net of tax, loss on debt extinguishment, net of tax, and the change in fair value of
contingent consideration liabilities. Adjusted Net Income and Adjusted Diluted EPS should not be
construed as alternatives to Net Income or Diluted EPS as determined in accordance with
accounting principles generally accepted in the United States. In addition, because not all
companies use identical calculations, this presentation of Adjusted Net Income and Adjusted
Diluted EPS may not be comparable to similarly titled measures of other companies.