june 2012 full year 29082012 - australian securities exchange · corporate responsibility statement...
TRANSCRIPT

Contents of the Directors' Report
Directors 2Company secretaries 4Directors' meetings 4Principal activities 5Review of operations 5Dividends 5State of affairs 6Events subsequent to reporting date 6Likely developments 6Environmental regulation 6Indemnification of directors and officers 6Insurance 6
Corporate responsibility statement 7
Remuneration report 24Remuneration snapshot 27Link between company performance and remuneration 32The role of the People and Remuneration Committee 34Our remuneration philosophy and structure 36Short-term incentives 41Long-term incentives 44Details of remuneration 49Contract terms of managing director and group executives 55Remuneration of non-executive directors 60
Chief Executive Officer's and Chief Financial Officer's declaration 63Non-audit services 63Rounding off 63Lead Auditor's independence declaration 64
Directors' Report For The Year Ended 30 June 2012
The directors present their report together with the consolidated financial report of Perpetual Limited, ("Perpetual" or the "Company") and its controlled entities (the "consolidated entity"), for the year ended 30 June 2012 and the auditor's report thereon.
Page No.
1
For
per
sona
l use
onl
y

Directors
Peter B Scott, Chairman and Independent DirectorBE (Hons), M.Eng.Sc (Age 58)
Listed company directorships held during the past three financial years:- Stockland Corporation Limited from August 2005 to the present
Paul V Brasher, Independent Director BEc (Hons), FCA (Age 62)
Listed company directorships held during the past three financial years:- Incitec Pivot Limited from September 2010 to the present
Philip Bullock, Independent DirectorBA, MBA, GAICD, Dip. Ed. (Age 59)
Listed company directorships held during the past three financial years:- Healthscope Limited from September 2007 to October 2010- CSG Limited from August 2009 to the present
E Paul McClintock AO, Independent Director BA, LLB (Age 63)
Listed company directorships held during the past three financial years:- Intoll Management Limited (formerly Macquarie Infrastructure Investment Management Limited)
- Myer Holdings Limited from August 2012 to the present
Mr Bullock brings to the Board broad management experience in Australia and Asia in technology, sales and client management, product and brand management, distribution, marketing and talent development.
from May 2003 to December 2010
Directors' Report For The Year Ended 30 June 2012 (continued)
The directors of the Company at any time during or since the end of the financial year are:
Appointed as a Director in July 2005 and Chairman on 26 October 2010. Mr Scott was formerly the Chief Executive Officer of MLC, an Executive General Manager of National Australia Bank and held a number of senior positions with Lend Lease. He is Chairman of Sinclair Knight Merz Pty Limited and a director of Stockland Corporation Limited. Mr Scott is an advisory board member of Igniting Change. He is Chairman of Perpetual's Nominations Committee.
Mr Scott has more than 20 years of senior business experience in publicly listed companies and extensive knowledge of the wealth management industry.
Appointed Director in November 2009. Mr Brasher was formerly Chairman of the Global Board of PricewaterhouseCoopers International. He previously chaired the Board of PricewaterhouseCoopers' Australian firm and held a number of other senior management and client service roles during his career with the firm. Mr Brasher was Client Service Partner and/or Lead Engagement Partner for some of the firm's most significant clients. He also spent significant periods working with PricewaterhouseCoopers in the US and UK. Mr Brasher is currently Chairman of Incitec Pivot Limited and a Board member of Essendon Football Club. He is a member of Perpetual's Audit, Risk and Compliance Committee and People and Remuneration Committee.
Mr Brasher brings to the Board his local and global experience as a senior executive and director, particularly in the areas of strategy, audit and risk management and public company governance.
Appointed as a Director in April 2004. He is Chairman of Thales Australia, Medibank Private Limited, I-MED Australia Pty Ltd, COAG Reform Council and Chairman-Elect and director of Myer Holdings Limited. He has also served as Secretary to Cabinet and Head of the Cabinet Policy Unit in the Australian Government. He is Chairman of Perpetual’s Investment Committee and a member of the Nominations Committee and People and Remuneration Committee.
Mr McClintock brings to the Board over 30 years experience as a legal adviser, investment banker and senior policy adviser to Government and corporations.
On 8 August 2012, Mr McClintock advised the Perpetual Board that he intends to step down as a director at the conclusion of the company's Annual General Meeting on 1 November 2012.
Appointed Director in June 2010. Mr Bullock was formerly Vice President, Systems and Technology Group, IBM Asia Pacific, Shanghai, China. Prior to that he was CEO and Managing Director of IBM Australia and New Zealand. His career with IBM spanned almost 30 years in the Asia Pacific region. Mr Bullock is a director of CSG Limited. He also provides advice to the Federal Government, through his role as Chair of Australian Workforce and Productivity Agency, as a member of the Education Investment Fund, the Australia India Education Council and a member of the now concluded, National Resources Sector Employment Taskforce. He is a member of Perpetual's Investment Committee and People and Remuneration Committee.
2
For
per
sona
l use
onl
y

Directors' Report For The Year Ended 30 June 2012 (continued)
Directors (continued)
Elizabeth M Proust AO, Independent Director BA (Hons), LLB, FAICD (Age 61)
Listed company directorships held during the past three financial years:- Spotless Group Limited from June 2008 to 16 August 2012
Philip J Twyman, Independent Director BSc, MBA, FAICD (Age 68)
Listed company directorships held during the past three financial years:- IAG Limited from July 2008 to the present
Geoff Lloyd, Managing Director and CEOLLM (Distinction) (UTS), Adv. Mgt. Program (Harvard) (Age 44)
B. Bus. (Age 52)
Meredith J Brooks, Independent Director BA, FIAA (Age 50)
As an experienced international executive and director, Mr Twyman brings to the Perpetual Board his background in financial services, investment and wealth management together with considerable practical experience in relation to the audit and risk management issues faced by public companies in Australia and overseas.
Appointed as a Director in November 2004. He was formerly Group Executive Director of the London-based Aviva plc, one of the world’s largest insurance groups with extensive fund management and wealth management businesses. Mr Twyman was also formerly Chairman of Morley Fund Management, a director of the Quilter Group, a UK private client stockbroker, and a senior executive of AMP in Australia. He has also been Chief Financial Officer of General Accident plc, Aviva plc and the AMP Group. Since returning to Australia, Mr Twyman has joined the Board of IAG Limited, Medibank Private Limited and the local Boards of the Swiss Re Group. He is also Chairman of Overseas Council Australia. He is Chairman of Perpetual's Audit, Risk and Compliance Committee and a member of the Investment Committee and Nominations Committee.
In addition to her skills from her leadership roles in significant change management programs, Ms Proust brings to the Board her strengths in human resources, public affairs and strategy development, and her strong knowledge of board processes and governance through her many senior executive and board roles.
Appointed as a Director in January 2006. She was formerly Managing Director of Esanda, part of the ANZ Group. Prior to joining ANZ she was Secretary (CEO) of the Victorian Department of Premier and Cabinet and Chief ExecutiveOfficer of the City of Melbourne. She is currently Chairman of Nestlé Australia Ltd and Bank of Melbourne Board, and a director of Insurance Manufacturers of Australia Pty Ltd and Sinclair Knight Merz Pty Ltd. She is Chairman of Perpetual's People and Remuneration Committee and a member of Perpetual's Audit, Risk and Compliance Committee and Nominations Committee.
Appointed Managing Director and Chief Executive Officer in February 2012. Mr Lloyd joined Perpetual in August 2010 as Group Executive of Private Wealth and has led the development and implementation of the growth strategy for Private Wealth. He took on the additional responsibility of Head of Retail Distribution in September 2011. Mr Lloyd was previously General Manager, Advice and Private Banking at BT Financial Group (BTFG) following the merger with St George’s Wealth Management business. Prior to the merger, he led St George's entire wealth management portfolio and was a member of the St George Bank Group Executive reporting to the CEO. He has held many senior positions at BTFG, including Chief Legal Counsel and Head of the Customer and Business Services Division.
Mr Lloyd has over 20 year’s experience in the financial services industry and has an extensive understanding of the industry and demonstrated leadership skills.
Directors who resigned during the period
Chris Ryan, Managing Director
Appointed Chief Executive Officer and Managing Director in February 2011. Mr Ryan stepped down as Chief Executive Officer and resigned as Managing Director on 5 February 2012.
Appointed as a Director in November 2004. On 20 September 2011, Ms Brooks advised that she would not seek re-election as a director at the 2011 Annual General Meeting and her last day as a Director of the Perpetual Limited board was on 28 October 2011.
3
For
per
sona
l use
onl
y

Directors' Report For The Year Ended 30 June 2012 (continued)
Directors (continued)
Ivan D Holyman, Alternate Director BEc, LLB (Age 56)
Alternate Director
Roger L Burrows, Alternate Director BCom, CPA, MAICD (Age 48)
Company Secretaries
Joanne HawkinsBCom, LLB, Grad Dip CSP FCIS
Glenda Charles Grad. Dip. Corp. Gov. ASX Listed Entities, CSA (Cert)
Directors’ meetings
DirectorEligible to
attend Attended Eligible to attend Attended Eligible to
attend Attended Eligible to attend
Eligible to attend Attended
P B Scott 14 14 - - - - 2 - -
P V Brasher 14 14 7 7 - - - 7 7
M J Brooks1 6 4 2 2 2 1 - - -
P Bullock 14 14 - - 6 6 - 7 7
E P McClintock 14 13 - - 6 6 2 7 7
E M Proust 14 14 7 7 - - 2 7 7
P J Twyman 14 12 7 6 6 6 2 - -
C Ryan2 8 8 - - - - - - -
G Lloyd3 5 5 - - - - - - -
The number of directors’ meetings which directors were eligible to attend (including meetings of board committees) and the number of meetings attended by each Director during the financial year to 30 June 2012 were:
Alternate Director for David Deverall from May 2006 until his resignation on 23 February 2011 and appointed as Alternate Director for Chris Ryan on 8 April 2011 until his resignation on 5 February 2012. Mr Holyman was appointed as Alternate Director for Geoff Lloyd on 9 February 2012 and resigned as Geoff Lloyd's alternate on 6 July 2012.
2
Appointed as Alternate Director for Peter Scott on 27 October 2010. He joined Perpetual as Chief Financial Officer in March 2008. Mr Burrows has over 25 years of experience as a senior finance executive in a diverse range of industries, including property, financial services, IT services, professional services and manufacturing. Prior to working at Perpetual, Mr Burrows was with Lend Lease for 20 years, including 3 years as Group Chief Financial Officer.
2
Attended
Joined Perpetual in August 1994. She was appointed Assistant Company Secretary of Perpetual in 1999 and Deputy Company Secretary in 2009. Ms Charles has over 15 years experience in company secretarial practice and administration and has worked in the financial services industry for over 25 years.
Appointed Company Secretary in June 2003. Ms Hawkins is head of Perpetual's Legal, Risk and Compliance and Company Secretariat teams. Prior to joining Perpetual, Ms Hawkins was Assistant Company Secretary of Macquarie Bank and Ord Minnett and was Company Secretary of the National Bank of the Solomon Islands. Ms Hawkins has also worked as a solicitor and legal adviser in New Zealand.
Nominations Committee
Investment Committee
-
People & Remuneration Committee
2
2 Chris Ryan resigned as Managing Director and CEO on 5 February 2012.
3 Geoff Lloyd appointed as Managing Director and CEO on 5 February 2012.
-
Board
Audit, Risk and Compliance Committee
1 Meredith Brooks retired as a director of Perpetual Limited and a member of the Audit, Risk & Compliance Committee and Investment Committee on 28 October 2011.
-
-
2
-
4
For
per
sona
l use
onl
y

Directors' Report For The Year Ended 30 June 2012 (continued)
Principal activities
Review of operations
Net profit after tax attributable to equity holders of Perpetual Limited 62,031Add : Restructuring costs (after tax)1 20,886 6,388
8,053 (3,905)Less : Gain on disposal of business (after tax) (1,151) -Add: Costs incurred for sale of discontinued operations (after tax) 1,434Add : Impairment of property, plant and equipment (after tax) 2,349 -Add : Impairment of intangible assets (after tax) 10,149 14,694Add: Transformation costs (after tax) 1,703 -Add : Private equity proposal response costs (after tax) 3,086Less : Exact Market Cash Fund gains (after tax)2 (9,752)Add/(less): (Loss)/profit after tax attributable to non-controlling interests3 (2,479) 337Underlying profit after tax attributable to equity holders of Perpetual Limited 67,623 72,879
Dividends
Date of payment
Declared and paid during the financial year 2012Final 2011 ordinary 27 Sep 2011Interim 2012 ordinary 29 Mar 2012Total
Declared after end of year
Final 2012 ordinary 5 Oct 2012Total
# All franked dividends declared or paid during the year were franked at a tax rate of 30 per cent and paid out of retained earnings.
-
The reconciliation of net profit after tax to underlying profit after tax for the 2012 financial year is as follows:
30 June 201130 June 2012Reconciliation of underlying profit after tax
26,679
Total amount$'000
Cents per share
Franked# / unfranked
1 Restructuring costs (after tax) includes an amount of $8.4 million related to the closure of the operations in Dublin. Upon completion of the liquidation of the PIIML subsidiary in the 2013 financial year the foreign currency translation reserve related to these operations will be reclassified as a non-cash expense within profit and loss. As at 30 June 2012 the foreign currency translation reserve related to the operations in Dublin was $5.1 million. 2 The Exact Market Cash Fund gains in the prior comparative period represented the ongoing recovery of the unrealised losses incurred on the portfolio in the 2008 and 2009 financial years. As the majority of the unrealised losses had been recovered as at 30 June 2011, the financial performance of the Exact Market Cash Fund portfolio will now form part of Underlying profit after tax. The Exact Market Cash Fund gains (after tax) for the period ended 30 June 2012 were $1.4 million.
This table has been prepared in accordance with the AICD/Finsia principles for reporting underlying profit and ASIC's Regulatory Guide 230 Disclosing non-IFRS financial information. Underlying profit after tax attributable to equity holders of Perpetual Limited has not been reviewed by our external auditors, however the adjustments to net profit after tax attributable to equity holders of Perpetual Limited have been extracted from the books and records that have been audited.
3 (Loss)/profit after tax attributable to non-controlling interests within seed fund investments.
Dividends paid or provided by the Company to members since the end of the previous financial year were:
After balance date, the directors declared the following dividend:
16,792 4016,792
The financial effect of dividends declared after year end are not reflected in the 30 June 2012 financial statements and will be recognised in subsequent financial reports.
50 20,968
Franked
-
Add/(less) : Loss/(profit) on disposal and impairment of investments (after tax)
For the financial year to 30 June 2012, Perpetual reported a net profit after tax of $26.7 million compared to the net profit after tax for the financial year to 30 June 2011 of $62.0 million.
$'000$'000
61,197 Franked Franked 90 40,229
A review of operations is included in Management's Discussion and Analysis of Financial Condition and Results of Operations (MD&A) section of the Annual Report.
The principal activities of the consolidated entity during the financial year were funds management, portfolio management, financial planning, trustee, responsible entity and compliance services, executor services, investment administration and custody services and mortgage processing services.
5
For
per
sona
l use
onl
y

Directors' Report For The Year Ended 30 June 2012 (continued)
State of affairsThere were no significant changes in the state of affairs of the consolidated entity during the financial year.
Events subsequent to reporting dateThe following events have occurred since the end of financial year:
i. Sale of Perpetual Lenders Mortgage Services (PLMS)
ii. IT Outsourcing
Likely developments
Environmental regulation
Indemnification of directors and officers
Insurance
The consolidated entity is not aware of any material non-compliance in relation to these licence requirements during the financial year.
The consolidated entity has determined that it is not required to register to report under the National Greenhouse and Energy Reporting Act 2007, which is Commonwealth environmental legislation that imposes reporting obligations on entities that reach reporting thresholds during the financial year.
On 1 August 2012 Perpetual completed the sale of its mortgage processing business Perpetual Lenders Mortgage Services ('PLMS') to FAF International Property Services (Australia) Pty Limited, an affiliate of First Mortgage Services ('FMS'). The PLMS business is classified as a discontinued operation, refer to Note 7 of the financial statements.
Perpetual's announcement to the market on 25 June 2012 included an update on the Company's plan to outsource IT as part of the 'Transformation 2015' strategy. On 29 August 2012, Perpetual entered into an IT Outsourcing arrangement with an external service provider. The arrangement is for a base period of 5 years and the total contract value for Infrastructure and Application services is $68 million over that period. Refer to Note 15(a) Assets and liabilities held for sale for further details.
In accordance with the provisions of the Corporations Act 2001 the company has a directors and officers' liability policy which covers all directors and officers of the consolidated entity. The terms of the policy specifically prohibit disclosure of details of the amount of the insurance cover and the premium paid.
Further information about likely developments in the operations of the consolidated entity and the expected results of those operations in future financial years has not been included in this report because disclosure of the information would be likely to result in unreasonable prejudice to the consolidated entity.
The company and its controlled entities indemnify the current directors and officers of the companies against all liabilities to another person (other than the company or a related body corporate) that may arise from their position as directors of the consolidated entity, except where the liabilities arise out of conduct involving a lack of good faith. The company and its controlled entities will meet the full amount of any such liabilities, including costs and expenses.
The consolidated entity acts as trustee or custodian for a number of property trusts, which have significant developments throughout Australia. These fiduciary operations are subject to environmental regulations under both Commonwealth and State legislation in relation to property developments. Approvals for commercial property developments are required by state planning authorities and environmental protection agencies. The licence requirements relate to air, noise, water and waste disposal. The responsible entity or manager of each of these property trusts is responsible for compliance and reporting under the government legislation.
Other than the events noted above, the Directors are not aware of any other event or circumstance since the end of the financial year not otherwise dealt with in this report that has or may significantly affect the operations of the consolidated entity, the results of those operations or the state of affairs of the consolidated entity in subsequent financial years. Events subsequent to balance sheet date are set out in Note 38 to the consolidated Financial Statements.
6
For
per
sona
l use
onl
y

Corporate Responsibility Statement Perpetual’s Board and management have a long-standing commitment to good corporate governance. The success of Perpetual’s core businesses – the management of other people’s money and the safekeeping of assets and securities – relies on a reputation of absolute trustworthiness. This statement sets out our approach to corporate governance. Copies of or summaries of documents that are underlined like this in this Corporate Responsibility Statement are available on our website at www.perpetual.com.au ASX Corporate Governance Council’s Corporate Governance Principles and Recommendations At Perpetual, good corporate governance includes a genuine commitment to the ASX Corporate Governance Council’s Principles and Recommendations (ASX Principles).
The Board considers that it complies with all the ASX Principles, and has done so throughout the reporting period. A table setting out each Principle and the location of Perpetual’s associated disclosure in this Corporate Responsibility Statement is located on pages 22 to 23.
1. Role of the Board The Board has its own Board Charter which sets out the functions and responsibilities reserved to the Board and delegations made to management. The Board delegates day-to-day responsibility for the management and operation of the company to the Managing Director but remains responsible for overseeing management’s performance.
The Board’s specific responsibilities include:
reviewing and approving Perpetual’s strategy selecting the Managing Director and approving the appointment and removal of Group
Executives setting the remuneration of the Managing Director
aligning remuneration outcomes to Perpetual’s financial soundness and risk management
framework setting the non-executive director remuneration within shareholder approved limits
setting Perpetual’s values and standards
monitoring business performance and the Perpetual Group’s financial position
overseeing the integrity of the Perpetual Group’s financial accounts and reporting
monitoring the Perpetual Group’s investment activities and investment performance
monitoring that significant business risks are identified and managed effectively
ensuring that the performance of the Board, Managing Director and senior management
are regularly assessed. The Board Charter is reviewed annually to ensure the balance of responsibilities remains
7
For
per
sona
l use
onl
y

appropriate to Perpetual. The roles and responsibilities of Perpetual’s Board and management are established in accordance with ASX Principle 1.
Each year, the Board’s People and Remuneration Committee oversees the performance review process for the Managing Director and Group Executives. The Group Executives report directly to the Managing Director. The Managing Director’s performance objectives are set by the Board at the beginning of each financial year. At the end of the financial year, the Chairman of the Board reviews the Managing Director’s performance against his goals with input from all Board members. The Managing Director sets performance objectives for each Group Executive at the beginning of each financial year. The Board’s People and Remuneration Committee reviews the performance objectives set for the Group Executives. The Managing Director carries out the performance review of each Group Executive against their objectives with input from appropriate stakeholders including board members. In 2012, performance reviews of the Managing Director and each Group Executive were conducted in accordance with this process. Group Executives and Directors who are new to Perpetual participate in Perpetual’s orientation program and an additional induction process tailored to their own responsibilities. Perpetual also has an orientation program for all new employees covering Perpetual’s history, business strategy, values, risk and compliance obligations and performance management. 2. Board structure The Board currently comprises seven directors: six Non-Executive Directors and the Managing Director. The roles of Chairman and Managing Director are separate. The Chairman is responsible for leadership of the Board and ensuring it performs its role and functions. He is also responsible for facilitating the effective contribution of directors by ensuring that each director fully participates in the Board’s activities. Details of the background, experience, professional skills and expertise and period in office of each director are set out on pages 2 to 4 of the Directors’ Report. The structure of the Board accords with ASX Principle 2. 3. Director independence The Board considers all Non-Executive Directors to be independent directors, including the Chairman.
In assessing the independence of each director, the Board considers, on a director-by-director basis, whether the director has any relationships that would materially affect his or her ability to exercise unfettered and independent judgment in the interests of Perpetual’s shareholders. Consistent with the emphasis on ‘substance over form’ advocated by the ASX Principles, Perpetual takes a qualitative approach to materiality rather than setting strict quantitative thresholds, and considers each director’s individual circumstances on its merits.
The independence of each Director is formally reviewed each May and at any time when a change occurs that may affect a Director’s independence. Non-Executive Directors also formally advise the Chairman of any relevant information, and update the Chairman if their circumstances change at any time.
8
For
per
sona
l use
onl
y

In determining the independence of individual Directors, the Board has considered the relevant elements of the definition of independence adopted by the Board. These elements include whether the Director:
• has a substantial shareholding in Perpetual or is an officer of a company which has a substantial shareholding in Perpetual (or is otherwise associated with a substantial shareholder of Perpetual)
• has been employed by the Perpetual Group at any stage and in any capacity within the previous three years
• has been involved with the Perpetual Group in a material advising or consulting role at any time within the previous three years
• is (or is associated with) a material supplier or customer of the Perpetual Group • is in a material contractual relationship with the Perpetual Group (other than as a
director) Paul Brasher receives post-termination benefits from his former employer, PricewaterhouseCoopers (PwC). PwC has been appointed as Perpetual’s remuneration consultant and occasionally provides consulting services to Perpetual, which are not considered material in nature or quantity. The Board does not believe that this appointment of PwC affects the independence of Paul Brasher. From time to time, funds managed by the Perpetual Group may take holdings, including substantial holdings in securities of listed entities. Perpetual Directors may also serve as non-executive directors on the boards of these entities. This factor alone is not considered to impact Director independence as decisions as to stock selection are not made by the Board of Perpetual but by Perpetual’s asset management team in accordance with client or fund investment mandates.
It is the Board’s view that no Directors currently hold other positions that materially affect their ability to exercise independent judgement in the interests of Perpetual shareholders.
4. Contracts with Directors In the 2012 financial year, no Director disclosed a material personal interest in any contract entered into by any member of the Perpetual Group other than the remuneration paid to the Directors as outlined in this Annual Report and the deeds of indemnity described below.
5. Indemnity of directors and officers Perpetual has entered into deeds to indemnify directors and officers of the Perpetual Group, to the extent permissible by law, from all liabilities incurred as directors or officers. Liabilities to the Perpetual Group, and liabilities that arise out of conduct that was not in good faith, are not covered in the indemnities. In addition, Perpetual has Directors’ and Officers’ insurance against claims Perpetual may be liable to pay under these indemnities. This policy insures directors and officers directly.
6. Board access to information and independent advice Directors receive regular updates on changes in the regulatory environment affecting Perpetual and the financial services industry. Directors are also encouraged to attend relevant conferences and seminars.
Non-Executive Directors regularly confer without management present and the Chairman presides over these sessions. All Directors have unrestricted access to company records
9
For
per
sona
l use
onl
y

and information. Perpetual has a formal policy allowing the Board or an individual Director to seek independent professional advice at the Perpetual Group’s expense, provided that the Director has obtained the prior approval of the Chairman, or if the relevant director is the Chairman, the prior approval of a majority of Perpetual’s Non-Executive Directors. In the 2012 financial year, no Director sought professional advice under this policy.
7. Nomination, appointment, re-election and retirement of directors Consistent with ASX Principle 2, the Board has a Nominations Committee with its own Terms of Reference. The Nominations Committee is made up of a majority of independent directors (and is chaired by an independent director). In accordance with its Terms of Reference, it is made up of the Chairman of the Board, the chairman of the Audit, Risk and Compliance Committee, the chairman of the Investment Committee and the chairman of the People and Remuneration Committee.
The Nominations Committee is responsible for reviewing the size and structure of the Board. The aim is to ensure that the Board comprises an appropriate balance of skills, diversity, experience and independence in order to enhance board performance and maximise value for shareholders. The mix of skills and diversity which the Board is looking to achieve in its membership includes the following:
• Knowledge of the financial services industry (Australia and /or International) • Management Skills • Financial expertise • Funds Management Experience • Investment Experience • Public Company Governance • Risk Management • Marketing and Communications • Strategic Planning and Change Management • IT knowledge • M&A and Transactions • Sales and Distribution
A summary of the experience of each Director can be found at pages 2 to 4. The Nominations Committee also takes diversity considerations into account when recommending any new appointment to the Board (see ‘Diversity’ below for Perpetual’s approach to diversity). The Nominations Committee is responsible for administering Perpetual’s Policy on the Appointment of Directors, which sets out the selection process and selection criteria for identifying candidates to fill board vacancies. Consistent with the ASX Principles regarding disclosure of board selection processes, the Policy is disclosed in full on our website. If a Board vacancy arises, the Nominations Committee will conduct a search in accordance with the Policy and the Board will appoint the most suitable candidate, having regard to the recommendation of the Nominations Committee. External consultants may be engaged to assist with the identification of appropriate candidates. A Director appointed to fill a casual vacancy must stand for election at the next Annual General Meeting.
Upon appointment, new Directors receive a detailed letter of appointment and participate in a comprehensive induction program designed to familiarise them with Perpetual’s business, strategy, operations, Group Executives and senior management team. Directors who have been in office without re-election for three years since their last appointment must retire and seek re-election at the company’s Annual General Meeting. In order to continue to refresh the composition of the Board, Directors agree not to seek re-election after three terms of three years unless the Board requests them to do so. The nine year principle does not displace shareholders’ rights to vote on the appointment and
10
For
per
sona
l use
onl
y

removal of directors, as set out in the ASX Listing Rules and the Corporations Act 2001 (Cth) (Corporations Act).
8. Meetings of the Board In the 2012 financial year, the Board met 14 times, including a strategic planning session. The Board receives performance, operations and risk reports from the Managing Director, the Chief Financial Officer, and the heads of each business division. The Board also receives reports and updates on strategic issues. In addition, Directors spend time reading and analysing board papers and reports submitted by management and they engage in regular informal discussions with management. The views of the Chairman and the Non-Executive Directors are canvassed regularly by the Managing Director and the Group Executive on a range of strategic and operational issues. The Chief Financial Officer and Company Secretary attend all board meetings. Other Group Executives and senior management attend board and committee meetings to report on particular issues and to engage in discussion on these issues. Senior executive attendance at board and committee meetings is subject to the overriding requirement that no senior executive will be directly involved in deciding their own remuneration. Attendance of Directors at board and committee meetings is set out in the Directors’ Report on page 4. 9. Board committees A key component of the Board’s governance structure is its four Board committees. Each committee has a written charter known as its Terms of Reference which is accessible on the company’s website under the ‘Corporate Responsibility’ heading.
All committees except the Nominations Committee generally meet at least quarterly, and more frequently if required. The Nominations Committee meets at least twice a year. Aside from the Nominations Committee, the Managing Director attends all committee meetings except where matters relating to his own remuneration and performance are discussed.
The qualifications and skills of the members of each committee are set out on pages 2 to 4 of the Directors’ Report.
The membership and key responsibilities of each of the Board committees (as at the date of this report) are set out below.
Audit, Risk and Compliance Committee Members: Philip Twyman (Chairman), Elizabeth Proust and Paul Brasher.
Changes to the committee since last Report: Meredith Brooks ceased to be a member of the committee in October 2011. The committee’s role is to oversee the Perpetual Group’s accounting policies and practices, the integrity of financial statements and reports, the scope, quality and independence of Perpetual’s external audit arrangements, the monitoring of the internal audit function, the effectiveness of the risk management framework and the adequacy of insurance programs, and to report on these matters to the Board. This committee is also responsible for monitoring overall legal and regulatory compliance.
All members of the committee (of which there must be at least three) are independent non-executive directors and are required to be financially literate. At least one member must have accounting or finance related expertise. Members are also required to have an
11
For
per
sona
l use
onl
y

understanding of the financial services industry in which Perpetual operates. The Chairman of the committee cannot be the Chairman of the Board.
Investment Committee
Members: Paul McClintock (Chairman), Philip Bullock, and Philip Twyman
Changes to the committee since last Report: Meredith Brooks ceased to be a member in October 2011. The committee’s role is to monitor management to ensure that it has in place, and carries out, appropriate investment strategies and processes for the investment activities conducted both for third parties and on the Group’s own behalf. This committee does not select stocks for individual Perpetual funds as stock selection is carried out by Perpetual’s asset management team. All members of the committee are independent non-executive directors.
People and Remuneration Committee
Members: Elizabeth Proust (Chairman), Paul McClintock, Paul Brasher and Philip Bullock
Changes to the committee since last Report: Nil. The committee’s role is to monitor the Perpetual Group’s people and culture policies and practices, including the diversity of Perpetual’s workforce, and to assist the Managing Director to implement fair, effective and market competitive remuneration and incentive programs designed to retain high calibre employees and which demonstrate a clear relationship between performance and remuneration. The committee is authorised to directly engage external remuneration advisers and, after obtaining their advice as and when appropriate, the committee recommends remuneration for non-executive directors, the Managing Director, the Group Executives and other senior managers, to the Board. The committee also reviews succession and career plans for key executives. All members of the committee are independent non-executive directors. Nominations Committee Members: Peter Scott (Chairman), Paul McClintock, Elizabeth Proust and Philip Twyman.
Changes to the committee since last Report: Nil. The committee’s role is to recommend to the Board nominees for appointment/election (including re-election of existing board members) and to review board succession plans. At least annually, the committee reviews the size and structure of the Board to ensure that it comprises appropriately qualified and experienced people. This committee is also responsible for the formal evaluation of the Board’s performance as a whole. All members of the committee are independent non-executive directors.
10. Board performance The Board undertakes ongoing self-assessment as well as a formal annual review of the performance of the Board, individual Directors and its committees. In 2012, the Board engaged an external consultant to conduct a review of the performance of the Board, its committees and individual Directors which has concluded. The Board review process aims to ensure that individual Directors continue to contribute effectively to the Board’s performance and that the Board as a whole and its committees continue to function effectively.
12
For
per
sona
l use
onl
y

11. Company Secretaries The Board has access to the services and advice of Joanne Hawkins, the Company Secretary, and Glenda Charles, Deputy Company Secretary. The Company Secretary is accountable to the Board on governance matters. Details of the experience and qualifications of Joanne Hawkins and Glenda Charles are set out in the Directors’ Report on page 4.
12. Perpetual’s subsidiary Boards
The boards of Perpetual’s subsidiaries are generally made up of executive directors. The exceptions include Perpetual Superannuation Limited, which carries out Perpetual’s superannuation activities and Queensland Trustees Pty Limited, which acts as trustee for Perpetual’s share plans. The boards of these companies include non-executive directors. Perpetual’s corporate governance policies are applied to its subsidiaries but adapted to reflect the size and nature of each subsidiary’s operations. The subsidiary boards are a key component of Perpetual’s Risk Management Framework. 13. Ethical conduct Perpetual has a Code of Conduct which draws from and expands on Perpetual’s Values. The Code of Conduct applies to all Directors, executives and employees and is designed to assist them in making ethical business decisions. It is based on the following principles: • acting with integrity • managing conflicts of interests appropriately • upholding the spirit as well as the letter of the law • commitment to our clients and consistently delivering
shareholder value • respecting privacy and confidentiality • maintaining a fair and safe work environment • protecting those who report wrongdoing. Additional policies deal with a range of ethical issues such as the obligation to maintain client confidentiality and to protect company information, the need to make full and timely disclosure of any price sensitive information and to provide a safe workplace for employees, which is free from discrimination. The Code of Conduct and associated policies are in keeping with ASX Principle 3. Perpetual’s Company Secretary is Perpetual’s Code of Conduct ombudsman and is available to all staff for a confidential discussion in relation to Code of Conduct matters. All new Perpetual employees are required to familiarise themselves with the Code of Conduct as part of their induction training requirements. Perpetual has a Whistleblowing Policy to protect employees who make reports in good faith of wrongdoing, prejudice or disadvantage. As part of Perpetual’s Whistleblowing Policy, a third party has been engaged to provide an independent and confidential hotline for Perpetual employees who prefer to raise their concern with an external organisation. 14. Diversity Perpetual has a strong commitment to diversity and recognises the value of attracting and retaining employees with different backgrounds, knowledge, experiences and abilities. Perpetual has implemented a number of initiatives to promote an inclusive culture and an environment that values individual differences, including the creation of a Diversity Policy and Diversity Strategy. Our Diversity Strategy focuses on embedding initiatives that align to the following four strategic priorities:
13
For
per
sona
l use
onl
y
• Representation of women in senior management roles • Meeting the identified needs of employees at different life stages – Baby Boomer,
Generation X and Generation Y • Flexibility for employees • Ethnicity and cultural diversity
Gender equality at all levels of the organisation is a key component of our Diversity Strategy. To encourage greater representation of women at senior levels of the organisation, Perpetual has undertaken and continues to develop initiatives targeting an improvement in gender diversity, including the refinement and improvement of our recruitment processes and expansion of career and leadership development, mentoring, networking forums and knowledge sharing opportunities available to female employees. Perpetual’s People & Remuneration Committee is responsible for overseeing the Diversity Policy generally and making recommendations to the Board with respect to appropriate measurable objectives. This Committee also has other key diversity-related responsibilities including reviewing and reporting to the Board on Perpetual’s measurable objective(s) (and its progress towards achieving them) and reviewing and reporting to the Board on the relative proportion of men and women employed by Perpetual. Both reviews must occur at least annually. The Committee also gives consideration to any gender diversity targets when reviewing both succession plans for key executive positions and career development plans in place for key executives. In accordance with Perpetual’s Diversity Policy, from time to time Perpetual establishes “measurable objectives” for achieving gender diversity throughout the Group. Perpetual’s current measurable objective is to achieve 38% representation of women in senior management by 2015. As at 23 August 2012:
a. the Perpetual Group has 29% representation of women in senior management b. 52% of the Perpetual Group’s employee population are female c. There is one female director on the Perpetual Board
Perpetual’s progress towards the 38% diversity target has proved challenging in recent months due to exiting and outsourcing areas of the business where there have been predominantly higher proportions of females at senior manager and above levels. However, there has been a continued focus on representation of women, particularly at the Executive level and by the end of the 2012 calendar year Perpetual expects to have 29% representation of women on the Executive Committee, in comparison to 20% at the end of 2011. Over the course of the next 12 months, Perpetual will review the measurable objective, and the progress made against the measurable objective, to ensure it remains relevant and ambitious given recent changes to the current strategy and operating model. As a commitment to ensuring that diversity remains a strategic priority for Perpetual on an on-going basis, Perpetual has established a Diversity Council, chaired by the CEO and includes representatives from each of the business units who serve as Council Members, encouraging shared accountability for Diversity. As a business imperative, the members of the Executive Committee act as subsidiary members of the Diversity Council and are accountable for supporting decisions made by the Council. In addition, Perpetual’s Executive Committee regularly reviews “diversity scorecards” at the organisation and business unit level. The diversity scorecard outlines diversity related metrics, the results of which can be used to measure diversity objectives.
14
For
per
sona
l use
onl
y

15. Risk Management
The Board is committed to effective risk management and all Group Executives are accountable for managing risk within their area of responsibility. They are also required to manage risk as part of their business objectives with risk management integrated across business processes. The Risk Group consists of risk management professionals and lawyers who provide the framework, tools, advice and assistance to enable management to effectively identify, assess and manage risk. Consistent with ASX Principle 7, Perpetual’s Risk Management Framework is designed to manage the company’s material business risks. The framework consists of programs and policies which are designed to address key areas of risk including strategic, financial, operational, investment, people and legal compliance risk. Through monitoring, the Board and its committees are provided with independent reporting of the effectiveness of Perpetual’s management of its material business risks. In addition, the Board reviews the company’s key risks regularly through the Key Risk Assessment process, further detailed in the Risk Management Framework. Perpetual also has an internal audit function. The General Manager Internal Audit reports to the Audit Risk and Compliance Committee as well as to the Chief Financial Officer and is independent from the external auditor. Internal Audit provides independent assurance over the effectiveness of Perpetual’s risk management, internal control, and governance processes. The Internal Audit team does not make management decisions or engage in other activities which could be perceived as compromising its independence. Each of the Chief Financial Officer, General Manager Internal Audit and General Manager Legal and Risk has the right to, and do, meet with the Audit Risk and Compliance Committee, or its Chairman, without other management present. The Managing Director and Chief Financial Officer report to the Board on the effectiveness of Perpetual’s management of its material business risks in accordance with ASX Principle 7. The Board received this report in 2012 together with the statements outlined in section 16 below. 16. Financial Reporting The Board has adopted policies designed to ensure that Perpetual’s financial reports:
• are true and fair • meet high standards of disclosure and audit integrity • when read with Perpetual’s other reports to shareholders, provide all material information
necessary to understand Perpetual’s financial performance and position. In accordance with section 295A of the Corporations Act, the Board requires that, in respect of each financial year, the Managing Director and Chief Financial Officer provide a written declaration that, in their respective opinions: • the financial records of the Company have been properly maintained in accordance with
section 286 of the Corporations Act and • the financial statements and notes comply with the accounting standards and give a true
and fair view of the financial position and performance of the Company and consolidated entity
15
For
per
sona
l use
onl
y

To underpin the integrity of Perpetual’s financial reporting and risk management framework, it is also Perpetual’s practice for the Managing Director and Chief Financial Officer to state to the Board in writing that, in their respective opinions: • the statements made regarding the integrity of the financial statements are founded on a
sound system of risk management and internal compliance and control systems which implement the policies adopted by the Board of Directors
• the risk management and internal compliance and control systems, to the extent they
relate to financial reporting, are operating effectively and efficiently, in all material respects, based on the risk management framework adopted by the Company
• the Company’s material business risks (including non-financial risks) are being
managed effectively
The statements referred to above are supported by written statements from senior management, detailed financial analysis and Perpetual’s Risk Management Framework. As previously noted, the Chief Financial Officer is present when the Board considers financial matters, as he attends all board meetings.
The statements made by the Managing Director and Chief Financial Officer are consistent with ASX Principle 7.3. In 2012, the Board received the statements referred to above.
17. Audit process The Perpetual Group’s financial reports are subject to an annual audit by an independent, professional auditor, who also reviews the Group’s half yearly financial statements. The Audit Risk and Compliance Committee oversees this process on behalf of the Board, in accordance with its Terms of Reference.
The external auditor attends each meeting of the committee, and it is the committee’s policy to meet with the auditor for part of these meetings without management present. The committee chairman meets with the audit partner at least once every quarter, also in the absence of management. The auditor has a standing invitation to meet with the committee, its Chairman or with the Board’s Chairman in the absence of management. The auditor attends the Board meetings at which the annual and half yearly financial reports are adopted, and at these meetings the Non-Executive Directors have an opportunity to meet with the auditor without management present.
The current external auditor is KPMG. The lead audit partner for 2012 was Andrew Yates and the engagement partner was Brendan Twining. This is the third year that Mr Yates has been acting as lead audit partner, and Mr Twining has acted as engagement partner for five years.
18. Auditor independence The Board has policies in place relating to the quality and independence of Perpetual’s external auditor. These policies include:
• a formal review of the appointed auditor every 5 years, to be timed during the middle of the lead partner’s tenure. The results of the review are reported to the Audit Risk and Compliance Committee and the Board
• an annual review of the external audit firm’s fees and performance, as well as the
independence of the external audit firm, the results of which are reported to the Audit Risk and Compliance Committee and the Board
• the lead audit partner on each Perpetual audit must be rotated at least every five years,
with a two year gap before a partner may be reappointed
16
For
per
sona
l use
onl
y

• former audit partners and audit firm employees involved in our audit cannot become
directors or employees of Perpetual Group companies for at least two years • the external audit firm is prohibited from providing non-audit services that may materially
conflict with its ability to exercise objective and impartial judgment on issues that may arise within Perpetual’s audit, such as:
- corporate financial services including mergers and acquisitions and due diligence on potential targets - tax planning and strategy - senior management recruitment - significant valuations and appraisals - design and implementation of financial information systems
The Audit, Risk and Compliance Committee is responsible for making recommendations on the annual engagement of the external auditor. In 2012, the greater part of fees paid to KPMG for work other than audit of Perpetual Group accounts was for audit services in relation to investment funds of which Perpetual companies are the responsible entity, manager or trustee. It is the Board’s view that these services are consistent with KPMG’s appointment as auditor and are not services of a kind that might impair their impartial judgement in relation to the Perpetual Group’s audit.
19. Market Disclosure Perpetual has a Continuous Disclosure Policy to ensure compliance with its continuous disclosure obligations under ASX Listing Rule 3.1 and the Corporations Act. The Managing Director, Chief Financial Officer, and Company Secretary are members of the Continuous Disclosure Committee responsible for deciding information that is required to be disclosed to the ASX. Perpetual ensures that all senior management give regular sign-offs as to whether there are matters that require disclosure to the ASX. The Board considers its disclosure obligations at each scheduled board meeting. Perpetual’s Continuous Disclosure Policy contains the matters recommended by ASX Principle 5.
Perpetual’s website includes copies of announcements lodged with the ASX by Perpetual. Consistent with amendments to the ASX Principles in 2010, advance notification of scheduled analyst briefings are provided to shareholders and the briefings are webcast. These can be found on the company’s website along with media releases, briefings and annual reports for the last five years.
20. Shareholders The Board is committed to ensuring that shareholders are fully informed of material matters that affect Perpetual’s position and prospects. It seeks to accomplish this through a strategy which involves the effective dissemination of information to shareholders using various mediums, including, in particular, technology. Key information released to shareholders includes:
• the Half Year Results released in February each year • the Full Year Results released in August each year • the Annual Report released in September each year • the Chairman’s and Managing Director’s addresses to the Annual General Meeting • market briefings and other significant information (which are posted on Perpetual’s
website as soon as it is disclosed to the market) Perpetual also publishes an “event calendar” on its website which sets out important dates (for example, the date Perpetual releases its full year results and the date of its Annual
17
For
per
sona
l use
onl
y

General Meeting). Shareholders can submit their email addresses if they wish to receive a reminder of these dates. Perpetual will hold its Annual General Meeting in November and a copy of the notice of Annual General Meeting is posted on the Perpetual website as well as being provided directly to shareholders via their nominated means of communication. The Board encourages shareholders to attend the Annual General Meeting or to appoint a proxy to vote on their behalf if they are unable to attend. The formal addresses at the Annual General Meeting are webcast for those shareholders who are unable to be present. In accordance with the Corporations Act, a representative of the external auditor, KPMG, attends the Annual General Meeting for the purpose of answering shareholder questions about the audit report and audit process.
Perpetual periodically holds briefings for institutional shareholders and analysts that aim to increase the flow of information and engagement with shareholders and analysts outside of reporting season and provide a greater insight into revenue building strategic initiatives. A webcast of these “Business Updates”, as well as copies of any other investor presentations held from time from time, are made available on Perpetual’s website. 21. Remuneration Perpetual has formed a People and Remuneration Committee consistent with ASX Principles 8.1 and 8.2 and ASX Listing Rule 12.8. Its role is set out on page 12 of this report. Details of board and executive remuneration are set out in the remuneration report which commences on page 24. In accordance with the ASX Principles, the structure of Non-Executive Director remuneration is clearly distinguished from that of executive Directors and senior management. In particular, Non-Executive Directors do not receive performance-related remuneration and are not entitled to receive performance shares, rights or options over Perpetual shares. Non-Executive Directors are not entitled to receive any retirement benefits, other than superannuation in accordance with Perpetual’s statutory superannuation obligations. 22. Trading in securities by Directors and Employees Perpetual has a Trading Policy that complies with the requirements of ASX Listing Rule 12.12. This was lodged with the ASX in 2010 and is available on the company’s website. Perpetual’s overriding policy in respect of personal trading is that there should be no dealings in the company’s shares by any director or employee who is in possession of price sensitive information or where the dealing is for short-term or speculative gain. Provided they do not have price sensitive information, directors and employees are permitted to deal in the company’s shares only in specified one-month trading windows. The Trading Policy requires prior approval for any share dealings from the Chairman in the case of Directors, from a nominated Director in the case of the Chairman and from the Managing Director in the case of senior executives. Prior approval is also required from the Managing Director or Company Secretary in the case of certain employees who are more likely to have access to information that is potentially price sensitive due to their role with the company.
The policy also prohibits non-executive directors and employees from entering into ‘hedging arrangements’ in relation to Perpetual securities. Perpetual employees cannot trade in financial products issued over Perpetual securities by third parties or trade in any associated products which limit the economic risk of holding Perpetual securities. Perpetual employees and directors are prohibited from margin lending in relation to Perpetual securities.
18
For
per
sona
l use
onl
y

23. Stakeholders
At Perpetual, we take advantage of opportunities to build our social, environmental and financial performance in ways that enhance our core values and business sustainability. We draw on our people’s experience, knowledge and expertise in investing, governance, financial advice and trusteeship to contribute positively to the community. We focus on activities where we can add the most value to society while minimising our environmental impact – doing the greatest good while leaving the smallest footprint. We are committed to doing our part to enrich our community by: • having the highest standards of corporate governance and business probity • investing responsibly and encouraging sustainable business practices • contributing time and money to charities which we know have a track record of delivering
on their promises and • reducing the environmental impact of our operations Some examples of how we are achieving these goals include: Investment Long-Term Investment Approach Perpetual’s asset managers are ‘value’ managers who focus on quality. Their initial investment criteria include:
• the strength of the company’s balance sheet • whether the company can demonstrate a recurring earnings stream • the quality of the business and • the soundness of management running the company We believe this approach holds corporate Australia to high standards and encourages behaviour in the long term interests of shareholders. Signatory to the United Nations Principles for Responsible Investment Perpetual is a signatory to the United Nations Principles for Responsible Investment (PRI) representing a commitment to take environmental, social and governance factors into account in our investment decision-making and ownership practices. PRI is about institutional investors encouraging sustainable business practices, which is aligned to Perpetual’s long term view. Member of the Responsible Investment Association The Responsible Investment Association is the peak industry body for professionals working in responsible investment in Australasia. The Responsible Investment Association’s purpose is to provide training, professional development, events, research and policy initiatives that will promote stable markets, maximise financial returns and create positive environmental, social and governance outcomes. Member of the Investor Group on Climate Change The Investor Group on Climate Change (IGCC) was established in 2005 and represents institutional investors, with funds under management of approximately $700 billion, and others in the investment community interested in the impact of climate change on investments. The IGCC aims to ensure that the risks and opportunities associated with climate change are incorporated into investment decisions for the ultimate benefit of individual investors.
19
For
per
sona
l use
onl
y

Social Philanthropy and the Perpetual Foundation
Perpetual has been managing charitable money for over 120 years with more than 400 individual trusts with a total of $1.1 billion in funds under management. In 1998, we established the Perpetual Foundation, which brings the generosity of individuals and organisations together with our resources and expertise in managing charitable funds.
The Philanthropy team provides support to the non-profit sector via thought leadership forums, regular IMPACT philanthropy newsletters, and facilitating a number of knowledge sharing opportunities. The Perpetual Foundation has also sponsored sector research including research at the Australian Centre for Philanthropy and Non-Profit Studies and also provided over 300 scholarships for volunteer directors of charitable non-profit entities to attend the Australian Institute of Company Directors Non Profit Directors Course through the Australian Scholarships Foundation. Staff Giving Perpetual’s Staff Giving program encourages staff to donate to charities in a tax-effective way, with all donations being matched dollar-for-dollar by Perpetual. In addition to monetary donations, Perpetual’s Staff Giving program also encourages employees to volunteer their time to charitable causes. Pro Bono Legal Assistance Perpetual’s legal team has partnered with the Cancer Council NSW to provide pro bono legal assistance to people with cancer who are unable to afford legal assistance themselves. This initiative aims to alleviate some of the difficulties faced by people through this difficult time, and it has also fostered a great sense of achievement and pride within Perpetual’s legal team. Political Donations Perpetual does not make political donations. Environmental Carbon Disclosure Project Perpetual has responded to the Carbon Disclosure Project (CDP) surveys on six occasions and has been included in the Climate Disclosure Leadership Index (Australia and New Zealand) on three occasions. Our People
Perpetual is committed to attracting, developing and engaging employees in a culture that is underpinned by Perpetual’s Values. Perpetual’s inclusive culture is based on team work and collaboration and allows high performing employees to excel and be rewarded for their success. There is a focus on developing leaders from within Perpetual and on employee engagement. Employee engagement is assessed annually and results are used to develop future people initiatives. The wellbeing of employees is supported by financial, insurance, health, fitness and work / life balance employee benefits. Some of the policies that support employee work / life balance include:
• Contribution Leave policy which provides an additional week of ‘Contribution Leave’ to allow employees to make a difference to their community, family or personal well-being. Employees are only eligible to take Contribution Leave if their Annual Leave balance is less than 10 days. This helps Perpetual manage its accrued leave liability
20
For
per
sona
l use
onl
y

and support risk management by encouraging employees to take their leave entitlement
• Purchased Leave policy which enables employees to apply for up to 4 weeks of
additional leave to spend more time with family, for holidays or greater work / life balance
• Sabbatical Leave and Leave Without Pay policies which allow employees to take an
extended period of unpaid leave where they may choose to take time out to be with their family, travel overseas or undertake further study
• Working From Home policy which allows employees to work from home for greater
work / life balance • Flexibility Policy which enables employees to achieve work / life balance and meet
parental or carer responsibilities. Perpetual has a tailored flexible working program to support managers and employees in managing requests for flexibility which included training all managers in managing flexibility.
Perpetual aims to meet the needs of employees at different stages of their lives and parental leave benefits are available for both men and women. This not only includes greater access to flexible working options but also 12 weeks’ paid maternity leave and a return to work bonus payable to the Primary Care Giver. A Proud Parents Program has also been introduced to support new parents as they transition back to work. All of the parental leave benefits have been added to a dedicated page on the Perpetual intranet and employees are also provided with a Parental Leave pack which contains this information as well as comprehensive checklists to help assist with their planning. Shareholders who wish to know more about Perpetual’s corporate policies are invited to review our website www.perpetual.com.au or to contact us by email at [email protected]. Comments and suggestions from shareholders are welcome.
21
For
per
sona
l use
onl
y

24. ASX Corporate Governance Council’s Corporate Governance Principles and Recommendations.
Principle/Recommendation Relevant
section(s) Comply?
Principle 1 – Lay solid foundations for management and oversight 1.1 Establish and disclose the functions reserved to the Board
and those delegated to senior executives. 1 Yes
1.2 Disclose the process for evaluating the performance of senior executives.
1 Yes
1.3 Provide the information indicated in the guide to reporting on Principle 1.
1 Yes
Principle 2 – Structure the Board to add value 2.1 A majority of the Board should be independent Directors. 3 Yes 2.2 The Chair should be an independent Director. 3 Yes 2.3 The roles of Chair and chief executive officer should not
be exercised by the same individual. 2 Yes
2.4 The Board should establish a nomination committee 7, 9 Yes 2.5 Disclose the process for evaluating the performance of the
Board, its committees and individual Directors. 10 Yes
2.6 Provide the information indicated in the guide to reporting on Principle 2.
2 – 7, 9, 10
Yes
Principle 3 – Promote ethical and responsible decision-making 3.1 Establish and disclose a code of conduct outlining
• the practices necessary to maintain confidence in the Company’s integrity • the practices necessary to take into account legal obligations and the reasonable expectations of stakeholders • the responsibility and accountability of individuals for reporting and investigating reports of unethical practices.
13 Yes
3.2 Establish a policy concerning diversity and disclose the policy or a summary of that policy. The policy should include requirements for the board to establish measurable objectives for achieving gender diversity and for the Board to assess annually both the objectives and progress in achieving them.
14 Yes
3.3 Disclose in each annual report the measurable objectives for achieving gender diversity set by the Board in accordance with the diversity policy and progress toward achieving them.
14 Yes
3.4 Disclose in each annual report the proportion of women in the whole organisation, women in senior executive positions and women on the Board.
14 Yes
3.5 Provide the information indicated in the guide to reporting on Principle 3.
13, 14 Yes
Principle 4 – Safeguard integrity in financial reporting 4.1 Establish an Audit Committee. 9 Yes 4.2 Structure the Audit Committee so that it:
• consists only of non-executive Directors • consists of a majority of independent Directors • is chaired by an independent chair, who is not the
Chair of the Board and • has at least three members.
9 Yes
4.3 The Audit Committee should have a formal charter. 9 Yes 4.4 Provide the information indicated in the guide to reporting 9, 18 Yes
22
For
per
sona
l use
onl
y

Principle/Recommendation Relevant section(s)
Comply?
on Principle 4. Principle 5 – Make timely and balanced disclosure 5.1 Establish and disclose written policies designed to ensure
compliance with ASX Listing Rule disclosure requirements and to ensure accountability at a senior management level for that compliance.
19 Yes
5.2 Provide the information indicated in the guide to reporting on Principle 5.
19 Yes
Principle 6 – Respect the rights of shareholders 6.1 Design and disclose a communications policy for
promoting effective communication with shareholders and encouraging their effective participation at general meetings and disclose the policy or a summary of the policy.
20 Yes
6.2 Provide the information indicated in the guide to reporting on Principle 6.
20 Yes
Principle 7 – Recognise and manage risk 7.1 Establish and disclose policies for the oversight and
management of material business risks. 15 Yes
7.2 Require management to design and implement the risk management and internal control system to manage the company’s material business risks and report to the Board on whether those risks are being managed effectively. The Board should disclose whether management has reported to it as to the effectiveness of the Company’s management of its material business risks.
15, 16 Yes
7.3 Disclose whether the Board has received assurance from the Managing Director and the Chief Financial Officer that the declaration provided under s295A of the Act is founded on a sound system of risk management and internal control that is operating effectively in all material respects in relation to financial reporting risks.
16 Yes
7.4 Provide the information indicated in the guide to reporting on Principle 7.
15,16 Yes
Principle 8 – Remunerate fairly and responsibly 8.1 The Board should establish a remuneration committee. 9, 21 Yes 8.2 The remuneration committee should be structured so that
it consists of a majority of independent Directors, is chaired by an independent chair and has at least three members.
9
8.3 Clearly distinguish the structure of Non-Executive Directors’ remuneration from that of executive Directors and senior management
21* Yes
8.4 Provide the information indicated in the guide to reporting on Principle 8.
9, 20, 21 Yes
*Full details of the remuneration policies and structures of Perpetual Limited and its controlled entities (Perpetual Group) are set out in the Remuneration Report section of the Directors’ Report on pages 24 to 62 of this Report.
23
For
per
sona
l use
onl
y

Remuneration Report Dear Shareholder, I am pleased to present our Remuneration Report for 2012. As you would be aware, at last year’s Annual General Meeting (AGM) 26.2% of the votes cast in respect of the resolution to adopt the 2011 Remuneration Report voted “against” that resolution. Because this was greater than 25% of cast votes, we received what is known as a “first strike” under the new executive remuneration laws which applied for the first time. The “against” vote in respect of the Remuneration Report was recorded despite most proxy advisors for institutional shareholders recommending that shareholders vote “in favour” of the Remuneration Report. Our formal response to issues raised by shareholders at the AGM with respect to the 2011 Remuneration Report is set out on page 31 of this Remuneration Report. Voting at AGMs is not compulsory and voter participation often reflects this with a low number of potential votes being cast. At the Perpetual 2011 AGM, only 32.9% of issued shares that were eligible to vote on the resolution to adopt the Remuneration Report did so, meaning that the ‘against’ vote represented 8.5% of eligible issued shares. While we believe our remuneration practices are sound and demonstrate a clear link between executive and shareholder outcomes, we have taken the first strike seriously and have undertaken an extensive review of Key Management Personnel remuneration with the assistance of our remuneration advisors, PricewaterhouseCoopers. As part of this review, we have met with proxy advisors, institutional shareholders and other stakeholders to seek feedback on our remuneration practices and proposed changes. The changes that the Board will implement in 2012/13 as a result of this review have been made within the existing remuneration philosophy and guiding principles. We believe the changes further strengthen the alignment of the executive remuneration framework to the business strategy, and therefore shareholders’ interests, and better reflect market practice. The changes include: • from October 2012, ceasing the practice of paying dividends on new LTI awards prior to performance
targets being met, • refining our approach to STI deferral by deferring a material portion of annual STI into Perpetual shares
every year to strengthen the focus on risk management and better reflect market practice, and • transitioning to a remuneration mix that provides greater consistency and alignment with Perpetual’s
business model. We have conducted a careful and in depth assessment of the issues, challenges and opportunities facing Perpetual. This has resulted in us embarking on a transformation strategy that will significantly simplify our corporate structure and refocus our operational activities to better leverage us for growth. This means the costs of managing the business will significantly but prudently reduce, as demonstrated by reducing the quantum of remuneration paid to Key Management Personnel to better align to Perpetual’s market peers. These changes complement those announced last year whereby company performance, for the purposes of determining the funding of the STI pool from 2011/12, is assessed against a balanced scorecard of financial and long-term value-creation measures. Further detail on each of the changes outlined above is provided in the Remuneration Report. We believe that these changes will be welcomed by most of our shareholders.
We will continue to review our remuneration arrangements in consideration of a changing business environment, legislative reform and your feedback. Thank you for taking the time to read this report. Elizabeth M Proust AO Chairman, People and Remuneration Committee
24
For
per
sona
l use
onl
y

Contents
1. Remuneration snapshot 27 2. Link between company performance and remuneration 32 3. The role of the People and Remuneration Committee 34 4. Our remuneration philosophy and structure 36 5. Short-term incentives 41 6. Long-term incentives 44 7. Details of remuneration 49 8. Contract terms of the Managing Director and Group Executives 55 9. Remuneration of Non-executive Directors 60
About this report This report sets out the remuneration arrangements for all Key Management Personnel (KMP), including the former and current Managing Directors, the Group Executives, and the Non-executive Directors of Perpetual Limited. The information in this Remuneration Report has been audited as required by section 308(3C) of the Corporations Act 2001.
Key terms used in this report
Balanced scorecard
A list of business performance measures agreed by the Board to assess company performance for the purposes of determining the funding of the short-term incentive pool. More details are on page 41.
EPS Earnings per share for the purpose of determining performance against LTI performance targets. When measuring the growth in EPS to determine the vesting of long-term incentive awards, we define EPS as Net Profit divided by the average number of issued shares during the year.
Executives The Managing Director and Group Executives.
KMP Key Management Personnel. Those people who have the authority and responsibility for planning, directing and controlling the company’s activities, either directly or indirectly. This includes directors, whether executive or otherwise, of the Perpetual consolidated group.
LTI Long-term incentive. LTI is a key feature of Perpetual’s remuneration strategy and seeks to align executive remuneration with sustainable shareholder wealth creation. LTI has historically been issued in the form of options and shares but in the future will be issued as performance rights. More details are on page 44.
Market peers
For the purposes of benchmarking remuneration practices and levels, Perpetual’s market peers refers to listed companies in the diversified financial services industry (excluding major banks and other financial services companies in the S&P/ASX 50).
Net Profit Net Profit is a financial measure in the Perpetual balanced scorecard for the purposes of determining the funding of the STI pool. Net Profit is defined as net profit after tax with the post-tax amount of the STI pool added back, and adjusted for any other items determined by the Board. The general principle used is to adjust NPAT for items of a capital nature. This includes capital gains and losses on investments, sale of businesses / activities, and exit from material operations / activities. As a general principle, no adjustment is made for redundancy costs. For 2011/12, adjustments were made for the following items:
• Gains and losses on the sale of investments and businesses, • Costs incurred on the closure of PI Investment Management Limited, and • An impairment charge for the write-down of the carrying value of IT assets to their net realisable value
in respect of outsourced operations. STI Short-term incentive. An incentive paid to employees for meeting annual targets aimed at delivering our
longer-term strategic plan. Under the STI Plan employees may be paid a discretionary incentive (less applicable taxes and superannuation) based on their individual performance as well as on the performance of their team, their division and Perpetual as a whole. For executives, a portion of STI is paid in cash and a portion deferred into Perpetual shares. The Board retains a broad discretion to claw-back deferred STI shares in certain circumstances. More details are on page 41.
TSR Total shareholder return. TSR is defined as share price growth plus dividends paid over the measurement period. Dividends are assumed to be reinvested on the ex-dividend date. Where applicable, adjustments may be made for any capital reconstructions or rights or bonus issues at the Board’s discretion.
25
For
per
sona
l use
onl
y

Key Management Personnel Below are Perpetual’s KMP this year:
Name Position Term Non-executive Directors Peter Scott Chairman Full year Paul Brasher Independent Director Full year Meredith Brooks Independent Director 1 July 2011 to 28 October 2011 Philip Bullock Independent Director Full year Paul McClintock1 Independent Director Full year Elizabeth Proust Independent Director Full year Philip Twyman Independent Director Full year Managing Director Geoff Lloyd Chief Executive Officer and Managing Director From 6 February 2012 to 30 June 2012 Group Executive Perpetual Private & Head of
Retail Sales 1 July 2011 to 5 February 2012
Former Managing Director Chris Ryan Chief Executive Officer and Managing Director 1 July 2011 to 5 February 2012 Current Group Executives Richard Brandweiner Acting Group Executive, Perpetual Investments
Group Executive Income and Multi Sector From 25 June 2012 to 30 June 2012 From 1 July 2011 to 24 June 2012
Roger Burrows Chief Financial Officer Full year Cathy Doyle2 Group Executive Equities Full year Christopher Green Group Executive Corporate Trust Full year Brian Henderson3 Group Executive Marketing and Communications Full year Ivan Holyman4 Chief Risk Officer Full year Richard Vahtrick Group Executive Operations Full year Current executives in Acting Group Executive roles during the year Nick Langton Acting Group Executive, Perpetual Private & Head
of Retail Sales From 6 February to 30 June 2012
Paul Chasemore Acting Group Executive, People & Culture From 21 May to 30 June 2012
Group Executives who departed during the year Janine Stewart Group Executive, People & Culture From 1 July 2011 to 18 May 2012
1 Will step down as a Director of Perpetual following the company’s Annual General Meeting on 1 November 2012. 2 Ceased employment with Perpetual on 31 July 2012. 3 Ceased employment with Perpetual on 13 July 2012. 4 Ceased employment with Perpetual on 13 July 2012.
26
For
per
sona
l use
onl
y

1. Remuneration snapshot
1.1 Key changes to be made to the KMP remuneration framework for 2012/13 During the year the Board conducted an extensive review of KMP remuneration with the assistance of its remuneration advisor, PricewaterhouseCoopers (PwC). The review was conducted within the context of Perpetual’s existing remuneration philosophy and remuneration guiding principles with the objective of further aligning the remuneration strategy with the business strategy and shareholders, and better reflecting practice of Perpetual’s peers. Feedback from proxy advisors, institutional shareholders and other stakeholders was an important component of the review. The following changes will apply to KMP remuneration for 2012/13: New LTI awards will be made in the form of performance rights
From October 2012, all new LTI grants will be made in the form of performance rights, meaning that dividends will not be received by the Managing Director and Group Executives until the performance rights have vested and been converted into Perpetual shares. Executives currently receive dividends on LTI shares during the three-year performance period. In adopting this practice, the value of expected dividends on LTI shares is included in total remuneration for executives for the purposes of benchmarking against market peers. We believe this practice aligns executives with shareholders by placing an appropriate balance of the executives’ focus on profit as well as share price performance. However, we acknowledge that this practice is not supported by shareholders and as a result we will change our approach for all new LTI grants to the Managing Director and Group Executives from October 2012. Dividends on unvested shares held by the Managing Director and Group Executives in respect of LTI previously granted will continue to be paid. Further information about our approach to LTI is on page 46. Our approach to STI deferral has been refined The approach to STI deferral for the Managing Director and Group Executives has been refined to strengthen the focus on risk management and better align with Perpetual’s market peers. For STI payments made to the Managing Director and current Group Executives in respect of the 2012/13 year (i.e. awarded in September 2013), 80% of the STI will be received in cash and 20% deferred in Perpetual shares. For 2013/14 and for any new Group Executives commencing after 1 July 2012, 60% of any STI will be paid in cash with 40% deferred in Perpetual shares. STI received in the form of Perpetual shares is deferred for two years and subject to the forfeiture and ‘claw-back’ provisions introduced in 2010. Previously, only STI awarded in excess of a certain threshold was deferred. The new approach ensures that a meaningful amount of STI will be deferred annually and provides an additional retention and risk management tool through the ‘claw-back’ provision. This approach also assists the Managing Director and Group Executives build share ownership and therefore increases alignment with shareholders. Dividends on deferred STI shares are paid during the vesting period as the performance criteria for awarding the STI has already been met. Further information on our approach to STI deferral is on page 43. We will realign our remuneration mix to the business model Perpetual will transition to a new remuneration mix for the Managing Director and Group Executives that provides greater consistency and alignment with Perpetual’s business model. For new Group Executives commencing after 1 July 2012, or on the restructure of roles for existing Group Executives, the long-term incentive component will decrease as a proportion of total remuneration generally corresponding to an increase in the fixed remuneration proportion. Total remuneration on a fair value basis will continue to be set in consideration of Perpetual’s market peers. The review found that our approach to setting remuneration arrangements for executives has resulted in remuneration mixes that are too leveraged to ‘at risk’ incentives, given the nature of our business model, and has been applied inconsistently across executives.
27
For
per
sona
l use
onl
y

More details on the remuneration mix for the Managing Director and Group Executives is on page 39. The quantum of remuneration paid to Non-executive Directors and for the Managing Director role has reduced As part of the review, the Board also sought feedback from shareholders and PwC on what they consider to be an appropriate approach to the remuneration of Non-executive Directors. A reduction in overall board costs by approximately $500,000, or 30%, will apply from 1 July 2012. The remuneration of the Chairman will reduce by 42%, while for other Non-executive Directors, remuneration, including committee allowances, will reduce by an average of 25%. The total remuneration of the Managing Director was also significantly reduced on the appointment of Geoff Lloyd in line with benchmarking against Perpetual’s market peers. These changes, together with the restructure of the executive team which resulted in the size of the team reducing from 10 to 7, is expected to reduce the annualised target remuneration for KMP by approximately 25%. Further information on Non-executive Directors’ fees is on page 60. Further information on the Managing Director’s remuneration is provide below. 1.2 Fixed remuneration increases for 2012/13 In consideration of the ongoing challenging operating environment and the need to closely manage our costs, there will be no increases in fixed remuneration to the Managing Director and Group Executives in 2012/13. Other employees with fixed remuneration of $200,000 or above will not be eligible for an increase, other than in exceptional circumstances such as on promotion. Any such increases are subject to the approval of the Managing Director. For employees with fixed remuneration below $200,000, a budget of 2% will apply, except for Award employees who will receive an increase of at least 2.5%. 1.3 Remuneration outcomes in 2011/12 A summary of the remuneration outcomes for the Managing Director and Group Executives for 2011/12 is set out below.
Remuneration Component 2011/12 outcomes
Fixed Remuneration
Managing Director & CEO Determined by the Board using market data provided by an external independent advisor. To determine the appropriate level of remuneration for this role, the Board considered the remuneration of CEOs of companies in the diversified financial services industry (excluding major banks and other financial services companies in the S&P/ASX 50).
The fixed remuneration for Geoff Lloyd ($1,100,000) is 10% lower than that provided to the former Managing Director, Chris Ryan ($1,225,000) and is more than 16% lower on a total remuneration basis.
More information on the remuneration of the Managing Director, including a summary of contractual arrangements, is on page 55.
Group Executives During the year, the Board benchmarked the remuneration of Group Executives against the remuneration of relevant market peers for each role provided by an external independent advisor. The market peers consisted of financial services companies in the S&P/ASX 51 - 200 with revenue comparable to the relevant Perpetual business division. Based on this review, increases to fixed remuneration were made for Janine Stewart, Richard Brandweiner and Chris Green to increase the market competitiveness of these executives’ remuneration.
Higher duties allowances were paid to Richard Brandweiner, Nick Langton and Paul Chasemore in respect of their Acting Group Executive roles.
The fixed remuneration for all other Group Executives remained unchanged during 2011/12.
28
For
per
sona
l use
onl
y

Remuneration Component 2011/12 outcomes
Other employees Increases were granted to employees where remuneration was considered not competitive against market. This resulted in an increase in fixed remuneration costs of 3.4% for these employees.
Short Term Incentives
STI pool The amount available for funding STI awards to employees for 2011/12 is approximately 31% lower than in 2010/11, using consistent principles and methodology of calculating the Net Profit for the purposes of determining the funding of STI awards. This reduction is largely a function of the 30% reduction in Net Profit used for assessing the financial component of the balanced scorecard but also reflects the level of achievement against target of other measures included in the balanced scorecard under Strategic Progress, Operational and People.
A summary of the 2011/12 balanced scorecard including an assessment of performance against the measures is set out on page 41.
Former Managing Director & CEO – Chris Ryan
Based on the Board’s assessment of the performance of the former Managing Director and CEO, a short-term incentive of $183,750 was awarded to Chris Ryan.
This equates to an achievement rate of 15% of his annualised short-term incentive target for 2011/12, compared to an achievement rate of 33% awarded in 2010/11.
Managing Director & CEO – Geoff Lloyd
Based on the Board’s assessment of his performance as Group Executive, Perpetual Private and Head of Retail Sales from 1 July 2011 to 5 February 2012, and Managing Director & CEO from 6 February 2012 to 30 June 2012, a short-term incentive of $437,000 was awarded to Geoff Lloyd.
This equates to an achievement rate of 52% of his short-term incentive target for 2011/12, compared to an achievement rate of 51% awarded in 2010/11.
Group Executives The Board approved short-term incentive awards for 2011/12 to Group Executives ranging between 17% and 60% of their respective targets, based on the recommendations of the Managing Director.
This compared to an achievement rate of 51% for 2010/11 that applied across all Group Executives.
Details of STI outcomes for Group Executives are included in the remuneration tables on pages 30 and 50.
Long Term Incentives
Managing Director & CEO and Group Executives
All LTI grants made to Executives in 2007 were forfeited during the year as the TSR and EPS growth targets were not met when retested on 1 October 2011.
No LTI grants made to Executives in 2008 vested as a result of the initial test of the performance targets on 1 October 2011. These will be retested in October 2012 but are very unlikely to vest.
A business unit-based LTI grant made to Cathy Doyle in February 2008 was retested during 2011/12. The stretch profit performance target was not met and accordingly all shares were forfeited.
Further detail on the LTI performance measures is on page 44.
Non-executive Director fees
Total fees paid to Non-executive Directors in 2011/12 were $1,693,432 which represented a reduction of 13% from the total fees of $1,951,994 paid in 2010/11. This reduction was due to changes in the composition of the Board and the cessation of fees paid for serving on the Nominations Committee from 1 July 2011.
The total remuneration available to Non-executive Directors remains at $2,250,000, as approved by shareholders at the 2006 AGM.
Further detail on Non-executive Director remuneration is provided on page 60.
29
For
per
sona
l use
onl
y
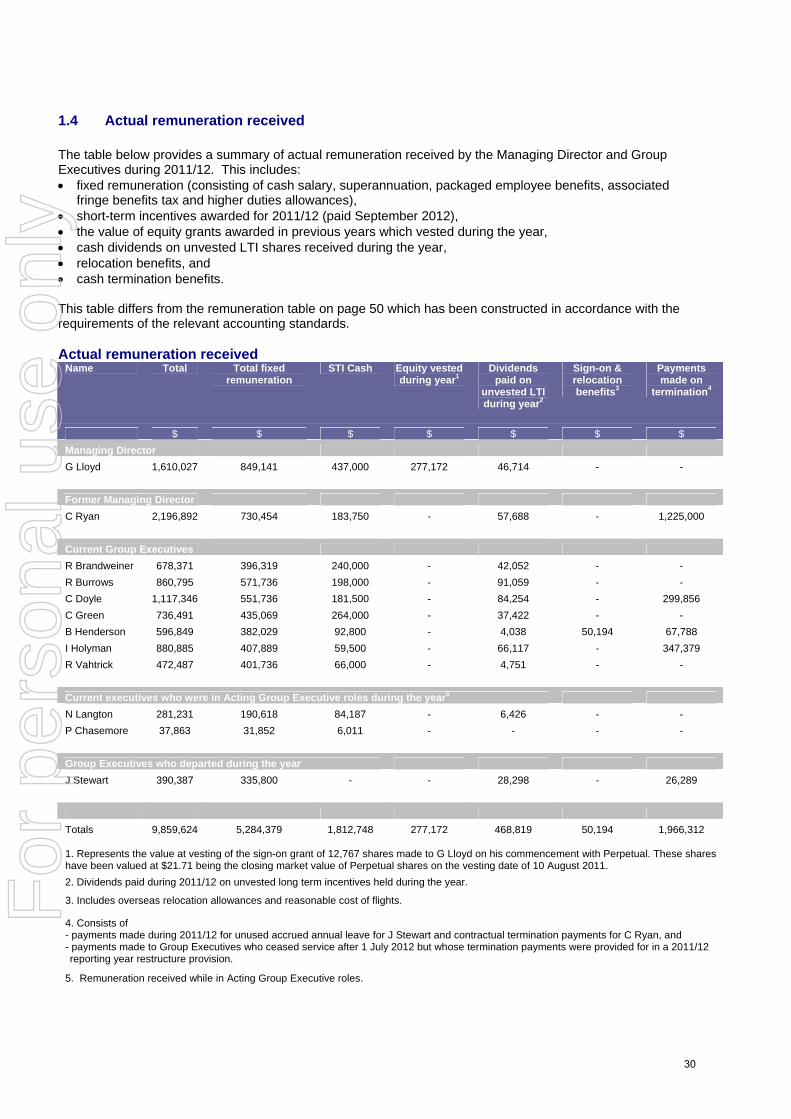
1.4 Actual remuneration received The table below provides a summary of actual remuneration received by the Managing Director and Group Executives during 2011/12. This includes: • fixed remuneration (consisting of cash salary, superannuation, packaged employee benefits, associated
fringe benefits tax and higher duties allowances), • short-term incentives awarded for 2011/12 (paid September 2012), • the value of equity grants awarded in previous years which vested during the year, • cash dividends on unvested LTI shares received during the year, • relocation benefits, and • cash termination benefits. This table differs from the remuneration table on page 50 which has been constructed in accordance with the requirements of the relevant accounting standards. Actual remuneration received
Name Total Total fixed remuneration
STI Cash Equity vested during year1
Dividends paid on
unvested LTI during year2
Sign-on & relocation benefits3
Payments made on
termination4
$ $ $ $ $ $ $ Managing Director G Lloyd 1,610,027 849,141 437,000 277,172 46,714 - - Former Managing Director C Ryan 2,196,892 730,454 183,750 - 57,688 - 1,225,000 Current Group Executives R Brandweiner 678,371 396,319 240,000 - 42,052 - - R Burrows 860,795 571,736 198,000 - 91,059 - - C Doyle 1,117,346 551,736 181,500 - 84,254 - 299,856 C Green 736,491 435,069 264,000 - 37,422 - - B Henderson 596,849 382,029 92,800 - 4,038 50,194 67,788 I Holyman 880,885 407,889 59,500 - 66,117 - 347,379 R Vahtrick 472,487 401,736 66,000 - 4,751 - - Current executives who were in Acting Group Executive roles during the year5 N Langton 281,231 190,618 84,187 - 6,426 - - P Chasemore 37,863 31,852 6,011 - - - - Group Executives who departed during the year J Stewart 390,387 335,800 - - 28,298 - 26,289 Totals 9,859,624 5,284,379 1,812,748 277,172 468,819 50,194 1,966,312
1. Represents the value at vesting of the sign-on grant of 12,767 shares made to G Lloyd on his commencement with Perpetual. These shares have been valued at $21.71 being the closing market value of Perpetual shares on the vesting date of 10 August 2011. 2. Dividends paid during 2011/12 on unvested long term incentives held during the year. 3. Includes overseas relocation allowances and reasonable cost of flights.
4. Consists of - payments made during 2011/12 for unused accrued annual leave for J Stewart and contractual termination payments for C Ryan, and - payments made to Group Executives who ceased service after 1 July 2012 but whose termination payments were provided for in a 2011/12 reporting year restructure provision.
5. Remuneration received while in Acting Group Executive roles.
30
For
per
sona
l use
onl
y

1.5 Response to concerns raised at the 2011 Annual General Meeting The table below provides a summary of the action the Board has taken, or will be taking, in response to concerns raised by shareholders at the 2011 Annual General Meeting (AGM) in relation to remuneration. Concern
Board action or comment
Adjustments made to NPAT for the purposes of determining remuneration outcomes.
Adjustments may be made to NPAT at the discretion of the Board for the purposes of determining remuneration outcomes. In exercising their discretion, the Board has adopted principles to ensure that any adjustments are applied consistently from year to year, do not inappropriately reward or penalise employees and are made in consideration of shareholder outcomes. Adjustments typically relate to capital items that do not reflect management performance or day-to-day business operations and activities such as gains or losses on the sale of assets and investments.
Please refer to the description of Net Profit in the Key Terms section on page 25 of this report for adjustments made to NPAT to determine remuneration outcomes for 2011/12.
The ability to claw-back incentives paid following subsequent poor performance.
The ability to claw-back deferred STI was introduced at Perpetual on 1 July 2010. This allows for unvested deferred STI shares to be forfeited if the Board subsequently becomes aware of any information that would have resulted in a lower or no STI being awarded had the Board been aware of that information at the time the STI was awarded. There is no mechanism to claw-back incentive payments that have already vested and paid out.
See page 43 for more information on deferred STI shares and claw-back.
Remuneration arrangements are too focused on short-term results.
In 2011/12, a balanced scorecard approach to assessing company performance for the purposes of determining the STI pool was introduced. The measures in the balanced scorecard are designed to reward both financial performance over the year and the activities that will generate future sustainable profits. Prior to this, the STI pool was determined solely on profit for that year.
As described on page 27, STI deferral for the Managing Director and Group Executives has been refined to ensure a more meaningful amount of STI is deferred. This approach strengthens the focus on risk management through the ability of the Board to claw-back incentives if appropriate, and increases long-term alignment with shareholders by building equity ownership for executives.
See page 41 of Section 5 for a detailed description of STI.
Items rewarded through STI that may be more appropriately remunerated in base pay.
Targets set in respect of each measure included in the balanced scorecard require performance over and above that expected in fulfilling the basic requirements of the role.
Lack of disclosure and clarity on the business measures used to determine the annual STI Pool.
See page 41 of Section 5 for a description of the business measures used in the 2011/12 balanced scorecard to assess company performance for determining the funding of the STI pool.
Quantum of remuneration paid to KMP.
As described on page 28, Non-executive Director fees and the remuneration of the Managing Director role on the appointment of Geoff Lloyd have significantly reduced.
These changes, together with the restructure of the executive team which resulted in the size of the team reducing from 10 to 7, is expected to reduce the annualised target remuneration for KMP by approximately 25%.
There will be no increases to fixed remuneration for KMP in 2012/13.
LTI performance measures. As part of the review of KMP remuneration, the Board reviewed the appropriateness of the current TSR and EPS growth LTI performance measures. While the Board recognised that there were some shortcomings with the existing approach, it remains the most appropriate for Perpetual at this time.
See page 44 for a description of LTI performance measures.
31
For
per
sona
l use
onl
y

2. Link between company performance and remuneration One of Perpetual’s remuneration guiding principles is that the remuneration structure should align value creation for shareholders, clients and employees. This section demonstrates the strong alignment between company performance and remuneration outcomes for KMP over the last five years. The following table shows the company’s five-year performance. Year ended
Perpetual's five-year performance 30 June
2008 30 June
2009 30 June
2010 30 June
2011 30 June
20121
Statutory net profit after tax ($'000's) 128,813 37,749 90,505 62,031 26,679
UPAT reported ($'000's) 133,464 65,697 72,793 72,879 67,623
Ordinary dividend per share declared with respect to the year ($) 3.30 1.00 2.10 1.85 0.90
Basic earnings per share - UPAT ($)1 3.42 1.67 1.83 1.79 1.74
Closing share price ($) 42.77 28.55 28.26 24.93 22.90
Annual total shareholder return (TSR) -30.9% -39.52% 12.43% -8.76% -10.65%
2.1 STI outcomes are aligned to company performance
The amount available for funding STI awards to employees for 2011/12 is approximately 31% lower than in 2010/11, using consistent principles and methodology of calculating the Net Profit for the purposes of determining the funding of STI awards. This reduction is largely a function of the 30% reduction in Net Profit used for assessing the financial component of the balanced scorecard but also reflects the level of achievement against target of other measures included in the balanced scorecard under Strategic Progress, Operational and People. Net Profit for the purposes of determining the amount to fund STI awards is statutory net profit after tax with the post-tax amount of the aggregate STI payments added back, and adjusted for any other items determined by the Board. For 2011/12, adjustments were made for the following items:
• Gains and losses on the sale of investments and businesses, • Costs incurred on the closure of PI Investment Management Limited, and • An impairment charge for the writedown of the carrying value of IT assets to their net realisable value in
respect of outsourced operations.
The chart below demonstrates the alignment between profit and STI outcomes over the past 5 years.
1 On 17 October 2011 Perpetual completed an off-market share buy-back. Refer to page 46 for more information.
32
For
per
sona
l use
onl
y

Company performance & STI outcomes
0
20
40
60
80
100
120
140
2008 2009 2010 2011 201250
100
150
200
250
300
NPAT UPAT STI Index
STI Index2012 = 100NPAT / UPAT ($m)
2.2 How LTI aligns to company performance
The following charts show the vesting outcomes of all LTI issued to KMP (past and present) in 2007, 2008 and 2009. No vesting has occurred in respect of grants for which TSR and EPS growth performance measures have applied with only minimal vesting for sign-on and business-based grants. This clearly demonstrates that LTI outcomes and company performance are aligned.
2007 Grants
5% 0%
95%
2008 Grants
9%
28%
63%
2009 Grants0%
37%
63%
LTI that has vested
LTI that remains unvested
LTI that has forfeited
LTI awarded in 2008 and 2009 that remains unvested is very unlikely to meet the relevant performance measures.
33
For
per
sona
l use
onl
y

3. The role of the People and Remuneration Committee The role of the People and Remuneration Committee (PARC) is to help the Board fulfil its responsibilities to shareholders through a strong focus on good governance, and in particular, the principles of accountability and transparency. The PARC operates under delegated authority from the Board. The PARC’s terms of reference are available on our website (http://www.perpetual.com.au) and are shown graphically below:
The terms of reference are broad, encompassing remuneration as well as executive development, talent management and succession planning. This enables the PARC to focus on ensuring a high quality of succession planning and executive development at all levels of Perpetual. The PARC members for 2011/12 were:
• Elizabeth Proust (Chairman) • Paul Brasher • Philip Bullock • Paul McClintock
The PARC met seven times during the year. Attendance at these meetings is set out on page 4 of the Directors’ Report. At the PARC’s invitation, the Managing Director and Group Executive People and Culture attended meetings except where matters associated with their own performance evaluation, development and remuneration were to be considered.
Oversee Equal Employment
Opportunity and cultural diversity
policies at all levels
Oversee HR management policy and
practices, including overall Remuneration
Policy
Review succession and career planning for the
Managing Director, Group Executives and other critical
roles
Establish and maintain a process for executive
performance planning and review to encourage superior performance
Oversee employee engagement at all levels
Ensure remuneration disclosure requirements
are met
Review and recommend Managing Director’s
performance, remuneration and contractual
arrangements to the Board
Review and recommend Board remuneration as well as Managing Director and
Group Executive remuneration
PARCOversee compliance with occupational health and
safety regulations
34
For
per
sona
l use
onl
y

The PARC considers advice and views from those invited to attend meetings and draws on services from a range of external sources, including remuneration consultants. Use of remuneration consultants In March 2011, the PARC appointed PricewaterhouseCoopers (PwC) as its principal remuneration consultant to provide specialist advice on executive remuneration and other Group-wide remuneration matters. In December 2011, the PARC asked PwC to review its existing remuneration framework for KMP and to provide recommendations in respect of both executive short-term and long-term incentive plan design. Under the terms of the engagement, PwC provided remuneration recommendations as defined in section 9B of the Corporations Act 2001 and was paid $119,886 (including GST) for these services. In addition to providing remuneration recommendations, PwC provided advice on other aspects of the remuneration of the Group's employees as well as a range of other services across Perpetual including advisory, assurance, private client, tax and legal services. In total, PwC was paid $606,676 (including GST) for their services to Perpetual. PwC has confirmed that the recommendations relating to remuneration have been made free from undue influence by members of Perpetual’s KMP. The following arrangements were made to ensure that the remuneration recommendations were free from undue influence:
• PwC was engaged by, and reported directly to, the Chairman of the PARC. The agreement for the provision of remuneration consulting services was executed by the Chairman of the PARC under delegated authority on behalf of the Board,
• The report containing the remuneration recommendations was provided by PwC directly to the Chairman of the PARC, and
• PwC was permitted to speak to management throughout the engagement to understand company processes, practices and other business issues and obtain management perspectives. However, PwC was not permitted to provide any member of management with a copy of their draft or final report that contained the remuneration recommendations.
As a consequence, the Board is satisfied that the recommendations were made free from undue influence from any members of the KMP.
35
For
per
sona
l use
onl
y

4. Our remuneration philosophy and structure
Perpetual’s remuneration philosophy is that the remuneration strategy should align with and support the achievement of our business strategy, while ensuring remuneration outcomes are aligned with shareholder interests and are market competitive. To that end we have created six guiding principles that direct our remuneration approach.
4.1 Remuneration principles Our remuneration policy is designed around the following six guiding principles:
1. The remuneration structure should attract, motivate and retain the desired talent within Perpetual,
2. The remuneration structure should align value creation for shareholders, clients and employees,
3. The remuneration structure should embed sound risk management,
4. Incentive arrangements should motivate performance,
5. Remuneration should be delivered efficiently and effectively considering the level of administration required, and
6. The remuneration structure should be supported by a governance framework that avoids conflict of interest and ensures proper controls are in place.
The PARC has also adopted a number of practices that collectively contribute to each remuneration principle.
4.2 Alignment with sound risk management When determining the variable (or ‘at risk’) elements of remuneration, we ensure that risk management is a key performance metric using specific performance goals and targets. Sound risk management practices include:
• deeming employees to be ineligible for the payment of STI in the event they exhibit poor risk behaviours,
• incorporating in employee performance plans goals that are specifically related to risk management performance measures. These goals are approved annually by the Board and cascade down to all employees,
• performing scenario testing on potential outcomes under any new incentive plans,
• regularly reviewing the alignment between remuneration outcomes and performance achievement for existing incentive plans,
• deferring a portion of STI into Perpetual shares to align remuneration outcomes with longer-term company performance,
• including provisions in incentive plans for the Board or the PARC to adjust incentive payments downwards, if required, to protect Perpetual’s financial soundness, or to respond to significant unexpected or unintended consequences,
• including a provision for the Board or the PARC to ‘claw-back’ deferred STI shares in certain circumstances, and
• continuous monitoring of remuneration outcomes by the Board, the PARC and management, to ensure that results are promoting behaviours that support Perpetual’s long-term financial soundness and the desired culture.
36
For
per
sona
l use
onl
y

4.3 Alignment with shareholders with shareholders Link to business strategy
A key tenet of our remuneration philosophy is that the remuneration strategy should support the achievement of our business strategy and desired culture while ensuring that remuneration outcomes are aligned with shareholder outcomes. The remuneration structure for the Managing Director and Group Executives in 2011/12 was as follows:
Fixed Fixed remuneration
Targeted at the median of market peers in order to attract and retain talented employees and to not encourage excessive risk-taking.
Calculated on a ‘total cost to company’ basis, consisting of cash salary, superannuation, packaged employee benefits and associated fringe benefits tax (FBT).
STI
Paid for meeting annual targets aimed at delivering our longer-term strategic plan. Awards are based on individual, divisional and company performance against stretch targets using financial and longer-term, value-creation measures.
Paid as cash
Deferred STI
STI awarded in excess of target STI opportunity are deferred into Perpetual shares for two years, with vesting subject to service conditions and claw-back provisions
See page 43 for details of changes to STI deferral arrangements for 2012/13.
Variable ‘at risk’
LTI
Granted in the form of fully paid ordinary Perpetual shares and are subject to service conditions and performance targets measured over a three-year period.
Performance measures are aligned to our business strategy and shareholder interests through TSR and EPS growth targets.
See page 46 for details of changes to LTI arrangements for 2012/13.
Awarded as equity subject to performance hurdles and/or service conditions
37
For
per
sona
l use
onl
y

Minimum shareholding guideline
A minimum shareholding guideline applies to the Managing Director and Group Executives. The purpose of this guideline is to strengthen the alignment between executives’ and shareholders’ interests in the long-term performance of Perpetual. Under this guideline, executives are expected to establish and hold a minimum shareholding to the value of: Managing Director: 1.5 times fixed remuneration Group Executives: 0.5 times fixed remuneration
The value of each performance right or share held in tax deferral by the executive is treated as being equal to 50% of that share or performance right, as this represents the value of the share in the hands of the executive after allowing for tax. Unvested shares or performance rights do not count towards the target holding. A five-year transition period, from the later of 1 July 2010 or the start of employment, gives executives reasonable time to meet their shareholding guideline. Where the guideline is not met after the required time period, executives may be restricted from trading vested shares held in the trust. The refinements to STI deferral for 2012/13 outlined in this report are expected to assist the Managing Director and Group Executives meet the minimum shareholding guideline and strengthen alignment between shareholders and executives. As at 30 June 2012, progress towards the minimum shareholding target for the Managing Director and each Group Executive (excluding Acting Group Executives and Group Executives who ceased employment with Perpetual in July 2012) was as follows:
Value of eligible shareholdings as
at 30 June 20121 Value of minimum shareholding
guideline $ $ Managing Director G Lloyd 146,182 1,650,000 Group Executives R Brandweiner 21,434 200,000 R Burrows - 285,000 C Green 54,914 220,000 R Vahtrick - 200,000
1. Value is calculated through reference to the closing Perpetual share price at 30 June 2012 of $22.90. Hedging and Share Trading Policy
Consistent with Corporations Act obligations, Perpetual’s Share Trading Policy prohibits employees and directors from entering into hedging arrangements in relation to Perpetual securities. Perpetual employees and directors cannot trade in financial products issued over Perpetual securities by third parties or trade in any associated products which limit the economic risk of holding Perpetual securities. Share-dealing can only take place during agreed trading windows throughout the year and is subject to certain approvals (as set out below). Share dealing approval
Any share dealings, whether these shares are held personally or were acquired as part of remuneration, require prior approval. The table below shows the approval required:
Person wishing to deal in shares Approval required from Managing Director Chairman Director Chairman Chairman Nominated Director Group Executive Managing Director An employee likely to have price-sensitive information Managing Director / Company Secretary
38
For
per
sona
l use
onl
y

4.4 Remuneration mix During 2011/12 the Board reviewed the target remuneration mix of the Managing Director and Group Executives. This found that our approach to setting remuneration arrangements for executives has resulted in remuneration mixes that are too leveraged to ‘at risk’ incentives, given the nature of our business model, and has been applied inconsistently across executives. As a result, Perpetual will transition to a new remuneration mix for the Managing Director and Group Executives that provides greater consistency and alignment with Perpetual’s business model which is materially influenced by macro-economic issues and business cycles. This means incentives, in particular LTI, will decrease as a proportion of total remuneration. Total remuneration on a fair value basis will continue to be set in consideration of Perpetual’s market peers. The new target remuneration mix will be implemented progressively as new Group Executives are appointed or existing roles are materially changed. The remuneration mix for current Group Executives will not materially change as transitioning to the desired remuneration mix would result in fixed remuneration increases which the Board does not believe is in the best interests of shareholders. The Managing Director and all Group Executives will continue to have a significant portion of their remuneration linked to performance and at risk. The application of the new remuneration mix with the refined STI deferral arrangements means that the proportion of remuneration paid as cash and equity is expected to remain largely unchanged. This is shown in the table below which shows the new and previous target remuneration mix for the Managing Director and Group Executive roles that will apply when STI deferral is at 40% for executives.
Target Remuneration Mix
0% 10% 20% 30% 40% 50% 60% 70% 80% 90% 100%
Previous Mix
New Mix
Previous Mix
New Mix
Fixed (cash)
STI (cash)
Deferred STI (equity)
LTI (equity)
34%
21%35% 30% 30%
33% 33% 33%
45 ‐ 50% 18 ‐ 21% 20%
31% 31% 31%
Group Executives
Managing Director
14%
38%
20%12 ‐ 14%
4.5 Asset manager remuneration
Asset manager remuneration arrangements are developed in consideration of the same principles that apply to all remuneration across Perpetual.
Similar to the Managing Director and Group Executives, asset manager remuneration consists of both fixed and variable components. A percentage of the variable component is paid in cash in September each year while a percentage is deferred in shares which may vest over three to five years. The vesting of shares may be subject to performance targets linked to EPS growth and service conditions, or targets linked to business measures relevant to the area in which the asset manager works.
Our strategy for asset manager remuneration differentiates between asset managers managing what we consider to be funds in a mature state as compared to those managing funds in the growth phase. We may also vary our practices for differing asset classes such as equities or fixed income.
39
For
per
sona
l use
onl
y

In all cases we seek to align asset manager remuneration with longer-term shareholder interests whilst balancing client outcomes. For asset managers managing funds in growth phase, remuneration arrangements have a heavier focus on rewarding business-building outcomes such as revenue or profit. For asset managers managing mature funds, the focus is more biased to rewarding longer-term investment performance. In all cases senior asset managers receive a significant component of their variable remuneration in the form of Perpetual shares which vest over several years, ensuring a strong alignment to shareholder outcomes. Dividends are paid on unvested shares as share grants are usually earned through meeting targets in annual performance agreements.
From 2012/13, portfolio managers will be able to receive a percentage of their incentives as a notional investment in the products that they manage. The arrangement is described as notional because asset managers do not directly hold securities in the investment. However, the value of their deferred incentives will vary as if the amounts were directly invested in actual investment units, giving the portfolio manager an effective exposure to the performance of the units. This builds alignment with clients over the longer-term.
40
For
per
sona
l use
onl
y

5 Short-term incentives Short-term incentives (STI) are incentives paid in the form of cash and deferred Perpetual shares for meeting annual targets aimed at delivering our longer-term strategic plan.
Commencing 2011/12, Perpetual implemented a new Group-wide STI Plan replacing the previous Profit Participation Pool (PPP). The changes to the STI plan were designed to:
• Measure company performance against more than just current year net profit. While net profit remains an important factor in determining the STI pool, we believe it is appropriate to also measure the activities that will generate future sustainable profits when assessing company performance for the year, and
• Give employees greater clarity over how their individual performance and that of the business contributes to their STI outcome.
The new STI Plan applies to the majority of employees (including the Managing Director and Group Executives). Some asset managers, whose STI is discussed in section 4.5 above, do not participate in the STI plan. In addition, participants in the Perpetual Private and Corporate Trust Sales incentive plans may also have a proportion of their STI determined outside of the STI plan through separate plans.
5.1 How the STI Pool is determined The Board determines the size of the STI pool under the new STI plan by assessing company performance against a range of measures in the balanced scorecard. This is then calibrated against net profit to ensure the STI pool is appropriately correlated to shareholder outcomes. The balanced scorecard includes stretch targets approved by the Board, allowing the business to be assessed in the context of the operating environment. Net profit remains a key performance measure to ensure STI outcomes under the new STI plan are closely aligned with shareholder interests. The scorecard is considered to be ‘balanced’ because it includes a range of short-term financial and longer-term value-creation measures. This approach aims to balance rewards for meeting financial objectives for the year, with rewarding activities designed to deliver sustainable future profits. For 2011/12, performance against the balanced scorecard resulted in an STI pool funded at 35% of target being allocated to employees. The balanced scorecard for 2011/12 and our performance against those measures is summarised in the following table:
Measure Full Year Performance
Financial Outcome Comments
Net Profit Not achieved Fell by 30% due to declining revenues as a result of difficult market conditions and one-off restructure costs.
New business Not achieved Many of our funds have suffered net outflows as market and investor confidence has continued to fall away.
Strategic Progress Outcome Comments
Deliver growth strategy Partially achieved
Transformation 2015 program to simplify, refocus and grow the group announced.
Strategic initiatives Partially achieved
Closed Dublin office and transferred management of funds to Wellington.
Implemented new retail distribution operating model for
41
For
per
sona
l use
onl
y

Measure Full Year Performance
Perpetual Investments.
Recommended and well advanced on sale process of PLMS business. Sale was subsequently completed on 1 August 2012.
People Outcome Comments
Employee engagement Partially achieved
Company engagement score increased by 7 points compared with target of 10 points.
Employee turnover Achieved Voluntary turnover rate at lower end of the industry average range of 15% to 20%.
Operational Outcome Comments
Operating expenses savings Achieved Operating expenses were reduced by 9% as a result of cost reduction initiatives.
Effective risk management Achieved Significant reduction in charges to profit for error corrections as a result of process improvements designed to mitigate risk.
No material operational or compliance breaches.
Overall result Below target
5.2 How the STI pool is allocated Employees must first meet risk and behaviour thresholds to be eligible to receive an STI payment. For the Managing Director and Group Executives, this is assessed by the Board. Individual STI allocations are determined through an assessment of overall company performance against the balanced scorecard, divisional performance against a divisional scorecard and individual performance. Following the determination of the group STI pool, a divisional STI pool is allocated to each division based on the relative contribution of each division to the company’s performance. This is determined by the Board based on recommendations from the Managing Director using divisional balanced scorecards to assess performance. Divisional pools are then allocated to the employees of that division based on the individual performance rating and target STI of the respective employees. The maximum STI opportunity for each employee is 2 times their target STI. Each year performance targets and goals are set for employees in consideration of the balanced scorecards for their division and the company. Performance objectives are classified into four categories, as provided below with example measures: Financial: revenue and cost targets, profit, retail inflows. Strategic: project milestones and execution objectives e.g., completion of acquisitions and/or divestments. Operational: operational efficiency, audit outcomes, process improvements. People: engagement survey scores, turnover rates, succession planning, team development.
42
For
per
sona
l use
onl
y

Performance objectives are assessed throughout the year as part of the performance management process. At year end, an annual assessment of each employee’s performance is made and the STI is then allocated based on company, relative divisional and individual performance. The Managing Director makes recommendations to the Board on STI allocations for the Group Executives and these are subject to approval by the Board. The Chairman of the Board makes recommendations to the Board on the STI allocation for the Managing Director and this is also approved by the Board.
5.3 How the STI is delivered Currently STI payments are delivered in cash except where the STI outcome is more than target STI, in which case the excess amount must be taken as deferred Perpetual shares. Deferred STI shares may vest after a two-year vesting period, subject to service conditions and claw-back provisions. Dividends on deferred STI shares are paid during the vesting period as the performance criteria for awarding the STI has already been met. New deferral arrangements from 2012/13
As part of the review of KMP remuneration, we have refined the approach to STI deferral for the 2012/13 year onwards. For STI payments made to the Managing Director and current Group Executives in respect of the 2012/13 year (i.e. awarded in September 2013), 80% of the STI will be received in cash and 20% deferred in Perpetual shares. For 2013/14 and for any new Group Executives commencing after 1 July 2012, 60% of any STI will be paid in cash with 40% deferred in Perpetual shares. As applies now, deferred STI shares will be subject to a two-year vesting period and claw-back provisions. Termination of employment
In the event of the Managing Director or Group Executive ceasing employment with the company, all unvested STI shares will be forfeited at the termination date, except as noted below. If an executive is made redundant or retires, dies or resigns due to total and permanent disablement, unvested shares are retained by the Executive or their estate, with vesting subject to the original two-year period and claw-back provisions. This approach strengthens the alignment between executives’ and shareholders’ interest in the long-term performance of Perpetual, extending beyond the executives’ tenure. Claw-back provisions
The Board retains a discretion to claw-back deferred STI shares awarded to executives prior to the shares vesting if the Board becomes aware of any information that, had it been available at the time STI awards were determined, would have resulted in a different (or no) STI amount being awarded.
43
For
per
sona
l use
onl
y

6 Long-term incentives This section explains LTI plans in place, how they work and changes to be made from 2012/13.
6.1 Perpetual Limited Long-term Incentive Plan Long-term incentives are provided to the Managing Director, Group Executives and selected senior leaders through the Perpetual Long-term Incentive Plan. This plan was introduced in February 2011 (replacing the Perpetual Limited Executive Share Plan) to modernise terms and conditions in light of significant changes to market practice and regulation of employee equity plans over the past decade.
In 2011/12, LTI grants to the Managing Directors and Group Executives were made in the form of fully paid ordinary shares in Perpetual, with vesting subject to service conditions and performance targets measured over a three-year performance period. Dividends are paid on vested and unvested grants made prior to October 2012. Performance targets
Vesting of LTI grants is subject to two performance measures directly linked to company performance:
• 50% of each grant is subject to a TSR performance target; and
• 50% is subject to an earnings per share (EPS) growth target.
Shares are held in trust for a maximum of seven years from the grant date (10 years for grants made before 1 July 2009). TSR performance target
The TSR performance target requires Perpetual’s TSR over the performance period to be equal to or better than the TSR of half of the comparator group, which consists of companies listed on the S&P/ASX100 (excluding listed property trusts). This comparator group was chosen in the absence of a suitable peer group of direct competitors, and as it best represents Perpetual’s performance which is influenced by equity market movements (given that Perpetual's revenue is significantly dependent on funds under management and funds under advice). For TSR performance greater than median, a sliding scale applies to determine the vesting percentage. TSR vesting schedule
Perpetual’s TSR ranking relative to the comparator group
Percentage of shares and options that will vest
Less than median 0%
Median 50%
Greater than median but less than 75th percentile 2% for every one percentile increase in Perpetual’s relative position
Greater than 75th percentile 100%
TSR is measured independently by Orient Capital and reported to the PARC. EPS performance target
The EPS performance target requires Perpetual’s EPS growth during the performance period to be equal to or greater than the target set by the Board. This target, which is currently 10% p.a., may be reviewed by the Board from time to time. The achievement of this performance target links the individual’s remuneration to the company’s growth in earnings.
44
For
per
sona
l use
onl
y

EPS vesting schedule
For LTI awarded to the Managing Director and Group Executives the following vesting schedule applies:
Perpetual’s growth in EPS Percentage of shares that will vest for grants made prior to 2010/11
Percentage of shares that will vest for grants made from 2010/11
EPS growth less than or equal to 5% p.a. 0%
EPS growth between 5% p.a. and 10% p.a.
0%
2% for every 0.1% of EPS growth
above 5% p.a.
EPS growth at or above 10% p.a. 100% 100%
Performance target testing and re-testing guidelines
A three-year performance testing period applies to TSR and EPS targets. For grants made before 1 July 2010, if the target is not met after the initial three-year period, it is re-tested on the fourth anniversary of the grant date, against four-year TSR and EPS targets. If the performance target is not met after this re-test, the portion of the LTI that has not vested is forfeited. For grants made after 1 July 2010, TSR and EPS performance is calculated and tested against the respective target on the third anniversary of the grant date. There is no retesting of grants made from 1 July 2010. Business unit performance targets
No new LTI with business unit performance targets has been granted to the Managing Director or Group Executives since February 2008. One Group Executive (Cathy Doyle) previously received LTI allocations which were linked to the achievement of stretch business unit targets. Shares subject to a profit target held by Cathy Doyle were re-tested as at 31 December 2011. As a result of that re-test no shares vested and all lapsed immediately. Refer to the table Unvested shareholdings of the Managing Director and Group Executives on page 54 for more information. Termination of employment
In the event of the Managing Director or Group Executive ceasing employment with the company, all unvested shares will be forfeited at the termination date, except as noted below. For LTI grants made in 2010/11 and 2011/12:
• On death, all unvested shares are retained by the executive’s estate, with vesting subject to the same performance conditions as if they had remained employed by Perpetual.
• If an executive is made redundant or retires, or resigns due to total and permanent disablement, unvested shares granted within the past 12 months lapse immediately. Unvested shares granted more than 12 months prior to termination are retained by the executive, with vesting subject to the same performance conditions as if they had remained employed by Perpetual.
This approach strengthens the alignment between executives’ and shareholders’ interest in the long-term performance of Perpetual, extending beyond the executives’ tenure. For LTI grants made before 2010/11:
• If an executive dies or resigns due to total and permanent disability, all unvested shares and options vest to the executive at the date of death or on termination.
• If an executive is made redundant or retires, the executive will be entitled to a pro rata portion of the grant based on the length of their employment (including any notice period actually given and any nominal notice period in respect of which any payment in lieu of notice is made). The pro rata amount will be based on the most recent performance targets to determine the number of shares and options that will vest.
45
For
per
sona
l use
onl
y

Treatment of LTI on change in control
If Perpetual were to be taken over or there were a partial or full change in control, LTI shares may vest in part or in full at the discretion of the Board. Guiding principles have been developed to help the Board determine vesting outcomes that are consistent, fair and reasonable, and balance multiple stakeholder interests. Impact of Perpetual Share Buy-Back on LTI
On 26 August 2011, Perpetual announced its intention to return up to approximately $70 million of shareholder capital through an off-market share buy-back which was executed in October 2011. This had an immaterial impact on remuneration outcomes. The Board determined that the EPS performance targets for LTI grants would not be adjusted in light of the buy-back. This approach was taken to ensure consistency with previous practice in that no adjustments have been made in the past for EPS dilutive actions such as issuing new shares for funding acquisitions. This approach was also applied for LTI grants with TSR targets to ensure that the approach for calculating TSR for all entities in the peer group was consistent. New arrangements for 2012/13
From October 2012, all new LTI grants will be made in the form of performance rights, meaning that dividends will not be received by the Managing Director and Group Executives until the performance rights have vested and been converted into Perpetual shares. Executives currently receive dividends on LTI shares during the three-year performance period. In adopting this practice, the value of expected dividends on LTI shares is included in total remuneration for executives for the purposes of benchmarking against market peers. We believe this practice aligns executives to shareholders by placing an appropriate balance of the executives’ focus on profit as well as share price performance. However, we acknowledge that this practice is not supported by shareholders and as a result we will change our approach for all new LTI grants to the Managing Director and Group Executives from October 2012. Dividends on unvested shares held by the Managing Director and Group Executives in respect of LTI previously granted will continue to be paid. The table below compares performance shares with performance rights at Perpetual.
Performance shares
(applied prior to October 2012) Performance rights
(to apply from October 2012)
Description
A right to full legal ownership of a Perpetual share at the end of a
performance period, subject to tenure and performance hurdles.
A right to acquire a fully paid Perpetual share, (or, subject to Board discretion, receive its cash value) at the end of a
performance period, subject to tenure and perfomance hurdles.
Ownership
Beneficial ownership of the share transfers to the executive at the initial grant date.
Full legal ownership may pass to the executive if the performance targets are
met at the end of the three-year performance period.
Full legal ownership of a share transfers to the executive once the rights vest if the
performance and tenure hurdles are met at the end of the three-year performance period and the rights are exercised into
shares.
Treatment of dividends Paid to executives. None
Voting rights Limited voting rights (for example, KMP are
not permitted to vote on remuneration matters).
None
46
For
per
sona
l use
onl
y

Performance shares
(applied prior to October 2012) Performance rights
(to apply from October 2012)
How is the number of securities issued each
year determined?
The number of shares granted is determined by dividing the value of the LTI
grant by the volume weighted average price (VWAP) of Perpetual shares traded on the ASX in the 5 business days up to
the grant date.
The number of performance rights granted is determined by dividing the value of the LTI
grant value by the VWAP of Perpetual shares traded on the ASX in the 5 business days up to the grant date, discounted for the
non-payment of dividends during the performance period, as calculated by an
independent external advisor.
6.2 Employee share plans Perpetual offers all employees (including KMP) the opportunity to participate in share plans. These are described below.
OPEN PLANS DESCRIPTION
Perpetual Limited Long-term Incentive Plan 189 members
From February 2011, this is the primary plan to be used for LTI grants to eligible employees, including the Managing Director and Group Executives.
Deferred Share Plan (DSP)
7 members
This plan is used for a small number of employees within the asset management team based in Australia, as part of their incentive arrangements. No KMP participate in this plan.
Shares held in the plan vest over the long-term subject to achievement of investment performance and succession targets.
The plan ensures the interests of these key employees are aligned with those of shareholders and clients over the longer-term and provides a strong retention element as employees who cease employment with Perpetual during the vesting period forfeit any unvested shares.
Tax Exempt Employee Share Purchase Plan (TESP) 66 members
This plan allows all employees, including the Managing Director and Group Executives, to purchase shares using a salary-sacrifice arrangement.
Employees may elect to sacrifice up to $1,000 of their cash STI payment into shares under the TESP. Shares acquired via this sacrifice are not subject to performance targets as they are acquired in lieu of a cash payment by the company; however the plan’s trading restrictions continue to apply until the earlier of three years from the date of grant or on termination of employment, before the shares can be released.
Tax Deferred Share Purchase Plan (TDSP) 66 members
This plan is used for awards made under the annual sales incentive plans for eligible employees within the Perpetual Private and Corporate Trust teams.
The plan was previously used by employees, including the Managing Director and Group Executives, to buy shares using a salary-sacrifice arrangement. The plan was closed to any new salary-sacrifice purchases during 2009/10.
PLANS CLOSED TO NEW ISSUE DESCRIPTION
Executive Share Plan (ESP) 185 members
Until February 2011, this was the main plan used for LTI grants to eligible employees, including the Managing Director and Group Executives.
47
For
per
sona
l use
onl
y

PLANS CLOSED TO NEW ISSUE DESCRIPTION
Global Employee Share Trust (GEST) 0 members
This plan was used for a small number of employees within the asset management team based in Ireland and United Kingdom (mainly those who were pivotal to the long-term success of Perpetual’s global asset management performance) as part of their incentive arrangements. No KMP participated in this plan.
This plan is in the process of being wound up following the closure of our offices in Ireland and the United Kingdom.
Employee Share Purchase Plan (ESPP) 148 members
This plan was used for granting shares under a non-recourse loan arrangement. It has been closed to new issues since 2003/2004.
The ESPP and another inactive plan, the Employee Reward Share Plan, are discussed in Note 27 to the Financial Statements.
Non-Executive Director Share Purchase Plan (NEDSPP) 4 members
This plan was used only by non-executive directors and was closed to new purchases on 1 July 2009, following changes to taxation rules.
Dilution limits for share plans
Shares awarded under Perpetual’s employee share plans may be purchased on market or issued subject to Board discretion and the requirements of the Corporations Act 2001 and the ASX Listing Rules. As at 30 June 2012, the proportion of unvested shares held in Perpetual’s employee share plans as a percentage of issued shares was 7.2%. Going forward, it is expected that dilution levels will reduce due to: • The likely forfeiture of shares granted as LTI as a result of performance measures not being met, • The de-emphasis of LTI in terms of the remuneration mix for executives, and • The intention to reduce the number of shares granted to asset managers as a result of the introduction of
an arrangement whereby asset managers may invest a portion of their incentives into the products that they manage.
The Board will manage the issue of shares under employee incentive plans to balance remuneration needs of employees with shareholder returns, subject to the relevant regulatory requirements. Refer to page 38 for detail on the share dealing approval process.
48
For
per
sona
l use
onl
y

7 Details of remuneration Index to tables Table Page Number Remuneration of the Managing Director and Group Executives 50
Remuneration components as a proportion of total remuneration 52
Value of unvested remuneration that may vest in future years 53
Unvested shareholdings of the Managing Director and Group Executives 54
49
For
per
sona
l use
onl
y

Remuneration of Managing Director and Group Executives (statutory reporting) Name
Fixed remuneration STI
Short-term Post employment
Total fixed remuneration
Fixed remuneration
& STI
LTI Payments made on
termination6
Total
Cash salary and short-term compensated
absences1
Non-monetary benefits2
Other3 Pension and super
Annual short term incentives and other bonuses4
Shares5
$ $ $ $ $ $ $ $ $ $
Managing Director
G Lloyd 2012 1,423,253 752,082 79,548 1,736 15,775 849,141 437,000 1,286,141 137,112 -
2011 2,034,017 528,857 59,982 701,625 15,199 1,305,663 307,700 1,613,363 420,654 -
Former Managing Director
C Ryan
2012 2,736,801 711,955 4,932 1,736 11,831 730,454 183,750 914,204 597,597 1,225,000
2011 1,307,244 407,732 4,828 637,084 47,600 1,097,244 150,000 1,247,244 60,000 -
Current Group Executives
R Brandweiner
2012 748,901 378,808 - 1,736 15,775 396,319 240,000 636,319 112,582 -
2011 701,873 345,218 - 1,825 15,199 362,242 204,800 567,042 134,831 -
R Burrows
2012 988,064 531,823 14,402 1,736 23,775 571,736 198,000 769,736 218,328 -
2011 1,247,282 528,566 14,402 1,825 23,699 568,492 307,200 875,692 371,590 -
C Doyle 2012 1,526,262 520,689 13,536 1,736 15,775 551,736 181,500 733,236 493,170 299,856
2011 1,044,417 486,248 45,535 1,825 15,199 548,807 281,600 830,407 214,010 -
C Green 2012 799,223 417,558 - 1,736 15,775 435,069 264,000 699,069 100,154 -
2011 700,197 353,391 - 1,825 15,199 370,415 204,800 575,215 124,982 -
B Henderson 2012 649,087 364,518 - 51,930 15,775 432,223 92,800 525,023 56,276 67,788
2011 79,508 - - 79,508 - 79,508 - 79,508 - -
I Holyman 2012 1,181,892 358,264 - 1,736 47,889 407,889 59,500 467,389 367,124 347,379
2011 837,085 363,377 - 1,825 48,738 413,940 175,100 589,040 248,045 -
R Vahtrick 2012 478,832 350,225 - 1,736 49,775 401,736 66,000 467,736 11,096 -
2011 16,946 14,206 - 23 2,717 16,946 - 16,946 - -
Current executives who were in Acting Group Executive roles during the year7
N Langton 2012 331,204 177,974 5,706 688 6,250 190,618 84,187 274,805 56,399 -
50
For
per
sona
l use
onl
y

Remuneration of Managing Director and Group Executives (statutory reporting) Name
Fixed remuneration STI
Short-term Post employment
Total fixed remuneration
Fixed remuneration
& STI
LTI Payments made on
termination6
Total
Cash salary and short-term compensated
absences1
Non-monetary benefits2
Other3 Pension and super
Annual short term incentives and other bonuses4
Shares5
$ $ $ $ $ $ $ $ $ $
P Chasemore 2012 39,502 29,981 - 147 1,724 31,852 6,011 37,863 1,639 -
Group Executives who departed during the year
J Stewart 2012 294,961 318,289 - 1,736 15,775 335,800 - 335,800 (67,128) 26,289
2011 523,468 318,134 - 1,825 15,199 335,158 102,400 437,558 85,910 -
Total 2012 11,197,982 4,912,166 118,124 68,389 235,894 5,334,573 1,812,748 7,147,321 2,084,349 1,966,312
Total 2011 8,492,037 3,345,729 124,747 1,429,190 198,749 5,098,415 1,733,600 6,832,015 1,660,022 -
1. Cash salary is the cash salary received in the year including payment for annual, long service, sick or other types of paid leave and higher duties allowances paid to Acting Group Executives.
2. Non-monetary benefits represent those amounts salary sacrificed from fixed remuneration to pay for benefits such as leased motor vehicles and car parking.
3. Other short-term benefits relate to: - salary continuance and death and total and permanent disability insurance provided as part of the remuneration package, - payments in respect of relocation expenses B Henderson ($50,194.47).
4. Annual incentives include best estimates if the cash payments to be made in September 2012 from the Group STI plan for performance during 2012 reporting year.
5. Share-based remuneration has been valued using the binomial method which takes into account the performance hurdles relevant to each issue of equity instruments. The value of each equity instrument has been provided by PricewaterhouseCoopers. Share-based remuneration is the amount expensed in the financial statements for the year and includes adjustments to reflect the most current expectation of vesting of LTI grants with non-market condition hurdles. For grants with non-market conditions including earnings per share hurdles, the number of shares expected to vest is estimated at the end of each reporting period and the amount to be expensed in the financial statements is adjusted accordingly. For grants with market conditions such as Total Shareholder Return hurdles, the number of shares expected to vest is not adjusted during the life of the grant and no adjustment is made to the amount expensed in the financial statements (except if service conditions are not met). The accounting treatment of non-market and market conditions is in accordance with Accounting Standards.
6. Final payments for executives: - who departed during the 2012 reporting year, including contractual termination payments made to C Ryan and annual leave entitlements paid to J Stewart, - who departed post the 2012 reporting year but whose termination payments were provided for in a 2012 reporting year restructure provision. These comprised payments in lieu of notice and severance for Cathy Doyle, Brian Henderson and Ivan Holyman. - In all cases, the entitlements paid on termination were less than the relevant caps required by legislation and as a result shareholder approval for these payments was not sought. - For the 2011 reporting year termination payments were included in the 'Other' column, under Short term, Fixed remuneration.
7. Represents the accounting value of remuneration while in acting Group Executive roles.
51
For
per
sona
l use
onl
y

Remuneration components as a proportion of total remuneration The remuneration components below are determined based on the “Remuneration of Managing Director and Group Executives (statutory reporting) table on page 50.
Performance linked benefits Name Fixed remuneration %
STI % LTI % Total % 2012 STI
(as % of Target)
Managing Director G Lloyd 59% 31% 10% 100% 52% Former Managing Director C Ryan 48% 12% 40% 100% 15% Current Group Executives R Brandweiner 53% 32% 15% 100% 60% R Burrows 58% 20% 22% 100% 33% C Doyle 45% 15% 40% 100% 33% C Green 54% 33% 13% 100% 60% B Henderson 74% 16% 10% 100% 33% I Holyman 49% 7% 44% 100% 17% R Vahtrick 84% 14% 2% 100% 33% Current executives who were in Acting Group Executive roles during the year N Langton 58% 25% 17% 100% 60% P Chasemore 81% 15% 4% 100% 64% Group Executives who departed during the year J Stewart 100% 0% 0% 100% N/A Note: The percentages in this table do not take into account payments made on termination.
52
For
per
sona
l use
onl
y

Value of unvested remuneration that may vest in future years
Estimates of the maximum future cost of equity based remuneration granted by the Company1 30-Jun-13 30-Jun-14 30-Jun-15 Maximum Maximum Maximum Managing Director G Lloyd 165,892 127,036 27,310 Former Managing Director C Ryan - - - Group Executives R Brandweiner 105,812 74,009 16,184 R Burrows 174,059 112,919 24,275 C Doyle 35,621 - - C Green 90,948 61,161 13,148 B Henderson 2,680 - - I Holyman 10,103 - - R Vahtrick 20,343 29,821 8,091 Current executives who were in Acting Group Executive roles during the year N Langton 57,406 53,254 8,750 P Chasemore 24,241 18,844 4,084 Group Executives who departed during the year J Stewart - - -
1. The minimum value of the grants is $nil if the performance targets are not met. The values above are determined in accordance with accounting standards. Fair value of shares is measured at grant date and amortised over the period during which employees become unconditionally entitled to the shares.
53
For
per
sona
l use
onl
y
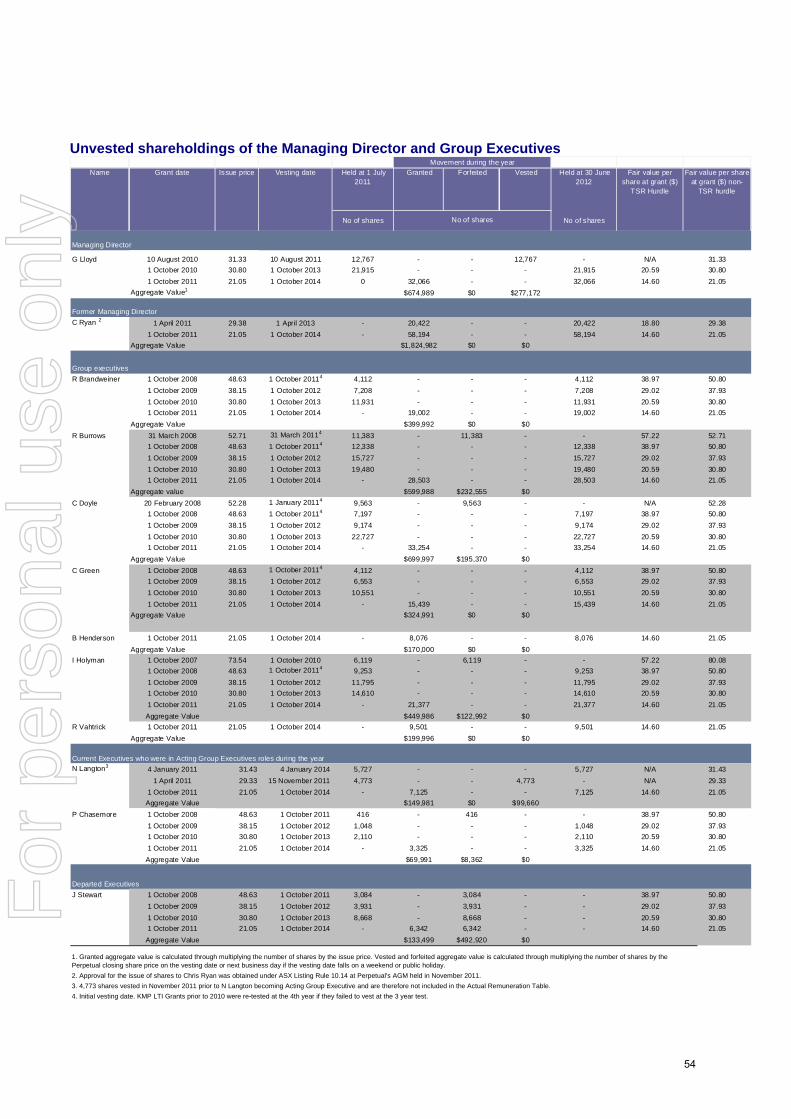
Unvested shareholdings of the Managing Director and Group Executives Name Grant date Issue price Vesting date Held at 1 July
2011 Granted Forfeited Vested Held at 30 June
2012 Fair value per
share at grant ($) TSR Hurdle
Fair value per share at grant ($) non-
TSR hurdle
No of shares No of shares
Managing Director
G Lloyd 10 August 2010 31.33 10 August 2011 12,767 - - 12,767 - N/A 31.331 October 2010 30.80 1 October 2013 21,915 - - - 21,915 20.59 30.801 October 2011 21.05 1 October 2014 0 32,066 - - 32,066 14.60 21.05
Aggregate Value1 $674,989 $0 $277,172
Former Managing DirectorC Ryan 2 1 April 2011 29.38 1 April 2013 - 20,422 - - 20,422 18.80 29.38
1 October 2011 21.05 1 October 2014 - 58,194 - - 58,194 14.60 21.05Aggregate Value $1,824,982 $0 $0
Group executivesR Brandweiner 1 October 2008 48.63 1 October 20114 4,112 - - - 4,112 38.97 50.80
1 October 2009 38.15 1 October 2012 7,208 - - - 7,208 29.02 37.931 October 2010 30.80 1 October 2013 11,931 - - - 11,931 20.59 30.801 October 2011 21.05 1 October 2014 - 19,002 - - 19,002 14.60 21.05
Aggregate Value $399,992 $0 $0R Burrows 31 March 2008 52.71 31 March 20114 11,383 - 11,383 - - 57.22 52.71
1 October 2008 48.63 1 October 20114 12,338 - - - 12,338 38.97 50.801 October 2009 38.15 1 October 2012 15,727 - - - 15,727 29.02 37.931 October 2010 30.80 1 October 2013 19,480 - - - 19,480 20.59 30.801 October 2011 21.05 1 October 2014 - 28,503 - - 28,503 14.60 21.05
Aggregate value $599,988 $232,555 $0C Doyle 20 February 2008 52.28 1 January 20114 9,563 - 9,563 - - N/A 52.28
1 October 2008 48.63 1 October 20114 7,197 - - - 7,197 38.97 50.801 October 2009 38.15 1 October 2012 9,174 - - - 9,174 29.02 37.931 October 2010 30.80 1 October 2013 22,727 - - - 22,727 20.59 30.801 October 2011 21.05 1 October 2014 - 33,254 - - 33,254 14.60 21.05
Aggregate Value $699,997 $195,370 $0C Green 1 October 2008 48.63 1 October 20114 4,112 - - - 4,112 38.97 50.80
1 October 2009 38.15 1 October 2012 6,553 - - - 6,553 29.02 37.931 October 2010 30.80 1 October 2013 10,551 - - - 10,551 20.59 30.801 October 2011 21.05 1 October 2014 - 15,439 - - 15,439 14.60 21.05
Aggregate Value $324,991 $0 $0
B Henderson 1 October 2011 21.05 1 October 2014 - 8,076 - - 8,076 14.60 21.05Aggregate Value $170,000 $0 $0
I Holyman 1 October 2007 73.54 1 October 2010 6,119 - 6,119 - - 57.22 80.081 October 2008 48.63 1 October 20114 9,253 - - - 9,253 38.97 50.801 October 2009 38.15 1 October 2012 11,795 - - - 11,795 29.02 37.931 October 2010 30.80 1 October 2013 14,610 - - - 14,610 20.59 30.801 October 2011 21.05 1 October 2014 - 21,377 - - 21,377 14.60 21.05
Aggregate Value $449,986 $122,992 $0R Vahtrick 1 October 2011 21.05 1 October 2014 - 9,501 - - 9,501 14.60 21.05
Aggregate Value $199,996 $0 $0
Current Executives who were in Acting Group Executives roles during the yearN Langton3 4 January 2011 31.43 4 January 2014 5,727 - - - 5,727 N/A 31.43
1 April 2011 29.33 15 November 2011 4,773 - - 4,773 - N/A 29.331 October 2011 21.05 1 October 2014 - 7,125 - - 7,125 14.60 21.05
Aggregate Value $149,981 $0 $99,660P Chasemore 1 October 2008 48.63 1 October 2011 416 - 416 - - 38.97 50.80
1 October 2009 38.15 1 October 2012 1,048 - - - 1,048 29.02 37.931 October 2010 30.80 1 October 2013 2,110 - - - 2,110 20.59 30.801 October 2011 21.05 1 October 2014 - 3,325 - - 3,325 14.60 21.05
Aggregate Value $69,991 $8,362 $0
Departed ExecutivesJ Stewart 1 October 2008 48.63 1 October 2011 3,084 - 3,084 - - 38.97 50.80
1 October 2009 38.15 1 October 2012 3,931 - 3,931 - - 29.02 37.931 October 2010 30.80 1 October 2013 8,668 - 8,668 - - 20.59 30.801 October 2011 21.05 1 October 2014 - 6,342 6,342 - - 14.60 21.05
Aggregate Value $133,499 $492,920 $0
Movement during the year
No of shares
3. 4,773 shares vested in November 2011 prior to N Langton becoming Acting Group Executive and are therefore not included in the Actual Remuneration Table.4. Initial vesting date. KMP LTI Grants prior to 2010 were re-tested at the 4th year if they failed to vest at the 3 year test.
2. Approval for the issue of shares to Chris Ryan was obtained under ASX Listing Rule 10.14 at Perpetual's AGM held in November 2011.
1. Granted aggregate value is calculated through multiplying the number of shares by the issue price. Vested and forfeited aggregate value is calculated through multiplying the number of shares by the Perpetual closing share price on the vesting date or next business day if the vesting date falls on a weekend or public holiday.
54
For
per
sona
l use
onl
y

8. Contract terms of the Managing Director and Group Executives
Contract terms for the current Managing Director
Contract Details
Geoff Lloyd, Managing Director and Chief Executive Officer from 6 February 2012
Term of contract Open-ended
Fixed Remuneration $1,100,000 per annum, reviewable in accordance with Perpetual’s policies.
STI Target STI of 100% of fixed remuneration. STI amounts are determined by the Board taking into account the executive’s performance against performance criteria determined by the Board annually. The performance criteria include threshold risk measures and behavior objectives which must be met by the executive for any STI to be awarded. Subject to the Board’s discretion, the executive may be required to apply a proportion of his STI payment to acquire deferred STI shares.
LTI Eligible to receive LTI grants of 80% of fixed remuneration provided by way of performance shares, performance rights or options in such proportions determined by the Board annually in its discretion.
Vesting of LTI grants is subject to performance targets determined by the Board and advised to the executive prior to the effective date of grant.
55
For
per
sona
l use
onl
y

Termination of employment
The agreement contains provisions for the termination of Mr Lloyd’s employment as follows: (a) Termination by Mr Lloyd on 12 months' notice in writing to the Board (or such shorter
period as may be agreed). In the event the Board agrees to a notice period of less than 12 months, the agreement will be subject to no entitlement to receive a payment of fixed remuneration (or any other remuneration or amount) in respect of any period after termination date. There is no entitlement for STI for that financial year; and unvested STI held as shares and all unvested LTI is forfeited.
(b) Termination by the Company on 12 months’ notice in writing (or such shorter period
as may be agreed). The Executive is entitled to be considered for a STI payment for that financial year; and unvested STI held as shares and unvested LTI due to vest within two years of the termination date, will remain eligible for vesting, subject to satisfaction of performance conditions in due course. Unvested LTI due to be tested after two years of the termination date is forfeited.
(c) If the executive becomes incapacitated by illness or injury for an accumulated period
of three months in any 12 month period, the Company may terminate this agreement by giving 12 months’ notice in writing (or such shorter period as may be agreed). The Executive is entitled to a pro-rata STI for that financial year; and unvested STI held as shares and unvested LTI due to vest within two years of the termination date, will remain eligible for vesting, subject to satisfaction of performance conditions in due course. Unvested LTI due to be tested after two years of the termination date is forfeited.
(d) Termination without notice following an Agreed Material Diminution Event. Upon
such termination, the company must, within 7 days, pay the Executive fixed remuneration in lieu of 12 months’ notice and a pro-rata STI for that financial year. Unvested STI held as shares and unvested LTI due to vest within two years of the termination date, will remain eligible for vesting, subject to satisfaction of performance conditions in due course. Unvested LTI due to be tested after two years of the termination date is forfeited.
(e) Termination by the Company for poor performance on six months’ notice in writing
(or such shorter period as may be agreed) or termination by the Company without notice. There is no entitlement for STI for that financial year; and unvested STI held as shares and all unvested LTI is forfeited.
(f) Termination in the event of Mr Lloyd's death - his estate is entitled to pro-rata STI for
that financial year; and unvested STI held as shares and unvested LTI remain eligible for vesting subject to satisfaction of performance conditions in due course.
The agreement also provides that the Company may elect to make a payment in lieu of notice.
56
For
per
sona
l use
onl
y

Contract terms for the former Managing Director
Contract Details
Chris Ryan, Managing Director and Chief Executive Officer until 5 February 2012
Overview Perpetual made payments to Mr Ryan upon the termination of his employment in accordance with his contract.
This provided for a cash payment of $1,225,000 in lieu of 12 months’ notice.
Mr Ryan was eligible for consideration for an STI for the 2011/2012 year and retained all unvested shares. Vesting of unvested shares is conditional upon the performance targets being met at the end of the relevant performance period. Refer to the table Unvested shareholdings of the Managing Director and Group Executives for more information.
Fixed Remuneration $1,225,000 per annum, reviewable in accordance with Perpetual’s policies.
STI • Target STI of 100% of fixed remuneration. • Subject to the Board’s assessment of criteria, including threshold risk measures and
behaviour objectives which must be met by the Executive for any STI to be awarded. • Subject to the Board’s direction, the Executive may be required to apply the proportion of
his actual STI payment in excess of 100% fixed remuneration to acquire deferred STI shares.
LTI Eligible to receive LTI grants of 100% of fixed remuneration (or such greater amounts as
may be determined by the Board from year to year) provided by way of either or both performance shares and options in such proportions determined by the Board annually in its discretion.
Grants are divided into two equal tranches, with the following performance targets being applied to each tranche: 1. TSR performance target If Perpetual’s TSR ranking relative to the comparator group is: - less than the median, 0% vests; - at the median, 50% vests; - greater than the median but less than 75%, 50% plus 2% for every percentile increase
vests; and - 75% or above, 100% vests. 2. EPS performance target If Perpetual’s growth in EPS is: - less than or equal to the threshold EPS growth target, 0% vests; - greater than the threshold EPS growth target but less than the maximum EPS growth
target, 2% for every 0.1% of EPS growth in excess of threshold EPS growth target. - at or above the maximum EPS growth target, 100% vests. The TSR and EPS targets are tested on the third anniversary of the grant date. After this date, any unvested portion is forfeited.
57
For
per
sona
l use
onl
y

Sign-on entitlements
In recognition of the remuneration foregone by Mr Ryan as a consequence of joining Perpetual, a sign-on entitlement was agreed:
(i) $500,000 gross (less applicable taxation) to be paid in cash three months after the commencement date; and
(ii) $600,000 in the form of performance shares (subject to shareholder approval) subject to vesting conditions (50% subject to a relative TSR hurdle and 50% subject to an EPS hurdle, as described above) measured over a two-year performance period (1 April 2011 to 1 April 2013).
Relocation benefits Reasonable costs associated with Mr Ryan’s relocation from Hong Kong to Sydney will be met by the Company in accordance with Perpetual’s Relocation Policy.
Termination of employment
The agreement contained provisions for the termination of Mr Ryan’s employment as follows: (a) Termination by Mr Ryan on 12 months' notice in writing to the Board (or such shorter
period as may be agreed). In the event the Board agrees to a notice period of less than 12 months, the agreement will be subject to no entitlement to receive a payment of fixed remuneration (or any other remuneration or amount) in respect of any period after termination date. There is no entitlement for STI for that financial year; and unvested STI held as shares, all unvested LTI and unvested share-based sign-on is forfeited.
(b) Termination by the Company on 12 months’ notice in writing (or such shorter period as
may be agreed). The Executive is entitled to be considered for a STI payment for that financial year; and unvested STI held as shares, unvested LTI and unvested share-based sign-on due to vest within two years of the termination date, will remain eligible for vesting, subject to satisfaction of performance conditions in due course. Unvested LTI due to be tested after two years of the termination date is forfeited.
(c) If the executive becomes incapacitated by illness or injury for an accumulated period
of three months in any 12 month period, the Company may terminate this agreement by giving 12 months’ notice in writing (or such shorter period as may be agreed). The Executive is entitled to a pro-rata STI for that financial year; and unvested STI held as shares, unvested LTI and unvested share-based sign-on due to vest within two years of the termination date, will remain eligible for vesting, subject to satisfaction of performance conditions in due course. Unvested LTI due to be tested after two years of the termination date is forfeited.
(d) Termination without notice following an Agreed Material Diminution Event. Upon such
termination, the company must, within 7 days, pay the Executive fixed remuneration in lieu of 12 months’ notice and a pro-rata STI for that financial year. Unvested STI held as shares, unvested LTI and unvested share-based sign-on due to vest within two years of the termination date, will remain eligible for vesting, subject to satisfaction of performance conditions in due course. Unvested LTI due to be tested after two years of the termination date is forfeited.
(e) Termination by the Company for poor performance on six months’ notice in writing (or
such shorter period as may be agreed) or termination by the Company without notice. There is no entitlement for STI for that financial year; and unvested STI held as shares, all unvested LTI and unvested share-based sign-on is forfeited.
(f) termination in the event of Mr Ryan's death - his estate is entitled to pro-rata STI for
that financial year; and unvested STI held as shares, unvested LTI and unvested share-based sign-on remain eligible for vesting subject to satisfaction of performance conditions in due course.
The agreement also provided that the Company may elect to make a payment in lieu of notice.
58
For
per
sona
l use
onl
y

Termination provisions for Group Executives
Term Who Conditions Duration of Contract Brian Henderson 4 years from the commencement date (unless terminated
earlier in accordance with the termination provisions) All other Group Executives Ongoing until notice is given by either party
Nick Langton 2 months Notice to be provided by Group Executive to terminate the employment agreement
All other Group Executives 3 months
Roger Burrows 6 months
Nick Langton 2 months
Notice to be provided by Perpetual to terminate the employment agreement for poor performance
All other Group Executives 3 months
Roger Burrows 6 months
Ivan Holyman 3 months' notice plus 3 weeks per completed year of service (up to 52 weeks)
Nick Langton 2 months
Notice to be provided by Perpetual to terminate the employment agreement without cause
All other Group Executives 3 months
Payment in lieu of notice Termination payments and/or benefits to be made on termination without cause
All Group Executives Group Executives are entitled to payment in lieu of any unexpired part of the notice period
STI All Group Executives Subject to the terms and conditions of the STI plan
LTI
All Group Executives Subject to the terms of the offer and LTI plan
Termination for cause Payment in lieu of notice
Roger Burrows 6 months
Nick Langton 2 months
All other Group Executives 3 months
STI
All Group Executives Subject to the terms and conditions of the STI plan
LTI
All Group Executives Subject to the terms of the offer and LTI plan
Post-employment restraints All Group Executives 6 month non-solicitation restraint
59
For
per
sona
l use
onl
y

9. Remuneration of Non-executive Directors Remuneration Policy The company’s Remuneration Policy for Non-executive Directors aims to ensure we can attract and retain suitably skilled, experienced and committed individuals to serve on the Board. Non-executive Directors do not receive performance-related remuneration and are not entitled to receive performance shares or options over Perpetual shares. Fee framework Non-executive Directors receive a base fee. Except for the Chairman, they also receive fees for participating in Board Committees (other than the Nominations Committee), either as Chairman or as a member of a Committee. As discussed at page 28 above these fees have been reduced effective 1 July 2012. Non-executive Directors’ fees 2011/12 2012/13 % reduction $ $ Chairman 484,275 280,000 42%
Directors 185,775 140,000 25%
Audit Risk and Compliance Committee Chairman 40,000 30,000 25%
Audit Risk and Compliance Committee Member 20,000 15,000 25%
People and Remuneration Committee Chairman 28,500 20,000 30%
People and Remuneration Committee Member 14,250 12,000 16%
Investment Committee Chairman 28,500 15,000 47%
Investment Committee Member 14,250 10,000 30%
Nominations Committee Member Nil Nil Nil The fees above are inclusive of superannuation contributions of 9%, capped at the maximum prescribed under Superannuation Guarantee legislation. Non-executive Directors may receive employer superannuation contributions in one of Perpetual’s employee superannuation funds or in a complying fund of their choice. Non-executive Directors may also salary-sacrifice superannuation contributions out of their base fee if they wish. Total remuneration available to Non-executive Directors is approved by shareholders and is currently $2,250,000, as approved at the 2006 annual general meeting. Total fees paid to Non-executive Directors in 2012 were $1,693,432. More details are provided on page 62. Alignment with shareholder interests The constitution requires Non-executive Directors to acquire a minimum of 500 Perpetual shares on appointment and at least 1,000 shares when they have held office for three years. The Non-executive Directors’ Share Purchase Plan (now closed) allowed Non-executive Directors to sacrifice up to 50% of their directors’ fees to acquire shares in Perpetual. Shares acquired in this way are not subject to performance targets, as they are acquired in place of cash payments. Following changes to tax rules, this plan was closed on 1 July 2009. Shares are held in the plan until the earlier of 10 years or retirement from the Board.
60
For
per
sona
l use
onl
y

Non-executive Directors do not receive share options. Directors’ holdings held directly or indirectly (for example, through a superannuation fund) are shown on page 62. Retirement Policy Non-executive Directors who have held office for three years since their last appointment must retire and seek re-election at the annual general meeting. In order to revitalise the Board, Perpetual’s Non-executive Directors agree not to seek re-election after three terms of three years. However, the Board may invite a non-executive director to continue in office beyond nine years if it is advantageous to the company for reasons such as leadership or continuity. Non-executive Director fees and responsibilities*
Peter B Scott Meredith J Brooks1
Paul Brasher Philip Bullock E Paul McClintock
Elizabeth M Proust
Philip J Twyman
$ $ $ $ $ $ $ Board fees (per annum)
Chairman
468,500
-
-
-
-
-
- Independent Director
-
170,000
170,000
170,000
170,000
170,000
170,000
Committee fees (per annum) Audit Risk and Compliance Committee
Chairman
-
-
-
-
-
-
40,000
Member
-
20,000
20,000
-
-
20,000
-
People and Remuneration Committee
Chairman
-
-
-
-
-
28,500
-
Member
-
-
14,250
14,250
14,250
-
-
Investment Committee
Chairman
-
-
-
-
28,500
-
-
Member
-
14,250
-
14,250
-
-
14,250
Nomination Committee2
Member
-
-
-
-
-
-
-
Appointed July 2005 as Director and
October 2010 as Chairman
November 2004
November 2009 June 2010 April 2004 January 2006 November
2004
* In addition to committee fees, directors are entitled to minimum superannuation guarantee contributions. See page 60 for information on agreed fee reductions from 1 July 2012. 1. Meredith J Brooks resigned effective 28 October 2011. Amounts shown above are annual, see page 62 for payments in accordance with accounting standards.
2. From 1 July 2011 no fees were paid to any members for serving on the Nominations Committee
61
For
per
sona
l use
onl
y

Remuneration of the Non-executive Directors (statutory reporting)
Name Total Short-term Post employment
Cash salary, fees and short-
term compensated absences1 Pension and
Superannuation2 2012 2011 2012 2011 2012 2011 $ $3 $ $ $ $ P B Scott 484,275 402,303 468,500 387,104 15,775 15,199 P Brasher 220,025 219,449 170,025 169,449 50,000 50,000 M J Brooks 72,032 219,449 66,774 204,250 5,258 15,199 P Bullock 214,275 210,711 198,500 195,512 15,775 15,199 E P McClintock 228,525 242,199 212,750 227,000 15,775 15,199 E M Proust 234,275 247,949 218,500 232,750 15,775 15,199 P J Twyman 240,025 253,699 224,250 238,500 15,775 15,199 TOTAL 1,693,432 1,795,759 1,559,299 1,654,565 134,133 141,194
1. Under a share purchase plan for non-executive directors approved by shareholders on 20 October 1998, non-executive directors may sacrifice up to 50 per cent of their fees to acquire shares in the company. 2. Non-executive directors do not receive any non-cash benefits as part of their remuneration.
3. The total shown relates to non executive directors disclosed in the 2012 Annual Report and so does not equal the 2011 totals disclosed in the 2011 report.
Non-executive Director holdings held directly or indirectly
Name
Balance at the start of the year, or for
directors appointed in the year, the date of
appointment
Shares acquired via salary sacrifice
during the year
Other changes
during the year
Balance at the end of the year, or for directors who
retired in the year, the date of retirement
No. of Shares P B Scott 2,291 - 140 2,431
P V Brasher 1,000 - - 1,000
M Brooks 6,156 - 380 6,536
P Bullock 1,000 - 1,000 2,000
E P McClintock 9,203 - 391 9,594
E Proust 4,401 - 149 4,550
P J Twyman 8,107 - - 8,107
62
For
per
sona
l use
onl
y

Directors' Report For The Year Ended 30 June 2012 (continued)
Chief Executive Officer's and Chief Financial Officer's Declaration
Non-audit services
Rounding off
This report is made in accordance with a resolution of the directors:
Peter B Scott Geoff LloydChairman Chief Executive Officer and Managing Director
Sydney 30 August 2012
The Company is of a kind referred to in ASIC Class Order 98/100 dated 10 July 1998 and in accordance with that Order, amounts in the financial report and the Directors' Report have been rounded off to the nearest thousand dollars, unless otherwise stated.
The Chief Executive Officer and Chief Financial Officer declared in writing to the Board, in accordance with section 295A of the Corporations Act 2001 that the financial records of the Company for the financial year have been properly maintained, the Company's financial reports for the year ended 30 June 2012 comply with accounting standards and present a true and fair view of the Company's financial condition and operational results. This statement is required annually.
During the year KPMG, the Company's auditor, did not perform other non-audit services in addition to their statutory duties (2011: $288,000).
The Board has a review process in relation to any non-audit services provided by the external auditor.
The Lead Auditor's independence declaration for the 30 June 2012 financial year is included at the end of this report.
63
For
per
sona
l use
onl
y

ABCD
KPMG, an Australian partnership and a member firm of the KPMG network of independent member firms affiliated with KPMG International Cooperative (“KPMG International”), a Swiss entity.
Liability limited by a scheme approved under Professional Standards Legislation.
Lead Auditor’s Independence Declaration under Section 307C of the Corporations Act 2001
To: the directors of Perpetual Limited
I declare that, to the best of my knowledge and belief, in relation to the audit for the financial year ended 30 June 2012 there have been:
(i) no contraventions of the auditor independence requirements as set out in the Corporations Act 2001 in relation to the audit; and
(ii) no contraventions of any applicable code of professional conduct in relation to the audit.
KPMG
Andrew Yates Partner
Sydney
30 August 2012
64
For
per
sona
l use
onl
y

Page No.
Consolidated Statement of Comprehensive Income 66
Balance Sheet 68
Statement of Changes in Equity 69
Cash Flow Statement 70
Notes to the Financial StatementsNote 1. Reporting entity 71Note 2. Summary of significant accounting policies 71Note 3. Revenue from continuing operations 87Note 4. Net profit before tax 87Note 5. Individually significant items included in profit for the year 88Note 6. Segment information 89Note 7. Discontinued operations held for sale 91Note 8. Auditor's remuneration 93Note 9. Income tax expense 94Note 10. Deferred tax assets/(liabilities) 95Note 11. Dividends 97Note 12. Earnings per share 98Note 13. Cash and cash equivalents 98Note 14. Receivables 99Note 15. Assets and liabilities held for sale 99Note 16. Other financial assets 101Note 17. Derivative financial instruments 101Note 18. Property, plant and equipment 102Note 19. Intangibles 103Note 20. Prepayments 104Note 21. Payables 104Note 22. Structured products - income received in advance 104Note 23. Non-current interest-bearing liabilities 105Note 24. Provisions 105Note 25. Contributed equity 106Note 26. Reserves 107Note 27. Employee benefits 107Note 28. Financial arrangements 112Note 29. Financial risk management 113Note 30. Structured products assets and liabilities 124Note 31. Commitments 128Note 32. Contingencies 128Note 33. Related parties 128Note 34. Controlled entities 129Note 35. Parent entity disclosures 131Note 36. Business combinations 132Note 37. Notes to the Cash Flow Statement 133Note 38. Subsequent events 134Note 39. Remuneration details provided as part of the financial report 135
Directors' Declaration 140
Independent Auditor's Report to the members of Perpetual Limited 141
Securities exchange and investor information 143
Table of contents
Financial Statements of Perpetual Limited and its controlled entities for the year ended 30 June 2012
65
For
per
sona
l use
onl
y

Consolidated Statement of Comprehensive Income for the year ended 30 June 2012
Note 2012 2011$'000 $'000
Re-presented *
Revenue from the provision of services 349,118 390,39542,010 69,149
Investment income 8,380 13,964
Total revenue from continuing operations 3 399,508 473,508
Staff related expenses excluding equity remuneration expense (194,637) (203,554)Occupancy expenses (18,085) (17,656)Administrative and general expenses (62,733) (63,240)
(36,355) (50,904)
Financing costs (2,479) (3,627)Equity remuneration expense (12,248) (18,585)Depreciation and amortisation expense 4 (13,509) (13,932)
Proceeds from sale of investments 54,349 75,138Cost of investments disposed of (53,990) (68,977)
Impairment of property, plant and equipment 5 (3,356) -Impairment of available-for-sale securities 5 (8,412) (1,534)Impairment of intangible assets 5 (14,498) (14,694)Gain on sale of businesses 5 1,151 -
Net profit before tax from continuing operations 34,706 91,943
Income tax expense (13,893) (31,519)Income tax expense on disposal of investments 5 - (722)Income tax expense 9 (13,893) (32,241)
Net profit after tax from continuing operations 20,813 59,702
Discontinued operationNet profit after tax from discontinued operation 7 2,230 2,666
Net profit after tax 23,043 62,368
(Loss)/profit after tax attributable to non-controlling interests (3,636) 337
26,679 62,031
Consolidated
Income from structured products
Distributions and expenses relating to structured products
The Consolidated Statement of Comprehensive Income is to be read in conjunction with the 'Notes to the Financial Statements' set out on pages 71 to 139.
Net profit after tax attributable to equity holders of Perpetual Limited
* Prior year comparatives have been re-presented due to the discontinued operation, refer to note 7.
66
For
per
sona
l use
onl
y

Note 2012 2011$'000 $'000
Re-presented *
Net profit after tax 23,043 62,368
Other comprehensive (expense)/income, net of tax
Available-for-sale reserve
(11,221) 1,761
8,412 1,534
(2,115) (2,416)
Cash flow hedge reserve(79) 38
Foreign currency reserveForeign exchange translation differences (744) (1,288)
Other comprehensive expense, net of income tax (5,747) (371)
Total comprehensive income 17,296 61,997
Non-controlling interests (4,691) 588Equity holders of Perpetual Limited 21,987 61,409Total comprehensive income 17,296 61,997
Earnings per share
12 68.6 152.7
12 64.0 140.8
Earnings per share - continuing operations
12 62.9 146.2
12 58.6 134.8
Loss of previously impaired available-for-sale financial assets reclassified to profit and loss upon disposal
Net (decrease)/increase in fair value of available-for-sale financial assets
Consolidated Statement of Comprehensive Income for the year ended 30 June 2012 (continued)
Diluted earnings per share attributable to ordinary equity holders – cents per share
Consolidated
Impairment of available-for-sale financial assets reclassified to profit and loss
The Consolidated Statement of Comprehensive Income is to be read in conjunction with the 'Notes to the Financial Statements' set out on pages 71 to 139.
Effective portion of changes in fair value of cash flow hedges
Total comprehensive income is attributable to:
Basic earnings per share attributable to ordinary equity holders – cents per share
* Prior year comparatives have been re-presented due to the discontinued operation, refer to note 7.
Basic earnings per share attributable to ordinary equity holders – cents per share Diluted earnings per share attributable to ordinary equity holders – cents per share
67
For
per
sona
l use
onl
y

Balance Sheet as at 30 June 2012
Note 2012 2011$'000 $'000
Current assetsCash and cash equivalents 13 153,057 220,320Receivables 14 58,237 72,722Assets held for sale 15 14,033 754Other financial assets 16 100 100Current tax assets 9 1,282 -Structured products – EMCF assets 30(i) 694,621 899,146Structured products – receivable from investors 30(ii) 24,222 20,806Prepayments 20 8,803 6,525
Total current assets 954,355 1,220,373
Non-current assetsOther financial assets Structured products – loans receivable from investors 30(ii) 84,943 130,253Property, plant and equipment 18 19,668 26,310Intangibles 19 122,691 148,326Deferred tax assets 10 30,820 34,413Prepayments 20 369 614
Total non-current assets 298,207 393,648
Total assets 1,252,562 1,614,021
Current liabilitiesPayables 21 31,283 40,342Liabilities held for sale 15 5,612 904Structured products – EMCF liabilities 30(i) 695,199 896,348Structured products – interest-bearing liabilities 29(ii) 23,046 17,386Structured products – income received in advance 22 7,138 11,057Derivative financial instruments 17 768 613Current tax liabilities 9 - 15,468Employee benefits 27 40,592 40,792Provisions 24 2,226 1,585 Total current liabilities 805,864 1,024,495
Non-current liabilitiesInterest-bearing liabilities 23 45,000 45,000Structured products – interest-bearing liabilities 29(ii) 88,370 134,109Deferred tax liabilities 10 8,471 7,533Employee benefits 27 3,255 3,201Provisions 24 21,141 23,582
Total non-current liabilities 166,237 213,425
Total liabilities 972,101 1,237,920
Net assets 280,461 376,101
EquityContributed equity 25 236,530 245,066Reserves 26 24,228 44,245Retained earnings 7,440 76,705
Total equity attributable to equity holders of Perpetual Limited 268,198 366,016
Non-controlling interest 12,263 10,085
Total equity 280,461 376,101
Consolidated
The Balance Sheet is to be read in conjunction with the 'Notes to the Financial Statements' set out on pages 71 to 139.
39,716 53,73216
68
For
per
sona
l use
onl
y

Statement of Changes in Equity for the year ended 30 June 2012
Consolidated Total
$'000Balance at 1 July 2011 411,947 (166,881) 245,066 3,499 103 (4,635) 45,694 (416) 44,245 76,705 366,016 10,085 376,101
Total comprehensive income/(expense) - - - (3,869) - (744) - (79) (4,692) 26,679 21,987 (4,691) 17,296
Issue of ordinary shares 47 - 47 - - - - - - - 47 - 47Employee Share Purchase Plan loan repayments during the year - 190 190 - - - - - - - 190 - 190Treasury shares issued during the year 13,947 (13,947) - - - - - - - - - - -Treasury shares purchased on market - (1,050) (1,050) - - - - - - - (1,050) - (1,050)Treasury shares vested during the year - 23,163 23,163 - - - (23,163) - (23,163) - - - -Fair value adjustment on recycled and vested TSR shares (15,488) 15,488 - - - - - - - - - - -Off market share buy-back (30,886) - (30,886) (39,127) (70,013) - (70,013)Dividends paid to shareholders - - - - - - - - - (61,197) (61,197) - (61,197)Dividends reinvestment plan allotment - - - - - - - - - - - - -Dividends paid on treasury shares - - - - - - (4,380) - (4,380) 4,380 - - -Equity remuneration expense - - - - - - 12,218 - 12,218 - 12,218 - 12,218Non-controlling interest - - - - - - - - - - - 6,869 6,869Balance at 30 June 2012 379,567 (143,037) 236,530 (370) 103 (5,379) 30,369 (495) 24,228 7,440 268,198 12,263 280,461
CHECK CHECK CHECK CHECK CHECK CHECK
Consolidated Total
$'000Balance at 1 July 2010 379,392 (173,375) 206,017 2,871 103 (3,347) 57,688 (454) 56,861 96,494 359,372 1,652 361,024
Total comprehensive income/(expense) - - - 628 - (1,288) - 38 (622) 62,031 61,409 588 61,997
Issue of ordinary shares 93 - 93 - - - - - - - 93 - 93Employee Share Purchase Plan loan repayments during the year - 177 177 - - - - - - - 177 - 177Treasury shares issued during the year 23,726 (23,726) - - - - - - - - - - -Treasury shares vested during the year - 24,777 24,777 - - - (24,777) - (24,777) - - - -Fair value adjustment on recycled and vested TSR shares (5,308) 5,308 - - - - - - - - - - -Dividends on treasury shares used to purchase equity - (42) (42) - - - 42 - 42 - - - -Dividends paid to shareholders - - - - - - - - - (73,774) (73,774) - (73,774)Dividends reinvestment plan allotment 14,044 - 14,044 - - - - - - (14,044) - - -Dividends paid on treasury shares - - - - - - (5,747) - (5,747) 5,747 - - -Equity remuneration expense - - - - - - 18,488 - 18,488 - 18,488 - 18,488Non-controlling interest - - - - - - - - - 251 251 7,845 8,096Balance at 30 June 2011 411,947 (166,881) 245,066 3,499 103 (4,635) 45,694 (416) 44,245 76,705 366,016 10,085 376,101
The Statement of Changes in Equity is to be read in conjunction with the 'Notes to the Financial Statements' set out on pages 71 to 139.
Gross contributed
equity
Treasury share
reserve
Total contributed
equity
Available-for-sale reserve
General reserve
Foreign currency
translation reserve
Equity compensation
reserve
Total reserves
Cash flow hedge
reserve
Total reserves
Retained earnings
Retained earnings
General reserve
Foreign currency
translation reserve
Equity compensation
reserve
Cash flow hedge
reserve
Gross contributed
equity
Treasury share
reserve
Total contributed
equity
Available-for-sale reserve
Equity holders of Perpetual
Non-controlling interest
Non-controlling interest
Equity holders of Perpetual
69
For
per
sona
l use
onl
y

Cash Flow Statement for the year ended 30 June 2012
Note 2012 2011$'000 $'000
Cash flows from operating activitiesCash receipts in the course of operations 444,188 503,416Cash payments in the course of operations (358,740) (361,794)Dividends received 892 1,101Interest received 8,709 11,954Interest paid (2,479) (3,627)Income taxes paid (26,123) (36,566)Net cash from operating activities 37 66,447 114,484
Cash flows from investing activitiesPayments for property, plant, equipment and software (10,193) (13,884)Payments for investments (50,461) (74,227)Repayments of advances made under the Employee Share Purchase Plan 190 177Acquisition of business (net of cash acquired) (1,110) (9,673)Proceeds from the sale of investments 54,349 75,138Repayment of Palisade loan - 7,165Tax paid on sale of investments - (722)Net cash used in investing activities (7,225) (16,026)
Cash flows from financing activitiesProceeds from issue of shares - 14,044Sale of units in seed funds to non-controlling interests 5,711 8,097Share buy back (LTI market purchase) (986) -Off market share buy back (70,013) -Dividends paid (61,197) (87,818)Net cash used in financing activities (126,485) (65,677)
Net (decrease)/increase in cash and cash equivalents (67,263) 32,781Cash and cash equivalents at 1 July 220,320 187,539
Cash and cash equivalents at 30 June 13 153,057 220,320
Consolidated
The Cash Flow Statement is to be read in conjunction with 'Notes to the Financial Statements' set out on pages 71 to 139.
70
For
per
sona
l use
onl
y

Note 1. Reporting entity
The financial report was authorised for issue by the Directors on 30 August 2012.
Note 2. Summary of significant accounting policies
i. Statement of compliance
ii. Basis of preparation
Note 10. Deferred tax assets/(liabilities)Note 17. Derivative financial instrumentsNote 19. IntangiblesNote 24. ProvisionsNote 27. Employee benefitsNote 30. Structured products assets and liabilitiesNote 32. Contingencies
Notes to and forming part of the financial statements for the year ended 30 June 2012
Perpetual Limited ("the Company") is domiciled in Australia. The consolidated financial report of the Company as at and for the year ended 30 June 2012 comprises the Company and its controlled entities (together referred to as "the consolidated entity") and the consolidated entity’s interests in associates.
The financial report is a general purpose financial report prepared in accordance with Australian Accounting Standards adopted by the Australian Accounting Standards Board (AASB) and the Corporations Act 2001.
The financial report of the consolidated entity also complies with International Financial Reporting Standards adopted by the International Accounting Standards Board (IASB).
The consolidated annual report for the consolidated entity as of and for the year ended 30 June 2012 is available at www.perpetual.com.au.
In particular, information about significant areas of estimation uncertainty and critical judgements in applying accounting policies that have the most significant effect on the amount recognised in the consolidated financial report is disclosed in:
The consolidated financial statements have been prepared on a historical cost basis, except for available-for-sale financial assets and derivative financial instruments which are measured at fair value. Non-current assets are stated at the lower of carrying amount or fair value less selling costs.
The consolidated financial statements are presented in Australian dollars, which is the functional currency of the majority of the consolidated entity.
The Company is of a kind referred to in ASIC Class Order 98/100 dated 10 July 1998 and in accordance with that Class Order, all financial information presented in Australian dollars has been rounded to the nearest thousand unless otherwise stated.
The preparation of the financial report requires management to make judgements, estimates and assumptions that affect the application of accounting policies and the reported amounts of assets, liabilities, income and expenses. Actual results may differ from these estimates. Estimates and underlying assumptions are reviewed on an ongoing basis. Revisions to accounting estimates are recognised in the period in which the estimate is revised and in any future periods affected.
71
For
per
sona
l use
onl
y

Note 2. Summary of significant accounting policies (continued)
iii. Basis of consolidation
(a) Business combinations
Business combinations are accounted for using the acquisition method as at the acquisition date, which is the date on which control is transferred to the Group. Control is the power to govern the financial and operating policies of an entity so as to obtain benefits from its activities. In assessing control, the Group takes into consideration potential voting rights that currently are exercisable.
- the fair value of the consideration transferred; plus
Notes to and forming part of the financial statements for the year ended 30 June 2012
- the recognised amount of any non-controlling interests in the acquiree; plus if the business combination is achieved in stages, the fair value of the existing equity interest in the acquiree; less
Acquisitions on or after 1 July 2009For acquisitions on or after 1 July 2009, the Group measures goodwill at the acquisition date as:
- the net recognised amount (generally fair value) of the identifiable assets acquired and liabilities assumed.
When the excess is negative, a bargain purchase gain is recognised immediately in profit.
The consideration transferred does not include amounts related to the settlement of pre-existing relationships. Such amounts are generally recognised in profit or loss.
Costs related to the acquisition, other than those associated with the issue of debt or equity securities, that the Group incurs in connection with a business combination are expensed as incurred.
Any contingent consideration payable is recognised at fair value at the acquisition date. If the contingent consideration is classified as equity, it is not remeasured and settlement is accounted for within equity. Otherwise, subsequent changes to the fair value of the contingent consideration are recognised in profit or loss.
When share-based payment awards (replacement awards) are required to be exchanged for awards held by the acquiree's employees (acquiree's awards) and related to past services, then all or a portion of the amount of the acquirer's replacement award is included in measuring the consideration transferred in the business combination. This determination is based in the market-based value of the replacement awards compared with the market-based value of the acquiree's awards and the extent to which the replacement awards relate to past and/or future service.
Acquisition between 1 July 2004 and 1 July 2009For acquisitions between 1 July 2004 and 1 July 2009, goodwill represents the excess of the cost of the acquisition over the Group's interest in the recognised amount (generally fair value) of the identifiable assets, liabilities and contingent liabilities of the acquiree. When the excess was negative, a bargain purchase gain was recognised immediately in profit or loss.
Transaction costs, other than those associated with the issue of debt or equity securities, that the Group incurred in connection with business combinations were capitalised as part of the cost of the acquisition.
Acquisition prior to 1 July 2004 (date of transition to IFRSs)As part of its transition to IFRSs, the Group elected to restate only those business combinations that occurred on or after 1 July 2003. In respect of acquisitions prior to 1 July 2003, goodwill represents the amount recognised under the Group's previous accounting framework, Australian Generally Accepted Accounting Practices.Acquisitions of non-controlling interests are accounted for as transactions with owners in their capacity as owners and therefore no goodwill is recognised as a result of such transactions. The adjustments to non-controlling interests are based on a proportionate amount of the net assets of the subsidiary.
72
For
per
sona
l use
onl
y

Note 2. Summary of significant accounting policies (continued)
iii. Basis of consolidation (continued)
(b) Subsidiaries
(c) Share plan entities
(d) Associates
(e) Transactions eliminated on consolidation
iv. Foreign currency translation
(a) Foreign currency transactions and balancesForeign currency transactions are translated into the functional currency using the exchange rates prevailing at the dates of the transactions. Foreign exchange gains and losses resulting from the settlement of such transactions and from the translation at year end exchange rates of monetary assets and liabilities denominated in foreign currencies are recognised in the profit or loss.
Translation differences on financial assets and liabilities carried at fair value are reported as part of their fair value gain or loss. Translation differences on non-monetary financial assets and liabilities such as equities held at fair value through profit or loss are recognised in profit or loss as part of the fair value gain or loss. Translation differences on non-monetary financial assets such as equities classified as available-for-sale financial assets are included in the available for sale reserve in equity.
Associates are those entities in which the consolidated entity has significant influence, but not control, over the financial and operating policies. Significant influence is presumed to exist when the consolidated entity holds between 20 and 50 percent of the voting power of another entity. Associates are accounted for using the equity method. The consolidated financial statements include the consolidated entity’s share of the income and expenses of associates, after adjustments to align the accounting policies with those of the consolidated entity, from the date significant influence commences until the date significant influence ceases. When the consolidated entity’s share of losses exceeds its interest in an associate, the carrying amount is reduced to nil and recognition of further losses is discontinued except to the extent that the consolidated entity has incurred legal or constructive obligations to make payments on behalf of an associate.
Notes to and forming part of the financial statements for the year ended 30 June 2012
Subsidiaries are entities controlled by the consolidated entity. Control exists when the consolidated entity has the power to govern the financial and operating policies of an entity so as to obtain benefits from its activities. In assessing control, potential voting rights presently exercisable are taken into account. Financial statements of subsidiaries are included in the consolidated financial statements from the date control commences until the date control ceases.
The consolidated entity has established a number of share plan entities (SPE) in relation to the administration of employee share plans rather than for trading and investment purposes. A SPE is consolidated if, based on an evaluation of the substance of its relationships within the consolidated entity and the SPE’s risks and rewards, the consolidated entity concludes that it controls the SPE. SPEs controlled by the consolidated entity were established under terms that impose strict limitations on the decision making powers of the SPE's management and that result in the consolidated entity receiving the majority of the benefits related to the SPE operations and net assets, being exposed to risks incidental to the SPE's activities and retaining the majority of the residual or ownership risks related to the SPE or their assets.
Intra-group balances and transactions, and any unrealised income and expenses arising from intra-group transactions, are eliminated in preparing consolidated financial statements. Unrealised gains arising from transactions with associates are eliminated against the investment to the extent of the consolidated entity’s interest in the associate. Unrealised losses are eliminated in the same way as unrealised gains, but only to the extent that there is no evidence of impairment. Gains and losses are recognised when the contributed assets are consumed or sold by the associates or, if not consumed or sold, when the consolidated entity’s interest in such entities is disposed of.
73
For
per
sona
l use
onl
y

Note 2. Summary of significant accounting policies (continued)
iv. Foreign currency translation (continued)
(b) Foreign operations
v. Intangible assets
(a) Goodwill
Measurement
(b) Software
(c) Other intangible assets
Certain internal and external costs directly incurred in acquiring and developing software have been capitalised and are amortised over their useful life. Development costs include only those costs directly attributable to the development phase and are only recognised following completion of a technical feasibility study and where the consolidated entity has an intention and ability to use the asset. Costs incurred on software maintenance are expensed as incurred.
Other intangible assets acquired by the consolidated entity, which have finite useful lives, are stated at cost less accumulated amortisation (refer to accounting policy v(e)) and impairment losses (see accounting policy xx).
Subsequent measurementGoodwill is measured at cost less accumulated impairment losses. In respect of associates, the carrying amount of goodwill is included in the carrying amount of the investment, and an impairment loss on such an investment is not allocated to any assets, including goodwill, that forms part of the carrying amount of the associate.
Gains and losses on the disposal of an entity include the carrying amount of goodwill relating to the entity sold.
A discount upon acquisition is recognised directly in profit or loss.
Notes to and forming part of the financial statements for the year ended 30 June 2012
The results and financial position of subsidiaries that have a functional currency different from the presentation currency are translated into Australian dollars as follows:
Assets and liabilities for each Balance Sheet presented are translated at the closing rate at the date of that balance sheet.
Goodwill represents the excess of acquisition cost over the fair value of the consolidated entity’s share of the net identifiable assets of the acquired subsidiary or associate at the date of acquisition. Goodwill on acquisition of subsidiaries is presented with intangible assets and on acquisition of associates is included in investment in associates. Goodwill is allocated to cash-generating units and is not amortised, but tested for impairment annually or more frequently if events or changes in circumstances indicate that it might be impaired. When impaired, goodwill is carried at cost less accumulated impairment losses (see accounting policy xx).
Foreign currency differences are recognised in other comprehensive income. When a foreign operation is disposed of, in part or in full, the relevant amount in the foreign currency translation reserve is transferred to profit or loss or to non-controlling interest as part of the profit or loss on disposal.
For the measurement of goodwill at initial recognition, see note 19.
Income and expenses for each Statement of Comprehensive Income are translated at average exchange rates (unless this is not a reasonable approximation of the cumulative effect of the rates prevailing on the transaction dates, in which case income and expenses are translated at the dates of the transactions).
Goodwill that arises upon the acquisition of subsidiaries is included in intangible assets.
74
For
per
sona
l use
onl
y

Note 2. Summary of significant accounting policies (continued)
v. Intangible assets (continued)
(d) Subsequent expenditure
(e) Amortisation
The estimated useful lives in the current and comparative periods are as follows:
capitalised software costs: 2.5 - 7 yearsfunds under management acquired: 5 yearscustomer contracts and relationships acquired: 5 - 10 years.
vi. Revenue and income recognition
(a) Revenue from the provision of services
(b) Income from structured products Refer to accounting policy xi for details on income from structured products.
(c) Investment income Interest income is recognised as it accrues taking into account the effective yield of the financial asset.
Unit trust distributions are recognised in profit or loss as they are received.
(d) Proceeds from sale of investmentsNet gains or losses on disposal of non-current assets are included in profit or loss. The gain or loss arising from disposal of an item of property, plant and equipment is determined as the difference between net disposal proceeds, being the cash price equivalent where payment is deferred, and the carrying amount of the item.
Profit or loss on disposal of assets is brought to account at the date an unconditional contract of sale is signed.
Revenue is recognised at fair value of consideration received or receivable net of goods and services tax payable to the taxation authority.
Revenue is earned from provision of services to customers outside the consolidated entity. Revenue is recognised when services are provided.
Dividend income is recognised in profit or loss on the date the entity's right to receive payment is established which, in the case of quoted securities, is the ex-dividend date.
Amortisation methods, useful lives and residual values are reviewed at each financial year-end and adjusted if appropriate.
Notes to and forming part of the financial statements for the year ended 30 June 2012
Subsequent expenditure is capitalised only when it increases future economic benefits embodied in the specific asset to which it relates. All other expenditure is expensed as incurred.
Amortisation is recognised in profit or loss on a straight-line basis over the period the benefits from the assets arise, unless these assets are indefinite life assets. Goodwill and other intangible assets with an indefinite useful life are systematically tested for impairment at each balance sheet date or more frequently if events or changes in circumstances indicate that they might be impaired. Other intangible assets are amortised from the date they are available for use.
Amortisation is calculated over the cost of the asset, or another amount substituted for cost, less its residual value.
75
For
per
sona
l use
onl
y

Note 2. Summary of significant accounting policies (continued)
vii. Segment reporting
viii. Interest-bearing borrowings
ix. Income tax
Deferred tax is not recognised for the following temporary differences:
the initial recognition of goodwillthe initial recognition of assets or liabilities that affect neither accounting nor taxable profit
Deferred tax is measured at the tax rates that are expected to be applied to the temporary differences when they reverse, based on the laws that have been enacted or substantively enacted by the reporting date.
A deferred tax asset is recognised to the extent that it is probable that future taxable profits will be available against which temporary differences can be utilised. Deferred tax assets are reviewed at each balance sheet date and are reduced to the extent that it is no longer probable that the related tax benefit will be realised.
Interest-bearing borrowings are initially recognised at fair value net of transaction costs incurred. Subsequent to initial recognition, interest-bearing borrowings are stated at amortised cost with any difference between initial carrying amount and redemption value being recognised in the profit or loss over the period of the borrowings using the effective interest method.
The consolidated entity determines and presents operating segments based on the information that internally is provided to the Chief Executive Officer (CEO), who is the consolidated entity's chief operating decision maker.
An operating segment is a component of the consolidated entity that engages in business activities from which it may earn revenues and incur expenses, including revenues and expenses that relate to transactions with any of the consolidated entity's other components. All operating segments' operating results are regularly reviewed by the consolidated entity's CEO to make decisions about resources to be allocated to the segment and assess its performance, and for which discrete financial information is available.
Segment results that are reported to the CEO include items directly attributable to a segment as well as those that can be allocated on a reasonable basis. Unallocated items comprise mainly corporate assets, head office expenses, and income tax expenses, assets and liabilities.
Deferred tax is recognised in respect of temporary differences between carrying amounts of assets and liabilities for financial reporting purposes and amounts used for taxation purposes.
differences relating to investments in subsidiaries to the extent that they probably will not reverse in the foreseeable future.
Notes to and forming part of the financial statements for the year ended 30 June 2012
Interest-bearing borrowings are removed from the Balance Sheet when the obligation specified in the contract is discharged, cancelled or expired.
Income tax expense comprises current and deferred tax. Income tax expense is recognised in the net profit or loss except to the extent that it relates to items recognised directly in equity, in which case it is recognised in other comprehensive income.
Current tax is expected tax payable on the taxable income for the year, using tax rates enacted or substantially enacted at reporting date and any adjustment to tax payable in respect of previous years.
76
For
per
sona
l use
onl
y

Note 2. Summary of significant accounting policies (continued)
ix. Income tax (continued)
x. Investments
(a) Held-to-maturity investments
(b) Available-for-sale financial assets
(c) Investments at fair value through profit or loss
xi. Structured products
(a) Exact Market Cash Funds
Structured products comprise products sold to investors where there is residual risk taken by the Company. Currently, structured products comprise products such as the Exact Market Cash Funds (the EMCF product) and Perpetual Protected Investments (PPI).
The EMCF product consisting of two Funds (EMCF 1 and EMCF 2) is consolidated as the consolidated entity is deemed to control the EMCF Funds since it retains the residual risks and benefits through the swap agreements. The swap agreements result in the benchmark rate of return being paid to the unit holders in the Fund. The swap agreements are inter-company transactions between a subsidiary of the Company and the Funds and are eliminated on consolidation.
Investments are classified as held-to-maturity if the consolidated entity has the positive intent and ability to hold to maturity. Held-to-maturity investments are measured at amortised cost using the effective interest method, less any impairment losses.
The Company and its wholly owned Australian resident entities are part of a tax consolidated group. As a consequence, all members of the tax consolidated group are taxed as a single entity. The head entity within the tax consolidated group is Perpetual Limited.
The consolidated entity’s investments in equity securities and unlisted unit trusts are classified as available-for-sale financial assets. Subsequent to initial recognition, they are measured at fair value and changes therein, other than impairment losses (see accounting policy xx), are recognised in other comprehensive income. When an investment is derecognised, the cumulative gain or loss in equity is transferred to profit or loss.
The fair value of financial instruments classified as available-for-sale is their quoted bid price at the reporting date.
Financial instruments designated at fair value through profit or loss are measured at fair value and changes recognised in profit or loss.
Deferred tax assets and liabilities are offset when there is a legally enforceable right to offset current tax assets and liabilities and when the deferred tax balances relate to the same taxation authority. Current tax assets and tax liabilities are offset where the entity has a legally enforceable right to offset and intends either to settle on a net basis, or to realise the asset and settle the liability simultaneously.
Additional income taxes that arise from the distribution of dividends are recognised at the same time as the liability to pay the related dividend is recognised.
Notes to and forming part of the financial statements for the year ended 30 June 2012
Investments are classified at fair value through profit or loss if they are held for trading or designated as such upon initial recognition. The consolidated entity’s derivative instruments within asset management incubation funds are classified as held for trading financial assets. On initial recognition, attributable transaction costs are recognised in profit or loss when incurred.
77
For
per
sona
l use
onl
y

Note 2. Summary of significant accounting policies (continued)
xi. Structured products (continued)
(a) Exact Market Cash Funds (continued)
(b) Perpetual Protected Investments
xii. Property, plant and equipment
(a) Recognition and measurement
Where parts of an item of property, plant and equipment have different useful lives, they are accounted for as separate items of property, plant and equipment.
Gains and losses on disposal of an item of property, plant and equipment are determined by comparing the proceeds from disposal with the carrying amount of property, plant and equipment. When revalued assets are sold, the amounts included in the revaluation reserve are transferred to retained earnings.
The incurred loss model makes specific provisions where specific loan impairment is identified. For individual loans not impaired, assets with similar risk profiles are pooled and collectively assessed for losses that may have been incurred but not yet identified. Bad debts are written off in the period in which they are identified.
Management makes judgements whether there is any observable data indicating that there is a significant decrease in the estimated future cash flows from a portfolio of loans. This evidence may include observable data indicating that there has been an adverse change in the payment status of the borrowers in a group, or national or local economic conditions that correlate with defaults on assets in that group.
Property, plant and equipment are measured at cost or deemed cost less accumulated depreciation and impairment losses (see accounting policy xx).
Cost includes expenditures that are directly attributable to the acquisition of the asset. Cost of self-constructed assets includes cost of materials, direct labour, an appropriate proportion of overheads and where relevant, the initial estimate of the costs of dismantling and removing the items and restoring the site on which they are located. Purchased software that is integral to the functionality of the related equipment is capitalised as part of that equipment.
Loans to investors are subject to recurring review and assessment for possible impairment. Provisions for loan losses are based on an incurred loss model, which recognises a provision where there is objective evidence of impairment at each balance sheet date, and are calculated based on the discounted values of expected future cash flows.
Loans to investors which are held as non-current assets at amortised cost on the Balance Sheet (refer to structured products - loan receivables) are non-derivative financial assets with fixed or determinable payments that are not quoted in an active market. Such assets are recognised initially at fair value plus any directly attributable transaction costs. Subsequent to initial recognition loans and receivables are measured at amortised cost using the effective interest method, less any impairment losses.
The financial assets represented by the structured products assets balance are accounted for in accordance with the underlying accounting policies of the consolidated entity. These consist of investments accounted for at fair value as available-for-sale financial assets.
Notes to and forming part of the financial statements for the year ended 30 June 2012
Assets and liabilities of the EMCF product are disclosed separately on the face of the Balance Sheet as structured product assets and structured product liabilities. The benchmark return generated by the EMCF product and distributions to unit holders are shown separately on the Statement of Comprehensive Income as distributions and expenses related to structured products.
78
For
per
sona
l use
onl
y

Note 2. Summary of significant accounting policies (continued)
xii. Property, plant and equipment (continued)
(b) Subsequent costs
(c) Depreciation
plant and equipment: 4 - 10 yearsleasehold improvements: 3 - 15 years.
xiii. Loans and receivables
xiv. Expenses
(a) Operating leases
(b) Financing costs
xv. Payables
Payables are non-interest bearing and are stated at amortised cost, with the exception of contingent consideration recognised in business combinations which is recorded at fair value at the acquisition date.
Contingent consideration recognised in business combinations is classified as a financial liability and is subsequently remeasured to fair value with changes in fair value recognised in profit or loss.
Loans and receivables comprise trade and other receivables. Refer to accounting policy xi(b) for structured-products loan receivables.
Operating lease payments are recognised as an expense in profit or loss on a straight-line basis over the term of the lease. Incentives received by the consolidated entity on entering a lease agreement are recognised on a straight-line basis over the term of the lease.
The difference between the cash amount paid and the amount recognised as an expense is recognised as a lease provision in the Balance Sheet (see accounting policy xvi). The provision is expected to be realised over the term of the underlying leases.
Financing costs comprise interest payments on borrowings and derivative financial instruments calculated using the effective interest method, and unwinding of discounts on provisions.
Subsequent to initial recognition loans and receivables are measured at amortised cost using the effective interest method less impairment losses (see accounting policy xx).
The residual value, useful life and depreciation method applied to an asset are reassessed at least annually.
Notes to and forming part of the financial statements for the year ended 30 June 2012
Depreciation is recognised in the Statement of Comprehensive Income on a straight-line basis over the estimated useful lives of each part of an item of property, plant and equipment. The estimated useful lives for the current and comparative periods are as follows:
The consolidated entity recognises the cost of replacing part of an item of property, plant and equipment in the carrying amount of that item when the cost is incurred, it is probable that future economic benefits embodied within the item will flow to the consolidated entity and the cost of the item can be measured reliably. The carrying amount of the replaced part is derecognised. All other costs are recognised in profit or loss as an expense when incurred.
Loans and receivables are financial assets with fixed or determinable payments that are not quoted in an active market. Such assets are recognised initially at fair value plus any directly attributable transaction costs.
79
For
per
sona
l use
onl
y

Note 2. Summary of significant accounting policies (continued)
xvi. Provisions
(a) Onerous leases and make good
(b) Restructuring
(c) Operational process review
(d) Self-insurance
(e) Legal provision
(f) Lease expense
(g) Employee benefitsRefer to accounting policy xxiii for details on employee benefits provisions.
Notes to and forming part of the financial statements for the year ended 30 June 2012
A provision is recognised in the Balance Sheet when the consolidated entity has a present legal or constructive obligation as a result of a past event that can be measured reliably and it is probable that an outflow of economic benefits will be required to settle the obligation.
Management exercise judgement in estimating provision amounts. It may be possible, based on existing knowledge, that outcomes in the next annual reporting period differ from amounts provided and may require adjustment to the carrying amount of the liability affected.
A provision for onerous leases is recognised when the expected benefits to be derived by the consolidated entity from a lease contract are lower than the unavoidable cost of meeting its obligations under the contract. The provision is measured at the present value of the lower of the expected cost of terminating the contract and the expected net cost of continuing with the contract. Before a provision is established, the consolidated entity recognises any impairment loss on the assets associated with that contract. A provision for make good is recognised when the consolidated entity is responsible for the make good of leased premises on termination of operating leases.
Provisions are determined by discounting the expected future cash flows at a pre-tax rate that reflects current market assessments of the time value of money and, where appropriate, the risks specific to the liability. The unwinding of the discount is recognised as a finance cost.
A provision for lease expense represents the difference between the cash amount paid and the amount recognised as an expense. The provision is expected to be realised over the term of the underlying lease.
Provision for self-insurance recognises incurred but not reported claims. These provisions are measured at the cost that the consolidated entity expects to incur in settling the claim, discounted using a government bond rate with a maturity date approximating the term of the obligation.
A provision for restructuring is recognised when the consolidated entity has approved a detailed and formal restructuring plan and the restructuring has either commenced or has been announced publicly. Future operating costs are not provided for.
A provision for litigation is recognised when reported litigation claims arise and are measured at the cost that the consolidated entity expects to incur in settling the claim.
A provision for operational process reviews is recognised when operational errors in relation to unit pricing are identified and represents the cost that the consolidated entity expects to incur in rectification and restitution costs.
80
For
per
sona
l use
onl
y

Note 2. Summary of significant accounting policies (continued)
xvii. Financial guarantee contracts
xviii. Share capital
(a) Ordinary shares
(b) Repurchase of share capital (treasury shares)
(c) Dividends
xix. Cash and cash equivalents
xx. Impairment
(a) Financial assets (including receivables)
Cash and cash equivalents comprise bank balances, deposits at call and short-term deposits.
A financial asset not carried at fair value through profit or loss is assessed at each reporting date to determine whether there is any objective evidence of impairment. A financial asset is considered to be impaired if objective evidence indicates that one or more events have had a negative effect on the estimated future cash flows of that asset.
Objective evidence that financial assets (including equity securities) are impaired can include default or delinquency by a debtor, restructuring of an amount due to the consolidated entity on terms that the consolidated entity would not consider otherwise, indications that a debtor or issuer will enter bankruptcy and the disappearance of an active market for a security. In addition, for an investment in an equity security, a significant or prolonged decline in fair value below its cost is objective evidence of impairment.
The consolidated entity considers evidence of impairment for receivables and held-to-maturity investment securities at both a specific asset and collective level. All individually significant receivables and held-to-maturity investment securities are assessed for specific impairment. All individually significant receivables and held-to-maturity investment securities found not to be specifically impaired are then collectively assessed for any impairment that has been incurred but not yet identified. Receivables and held-to-maturity investment securities that are not individually significant are collectively assessed for impairment by grouping together receivables and held-to-maturity investment securities with similar risk characteristics.
Dividends are recognised as a liability in the period in which they are declared.
Notes to and forming part of the financial statements for the year ended 30 June 2012
Financial guarantee contracts are recognised as a financial liability at the time the guarantee is issued. The liability is initially measured at fair value and subsequently at the higher of the amount determined in accordance with AASB 137 Provisions, Contingent Liabilities and Contingent Assets and the amount initially recognised less cumulative amortisation, where appropriate.
Where guarantees in relation to loans or other payables of subsidiaries are provided for no compensation, the fair values are accounted for as contributions and recognised as part of the cost of the investment.
Ordinary shares are classified as equity. Incremental costs directly attributable to the issue of ordinary shares are recognised as a deduction from equity, net of any tax effects.
When share capital recognised as equity is repurchased or held by employee share plans and subject to vesting conditions, the amount of the consideration paid, including directly attributable costs, is recognised as a deduction from equity. When treasury shares are sold or reissued subsequently, the amount received is recognised as an increase in equity.
81
For
per
sona
l use
onl
y

Note 2. Summary of significant accounting policies (continued)
xx. Impairment (continued)
(b) Non-financial assetsThe carrying amounts of the consolidated entity’s non-financial assets, other than deferred tax assets (see accounting policy ix), are reviewed at each reporting date to determine whether there is any indication of impairment. If any such indication exists, the asset’s recoverable amount is estimated. For goodwill and intangible assets that have indefinite lives or that are not yet available for use, recoverable amount is estimated at each balance sheet date.
The recoverable amount of an asset or cash-generating unit is the greater of its value in use and its fair value less costs to sell. In assessing value in use, the estimated future cash flows are discounted to their present value using a pre-tax discount rate that reflects current market assessments of the time value of money and the risks specific to the asset. For the purpose of impairment testing, assets that cannot be tested individually are grouped together into the smallest group of assets that generates cash inflows from continuing use that are largely independent of the cash inflows of other assets or groups of assets (the "cash-generating unit" or CGU). Subject to an operating segment ceiling test, for the purposes of goodwill impairment testing, CGUs to which goodwill has been allocated are aggregated so that the level at which impairment is tested reflects the lowest level at which goodwill is monitored for internal reporting purposes.
The consolidated entity's corporate assets do not generate separate cash inflows. If there is an indication that a corporate asset may be impaired, then the recoverable amount is determined for the CGU to which the corporate asset belongs.
An impairment loss is recognised if the carrying amount of an asset or its cash-generating unit exceeds its recoverable amount. Impairment losses are recognised in the Statement of Comprehensive Income. Impairment losses recognised in respect of cash-generating units are allocated first to reduce the carrying amount of any goodwill allocated to the units and then, to reduce the carrying amount of the other assets in the unit on a pro rata basis.
If, in a subsequent period, the fair value of an impaired available-for-sale debt security increases and the increase can be related objectively to an event occurring after the impairment loss was recognised in profit or loss, then the impairment loss is reversed, with the amount of the reversal recognised in profit or loss. However, any subsequent recovery in the fair value of an impaired available-for-sale equity security is recognised in other comprehensive income.
Notes to and forming part of the financial statements for the year ended 30 June 2012
In assessing collective impairment the consolidated entity uses historical trends of the probability of default, timing of recoveries and the amount of loss incurred, adjusted for management's judgement as to whether current economic and credit conditions are such that the actual losses are likely to be greater or less than suggested by historical trends.
An impairment loss in respect of a financial asset measured at amortised cost is calculated as the difference between its carrying amount and the present value of the estimated future cash flows discounted at the asset's original effective interest rate. Losses are recognised in profit and loss and reflected in an allowance account against receivables. Interest on the impaired asset continues to be recognised through the unwinding of the discount. When a subsequent event causes the amount of impairment loss to decrease, the decrease in impairment loss is reversed through profit or loss.
Impairment losses on available-for-sale investment securities are recognised by transferring the cumulative loss that has been recognised in other comprehensive income, and presented in the available-for-sale reserve in equity, to profit or loss. The cumulative loss that is removed from other comprehensive income and recognised in profit or loss is the difference between the acquisition cost, net of any principal repayment and amortisation, and the current fair value, less any impairment loss previously recognised in profit or loss.
82
For
per
sona
l use
onl
y

Note 2. Summary of significant accounting policies (continued)
xx. Impairment (continued)
(b) Non-financial assets (continued)
xxi. Recognition and derecognition of financial assets and liabilities
xxii. Derivative financial instruments
The consolidated entity holds derivative financial instruments within structured products and incubation funds to hedge its interest rate, foreign exchange and market risk exposures.
On initial designation of the hedge, the consolidated entity formally documents the relationship between the hedging instrument and the hedged item, including the risk management objectives and strategy in undertaking the hedge transaction, together with the methods that will be used to assess the effectiveness of the hedging relationship. The consolidated entity makes an assessment, both at the inception of the hedge relationship as well as on an ongoing basis, whether the hedging instruments are expected to be "highly effective" in offsetting the changes in the fair value or cash flows of the respective hedged items during the period for which the hedge is designated, and whether the actual results of each hedge are within a range of 80-125 per cent. For a cash flow hedge of a forecast transaction, the transaction should be highly probable to occur and should present an exposure to variations in cash flows that could ultimately affect reported net income.
Derivatives are recognised initially at fair value. Attributable transaction costs are recognised in profit or loss when incurred. Subsequent to initial recognition, derivatives are measured at fair value, and changes therein are accounted for as described below.
Financial assets and liabilities are offset and the net amount presented in the balance sheet when, and only when, the consolidated entity has a legal right to offset the amounts and intends either to settle on a net basis or to realise the asset and settle the liability simultaneously.
Financial liabilities (including liabilities designated at fair value through profit or loss) are recognised initially on the trade date at which the consolidated entity becomes a party to the contractual provisions of the instrument. The consolidated entity derecognises a financial liability when its contractual obligations are discharged or cancelled or expire.
The consolidated entity initially recognises loans and receivables and deposits on the date that they are originated. All other financial assets (including assets designated at fair value through profit or loss) are recognised initially on the trade date at which the consolidated entity becomes a party to the contractual provisions of the instrument.
Notes to and forming part of the financial statements for the year ended 30 June 2012
An impairment loss in respect of goodwill is not reversed. In respect of other assets, impairment losses recognised in prior periods are assessed at each balance sheet date for any indications that the loss has decreased or no longer exists. An impairment loss is reversed if there has been a change in the estimates used to determine the recoverable amount. An impairment loss is reversed only to the extent that the asset’s carrying amount does not exceed the carrying amount that would have been determined, net of depreciation or amortisation, if no impairment loss had been recognised.
The consolidated entity derecognises a financial asset when the contractual rights to the cash flows from the asset expire, or it transfers the rights to receive the contractual cash flows on the financial asset in a transaction in which substantially all the risks and rewards of ownership of the financial asset are transferred. Any interest in transferred financial assets that is created or retained by the consolidated entity is recognised as a separate asset or liability.
83
For
per
sona
l use
onl
y

Note 2. Summary of significant accounting policies (continued)
xxii. Derivative financial instruments (continued)
(a) Cash flow hedges
(b) Other derivatives
xxiii. Employee benefits
(a) Defined contribution superannuation funds
(b) Long service leave
(c) Wages, salaries, annual leave, sick leave and non-monetary benefits Liabilities for employee benefits for wages, salaries and annual leave expected to be settled within 12 months of the reporting date represent present obligations resulting from employees' services provided to reporting date. These liabilities are calculated at undiscounted amounts based on wage and salary rates that the consolidated entity expects to pay as at reporting date including related on-costs, such as workers compensation insurance and payroll tax.
Non-accumulating benefits, such as sick leave, are not provided for but are expensed as the benefits are taken by the employees.
Non-accumulating non-monetary benefits, such as medical care, housing, cars and free or subsidised goods and services are expensed based on the net marginal cost to the consolidated entity as the benefits are taken by the employees.
A provision is recognised for the amount expected to be paid under short-term bonus or profit-sharing plans if the consolidated entity has a present legal or constructive obligation to pay this amount as a result of past service provided by the employee.
A defined contribution plan is a post-employment benefit plan under which an entity pays fixed contributions into a separate entity and will have no legal or constructive obligation to pay further amounts. Obligations for contributions to defined contribution pension plans are recognised as an expense in the periods during which services are rendered by employees.
The liability for long service leave is recognised in the provision for employee benefits and measured as the present value of expected future payments to be made in respect of services provided by employees up to the reporting date using the projected unit credit method. Consideration is given to expected future wage and salary levels, experience of employee departures and periods of service. Expected future payments are discounted using market yields at the reporting date on national government bonds with terms to maturity and currency that match, as closely as possible, the estimated future cash outflows.
Notes to and forming part of the financial statements for the year ended 30 June 2012
To the extent that the hedge is effective, changes in the fair value of a derivative hedging instrument designated as a cash flow hedge are recognised in the cash flow hedge reserve. To the extent that the hedge is ineffective, changes in fair value are recognised in the net profit or loss.
If the hedging instrument no longer meets the criteria for hedge accounting, expires or is sold, terminated or exercised, then hedge accounting is discontinued prospectively. The cumulative gain or loss previously recognised in equity remains there until the forecast transaction occurs. When the hedged item is a non-financial asset, the amount recognised in equity is transferred to the carrying amount of the asset when it is recognised. In other cases the amount recognised in equity is transferred to the net profit or loss in the same period that the hedged item affects profit or loss.
When a derivative financial instrument is not designated in a qualifying hedge relationship, any changes in fair value are recorded in profit and loss.
84
For
per
sona
l use
onl
y

Note 2. Summary of significant accounting policies (continued)
xxiv. Share-based payment transactions
(a) Employee share purchase and option plans
(b) Deferred staff incentives
xxv. Earnings per share
xxvi. New standards and interpretations not yet adopted
The consolidated entity presents basic and diluted earnings per share (EPS) data for its ordinary shares. Basic EPS is calculated by dividing the net profit or loss attributable to ordinary shareholders of the Company by the weighted average number of ordinary shares outstanding during the period, adjusted for shares held by the Company's employee share plan trust. Diluted EPS is determined by dividing the net profit or loss attributable to ordinary shareholders by the weighted average number of ordinary shares outstanding, adjusted for shares held by Company's sponsored employee share plan trust and for the effects of all dilutive potential ordinary shares, which comprise shares and options granted to employees under long-term incentive and retention plans.
A number of new accounting standards and amendments have been issued but are not yet effective. The Perpetual Group has not elected to early adopt any of these new standards or amendments in this Financial Report. These new standards and amendments, when applied in future periods, are not expected to have a material impact on the financial position or performance of the Perpetual group other than the following:
Notes to and forming part of the financial statements for the year ended 30 June 2012
Share option and share incentive programs allow employees to acquire shares in the Company. The fair value of shares and/or options granted under these programs is recognised as an employee expense with a corresponding increase in equity. Fair value is measured at grant date and amortised over the period during which employees become unconditionally entitled to the shares and/or options.
The consolidated entity makes estimates of the number of shares that are expected to vest. Where appropriate, revised estimates are reflected in profit or loss with the corresponding adjustment to the equity compensation reserve. Where shares containing a market linked hurdle do not vest, due to total shareholder return not achieving the threshold for vesting, an adjustment is made to contributed equity and equity compensation reserve.
The fair value of the shares granted is measured by the share price adjusted for the terms and conditions upon which the shares were granted. This fair value is amortised on a straight-line basis over the applicable vesting period.
The fair value of the options granted is measured using a binomial model, taking into account the terms and conditions upon which the options were granted. The amount recognised as an expense is adjusted to reflect the actual number of share options that vest except where forfeiture is due to share prices not achieving their threshold for vesting.
The Company grants certain employees shares under long-term incentive and retention plans. Under these plans, shares vest to employees over relevant vesting periods. To satisfy the long-term incentives granted, the Company purchases or issues shares under the Executive Share Plan, Deferred Share Plan or the Global Employees Share Trust.
85
For
per
sona
l use
onl
y

Note 2. Summary of significant accounting policies (continued)
xxvi. New standards and interpretations not yet adopted (continued)
xxvii. Australian Government's proposed carbon pricing mechanism
The Clean Energy Act introduced a carbon pricing mechanism into the Australian economy from 1 July 2012. The introduction of the carbon pricing mechanism is not expected to have a material impact on the future cash flows generated from the cash-generating units for the purpose of fair value calculations in asset impairment models.
Notes to and forming part of the financial statements for the year ended 30 June 2012
AASB 10 Consolidated Financial Statements, AASB 11 Joint Arrangements, AASB 12 Disclosure of Interest in Other Entities, revised AASB 127 Separate Financial Statements, revised AASB 128 Investments in Associates and Joint Ventures and AASB 2011-7 Amendments to Australian Accounting Standards arising from the Consolidation and Joint Arrangements Standards. These standards change the criteria for determining which entities are to be consolidated and which entities are to be accounted for using the equity method in preparing consolidated accounts and the required disclosures in relation to such entities. Each of these standards is mandatory for adoption by the Perpetual group in the year ending 30 June 2014. The financial impact on the Perpetual group of adopting these standards has not yet been quantified.
Revised AASB 101 Presentation of Financial Statements. The revised AASB 101 requires items in the Statement of comprehensive income to be segregated between those that will be eventually realised in the income statement in future periods and those that will not. The revised AASB 101 is mandatory for adoption by the Perpetual group in the year ending 30 June 2013. The changes to AASB 101 relate to the presentation only and are not expected to have a financial impact on the Perpetual Group.
AASB 13 Fair Value Measurement. This standard centralises the definition and guidance for calculating fair values where required to be applied by various other accounting standards and removes some minor inconsistencies that previously existed between the guidance for determining fair value in these standards. The new standard requires quantitative and qualitative disclosures of all fair value measurements. AASB 13 is mandatory for adoption by the Perpetual group in the year ending 30 June 2014. The financial impact on the Perpetual group of adopting AASB 13 has not yet been quantified.
86
For
per
sona
l use
onl
y

Notes to and forming part of the financial statements for the year ended 30 June 2012
2012 2011$'000 $'000
Re-presented *Note 3. Revenue from continuing operations
Revenue from the provision of servicesGross revenue from fees and commissions 349,118 390,395
Total revenue from the provision of services 349,118 390,395
Other income Income from structured products 42,010 69,149
Total other income 42,010 69,149
Investment incomeDividends 905 1,071Interest and unit trust distibution 7,475 12,893
Total investment income 8,380 13,964.
399,508 473,508
Note 4. Net profit before tax
Net profit before tax has been arrived at after charging/(crediting) the following items:
Depreciation of property, plant and equipment:– Leasehold improvements 2,668 2,314– Plant and equipment 2,027 2,338
4,695 4,652Amortisation of intangible assets: CHECK CHECK
– Capitalised software 6,988 6,218– Other intangible assets 1,826 3,062
8,814 9,280
Depreciation and amortisation expense 13,509 13,932CHECK CHECK
Rental charges – operating leases 15,901 16,296
Net loss on sale of property, plant and equipment 2 795
Net movements in provision for:– Employee benefits (146) 5,219– Bad and doubtful debts 345 (22)– Credit losses on structured products 233 196
Net foreign exchange (gain)/loss (115) 717
* Prior year comparatives have been re-presented due to the discontinued operation, refer to note 7.
Consolidated
87
For
per
sona
l use
onl
y

Notes to and forming part of the financial statements for the year ended 30 June 2012
2012 2011$'000 $'000
Re-presented *Note 4. Net profit before tax (continued)
Total staff related expenses:– Staff related expenses 194,637 203,554– Equity remuneration expense 12,248 18,585
206,885 222,139
Profit/(loss) on disposal and impairment of investments:– Profit on sale of part of investment portfolio 359 6,161– Impairment of available-for-sale securities (8,412) (1,534)
Total (loss)/profit on disposal and impairment of investments before tax (8,053) 4,627Income tax expense applicable - (722)Total (loss)/gain on disposal and impairment of investments after tax (8,053) 3,905
(26,476) (9,125)5,590 2,737
(20,886) (6,388)
1,151 - - -
1,151 -
(1,434) - - -
(1,434) -
Impairment of property, plant and equipment (3,356) -Income tax benefit applicable 1,007 -
(2,349) -
Impairment of intangible assets (14,498) (14,694)Income tax benefit applicable 4,349 -
(10,149) (14,694)
Transformation office costs (2,433) -730 -
(1,703) -
Private equity proposal response costs - (4,408) - 1,322 - (3,086)
* Prior year comparatives have been re-presented due to the discontinued operation, refer to note 7.** Tax losses not previously recognised have been utilised.
Consolidated
Note 5. Individually significant items included in profit for the year
Income tax benefit applicable
Income tax benefit applicable
Income tax expense applicable**Gain on sale of businesses
As the Exact Market Cash Fund portfolio continues to run off and the majority of its unrealised losses were recognised as at 30 June 2011, its financial performance will not be disclosed as a significant item. The Exact Market Cash Fund gains was $1.4 million (2011: $9.8m).
Restructuring costs
Costs incurred for sale of discontinued operationsIncome tax benefit applicable
Income tax benefit applicable
88
For
per
sona
l use
onl
y

Note 6. Segment informationPrivate Wealth
30 June 2012
External revenues 225,230 115,966 86,108 427,304Inter-segment revenue/(expense) 1,265 (1,265) - -Interest revenue 400 31 561 992Total revenue for reportable segment 226,895 114,732 86,669 428,296
(4,028) (6,118) (3,113) (13,259)
Reportable segment net profit before tax 72,024 8,228 20,598 100,850
Reportable segment assets 846,463 126,264 40,270 1,012,997
Reportable segment liabilities (831,444) (14,204) (9,923) (855,571)
Capital expenditure 1,061 4,887 432 6,380
30 June 2011
External revenues 287,937 117,334 96,249 501,520Inter-segment revenue/(expense) 1,239 (1,239) - -Interest revenue 692 42 956 1,690Total revenue for reportable segment 289,868 116,137 97,205 503,210
(5,459) (6,259) (3,156) (14,874)
Reportable segment net profit before tax 87,142 13,312 25,346 125,800
Reportable segment assets 1,111,605 128,326 44,602 1,284,533
Reportable segment liabilities (1,088,104) (16,485) (8,764) (1,113,353)
Capital expenditure 1,997 2,305 891 5,193
2 Segment information for Corporate Trust includes discontinued operations, Perpetual Lenders Mortgage Services. Further information is provided in note 7.
Depreciation and amortisation
Notes to and forming part of the financial statements for the year ended 30 June 2012
Depreciation and amortisation
Total
$’000
Perpetual Investments1
$’000
Perpetual Private$’000
Corporate Trust 2
$’000
1 Segment information for Perpetual Investments includes the Exact Market Cash Funds.
89
For
per
sona
l use
onl
y

Note 2012 2011$'000 $'000
Re-presented *
Note 6. Segment information (continued)
RevenuesTotal revenue for reportable segments 428,296 503,210less: Revenue from discontinued operation 7 (34,718) (40,020)add: Group and Support Services revenue 5,930 10,318Total group revenue from continuing operations 399,508 473,508
Net profit before tax100,850 125,800
less: Net profit before tax for discontinued operation 7 (3,186) (3,808)Financing costs (2,479) (3,627)Profit on disposal of investments 359 6,161Impairment of available-for-sale securities (8,412) (1,534)Impairment of intangible assets (14,498) (14,694)Impairment of property, plant and equipment (3,356) -Gain on sale of business 1,151 -Costs incurred for sale of discontinued operation (1,434) -Transformation office costs (2,433) -Restructuring costs (26,476) (9,125)Private equity proposal response costs - (4,408)Group and Support Services expense (5,380) (2,822)Net profit before tax from continuing operations 34,706 91,943
Total assetsTotal assets for reportable segments 1,012,997 1,284,533Group and Support Services assets 239,565 329,488Total assets 1,252,562 1,614,021
Total liabilities Total liabilities for reportable segments 855,571 1,113,353Group and Support Services liabilities 116,530 124,567Total liabilities 972,101 1,237,920
a. Services provided
Perpetual Investments
Perpetual Private
Notes to and forming part of the financial statements for the year ended 30 June 2012
The consolidated entity has identified three operating segments based on the internal reports that are reviewed and used by the consolidated entity's CEO in assessing performance and in determining the allocation of resources. For each of the reportable segments, the consolidated entity's CEO reviews internal management reports on a monthly basis. The following summary describes the operations in each of the reportable segments:
Consolidated
Reconciliations of reportable segment revenues, net profit before tax, total assets and liabilities
Total net profit before tax for reportable segments
* Prior year comparatives have been re-presented due to the discontinued operation, refer to note 7.
The consolidated entity operates in the financial services industry in Australia and provides wealth management and corporate trust services. The major services from which the reportable segments derive revenue are:
Manufacturer of financial products, management and investment of monies on behalf of private, corporate, superannuation and institutional clients.
Perpetual Private provides a wide range of investment and non-investment products and services. These include a comprehensive advisory service, portfolio management, philanthropic, executorial and trustee services to high net worth and emerging high net worth Australians. Perpetual Private also provides many of these services to charities, not for profit and other philanthropic organisations. 90
For
per
sona
l use
onl
y

Note 6. Segment information (continued)
a. Services provided (continued)
Corporate Trust
b. Geographical information
c. Major customersThe consolidated entity does not rely on any major customer.
Note 7. Discontinued Operations Held for Sale
2012 2011$'000 $'000
Results of discontinued operationRevenue 34,718 40,020Expenses (31,532) (36,212)Profit before tax 3,186 3,808
(956) (1,142)
Profit for the year from a discontinued operation 2,230 2,666
Earnings per share:Basic profit for the year, from discontinued operation – cents per share 5.7 6.5 Diluted, profit for the year, from discontinued operation – cents per share 5.4 6.0
Cash flows from/(used in) discontinued operationNet cash from operating activities 7,670 6,517Net cash used in investing activities (52) -Net cash used in financing activities (7,804) (6,729)Net cash flows for the year (186) (212)
Reconciliations of reportable segment revenues, net profit before tax, total assets and liabilities (continued)
The consolidated entity operates predominantly in Australia. More than 90 per cent of revenue and non-current assets relate to operations in Australia.
The results of Perpetual Lenders Mortgage Services (PLMS) have been included in the segment information for Corporate Trust. The revenue and net profit before tax for the discontinued operation have been separately identified in the reconciliation of reportable segment revenues, net profit before tax, total assets and liabilities.
Notes to and forming part of the financial statements for the year ended 30 June 2012
The Corporate Trust division provides fiduciary services incorporating safe-keeping and recording of assets and transactions as custodian, trustee, registrar or agent for corporate and financial services clients and mortgage processing services.
Consolidated
Income tax expense
The consolidated entity publicly announced the decision of the Board of Directors to implement the ‘Transformation 2015’ strategy on 25 June 2012. A central element to this project was the selling of the mortgage servicing subsidiary, Perpetual Limited Mortgage Services (PLMS) which is part of Corporate Trust. As at 30 June 2012 Perpetual was in advanced negotiations, and at 12 July 2012 a sale of PLMS in its present condition was agreed upon and announced to market. The sale was completed on 1 August 2012.
The ‘Transformation 2015’ strategy includes a plan for the consolidated entity to simplify its business by reducing duplication and business activities and re-focussing on the core activities of the Group. The strategy identified PLMS as a non-core business and is held for sale at 30 June 2012.
91
For
per
sona
l use
onl
y

Note 7. Discontinued Operations Held for Sale (continued)
2012$'000
Total assetsIntangibles 5,663Property, plant and equipment 1,771Trade and other receivables 3,209Other asset 73Deferred tax assets 989Assets classified as held for sale 11,705
Total liabilities Trade and other payables 2,119Employee benefits 1,938Lease provision 1,555Liabilities directly associated with assets classified as held for sale 5,612
Net assets 6,093
Cumulative income or expense recognised in other comprehensive income
The assets and liabilities of PLMS are classified as held for sale and included in note 15 Assets and Liabilities Held for Sale.
Notes to and forming part of the financial statements for the year ended 30 June 2012
The major classes of assets and liabilities of PLMS classified as held for sale as at 30 June 2012 are:
There are no cumulative income or expense items recognised in the other comprehensive income relating to the disposal of PLMS.
92
For
per
sona
l use
onl
y

2012 2011$'000 $'000
Note 8. Auditor's remuneration
Audit ServicesAuditors of the Company
KPMG Australia:Audit and review of the consolidated and subsidiary financial statements 463 533Audit services in accordance with regulatory requirements 209 205Other assurance services 5 32
Overseas KPMG firms:Audit and review of financial statements 17 71Other assurance services - 2Total audit fee attributable to the audit of Perpetual Limited 694 843
KPMG Australia:Audit and review of managed funds and superannuation funds
1,953 2,007
760 715Audit services in accordance with regulatory requirements 293 301
Overseas KPMG firms:Audit of funds 17 20Other assurance services - 92
Total audit fee attributable to the audit of non-consolidated funds 3,023 3,135
3,717 3,978
Non Audit services
KPMG Australia:Private equity proposal - 288
Notes to and forming part of the financial statements for the year ended 30 June 2012
Non-audit services paid to KPMG in the prior year were incurred in relation to the Company's private equity response and are in accordance with the Company's auditor independence policy as outlined in Perpetual's Corporate Responsibility Statement.
1 These fees were paid for the audit and review of 590 managed funds (2011: 574 managed funds) and 1,120 (2011: 1,180) DIY superannuation funds and which contained assets totalling $22.6 billion (2011: $27.2 billion). These fees are incurred by the consolidated entity and are effectively recovered from the funds via management fees.
Consolidated
for which the consolidated entity acts as responsible entity1
Audit of DIY superannuation funds for which Perpetual acts as administrator or trustee1
Audit services for non-consolidated managed funds, superannuation funds and DIY superannuation funds;
93
For
per
sona
l use
onl
y

Notes to and forming part of the financial statements for the year ended 30 June 2012
2012 2011$'000 $'000
Note 9. Income tax expense
a. Income tax expenseCurrent tax expense 10,730 37,082Deferred tax expense/(benefit) 4,885 (1,831)Over provided in prior years (766) (1,868)Total 14,849 33,383
(Decrease)/increase in deferred tax assets (4,349) 1,008(536) 823
Total (4,885) 1,831
Tax expense from continuing operations 13,893 32,241Tax expense from discontinuing operation 956 1,142Total 14,849 33,383
Profit before tax for the year from continuing operations 34,706 91,943Profit before tax from discontinued operations 3,186 3,808Profit before tax 37,892 95,751
Prima facie income tax expense calculated at 30% (2011: 30%) on profit for the year 11,367 28,726Increase in income tax expense due to:– Accounting impairment on assets 1,712 4,408– Foreign source loss 2,699 1,866– Net taxable capital gain 179 -– Imputation gross-up on dividends received 175 79– Other non-deductible expenditure 706 2,186
Decrease in income tax expense due to:– Net taxable capital loss - (1,148)– Write back of deferred tax liability arising from business combinations (640) (602)– Franking credits on dividends received (583) (264)
Income tax expense attributable to profit for the year before tax 15,615 35,251Less: Income tax over provided in prior years (766) (1,868)
14,849 33,3831 Prior period comparatives have been re-presented.
The above movements in deferred tax assets and deferred tax liabilities are net of movements in these balances recognised directly in other comprehensive income.
The realisation of the deferred tax assets relating to the realised and unrealised capital losses is dependent on future capital gains being in excess of the losses shown in note 10.
Income tax expense attributable to profit for the year
Deferred tax included in income tax expense comprises:
Decrease/(increase) in deferred tax liabilities
b. Reconciliation of income tax expense to prima facie income tax payable1
Consolidated
94
For
per
sona
l use
onl
y

2012 2011$'000 $'000
Note 9. Income tax expense (continued)
c. Current tax assets/(liabilities)
1,282 (15,468)
(34) (186)(1,309) 1,158(1,343) 972
Note 10. Deferred tax assets / (liabilities)1
The balance comprises temporary differences attributable to:
Provisions and accruals 14,028 10,766Intangible assets - 1,076Capital expenditure deductible over 5 years 658 1,266Structured products - interest received in advance 2,229 3,418Employee benefits 8,350 10,750Property, plant and equipment 291 3,691Realised net capital losses 2,294 2,078Unrealised net capital losses 2,365 523Other items 605 845Deferred tax assets from continuing operations 30,820 34,413Deferred tax assets for discontinuing operations reclassified to held for sale assets 989 -Total deferred tax assets 31,809 34,413
Intangible assets (5,920) (5,464)Unrealised net capital gains (1,562) (1,176)Other items (989) (893)Total deferred tax liabilities (8,471) (7,533)
Net deferred tax assets 23,338 26,880
Notes to and forming part of the financial statements for the year ended 30 June 2012Consolidated
d. Income tax recognised in other comprehensive income
The current tax asset/(liability) for the consolidated entity represents income taxes payable in respect of the current financial year. In accordance with tax consolidation legislation, the Company, as head entity of the Australian tax-consolidated group, has assumed the current tax asset/(liability) recognised by members in the tax consolidated group. Current tax asset represents instalments paid in advance.
Current tax assets/(liabilities)
Available-for-sale financial assetsCash flow hedges
1 Prior period comparatives have been re-presented.
PI Investment Management Limited, the controlled entity incorporated in Ireland, was placed into voluntary liquidation on 8 June 2012. At 30 June 2012, the consolidated entity had carried forward foreign trading tax losses attributable to PI Investment Management Limited of EUR 47,560,000 (30 June 2011: EUR 40,648,000) which translates to A$58,774,000 (30 June 2011: A$54,892,000). The tax benefit relating to these carried forward foreign trading tax losses has not been recognised as a deferred tax asset at 30 June 2012.
At 30 June 2012, the consolidated entity had carried forward realised tax capital losses of $7,644,000 (30 June 2011: $6,925,000) which had a tax benefit of $2,294,000 (30 June 2011: $2,078,000); the tax benefit of these capital losses has been recognised in deferred tax assets.
As at 30 June 2012, the consolidated entity had carried forward unrealised tax capital losses of $7,883,000 (30 June 2011: $1,745,000) which had a tax benefit of $2,365,000 (30 June 2011: $523,000). Of this amount $1,393,000 (30 June 2011: $1,070,000) which had a tax benefit of $418,000 (30 June 2011: $321,000) has been recognised in profit and loss in the current and prior periods, and $6,490,000 (30 June 2011: $675,000) which had a tax benefit of $1,947,000 (30 June 2011: $202,000) has been recognised in other comprehensive income in the current and prior periods. The tax benefit of these capital losses has been recognised in deferred tax assets.
On completion of the voluntary liquidation process the consolidated entity will realise a capital loss on its investment in PI Investment Management Limited. The tax benefit relating to the capital loss has not been recognised as a deferred tax asset at 30 June 2012.
95
For
per
sona
l use
onl
y

Balance 1 July 2011
Recognised in profit or
loss
Recognised in other
comprehensive income
Balance 30 June 2012
$'000 $'000 $'000 $'000
Note 10. Deferred tax assets / (liabilities) (continued)
Movement in temporary differences during the year
ConsolidatedDeferred tax assetsProvisions and accruals 10,766 3,262 - 14,028Intangible assets 1,076 (1,076) - -Capital expenditure deductible over 5 years 1,266 (608) - 658Structured products - interest received in advance 3,418 (1,189) - 2,229Employee benefits 10,750 (2,400) - 8,350Property, plant and equipment 3,691 (3,400) - 291Realised net capital losses 2,078 216 - 2,294Unrealised net capital losses 523 97 1,745 2,365Other items 845 (240) - 605Deferred tax assets from continuing operations 34,413 (5,338) 1,745 30,820
- 989 - 98934,413 (4,349) 1,745 31,809
Deferred tax liabilitiesIntangible assets (5,464) (456) - (5,920)
(1,176) 16 (402) (1,562)Other items (893) (96) - (989)
(7,533) (536) (402) (8,471)
Net deferred tax assets 26,880 (4,885) 1,343 23,338
Balance 1 July 2010
Recognised in profit or
loss
Recognised in other
comprehensive income
Balance 30 June 2011
$'000 $'000 $'000 $'000
Movement in temporary differences during the previous year
ConsolidatedDeferred tax assetsProvisions and accruals 11,589 (823) - 10,766Intangible assets - 1,076 - 1,076Capital expenditure deductible over 5 years 274 992 - 1,266Structured products - interest received in advance 4,289 (871) - 3,418Employee benefits 10,970 (220) - 10,750Property, plant and equipment 1,819 1,872 - 3,691Realised net capital losses 1,433 645 - 2,078Unrealised net capital losses 2,636 (2,299) 186 523Other items 209 636 - 845
33,219 1,008 186 34,413
Deferred tax liabilitiesIntangible assets (6,845) 1,381 - (5,464)
- (18) (1,158) (1,176)Other items (353) (540) - (893)
(7,198) 823 (1,158) (7,533)
Net deferred tax assets 26,021 1,831 (972) 26,880
Unrealised net capital gains
Notes to and forming part of the financial statements for the year ended 30 June 2012
Unrealised net capital gains
Deferred tax assets for discontinuing operations reclassified to held for sale assetsTotal
96
For
per
sona
l use
onl
y

Note 11. Dividends
a. Dividends paidDividends paid or provided for in the current and comparative year are as follows:
Cents per share
Total amount $'000
Franked1 / Unfranked
Date of payment
2012Final 2011 ordinary 90 40,229 Franked 27 Sep 2011Interim 2012 ordinary 50 20,968 Franked 29 Mar 2012
140 61,197
2011Final 2010 ordinary 105 45,602 Franked 28 Sep 2010Interim 2011 ordinary 95 42,216 Franked 30 Mar 2011Total amount 200 87,8181 All franked dividends declared or paid during the year were franked at a tax rate of 30 per cent and paid out of retained earnings.
b. Subsequent events
Cents per share
Total amount2
$'000Franked1 / Unfranked
Date of payment
Final 2012 ordinary 40 16,792 Franked 5 Oct 2012
1 All franked dividends declared or paid during the year were franked at a tax rate of 30 per cent and paid out of retained earnings.2 Calculation based on the ordinary shares on issue as at 30 June 2012.
2012 2011c. Dividend franking account $'000 $'000
26,764 60,88030% franking credits available to shareholders for subsequent financial years
The above available amounts are based on the balance of the dividend franking account at 30 June 2012 adjusted for franking credits that will arise from the payment of the current tax liabilities, and franking credits that will arise from the receipt of dividends recognised as receivables by the tax consolidated group at the year-end.
The ability to utilise the franking credits is dependent upon there being sufficient available profits to declare dividends. The impact on the dividend franking account of dividends proposed after the balance sheet date, but not recognised as a liability, is to reduce it to $19,606,000 (2011: $43,650,000).
Notes to and forming part of the financial statements for the year ended 30 June 2012
The financial effect of this dividend has not been brought to account in the financial statements for the year ended 30 June 2012 and will be recognised in subsequent financial reports.
The Company introduced a Dividend Reinvestment Plan (DRP) in May 2009. The DRP is optional and offers ordinary shareholders in Australia and New Zealand the opportunity to acquire fully paid ordinary shares, without transaction costs. Shareholders can elect to participate in or terminate their involvement in the DRP at any time.
Since the end of the financial year, the directors declared the following dividend. The dividends have not been provided for and there are no tax consequences.
97
For
per
sona
l use
onl
y

Notes to and forming part of the financial statements for the year ended 30 June 2012
2012 2011
Note 12. Earnings per shareEarnings per share
68.6 152.7 Diluted earnings per share 64.0 140.8
Earnings per share - continuing operations62.9 146.2
Diluted earnings per share 58.6 134.8
$'000 $'000
Net profit after tax attributable to equity holders of Perpetual Limited 26,679 62,031
Net profit after tax from discontinued operation 2,230 2,666
24,449 59,365
38,892,721 40,618,084Effect of dilutive securities:Share options - 9,252Weighted average number of treasury shares on issue 2,815,178 3,421,085
41,707,899 44,048,421
2012 2011$'000 $'000
Note 13. Cash and cash equivalents
72,547 79,478Deposits at call 61,182 86,601Short-term deposits 19,328 54,241
153,057 220,320
Number of sharesWeighted average number of ordinary shares used in the calculation of basic earnings per share
Weighted average number of ordinary shares and potential ordinary shares used in the calculation of diluted earnings per share
Basic earnings per share
Net profit after tax from continuing operations attributable to equity holders of Perpetual Limited
deposits represent investments in the Perpetual Credit Income Fund and Perpetual High Grade Treasury Fund. These funds have a Standard & Poor's fund credit quality rating of 'Af' and invest in high grade credit products with the intention of generating a return in excess of the UBS Bank Bill Index and are generally available at seven days' notice.
Deposits at call are invested in a cash management trust operated by the consolidated entity. Short-term
Consolidated
Cents per share
Consolidated
Bank balances
Basic earnings per share
The following reflects the income and share information used in calculating the basic and diluted earnings per share:
98
For
per
sona
l use
onl
y

Notes to and forming part of the financial statements for the year ended 30 June 2012
2012 2011$'000 $'000
Note 14. Receivables
CurrentTrade debtors 55,511 70,196Less: Provision for doubtful debts (845) (500)
54,666 69,696
Other debtors 3,571 3,02658,237 72,722
Balance as at 1 July 2011 500 522Provision for impairment recognised during the year 676 316Receivables written off during the year as uncollectible (147) (260)Unused amount reversed (184) (78)Balance as at 30 June 2012 845 500
This note should be read in conjunction with Note 29 i(c).
Note 15. Assets and liabilities held for sale
Assets classified as held for sale NoteDiscontinued operation - PLMS 7 11,705 -IT outsourcing 15(a) 2,328 -smartsuper 15(b) - 754
14,033 754
Liabilities classified as held for saleDiscontinued operation - PLMS 7 5,612 -IT outsourcing 15(a) - -smartsuper 15(b) - 904
5,612 904
Consolidated
Movements in the provision for bad and doubtful debts are as follows :
Movements in the provision for bad and doubtful debts have been recognised in Administrative and general expenses in the Consolidated Statement of Comprehensive Income. Amounts charged to the allowance account are generally written off when there is no expectation of recovering additional cash.
Assets and liabilities held for sale at 30 June 2012 comprise assets and liabilities of the discontinued operation of Perpetual Lenders Mortgage Services (PLMS) and assets being sold as part of the company's strategy to outsource Information Technology (IT).
99
For
per
sona
l use
onl
y

Notes to and forming part of the financial statements for the year ended 30 June 2012
2012 2011$'000 $'000
Note 15. Assets and liabilities held for sale (continued)
a. IT outsourcing
Assets classified as held for saleIntangibles - capitalised software 1,560 -Property, plant and equipment 768 -
2,328 -
b. smartsuper
Assets classified as held for saleReceivables - 716Prepayments - 38
- 754Liabilities classified as held for salePayables - 760Employee benefits - 144
- 904
An impairment loss of $17.9 million, composed of $14.5 million intangible assets impairment and $3.4 million property, plant and equipment impairment due to the remeasurement of the assets to the lower of their carrying value and their fair value less costs to sell has been recognised in Net profit before tax from continuing operations (see note 5 Individually significant items included in profit for the year).
The operations of smartsuper Pty Ltd were presented as a disposal group held for sale in the prior year. The sale was completed on the 12 August 2011. At 30 June 2011 the disposal group comprised assets of $0.8 million and liabilities of $0.9 million. A gain on the sale of business of $593,000 has been recognised in the year ended 30 June 2012.
In the 2011 comparative, an impairment loss of $4.1 million on the remeasurement of the disposal group to the lower of its carrying amount and its fair value less costs to sell was recognised in impairment of assets. This was in addition to the $10.6 million impairment of goodwill.
Consolidated
The announcement to market in June 2012 included an update on Perpetual’s plan to outsource IT as part of the ‘Transformation 2015’ strategy. Efforts to find an outsourcing partner are advanced, and an arrangement is expected early in financial year 2013. Assets are expected to be sold as part of the arrangement.
100
For
per
sona
l use
onl
y

Notes to and forming part of the financial statements for the year ended 30 June 2012
2012 2011$'000 $'000
Note 16. Other financial assets
Current100 100
Non-currentListed equity securities available-for-sale – at fair value 33,946 47,461Unlisted unit trusts available-for-sale – at fair value 5,352 5,882
102 102Secured loans 316 287
39,716 53,732Note 17. Derivative financial instrumentsCurrent liabilitiesInterest rate swap contracts and swap contracts 768 613
Interest rate swap contracts and swap contracts Interest rate swap contracts and swap contracts are held for hedging purposes associated with the PPI structured product are disclosed in Note 29(iii)(b).
Consolidated
This note should be read in conjunction with Note 29(iii)(b).
Government, municipal and other public securities
Government, municipal and other public securitiesheld-to-maturity
101
For
per
sona
l use
onl
y

Notes to and forming part of the financial statements for the year ended 30 June 2012
2012 2011$'000 $'000
Note 18. Property, plant and equipment
Plant and equipment – at cost 16,131 17,281Accumulated depreciation (12,683) (11,244)
3,448 6,037
Leasehold improvements – at cost 31,799 31,887Accumulated depreciation (15,632) (12,688)
16,167 19,199
Project work in progress – at cost 53 1,074
19,668 26,310
Depreciation and amortisation
Amortisation expense from continuing operations 4,695 4,652Amortisation expense from discontinued operations 482 600Total amortisation 5,177 5,252
Plant and equipment
Leasehold improvements
Project work in
progress Total$'000 $'000 $'000 $'000
ConsolidatedBalance as at 1 July 2011 6,037 19,199 1,074 26,310Additions 2,965 1,493 - 4,458Transfers from work in progress 495 526 (1,021) -Depreciation and amortisation (2,187) (2,990) - (5,177)Impairment1 (2,744) (612) - (3,356)Reclassification to assets held for sale (1,095) (1,444) - (2,539)Disposals (23) (5) - (28)Balance as at 30 June 2012 3,448 16,167 53 19,668
CHECKConsolidatedBalance as at 1 July 2010 6,623 20,634 539 27,796Additions 2,234 1,309 535 4,078Transfers from work in progress - - - -Depreciation and amortisation (2,624) (2,628) - (5,252)Reclassification to assets held for sale (189) (96) - (285)Disposals (7) (20) - (27)Balance as at 30 June 2011 6,037 19,199 1,074 26,310
1 An impairment loss of $3.4 million has been recognised in Net profit before tax from continuing operations. The impairment loss relates to Perpetual's plan to outsource IT as part of the 'Transformation 2015' strategy and the remeasurement of property, plant and equipment to the lower of their carrying value and their fair value less costs to sell.
Reconciliations of the carrying amounts for each class of property, plant and equipment are set out below:
Consolidated
Amortisation is recognised in the following line items in the Statement of Comprehensive Income :
102
For
per
sona
l use
onl
y

Notes to and forming part of the financial statements for the year ended 30 June 2012
2012 2011$'000 $'000
Note 19. Intangibles
Goodwill – at cost 97,308 113,539Impairment loss - (10,583)
97,308 102,956
Other intangibles – at cost 17,887 22,636Accumulated amortisation (5,685) (7,980)
12,202 14,656
Capitalised software – at cost 32,064 37,724Accumulated amortisation (24,096) (16,898)
7,968 20,826
Project work in progress – at cost 5,213 9,888122,691 148,326
Amortisation
Depreciation and amortisation expense from continuing operations 8,814 9,280Depreciation and amortisation expense from discontinued operations 837 1,117Total depreciation and amortisation 9,651 10,397
GoodwillOther
intangiblesCapitalised
software
Project work in
progress Total$'000 $'000 $'000 $'000 $'000
ConsolidatedBalance as at 1 July 2011 102,956 14,656 20,826 9,888 148,326Additions - - 15 5,722 5,737Transfers from work in progress - - 10,397 (10,397) -Amortisation for the year - (2,439) (7,212) - (9,651)Impairment1 - - (14,498) - (14,498)Reclassification to assets held for sale (5,648) (15) (1,560) - (7,223)Balance as at 30 June 2012 97,308 12,202 7,968 5,213 122,691
CHECK
Balance as at 1 July 2010 113,539 21,342 23,045 5,582 163,508Additions - - 198 9,608 9,806Transfers from work in progress - - 4,833 (4,833) -Impairment (10,583) - - - (10,583)Amortisation for the year - (3,828) (6,569) - (10,397)Reclassification to assets held for sale - (2,858) (165) - (3,023)Disposals - - (516) (469) (985)Balance as at 30 June 2011 102,956 14,656 20,826 9,888 148,326
1 An impairment loss of $14.5 million has been recognised in Net profit before tax from continuing operations. The impairment loss relates to Perpetual's plan to outsource IT as part of the 'Transformation 2015' strategy and the remeasurement of the intangible assets to the lower of their carrying value and their fair value less costs to sell.
Reconciliations of the carrying amounts for each class of intangibles are set out below:
Consolidated
Amortisation is recognised in the following line items in the Statement of Comprehensive Income :
103
For
per
sona
l use
onl
y

2012 2011$'000 $'000
Note 19. Intangibles (continued)
Impairment tests for cash generating units containing goodwillThe following cash generating units have significant carrying amounts of goodwill:
Perpetual Private 77,159 77,159Securitisation 16,653 16,653Australian Equities 3,496 3,496Perpetual Lenders Mortgage Services* - 5,648
97,308 102,956
* Transferred to Assets held for sale.
Note 20. Prepayments
CurrentPrepayments 8,803 6,525
Non-current Prepayments 369 614
Note 21. Payables
CurrentTrade creditors 26,312 30,825Other creditors and accruals 4,971 9,517
31,283 40,342
This note should be read in conjunction with Note 29 (ii).
Note 22. Structured products – income received in advance
CurrentInterest income 7,138 11,057
Notes to and forming part of the financial statements for the year ended 30 June 2012
Impairment testing of these goodwill balances is based on each cash generating unit's value in use, calculated as the present value of forecast future cash flows from those cash generating units using discount rates of between 12.5% and 15% (2011: discount rates of between 12.5% and 15%). The forecast future cash flows used in the impairment testing are based on assumptions as to the level of profitability for each business over a forecast period. Forecast future cash flows have been projected for 3 years based on the 2013-2015 Operating Plan which has been approved by the Board and then projected for an indefinite period by including a terminal value with a growth rate in perpetuity of 2.5%.
Income received in advance consists of deferred interest income received associated with the PPI structured product. The PPI structured product is disclosed in Note 29 (i)(a).
Consolidated
The Clean Energy Act introduced a carbon pricing mechanism into the Australian economy from 1 July 2012. The introduction of the carbon pricing mechanism is not expected to have a material impact on the future cash flows generated from the cash-generating units for the purpose of fair value calculations in asset impairment models.
104
For
per
sona
l use
onl
y

2012 2011$'000 $'000
Note 23. Non-current interest-bearing liabilities
Floating rate bill facility 45,000 45,000
Note 24. Provisions
CurrentInternal insurance and legal provision1 721 477Operational process review provision 170 249Lease expense provision 1,335 859
2,226 1,585
Non-currentInternal insurance and legal provision1 800 800Lease expense provision 20,341 22,782
21,141 23,582
Internal insurance and legal provisionCarrying amount at beginning of year 1,277 6,204
862 440(416) (417)
Unused amounts reversed during the year (202) (4,950)Carrying amount at end of year 1,521 1,277
Carrying amount at beginning of year 249 1,667Additional provision made during the year 513 2,250Unused amounts reversed during the year (301) (1,204)Payments made during the year (291) (2,464)Carrying amount at end of year 170 249
Reconciliations of the carrying amounts of each class of provision are set out below:
Operational process review provision
Additional provision made during the yearPayments made during the year
Notes to and forming part of the financial statements for the year ended 30 June 2012
Consolidated
1 The internal insurance and legal provision includes the provision for self insurance and the provision for litigation. The provision for self-insurance recognises incurred but not reported claims. The provision for litigation claims includes provisions for legal cost and settlement amounts. These provisions are measured at the cost that the entity expects to incur in defending and/or settling the claim.
See Notes 28 and 29 iii(b) for additional information. Bank facility associated with the PPI structured product is disclosed in Note 30 ii.
105
For
per
sona
l use
onl
y

2012 2011$'000 $'000
Note 24. Provisions (continued)
Lease expense provision Carrying amount at beginning of year 23,641 22,724
15,627 14,894(16,383) (14,376)
Unused amounts reversed during the year (1,862) (231)Unwinding of provisions 653 630Carrying amount at end of year 21,676 23,641
Note 25. Contributed equity
Share capital
236,530 236,530 245,066
Numberof shares $'000
Number of shares $'000
Movements in share capital
Balance at beginning of year 41,021,469 245,066 40,094,528 206,017Shares issued:Dividend reinvestment - - 483,569 14,044Executive share plans (vested during the year) 482,392 23,163 441,443 24,777Employee equity allocation purchased on market (49,880) (1,050) (1,162) (42)Employee share plans (vested during the year) - 190 - 177Issued on market 2,219 47 3,091 93Off market share buy-back (3,349,884) (30,886) - -Balance at end of year 38,106,316 236,530 41,021,469 245,066CHECK
38,106,316 236,530 41,021,469 245,066Unvested shares from share plans 3,874,362 143,037 3,649,660 166,881Ordinary shares fully paid 41,980,678 379,567 44,671,129 411,947
CHECK
The Company does not have authorised capital or par value in respect of its issued shares.
Terms and conditions
In the event of winding up of the Company, ordinary shareholders rank after creditors and are fully entitled to any surplus capital.
Holders of ordinary shares are entitled to receive dividends as declared from time to time and entitled to one vote per share at shareholders' meetings.
Ordinary shares fully paid (excluding unvested shares from share plans)
41,980,678 (2011: 44,671,129) ordinary shares, fully paid
2012 2011
On 17 October 2011 the Company completed an off-market share buy-back. The buy-back price was $20.90 per share, which represents a discount to the market price of 10% being the maximum discount in the tender discount range. The capital component was $9.22 per share.
During the year, the Company issued nil (30 June 2011: nil) ordinary shares in relation to vested options in accordance with Perpetual Limited's Long Term Incentive Plan at a weighted average share price of nil (30 June 2011: nil) per share.
Additional provision made during the yearPayments made during the year
Notes to and forming part of the financial statements for the year ended 30 June 2012
Consolidated
106
For
per
sona
l use
onl
y

Notes to and forming part of the financial statements for the year ended 30 June 2012
2012 2011$'000 $'000
Note 26. Reserves
General 103 103Available-for-sale reserve (370) 3,499Equity compensation reserve 30,369 45,694Cash flow hedge reserve (495) (416)Foreign currency translation reserve (5,379) (4,635)
24,228 44,245
Note 27. Employee benefits
i. Aggregate liability for employee benefits, including on-costs
CurrentLiability for annual leave 5,385 6,650Liability for long service leave 3,224 3,512Other employee benefits 14,756 24,605Restructuring provision 17,227 6,025
40,592 40,792
Non-currentLiability for long service leave 3,255 3,201
Restructuring provisionCarrying amount at beginning of year 6,025 40
26,476 9,125(15,274) (3,140)
Carrying amount at end of year 17,227 6,025Payments made during the year
Consolidated
The available-for-sale reserve represents movements in the fair value of shares and unit trusts. When these assets are sold or considered impaired, the cumulative gain / loss that had been recognised directly in equity is recycled to profit and loss.
The equity compensation reserve represents the value of the Company's own shares held by an equity compensation plan that the consolidated entity is required to include in the consolidated financial statements. This reserve will be reversed against share capital when the underlying shares vest to the employee. No gain or loss is recognised in profit and loss on the purchase, sale, issue or cancellation of the consolidated entity's own equity instruments.
The cash flow hedge reserve is used to record gains or losses on hedging instruments designated as cash flow hedges as described in accounting policy Note 2 xxii(a). Amounts are recognised in the Statement of Comprehensive Income when the associated hedged transaction affects profit and loss.
The foreign currency translation reserve records the foreign currency differences arising from the translation of self-sustaining foreign operations, the translation of transactions that hedge the company’s net investment in a foreign operation or the translation of foreign currency monetary items forming part of the net investment in a self-sustaining operation. Upon cessation of operations the debit balance in the foreign currency reserve related to the operations in Dublin will be reclassified to operating expenses within profit and loss. This is expected to occur in 2012/2013. Refer to accounting policy Note 2 iv.
Additional provision made during the year
107
For
per
sona
l use
onl
y
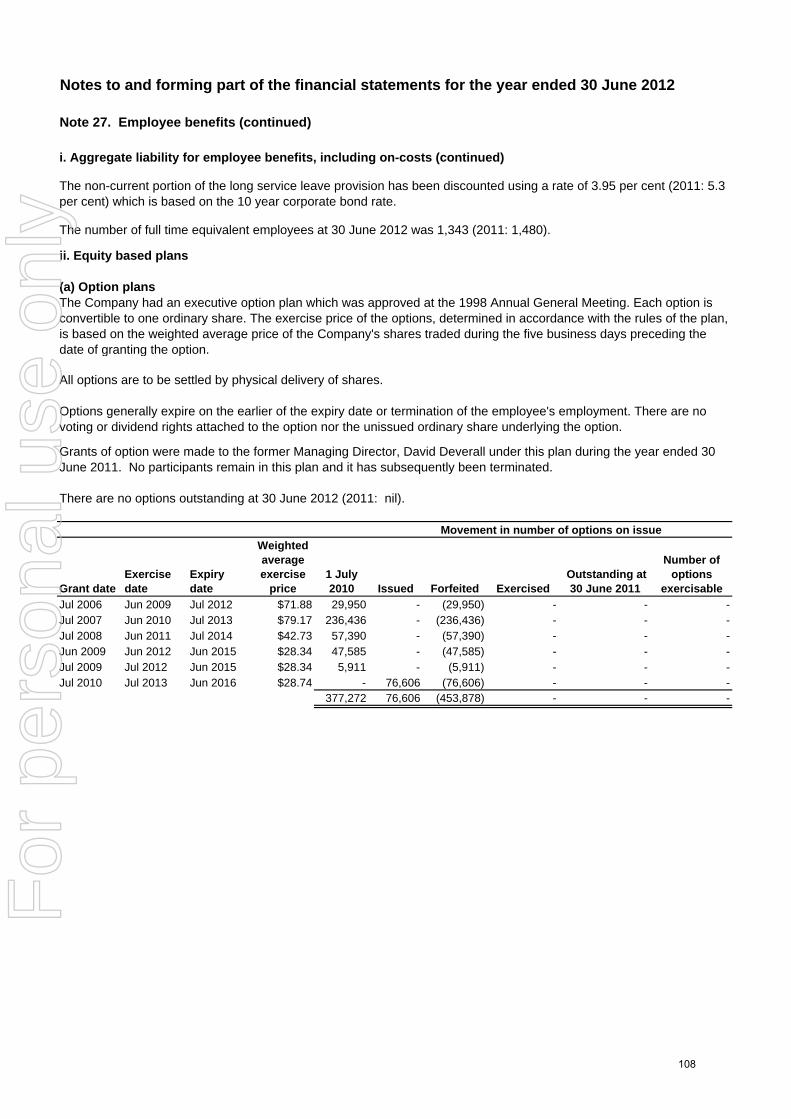
Notes to and forming part of the financial statements for the year ended 30 June 2012
Note 27. Employee benefits (continued)
i. Aggregate liability for employee benefits, including on-costs (continued)
ii. Equity based plans
(a) Option plans
Movement in number of options on issue
Grant dateExercise date
Expiry date
Weighted average exercise
price 1 July 2010 Issued Forfeited Exercised
Outstanding at 30 June 2011
Number of options
exercisableJul 2006 Jun 2009 Jul 2012 $71.88 29,950 - (29,950) - - -Jul 2007 Jun 2010 Jul 2013 $79.17 236,436 - (236,436) - - -Jul 2008 Jun 2011 Jul 2014 $42.73 57,390 - (57,390) - - -Jun 2009 Jun 2012 Jun 2015 $28.34 47,585 - (47,585) - - -Jul 2009 Jul 2012 Jun 2015 $28.34 5,911 - (5,911) - - -Jul 2010 Jul 2013 Jun 2016 $28.74 - 76,606 (76,606) - - -
377,272 76,606 (453,878) - - -
Options generally expire on the earlier of the expiry date or termination of the employee's employment. There are no voting or dividend rights attached to the option nor the unissued ordinary share underlying the option.
Grants of option were made to the former Managing Director, David Deverall under this plan during the year ended 30 June 2011. No participants remain in this plan and it has subsequently been terminated.
There are no options outstanding at 30 June 2012 (2011: nil).
The non-current portion of the long service leave provision has been discounted using a rate of 3.95 per cent (2011: 5.3 per cent) which is based on the 10 year corporate bond rate.
All options are to be settled by physical delivery of shares.
The Company had an executive option plan which was approved at the 1998 Annual General Meeting. Each option is convertible to one ordinary share. The exercise price of the options, determined in accordance with the rules of the plan, is based on the weighted average price of the Company's shares traded during the five business days preceding the date of granting the option.
The number of full time equivalent employees at 30 June 2012 was 1,343 (2011: 1,480).
108
For
per
sona
l use
onl
y

Notes to and forming part of the financial statements for the year ended 30 June 2012
Note 27. Employee benefits (continued)
ii. Equity-based plans (continued)
(a) Option plans (continued)
2011Fair value at grant date ($) 5.29Share price ($) 30.80Exercise price ($) 28.74Expected volatility (%) 30Option life (years) 5Expected dividends (%) 6.16Risk free interest rate (%) 4.83
(b) Executive Share Plan (ESP)
(c) Employee Share Purchase Plan (ESPP)This plan was discontinued on 10 December 2004 and no further issues have been made under this plan.
The shares vest when the loan is fully repaid.
While shares are held by the ESP, employees receive dividends and have voting rights.
The ESPP provided eligible employees with a non-recourse interest free loan, for a period not exceeding 10 years, to purchase shares under the plan. The invitation was open to employees who commenced permanent employment with Perpetual prior to 1 June 2004 with an offer to purchase a minimum number of shares equivalent in value to $1,000 and a maximum number of shares equivalent in value to $4,000. The issue price under the plan was the weighted average of the prices at which shares were traded on the ASX for the five days up to the date of issue.
The fair value of services received in return for share options granted is based on the fair value of share options granted, measured using a binomial option pricing model, with the following inputs (weighted average):
The ESP was approved by shareholders at the Company's Annual General Meeting in 1997 and was amended at the 1999 AGM.
The ESP forms part of the structure for short and long term variable remuneration components paid to employees. Grants under the plan for short-term performance are made on achievement of specific performance goals. Long-term grants vest after periods of between three to five years, and may include the achievement of specific performance hurdles.
The issue price of grants of shares is the weighted average of the prices at which shares were traded on the ASX for the five days up to the date of issue. Shares are either purchased on market or issued by the Company to satisfy the grants made to eligible employees.
109
For
per
sona
l use
onl
y

Notes to and forming part of the financial statements for the year ended 30 June 2012
Note 27. Employee benefits (continued)
ii. Equity based plans (continued)
(d) Tax Exempt Share Plan (TESP)
(e) The Tax Deferred Share Plan (TDSP)
(f) Deferred Share Plan (DSP)
(g) Global Employee Share Trust (GEST)
Grants under the plan vest subject to the achievement of specific performance hurdles.
(h) Long-term incentive plan (LTI)In February 2011, the Board approved the introduction of a new plan, the Perpetual Limited Long-term Incentive Plan, for the purpose of making future long-term incentive grants to executives, including the sign-on grant of shares to the former Managing Director, approved by shareholders at the 2011 AGM.
The new plan was introduced to modernise terms and conditions in light of significant changes to market practice and regulation of employee equity plans over the past decade. A single set of rules has been developed to enable grants of performance shares or options. Having these included under a single plan ensures consistency and additional flexibility.
Under the TESP, eligible employees will be able to salary sacrifice up to $1,000 of short term incentive to acquire an equivalent value of Perpetual shares. These shares cannot be sold or transferred until the earlier of three years after the date of allocation or the time the participant ceases to be an employee of Perpetual. Shares will be acquired in ordinary trading on the Australian Securities Exchange or issued by Perpetual. Executive directors and executives are not able to participate in this plan.
Dividends paid on shares held by the GEST are retained in the GEST for the benefit of the employee until performance hurdles are tested, at which time the dividend accumulated may be distributed to the employee. Voting rights attached to unvested shares that are held in the GEST are exercisable by the trustee of the GEST.
Under the TDSP, eligible employees are able to salary sacrifice all or part of their short term incentive to acquire an equivalent value of Perpetual shares. Shares are acquired in the ordinary course of trading on the Australian Securities Exchange. Executive directors and executives have the opportunity to participate in this plan. Shares acquired under this plan by executive directors and executives are not subject to performance hurdles because they are acquired on a salary or bonus sacrifice basis.
The DSP forms part of the structure for short-term and long-term variable remuneration components paid to eligible employees of the Australian business. Grants under the plan vest subject to the achievement of specific performance hurdles and service.
The issue price of grants is the weighted average of the prices at which shares traded on the Australian Securities Exchange for the five days up to the date of issue. Shares are either purchased on market or issued by the company to satisfy grants made to eligible employees.
While shares are held by the DSP, eligible employees have voting rights and receive dividends directly or reinvest dividends into Perpetual shares.
The GEST formed part of the structure for long-term variable remuneration components paid to eligible employees of the Perpetual Investments Global Equities business. The plan is closed and no longer being used.
The issue price of grants is the weighted average of the prices at which shares traded on the Australian Securities Exchange for the five days prior to the date of grant of shares. Shares were ether purchased on market or issued by the company to satisfy grants made to eligible employees.
110
For
per
sona
l use
onl
y

Notes to and forming part of the financial statements for the year ended 30 June 2012
Note 27. Employee benefits (continued)
ii. Equity-based plans (continued)
(i) Details of the movement in employee shares
(j) Non-executive directors' share purchase plan
During this financial year and last financial year there were no directors that purchased shares on market in the Non-executive directors share purchase plan.
A share purchase plan for non-executive directors was approved by shareholders at the annual general meeting in October 1998, under which each non-executive director can sacrifice up to 50 per cent of their director's fees to acquire shares in the Company. The shares are purchased four times throughout the year at market value and have a disposal restriction of 10 years, or when the director ceases to be a director of the Company.
The amounts recognised in the financial statements of the consolidated entity in relation to the share plans referred to above during the year were amortisation of performance shares totalling $12,218,000 (2011: $18,488,000) recognised as an expense with the corresponding entry directly in equity.
Of share grants under the ESP, DSP and LTI in the 2012 financial year, 631,969 shares were issued at market price and 530,522 shares were re-issued from the forfeited share pool at market price. As a result of changes in the employee share scheme rules enacted in 2009, dividends that were being reinvested in Perpetual shares on long term incentive schemes are either now being received directly by the employees or held in the share plan bank account depending on the likelihood of the shares vesting.
111
For
per
sona
l use
onl
y

Notes to and forming part of the financial statements for the year ended 30 June 2012
2012 2011$'000 $'000
Note 28. Financial arrangements
The consolidated entity has access to the following line of credit:
Facilities utilisedFloating rate bank facility 45,000 45,000
Facilities not utilised Floating rate bank facility 25,000 25,000
Bill facilities
Bank facilities associated with the PPI structured product are disclosed in Note 30 ii.
This note should be read in conjunction with Note 29 iii(b).
The consolidated entity has agreed to various debt covenants including shareholders' funds as a specified percentage of total assets, a minimum amount of shareholders' funds, a maximum ratio of total debt, a minimum interest cover, a maximum amount of structured product liabilities and a maximum provision for PPI credit losses as a specified percentage of PPI investor loans. The consolidated entity is in compliance with the covenants at 30 June 2012. Should the consolidated entity not satisfy any of these covenants, the outstanding balance of the loans may become due and payable.
Consolidated
The floating rate bank bill facility is unsecured and has a floating interest rate of 4.78 per cent at 30 June 2012 (30 June 2011: 5.45 per cent). Repayment of the existing facility is due on 31 January 2014.
112
For
per
sona
l use
onl
y

Notes to and forming part of the financial statements for the year ended 30 June 2012
Note 29. Financial risk management
The following discussion relates to financial risks exposure of the consolidated entity in its own right.
2012 2011$'000 $'000
Cash and cash equivalents 153,057 220,320Trade debtors 54,666 69,696Structured products - loans receivable (PPI) 109,165 151,059Other loan receivables 3,887 3,312Available-for-sale listed equity securities and unlisted unit trusts 39,298 53,344Held-to-maturity securities 202 202
Credit risk is managed on a functional basis across the various business segments. As a result of the swap agreements between the EMCF and the consolidated entity, the consolidated entity is also exposed to credit risk on its exposure to the $695 million (2011: $906 million) of underlying investments held by the EMCF. This maximum exposure would only be realised in the unlikely event that the recoverable value of all of the underlying investments held by the EMCF decline to $nil. Further details of the credit risk relating to the EMCF are disclosed in Note 30.
Consolidated
Perpetual recognises that risk is part of doing business and that the ongoing management of risk is critical to its success. The approach to managing risk is articulated in the Risk Management Framework. The Risk Management Framework is supported by the Risk Group, who are responsible for the design and maintenance of the framework, establishing and maintaining group wide risk management policies, and providing regular risk reporting to the Board, the Audit, Risk and Compliance Committee (ARCC) and the Group Executive Committee. This framework is approved by the Perpetual Board of Directors (the Board) and is reviewed for adequacy and appropriateness on an annual basis.
Credit risk is the risk of financial loss from a counterparty failing to meet its contractual commitments. The consolidated entity is predominantly exposed to credit risk on its Perpetual Protected Investments (PPI) loans which are issued only in Australia to retail customers, derivative financial instruments and deposits with banks and financial institutions, outstanding receivables and committed transactions.
The maximum exposure of the consolidated entity to credit risk on financial assets which have been recognised on the balance sheet is the carrying amount, net of any provision for doubtful debts. The table below outlines the consolidated entity's maximum exposure to credit risk as at reporting date.
The Board regularly monitors the overall risk profile of the group and sets the risk appetite for the group, usually in conjunction with the annual planning process. The Board is responsible for ensuring that management have appropriate processes in place for managing all types of risk, ranging from financial risk to operational risk. To assist in providing ongoing assurance and comfort to the Board, responsibility for risk management oversight has been delegated to the ARCC. The main functions of this Committee are to oversee the consolidated entity’s accounting policies and practices, the integrity of financial statements and reports, the scope, quality and independence of external audit arrangements, the monitoring of the internal audit function, the effectiveness of risk management policies and the adequacy of insurance programs. This Committee is also responsible for monitoring overall legal and regulatory compliance.
The activities of the consolidated entity expose it to the following financial risks: credit risk, liquidity risk and market risk. These are distinct from the financial risks borne by customers which arise from financial assets managed by the consolidated entity in its role as fund manager, trustee and responsible entity.
The risk management approach to and exposures arising from the Exact Market Cash Fund (EMCF) are disclosed in Note 30.
i. Credit risk
113
For
per
sona
l use
onl
y

Notes to and forming part of the financial statements for the year ended 30 June 2012
Note 29 - Financial risk management (continued)
i. Credit risk (continued)
(a) Structured products – Perpetual Protected Investment loans
(b) Investments held by incubation funds
(c) Other financial assets
In order to manage the credit risk arising from lending to investors in PPI structured product offerings, the consolidated entity has in place a Credit Office who report to the General Manager, Service and Operations. The Credit Office is governed by the Credit Risk Policy which stipulates the criteria that investors are required to meet prior to being granted a loan, and hence ensures that all investors under this arrangement possess the desired level of credit worthiness. The Credit Risk Policy is reviewed periodically by the General Manager Legaland Risk to ensure its continued compliance with the Group’s Risk Management Framework. All loans are secured by the investor’s investment in the structured product and the consolidated entity has recourse to the investor and the investment in the event of default. A charge over additional collateral may be required for loans greater than $2 million. As at 30 June 2012, loans for which Perpetual holds additional collateral amounted to nil (30 June 2011: $3.5 million).
The consolidated entity minimises concentrations of credit risk by imposing a limit on the exposure it can have with each investor. The maximum standard exposure per borrower is set at $1 million. For amounts greater than $1 million, approval from both the General Manager Legal and Risk and the Chief Financial Officer (CFO) is required.
There were no PPI loans that were past due but not impaired as at the reporting date. Further information on the risk management approach to and exposures arising from the PPI structured product offerings is disclosed below in this note and in Note 30.
Perpetual incubates new investment strategies through the establishment of seed funds for the purpose of building investment track records and developing asset management skills before releasing products to Perpetual’s investors. Exposure to credit risk arises on the consolidated entity's financial assets held by the incubation funds mainly being deposits with financial institutions and derivative financial instruments.
Trade debtors are managed by the accounts receivable department. Outstanding fees and receivables are monitored on a daily basis and an aged debtors report is prepared and monitored by Group Finance. Management assesses the credit quality of customers by taking into account their financial position, past experience and other factors.
The Credit Office monitors the loan portfolio on a daily basis and provides reports on a monthly basis to Group Finance and the Risk Group for review. Arrears above 30 days are reviewed on a monthly basis by the Credit Committee, and are followed up and managed by the Credit Officer and recovery initiatives can include litigation if required.
The exposure to credit risk is monitored on an ongoing basis by the funds' investment manager and managed in accordance with the investment mandate of the funds.
The consolidated entity's exposure to trade debtors is influenced mainly by the individual characteristic of each customer.
Credit risk is not considered to be significant to the incubation funds as investments held by the funds are predominantly equity securities.
114
For
per
sona
l use
onl
y

Notes to and forming part of the financial statements for the year ended 30 June 2012
Note 29 - Financial risk management (continued)
i. Credit risk (continued)
(c) Other financial assets (continued)
Less than 30
days
30 to 60 days
60 to 90
days
More than 90
days Total
Less than 30
days
30 to 60 days
60 to 90
days
More than 90
days Total $'000 $'000 $'000 $'000 $'000 $'000 $'000 $'000 $'000 $'000
Consolidated
Trade debtors 2,071 1,049 278 261 3,659 2,176 737 371 693 3,977Other debtors 1,211 3 375 671 2,260 936 57 119 12 1,124
3,282 1,052 653 932 5,919 3,112 794 490 705 5,101
Credit risk further arises in relation to financial guarantees given to wholly owned subsidiaries. Such guarantees are only provided in exceptional circumstances and are subject to specific Board approval and are monitored on a quarterly basis as part of the consolidated entity's regulatory reporting.
Credit risk arising from cash investments is mitigated by ensuring they have a Standard & Poor’s rating of ‘A’ or higher, and transactions involving derivatives are limited to high credit quality financial institutions.
The credit quality of financial assets that are neither past due nor impaired is assessed by reference to external credit ratings, if available, or to historical information on counterparty default rates.
The trade debtors in the above table relate to a number of independent customers and investors for whom there is no recent history of default.
The tables below provide an aged analysis of the financial assets which were past due but not impaired as at the reporting date.
30 June 2012 30 June 2011
115
For
per
sona
l use
onl
y

Notes to and forming part of the financial statements for the year ended 30 June 2012
Note 29 - Financial risk management (continued)
i. Credit risk (continued)
(c) Other financial assets (continued)The nominal values of financial assets which were impaired and have been provided for are as follows:
Trade debtorsStructured products - loans receivable
ii. Liquidity risk
3,064 2,8313,909 3,331
Liquidity risk is the risk that the financial obligations of the consolidated entity cannot be met as and when they fall due without incurring significant costs. The consolidated entity’s approach to managing liquidity is to maintain a level of cash or liquid investments sufficient to meet its ongoing financial obligations. The consolidated entity has a robust liquidity risk framework in place which is principally driven by the Capital Management Review (refer to capital management disclosed below in Note 29(iv) for further details).
The consolidated entity manages liquidity risk by continually monitoring forecast and actual cash flows, and by matching the maturity profiles of financial assets and liabilities. Surplus funds are generally only invested in instruments that are tradeable in highly liquid markets. In addition, a five year forecast of liquid assets, cash flows and balance sheet is reviewed by the Board on a semi-annual basis as part of the Capital Management Review to ensure there is sufficient liquidity within the Group.
The repayment of the existing utilised facility of $45 million (refer to Note 28) is due on 31 January 2014.
The $25 million unutilised bank facility may be drawn at any time at the discretion of the consolidated entity. The consolidated entity's bank facilities are subject to annual review and management intends to refinance the existing facility for a further period after the due date.
The impaired financial assets relate mainly to independent customers and investors who are in unexpectedly difficult economic situations, where the consolidated entity is of the view that the full carrying value of the receivable cannot be recovered. The consolidated entity does not hold any collateral against the trade debtors. Collateral held in respect of PPI loans is discussed in Note 29(i)(a) above. For details of the provisions for impairment refer to Notes 14 and 30.
$'000 $'000845 500
Consolidated2012 2011
116
For
per
sona
l use
onl
y

Notes to and forming part of the financial statements for the year ended 30 June 2012
Note 29 - Financial risk management (continued)
ii. Liquidity risk (continued)
Maturities of financial liabilities
Less than 1
year1 to 5 years
More than 5 years Total
Less than 1
year1 to 5 years
More than 5 years Total
$'000 $'000 $'000 $'000 $'000 $'000 $'000 $'000Consolidated
LiabilitiesTrade and other payables 31,283 - - 31,283 40,342 - - 40,342Interest bearing liabilities - 45,000 - 45,000 - 45,000 - 45,000Structured products - interest bearing liabilities 23,046 88,370 - 111,416 17,386 134,109 - 151,495
54,329 133,370 - 187,699 57,728 179,109 - 236,837
Derivatives Net settled - Interest rate swap contracts and swap contracts 123 95 - 218 200 509 - 709Gross settled - other derivatives- outflow 127 - - 127 1,134 - - 1,134- (inflow) (125) - - (125) (1,117) - - (1,117)
125 95 - 220 217 509 - 726
30 June 2012 30 June 2011
The tables below show the maturity profiles of the financial liabilities and gross settled derivative financial instruments for the consolidated entity. These have been calculated using the contractual undiscounted cash flows.
117
For
per
sona
l use
onl
y

Notes to and forming part of the financial statements for the year ended 30 June 2012
Note 29 - Financial risk management (continued)
iii. Market risk
(a) Currency risk
(b) Interest rate risk
(a) Fixed rate assets being financed with floating rate liabilities; and(b) Maturity or duration mismatches.
The consolidated entity is subject to the following market risks:
Investments held in listed securities and unlisted unit trusts including incubation funds are of a non-monetary nature and therefore are not exposed to currency risk as defined in AASB 7 Financial Instruments: Disclosures . The currency risk relating to non-monetary assets and liabilities is a component of price risk and arises as the value of the securities denominated in other currencies fluctuates with changes in exchange rates.
In order to manage the interest rate risk relating to PPI structured products, it is the consolidated entity’s policy to hedge at least 95 per cent of its loan exposure by entering into floating-to-fixed interest rate swaps where the banking facilities have a variable interest rate. The hedging of interest rate exposure is managed by Group Finance and is reported to the Audit, Risk and Compliance Committee on a half-yearly basis.
The exposure to currency risk, as defined in AASB 7 Financial Instruments: Disclosures , arises when financial instruments are denominated in a currency that is not the functional currency of the entity and are of a monetary nature. Hence the gains/(losses) arising from the translation of the controlled entities’ financial statements into Australian dollars are not considered in this note.
A significant proportion of the monetary financial instruments held by the consolidated entity, being liquid assets, receivables, loans receivable, interest-bearing liabilities and payables, interest rate swaps, are denominated in Australian dollars. Hence fluctuations in exchange rates do not materially impact the profit/(loss) for the year or shareholders' equity.
PPI structured product loans bear interest rates which are either fixed for the term of the product (7 years), fixed annually or variable. The consolidated entity has entered into fixed and variable rate banking facilities in order to finance loans provided to investors as a result of exposure to interest rate risk arising from:
Interest rate risk is the risk that the fair value or future cash flows of a financial instrument will fluctuate because of changes in market interest rates. The consolidated entity's exposure to interest rate risk arises predominantly on investor loans granted under the PPI structured product offering.
118
For
per
sona
l use
onl
y

Notes to and forming part of the financial statements for the year ended 30 June 2012
Note 29 - Financial risk management (continued)
iii. Market risk (continued)
(b) Interest rate risk (continued)
Consolidated
6 months or less
6-12 months
3-4 years
Note $'000 $'000 $'000 $'000 $'000 $'000
At 30 June 2012
Financial assetsCash assets 13 153,057 - - - 153,057Receivables 14 - - - - 58,237 58,237Other financial assets 16 60 142 - - 39,614 39,816Structured products – loans receivable - current 30 24,222 - - - - 24,222Structured products – loans receivable - non-current 30 7,991 - 30,416 46,536 - 84,943
185,330 142 30,416 46,536 97,851 360,275
Financial liabilitiesPayables 21 - - - - 31,283 31,283Interest-bearing liabilities 23 45,000 - - - - 45,000Structured products – interest-bearing liabilities - current 29(ii) 23,046 - - - - 23,046Structured products – interest-bearing liabilities - non-current 29(ii) 40,850 - 7,680 39,840 - 88,370Effect of interest rate swaps (27,400) - 21,214 6,186 - -
81,496 - 28,894 46,026 31,283 187,699
At 30 June 2011
Financial assetsCash assets 13 220,070 250 - - - 220,320Receivables 14 - - - - 72,722 72,722Other financial assets 16 60 142 - - 53,630 53,832Structured products – loans receivable - current 30 20,806 - - - - 20,806Structured products – loans receivable - non-current 30 15,583 - 51,368 63,302 - 130,253
256,519 392 51,368 63,302 126,352 497,933
Financial liabilitiesPayables 21 - - - - 40,342 40,342Interest-bearing liabilities 23 45,000 - - - - 45,000Structured products – interest-bearing liabilities - current 29(ii) 17,386 - - - - 17,386Structured products – interest-bearing liabilities - non-current 29(ii) 64,572 - 13,255 56,282 - 134,109Effect of interest rate swaps (43,186) - 36,455 6,731 - -
83,772 - 49,710 63,013 40,342 236,837
Fixed interest rate maturing in
The consolidated entity's exposure to interest rate risk for the financial assets and liabilities is set out as follows:
Total
Non-interest bearing
Floating interest rate
119
For
per
sona
l use
onl
y

Notes to and forming part of the financial statements for the year ended 30 June 2012
Note 29 - Financial risk management (continued)
iii. Market risk (continued)
(b) Interest rate risk (continued)
Consolidated
Change in variable+ 1 per cent- 1 per cent
(c) Market risks arising from Funds Under Management and Funds Under Advice
(d) Market risks arising from incubation funds
(1,676)
The consolidated entity is exposed to equity price risk on investments held by its incubation funds. The funds may also be exposed, to a small extent, to the other risks which influence the value of those shares or units (including foreign exchange rates and interest rates).
The Investment Committee is responsible for determining the size of and approving new incubation fund strategies. They also ensure management has appropriate processes and systems in place for managing investment risk for each fund. The funds' specialist asset managers aim to manage the impact of price risks through the use of consistent and carefully considered investment guidelines. Risk management techniques are used in the selection of investments, including derivatives, which are only acquired if they meet specified investment criteria. Daily monitoring of trade restrictions and derivative exposure against limits is undertaken with any breach of these restrictions reported to the General Manager Legal and Risk.
The impact on profit after tax for the year would be mainly as a result of an increase / (decrease) in interest revenue earned on cash and cash equivalents. The impact on equity would be mainly the result of an increase/(decrease) in the fair value of the cash flow hedges associated with variable interest rate borrowings.
The consolidated entity’s revenue is significantly dependent on Funds Under Management ('FUM') and Funds Under Advice ('FUA') which are influenced by equity market movements. Management calculates the expected impact on revenue for each 1 per cent movement in the All Ords. Based on the level of the All Ords at the end of 30 June 2012 (4,135.5), a 1 per cent movement in the market changes annualised revenue by approximately $1.5m to $2.0m. It is worth noting this movement is not linear to the overall value of the market. This means that as the market reaches higher or lower levels, a 1 per cent movement may have a larger or smaller effect on revenue as FUM and FUA are comprised of both equity market and non-equity market-sensitive asset classes.
These funds may be party to derivative financial instruments in the normal course of business in order to hedge exposure to fluctuations in foreign exchange rates, interest rates and equity indices in accordance with the funds' investment guidelines.
30 June 2011Impact on
equity$'000
Impact on profit after tax
$'000
30 June 2012Impact on
equity$'000
Impact on profit after tax
The table below demonstrates the impact of a 1 per cent change in interest rates, with all other variables held constant, on the profit after tax and equity of the consolidated entity.
1,122(1,130)
1,074(1,074)
$'000
728(728)
1,670
120
For
per
sona
l use
onl
y

Notes to and forming part of the financial statements for the year ended 30 June 2012
Note 29 - Financial risk management (continued)
iii. Market risk (continued)
(d) Market risks arising from incubation funds (continued)
(e) Market risks arising from the Exact Market Cash Funds
iv. Capital management
(a) Dividend Policy
(b) Review of capital and distribution of excess capital A review of the consolidated entity’s capital base is performed at least semi-annually and excess capital that is surplus to the Group's current requirements is potentially returned to shareholders in the absence of a strategically aligned, value accretive investment opportunity.
Dividends paid to shareholders are typically in the range of 80-100 per cent of the consolidated entity's net profit after tax attributable to members of the Company, which is in line with the historical dividend range paid to shareholders. In certain circumstances, the Board may declare a dividend outside that range.
The impact on the consolidated profit after tax of a potential change in the returns of the funds in which the consolidated entity invested at year end is not material. The potential change has been determined using historical analysis and management’s assessment of an appropriate rate of return. The analysis is based on the assumption that the returns on asset classes have moved, with all other variables held constant and that the relevant change occurred as at the reporting date. However, actual movements in the risk may be greater or less than anticipated due to a number of factors, including unusually large market shocks resulting from changes in the performance of economies, markets and securities in which the funds invest. As a result, historic variations in risk variables are not a definitive indicator of future variations in the risk variables.
The incubation funds may be exposed to currency risk and interest rate risk. Their investment managers may enter into derivative contracts (such as forwards, swaps, options and futures) through approved counterparties to minimise risk. However, the use of these contracts must be consistent with the investment strategy and restrictions of each incubation fund, and agreed acceptable level of risk. These funds are also exposed to interest rate risk on cash holdings. Interest income from cash holdings is earned at variable interest rates and investments in cash holdings are at call.
A Capital Management Review is carried out on a semi-annual basis and is submitted to the Board for review and approval. The capital management policy ensures that the level of financial conservatism is appropriate for the Company's businesses including acting as custodian and manager of clients' assets and operation as a trustee company. This policy also aims to provide business stability and accommodate the growth needs of the consolidated entity. This policy comprises three parts:
The consolidated entity is further subject to market risks through the establishment of the Exact Market Cash Fund (EMCF). The fund was established with the purpose of providing an exact return utilising the UBS Bank Bill Index (the benchmark index) to investors. The impact of the EMCF on the consolidated entity’s financial results is dependent on the performance of the fund relative to the benchmark.
The risk management approach to and exposures arising from the EMCF are disclosed in Note 30.
121
For
per
sona
l use
onl
y

Notes to and forming part of the financial statements for the year ended 30 June 2012
Note 29 - Financial risk management (continued)
iv. Capital management (continued)
(c) Gearing Policy
v. Fair value
Consolidated
At 30 June 2012
Financial assetsAvailable-for-sale listed equity securitiesAvailable-for-sale unlisted unit trustsStructured products - EMCF assets1
Financial liabilitiesSwap contractsDerivative financial instruments - forward exchange contracts and index futuresDerivative financial instrumentsDeferred acquisition consideration
Consolidated
At 30 June 2011
Financial assetsAvailable-for-sale listed equity securitiesAvailable-for-sale unlisted unit trustsStructured products - EMCF assets1
Financial liabilitiesDerivative financial instruments - forward exchange contractsDerivative financial instrumentsDeferred acquisition consideration
1 The EMCF liability is not included as it is accounted for at amortised cost.
110 110 - -
607 - 607 -
- 2 - 2
- 768 599 1,367
33,946 657,372 - 691,318
- 599
656599
- -
656 -
33,9465,352
- -
- 5,352
33,946 -
The consolidated entity seeks to maintain a conservative financial management profile. Its gearing policy includes a maximum debt / debt and total equity ratio of 30 per cent and EBITDA interest cover of more than 10 times. Corporate debt (excluding product debt) has been maintained at $45 million throughout the year (2011: $45 million), and the consolidated entity is within its stated gearing policy at year end.
The gearing ratio for the consolidated entity as at 30 June 2012 is 13.8 per cent (2011: 11 per cent) and an EBITDA interest cover ratio of 48 times (2011: 40 times) was achieved.
Level 3 Total
The following tables present the consolidated entity's assets and liabilities measured and recognised at fair value, by valuation method, at 30 June 2012. The different levels have been defined as follows:
Level 1 Level 2
- Level 1: quoted prices in active markets for identical assets and liabilities - Level 2: inputs other than quoted prices included within Level 1 that are observable for the asset or liability, either directly or indirectly - Level 3: inputs for the asset or liability that are not based on observable market data.
$'000 $'000$'000 $'000
652,020 - - 652,020
Level 1 Level 2 Level 3 Total$'000 $'000 $'000 $'000
47,461 - - 47,461 - 5,882 - 5,882 - 866,996 - 866,996
47,461 872,878 - 920,339
- 6 - 6
- - 3,339 3,339 - 613 3,339 3,952
122
For
per
sona
l use
onl
y

Notes to and forming part of the financial statements for the year ended 30 June 2012
Note 29 - Financial risk management (continued)
v. Fair value (continued)
2012 2011$'000 $'000
Deferred acquisition considerationOpening balance 3,339 11,819Unused amounts reversed (1,777) -Accrual of interest 147 1,193
(1,110) (9,673)Closing balance 599 3,339
Carrying amount
Fair value
Carrying amount
Fair value
$'000 $'000 $'000 $'000Non-currentStructured products – loans receivable 84,943 82,352 130,253 124,702Structured products – interest bearing liabilities 88,370 86,536 134,109 125,714
Consolidated
Payments made during the year
2012 2011
The fair value of financial instruments traded in active markets (such as publicly traded derivatives, and trading and available-for-sale securities) is based on quoted market prices at the reporting date. The quoted market price used for financial assets held by the consolidated entity is the current bid price. Marketable shares included in other financial assets are traded in an organised financial market and their fair value is the current quoted market bid price for an asset. The carrying amounts of bank term deposits and receivables approximate fair value. The fair value of investments in unlisted shares in other corporations is determined by reference to the underlying net assets and an assessment of future maintainable earnings and cash flows of the respective corporations.
Derivative contracts classified as held for trading are fair valued by comparing the contracted rate to the current market rate for a contract with the same remaining period to maturity.
The fair value of financial instruments that are not traded in an active market (for example, over-the-counter derivatives) is determined using valuation techniques. The fair value of interest rate swaps is calculated as the present value of the estimated future cash flows. The fair value of forward exchange contracts is determined using forward exchange market rates at the reporting date. The estimates of fair value where valuation techniques are applied are subjective and involve the exercise of judgement. Changing one or more of the assumptions applied in valuation techniques to reasonably possible alternative assumptions may impact on the amounts disclosed.
The consolidated entity's financial assets and liabilities included as current and non-current in the balance sheet are carried at amounts in accordance with Notes 13, 14, 16, 21 and 30. The carrying amount of financial assets and financial liabilities, less any impairment, approximates their fair value, except for those outlined in the table below, which are stated at amortised cost.
123
For
per
sona
l use
onl
y

2012 2011$'000 $'000
Note 30. Structured products assets and liabilities
i. Exact Market Cash Funds
Current assetsExact Market Cash Fund 1 178,395 382,901Exact Market Cash Fund 2 516,226 516,245
694,621 899,146
Current liabilitiesExact Market Cash Fund 1 180,126 383,598Exact Market Cash Fund 2 515,073 512,750
695,199 896,348
Notes to and forming part of the financial statements for the year ended 30 June 2012
The Exact Market Cash Fund 1 (EMCF 1) was established during the financial year ended 30 June 2005 with the purpose of providing an exact return that matched the UBS Bank Bill rate (the benchmark index), or a variant thereon, to investors. The fund's ability to pay the benchmark return to the investors is guaranteed by the consolidated entity. The National Australia Bank has provided the EMCF 1 product with a guarantee to the value of $5 million in 2012 (2011: $20 million) to be called upon in the event that the consolidated entity is unable to meet its obligations. Due to the guaranteed benchmark return to investors, the consolidated entity is exposed to the risk that the return of the EMCF 1 differs from that of the benchmark. The return of the EMCF 1 is affected by risks to the underlying investments in the EMCF 1 portfolio, which are market, liquidity, and credit risks.
The EMCF 1 product has been assigned a ‘AAf’ fund credit quality rating by Standard & Poor’s and invests predominantly in Perpetual's Credit Enhanced Cash Fund (AA) and Cash Alpha Pool Fund of the consolidated entity. These funds cannot invest in securities which have a Standard & Poor’s credit rating below ‘BBB-'. They can invest in assets directly or indirectly by investing in other managed funds that have similar investment objectives and authorised investments. The underlying funds may invest in a variety of cash and debt securities, predominantly floating rate securities, cash deposits and fixed rate securities.
Consolidated
The Exact Market Cash Fund 2 (EMCF 2) was established in July 2008 and aims to provide an exact return that matches the benchmark index to investors in the fund. It has a similar structure to EMCF 1, but in addition, there are specific rules that govern the withdrawal of funds. EMCF 2 invests in debt securities issued by parties or securities with a minimum credit rating of 'BBB-' by Standard & Poor's or equivalent rating agency at the time of purchase. The investments held by EMCF 2 are recorded at fair value within the fund, and in the consolidated entity's financial statements. National Australia Bank has provided the fund with a guarantee to the value of $6 million (2011: $6 million) to be called upon in the event that Perpetual does not meet its obligations to the fund under the swap agreement.
In March 2009, the consolidated entity changed the swap agreement valuation methodology between the fund and the consolidated entity. The underlying investments are now valued on a hold to maturity basis for unit pricing purposes, which is consistent with the way in which Perpetual now manages the portfolio. The underlying assets were valued at their fair value at the date of change, which for many assets was at a discount to their maturity value. The discount to maturity value will be amortised over the remaining term of the assets. The change in valuation methodology will not affect the investment returns to investors in the EMCF 1.
The Exact Market Cash Funds current asset balances reflect the fair value of the net assets held by the funds. The current liabilities balances represent the consolidated entity's obligation to the funds investors under the swap agreements and reflect the net assets of the funds for unit pricing purposes. The difference between the current assets and current liabilities balance has been recorded in equity in the available for sale reserve.
124
For
per
sona
l use
onl
y

Note 30. Structured products assets and liabilities (continued)
i. Exact Market Cash Funds (continued)
Details of the assets held by the underlying funds are set out below:
AAA to A+ to BBB+ to TotalAA- A- BBB-
$'000 $'000 $'000 $'000
Corporate bonds 246,819 148 - 246,967 Mortgage and asset backed securities 203,479 68,129 16,949 288,557 Cash 159,349 - - 159,349
609,647 68,277 16,949 694,873
AAA to A+ to BBB+ to TotalAA- A- BBB-
$'000 $'000 $'000 $'000
Corporate bonds 240,382 80,756 43,039 364,177 Mortgage and asset backed securities 383,062 3,181 3,796 390,039 Cash 151,706 - - 151,706
775,150 83,937 46,835 905,922
The EMCF 2 product invests directly into a variety of cash and debt securities, predominantly floating rate securities, cash deposits and fixed rate securities with a minimum credit rating band of 'BBB-' by Standard & Poor's or equivalent rating agency at the time of purchase.
Notes to and forming part of the financial statements for the year ended 30 June 2012
30 June 2011
30 June 2012
The investment managers of the underlying funds invested by the EMCF enter into a variety of derivative financial instruments such as credit default swaps and foreign exchange forwards in the normal course of business in order to mitigate credit risk exposure, and to hedge fluctuations in foreign exchange rates.
Furthermore, the credit quality of financial assets is managed by the EMCF using Standard & Poor’s rating categories or equivalent, in accordance with the investment mandate of the EMCF. The EMCF’s exposure in each credit rating category is monitored on a daily basis. This review process allows assessment of potential losses as a result of risks and the undertaking of corrective actions. The investment managers have undertaken to restrict the asset portfolio of the underlying funds to securities, deposits or obligations that meet Standard & Poor’s 'AAf' fund credit quality rating criteria.
EMCF 1 and EMCF 2 (EMCF) use professional investment managers to manage the impact of these risks by using prudent investment guidelines and investment processes. The investment manager explicitly targets low volatility and aims to achieve this through a quality-screening process that is designed to assess the likelihood of default and difficult trading patterns during periods of rapid systematic risk reduction. There is a clearly defined mandate for the inclusion of sectors and issuances. In periods of risk reduction, diversification may be narrowly focused on cash and highly liquid investment-grade assets. At times of higher risk tolerance, appropriate diversification should be expected.
Liquidity risk of EMCF is managed by maintaining a level of cash or liquid investments in the portfolio which are sufficient to meet a level and pattern of investor redemptions (consistent with past experience), distributions or other of the fund's financial obligations. This is complemented by a dynamic portfolio management process that ensures liquidity is increased when there is an expectation of a deterioration in market conditions. Cash flow forecasts are prepared for the funds, including the consideration of the maturity profile of the securities, interest and other income earned by the funds, and projected investor flows based on historical trends and future expectations.
Interest rate exposure is limited to +/- 90 days versus the benchmark. The portfolio is constructed with the goal of having a diversified portfolio of securities, while largely retaining the low-risk characteristics of a cash investment.
125
For
per
sona
l use
onl
y

Note 30. Structured products assets and liabilities (continued)
i. Exact Market Cash Funds (continued)
1 per cent increase1 per cent decrease
ii. Perpetual Protected Investments
Structured products – loans receivable at reporting date consists of the following:
2012 2011$'000 $'000
CurrentStructured products – receivable from investors 24,222 20,806Non-currentStructured products – loans receivable from investors 88,122 133,314Less: loan establishment fees (115) (230)
88,007 133,084
Less: provision for credit losses (3,064) (2,831)84,943 130,253
Balance as at 1 July 2,831 2,635Provision utilised during the year (39) (189)Provision for credit losses recognised during the year 272 385Balance as at 30 June 3,064 2,831
In June 2012, a number of investors in the PPI product advised the Group that they intended to repay all or some of their loans. This gave rise to the reclassification to current assets and liabilities in relation to the PPI and corresponding bank funding facilities. Repayments received from investors will be applied to reduce the bank funding facilities used to finance these loans.
2011$'000 $'0006,949
(6,949)
Movements in the provision for credit losses are as follows :
The actual impact of a change in the fair value of the underlying assets of the EMCF on the consolidated profit before tax is dependent on the calculation of the swap agreement between the fund and the consolidated entity and the performance of the fund relative to the benchmark index. If the fund’s performance is below the benchmark return, then the consolidated entity will be obliged to make payments to the fund under the swap agreement. Conversely, if the fund’s performance is higher than the benchmark, then the fund will make payments to the consolidated entity.
Notes to and forming part of the financial statements for the year ended 30 June 2012
Consolidated
The Perpetual Protected Investments structured product (the PPI product) was established in the financial year ended 30 June 2007 for the purpose of providing investors the ability to select investments from a menu of managed funds while providing capital protection at maturity via a constant proportion portfolio insurance structure. The seven-year investment allows investors to borrow up to 100 per cent of their original invested amount (and their first year's interest if the interest is pre-paid), subject to a minimum loan of $50,000.
The table below demonstrates the impact of a 1 per cent change in the fair value of the underlying assets of the EMCF, due to market price movements, based on the values at reporting date.
2012
9,059(9,059)
A 1 per cent increase or decrease in the fair value of the underlying assets of the EMCF, assuming all other variables are held constant, would result in a $6,949,000 (2011: $9,059,000) increase or decrease in the consolidated entity’s current assets EMCF balance. However, any variance between the consolidated entity’s current assets EMCF balance and the consolidated entity’s current liabilities EMCF balance would be reflected in reserves, except in the case of a credit default which would impact the consolidated profit before tax.
126
For
per
sona
l use
onl
y

Note 30. Structured products assets and liabilities (continued)
ii. Perpetual Protected Investments (continued)
Fair Notional Fair Notional value amount value amount $'000 $'000 $'000 $'000
Less than 1 year 37 21,214 (102) 36,4551-4 years (724) 6,186 (539) 6,731
(687) 27,400 (641) 43,186
Notes to and forming part of the financial statements for the year ended 30 June 2012
The gain or loss from re-measuring interest rate swap contracts at fair value is deferred in other comprehensive income in the cash flow hedge reserve, to the extent that the hedge is effective, and re-classified into profit or loss when the hedged interest expense is recognised. The ineffective portion is recognised in profit or loss immediately.
The fair value of interest rate swap contracts outstanding as at reporting date and period of expiry are as follows:
2012
Interest rate swaps have been both terminated and entered into in accordance with the Group's product interest rate risk policy.
Investment and interest loans made to investors are funded by fixed and variable interest rate banking facilities. Total bank facilities available and utilised under these financial arrangements as at 30 June 2012 were $111.4 million (2011: $151.5 million).
The interest rates under the fixed interest banking facilities range from 3.37 per cent to 7.77 per cent (2011: 5.34 per cent to 7.77 per cent). There were $47.4 million (2011: $69.5 million) fixed interest banking facilities at 30 June 2012.
It is the consolidated entity's policy to hedge variable rate facilities from exposure to fluctuating interest rates in accordance with its financial risk management policies. Accordingly, the consolidated entity has entered into interest rate swap contracts in order to hedge exposure to fluctuations in interest rates under which it is obliged to receive interest at variable rates and to pay interest at fixed rates. Details of the consolidated entity's exposure to risks arising from Perpetual Protected Investments are set out in Note 29.
The contracts are settled on a net basis. For the 1 year interest rate swap, the fixed rate payment is paid either annually in advance or monthly in arrears, and the floating rate payment is received monthly in arrears; for the 7 years interest rate swap, the fixed rate leg is paid annually in advance, and the floating rate leg is received quarterly in arrears.
At year end interest rate swap contracts entered into cover approximately 96 per cent (2011: 96 per cent) of the variable interest rate banking facilities and are timed to expire as each loan falls due. The fixed interest rates of these swaps range from 2.91 per cent to 7.37 per cent (2011: 4.94 per cent to 7.37 per cent) and the banking facilities' variable interest rates range from 4.93 per cent to 5.52 per cent (2011: 6.24 per cent to 6.26 per cent).
As at 30 June 2012, an unrealised loss of $0.5 million (2011: loss of $0.4 million) was deferred in equity in the cash flow hedge reserve.
2011
127
For
per
sona
l use
onl
y

Notes to and forming part of the financial statements for the year ended 30 June 2012
2012 2011$'000 $'000
Note 31. Commitments
Capital expenditure commitments - 320
Operating lease commitmentsFuture operating lease rentals not provided for in the financial statements and payable:
Not later than 1 year 17,612 16,350Later than 1 year and not later than 5 years 68,101 61,674Later than 5 years 45,098 58,981
130,811 137,005Operating leases are predominantly related to premises.
Note 32. Contingencies
Contingent liabilities
1,784 984837 -
Note 33. Related parties
Controlled entities and associatesThe consolidated entity has a related party relationship with its Key Management Personnel (see Note 39).
Bank guarantees of a controlled entity in favour of the ASX Settlement and Transfer Corporation Pty Limited with respect to normal trading activities.
The Directors are of the opinion that the recognition of liabilities is not required in respect of the matters below, as it is not probable that future sacrifice of economic benefits will be required and the amount is not capable of reliable measurement.
Consolidated
Contracted but not provided for and payable within one year
1,000
Business transactions with related parties are on normal commercial terms and conditions no more favourable than those available to other parties unless otherwise stated.
1,000
In the ordinary course of business, contingent liabilities exist in respect of claims and potential claims against entities in the consolidated entity. The consolidated entity does not consider that the outcomes of any such claims known to exist at the date of this report, either individually or in aggregate, are likely to have a material effect on its operations or financial position.
- Rental bonds on leased premises- Master rental agreement
Bank guarantees of a controlled entity in favour of various lessors:
128
For
per
sona
l use
onl
y

Notes to and forming part of the financial statements for the year ended 30 June 2012
Name of Company 2012 2011 Country of % % incorporation
Note 34. Controlled entities
Perpetual Limited
Controlled Entities 1
Australian Trustees Limited 100 100 Australia Commonwealth Trustees Pty Limited2 100 100 Australia Financial Pursuit Pty Limited 100 100 Australia Fordham Business Advisors Pty Ltd 100 100 Australia Grosvenor Financial Services Pty Ltd 100 100 Australia Investor Marketplace Limited 100 100 Australia Perpetual Assets Pty Limited2 100 100 Australia Perpetual Australia Pty Limited 100 100 Australia Perpetual Investment Management Limited 100 100 Australia Perpetual Legal Services Pty Limited 100 100 Australia Perpetual Loan Company Limited 100 100 Australia Perpetual Loan Company No. 2 Limited 100 100 Australia Perpetual Mortgage Services Pty Limited 100 100 Australia Perpetual Nominees Limited 100 100 Australia Perpetual Services Pty Limited2 100 100 Australia Perpetual Trust Services Limited 100 100 Australia Perpetual Trustee Company (Canberra) Limited 100 100 Australia Perpetual Trustee Company Limited 100 100 Australia Perpetual Trustees Consolidated Limited 100 100 Australia Perpetual Trustees Queensland Limited 100 100 Australia Perpetual Trustees SA Limited 100 100 Australia Perpetual Trustees Victoria Limited 100 100 Australia Perpetual Trustees WA Limited 100 100 Australia PI Investment Management Limited 100 100 IrelandProperty and Mortgage Services Australia Pty Ltd* - - Australia Queensland Trustees Pty Limited 100 100 Australia smartsuper Pty Limited3 - 100 Australia
Perpetual Resource Fund 57 66 Australia Perpetual Asia Pool Fund 100 100 Australia Perpetual Equity Imputation Portfolio 100 100 Australia Perpetual Capital Accumulation Portfolio 100 100 Australia Global Equities UCITS Fund 100 100 IrelandPerpetual Pure Value 2 Fund 100 100 Australia Perpetual Wholesale Dynamic Fixed Income Fund 64 100 Australia Exact Market Cash Fund 1 100 100 Australia Exact Market Cash Fund 2 100 100 Australia
Entities under the control of Australian Trustees Limited Wilson Dilworth Partnership Pty Limited2 # - 100 Australia
Beneficial interest
129
For
per
sona
l use
onl
y

Name of Company 2012 2011 Country of % % incorporation
Note 34. Controlled entities (continued)
Entities under the control of Fordham Business Advisors Pty LimitedFordham Investment Management Pty Ltd 100 100 Australia Garnet Investment Management Pty Ltd 100 100 Australia Garnet Superannuation Pty Ltd 100 100 Australia Transcript Pty Ltd2 # - 100 Australia
Entities under the control of Grosvenor Financial Services Pty LimitedPerpetual Tax and Accounting Pty Ltd 100 100 Australia
Entities under the control of Perpetual Assets Pty Limited Perpetual Asset Management Limited 100 100 Australia
Entities under the control of Perpetual Asset Management Limited1
Perpetual Superannuation Ltd 100 100 Australia
Entities under the control of Perpetual Trustee Company Limited Perpetual Corporate Trust Limited 100 100 Australia Perpetual Custodians Limited 100 100 Australia Perpetual Service Network Pty Limited2 # - 100 Australia PT Limited 100 100 Australia
Entities under the control of Perpetual Trustees Consolidated LimitedPerpetual Nominees (Canberra) Limited # - 100 Australia Perpetual Custodian Nominees Pty Limited2 100 100 Australia
Entities under the control of Perpetual Trustees Victoria Limited Perpetual Executors Nominees Limited # - 100 Australia
Entities under the control of Perpetual Trustees WA Limited Terrace Guardians Limited # - 100 Australia
Entities under the control of PT Limited1
Perpetrust Nominees Pty Limited2 100 100 Australia
Entities under the control of Wilson Dilworth Partnership Pty Limited1 #
Wilson Dilworth Limited # - 100 Australia
3 smartsuper Pty Limited was sold 12/08/2011.
* Property and Mortgage Services Australia Pty Ltd was incorporated on 02/07/2012 and sold on 01/08/2012 as part of the sale of Perpetual Lenders Mortgage Services.
# Perpetual applied to Australian Securities and Investments Commission (ASIC) to voluntarily deregister these companies and their deregistration was confirmed by ASIC as follows: Perpetual Executors Nominees Limited (05/09/2011) Perpetual Nominees (Canberra) Limited (16/05/2012)Perpetual Service Network Pty Limited (01/09/2011)Terrace Guardians Limited (05/09/2011)Transcript Proprietary Limited (01/09/2011)Wilson Dilworth Limited (01/09/2011)Wilson Dilworth Partnership Pty Ltd (01/09/2011)
Notes to and forming part of the financial statements for the year ended 30 June 2012
1 Entities in bold are directly owned by Perpetual Limited with the exception of Perpetual Asset Management Limited and P.T. Limited which are owned by Perpetual subsidiaries.2 A small proprietary company as defined by the Corporations Act 2001 and is not required to be audited for statutory purposes.
Beneficial interest
130
For
per
sona
l use
onl
y

Notes to and forming part of the financial statements for the year ended 30 June 2012
2012 2011$'000 $'000
Note 35. Parent entity disclosures
Result of the parent entityProfit for the period 16,599 72,398Other comprehensive income/(expense) 5,641 (619)Total comprehensive income for the period 22,240 71,779
Financial position of the parent entity at year endCurrent assets 101,724 177,498Total assets 420,998 534,760
Current liabilities 93,389 106,432Total liabilities 118,655 133,255
Total equity of the parent entity comprising:Share capital 254,493 274,980Reserves 37,699 37,029Retained earnings 10,151 89,496Total Equity 302,343 401,505
Parent entity contingencies
Uncalled capital of the controlled entities. 7,100 7,100
Operating lease commitmentsFuture operating lease rentals not provided for in the financial statements and payable:
Not later than 1 year 11,672 10,661Later than 1 year and not later than 5 years 49,247 44,656Later than 5 years 43,086 53,946
104,005 109,263Operating leases are predominantly related to premises.
Company
As at, and throughout, the financial year ending 30 June 2012 the parent entity of the consolidated entity was Perpetual Limited.
In the ordinary course of business, contingent liabilities exist in respect of claims and potential claims against the parent entity. The parent entity does not consider that the outcome of any such claims known to exist at the date of this report, either individually or in aggregate, are likely to have a material effect on its operations or financial position.
The Directors are of the opinion that provisions are not required in respect of these matters, as it is not probable that a future sacrifice of economic benefits will be required or the amount is not capable of reliable measurement.
131
For
per
sona
l use
onl
y

Notes to and forming part of the financial statements for the year ended 30 June 2012
Note 35. Parent entity disclosures (continued)
Parent entity guarantees
Note 36. Business combinations
Contingent consideration
Total cash consideration of $1.1 million (2011: $9.7m) was paid to the selling stakeholders for the year ended 30 June 2012 in respect of pre-determined targets being reached. The earnout periods have passed, and unused provisions of $1.7 million (2011: $nil) have been released. The unwinding of discount, relating to business combinations in previous periods, was $147,000 (2011: $1.2 million) for the year ended 30 June 2012.
Contingent consideration relating to business combinations acquired in preceding periods have historically been recognised as liabilities at their discounted fair value, reducing each year with payments being made to the sellingstakeholders on the basis of pre-determined targets being achieved. At 30 June 2012, the earn-out periods for Financial Pursuit Pty Limited and Grosvenor Financial Services Pty Ltd have ceased, therefore there is $nil contingent consideration for the year ended 30 June 2012. Amounts which remain payable to the selling stakeholders at this date have been classed as acquisition consideration within current liabilities in payables, as there is no longer a contingent requirement to be met.
- No liability was recognised by the Company in relation to these guarantees as the fair value of these guarantees is considered to be immaterial. The Company does not expect the financial guarantees to be called upon.
The Company's policy is to provide financial guarantees only to wholly-owned subsidiaries and it has provided financial guarantees in respect of: - Guarantee to secure a $70,000,000 bank facility ($45,000,000 is utilised) of a controlled entity amounting to $70,000,000 (2011: $70,000,000). - Guarantees to secure lending associated with structured products amounting to $6,201,000 (2011: $8,991,000).
132
For
per
sona
l use
onl
y

Notes to and forming part of the financial statements for the year ended 30 June 2012
2012 2011$'000 $'000
Note 37. Notes to the Cash Flow Statement
Cash flows from operating activities
Profit for the year 26,679 62,031
Add/(less) items classified as investing/financing activities:Profit on sale of investments (359) (6,161)Reinvestment of dividends and unit distributions (399) (153)Deferred acquisition consideration 1,110 9,673Repayment of Palisade loan - 7,165Tax paid on the sale of investments - 722Add/(less) non-cash items:Loss on sale of property, plant and equipment 2 795Depreciation and amortisation expense 14,828 15,649Equity remuneration expense 12,218 18,586Impairment of software intangibles 14,498 -Impairment of fixed assets 3,356Transfer to foreign currency translation reserve (744) (1,288)Transfer to available-for-sale reserve 4,581 (1,261)Loss after tax attributable to non-controlling interests 3,636 337Impairment of available-for-sale securities 8,412 1,534Net cash provided by operating activities before change in assets and liabilities 87,818 107,629Change in assets and liabilities during the financial year:Decrease in receivables 14,485 17,769Increase in net structured products assets (2,104) (3,218)Decrease in derivative assets - 11Increase/(decrease) in derivative liabilities 155 (49)Decrease in payables (9,059) (6,525)(Increase)/decrease in prepayments (2,033) 1,166Increase/(decrease) in employee benefits (146) 5,219Decrease in provisions (1,800) (5,503)Decrease in net current tax liabilities (16,750) (1,268)Decrease/(increase) in deferred tax assets 3,593 (1,194)Increase in deferred tax liabilities 938 335Increase in assets held for sale (13,279) (754)Increase in liabilities held for sale 4,708 904Increase in cash flow hedge reserve (79) (38)
Net cash provided by operating activities 66,447 114,484
Consolidated
133
For
per
sona
l use
onl
y

Notes to and forming part of the financial statements for the year ended 30 June 2012
Note 38. Subsequent events
i. Sale of Perpetual Lenders Mortgage Services (PLMS)
ii. IT Outsourcing
The following events have occurred since the end of financial year:
Perpetual's announcement to the market on 25 June 2012 included an update on the Company's plan to outsource IT as part of the 'Transformation 2015' strategy. On 29 August 2012, Perpetual entered into an IT Outsourcing arrangement with an external service provider. The arrangement is for a base period of 5 years and the total contract value for Infrastructure and Application services is $68 million over that period. Refer to Note 15(a) Assets and liabilities held for sale for further details.
Other than the events noted above, the Directors are not aware of any other event or circumstance since the end of the financial year not otherwise dealt with in this report that has or may significantly affect the operations of the consolidated entity, the results of those operations or the state of affairs of the consolidated entity in subsequent financial years.
On 1 August 2012 Perpetual completed the sale of its mortgage processing business Perpetual Lenders Mortgage Services ('PLMS') to FAF International Property Services (Australia) Pty Limited, an affiliate of First Mortgage Services ('FMS'). The PLMS business is classified as a discontinued operation, refer to Note 7 of the financial statements.
134
For
per
sona
l use
onl
y

Notes to and forming part of the financial statements for the year ended 30 June 2012
Note 39. Remuneration details provided as part of the financial report
The following disclosures required under AASB 124 are required to be included in the Financial Report:
Para 16 'Total Compensation of Key Management Personnel'Para 25.7.3 'Options and Rights holdings'Para 25.7.4 'Equity Holdings and Transactions'Para 25.9 'Disclosure of Other Transactions'.
Total compensation of key management personnel
Short-TermPost-EmploymentTermination benefits 1,308,470Share-BasedTotal
Related party disclosures
Option holdings of Executive Director and Group Executives
Name Grant date Exercise period Exercise price
Held at 1 July 2010
Granted Forfeited Exercised Held at 30 June 2011
Vested & exercisable at 30 June 2011
Fair value peroption at
grant date1
Proceeds received on
exercise
$ No. of options
No. of options No. of options $ $
Former Managing Director
D Deverall 2 Options granted prior to 1 July 2008 3 267,364 - 267,364 - - - 1 Jul 08 1 Jul 11 - 1 Jul 14 42.73 57,390 - 57,390 - - - 8.97 -
29 Jun 09 1 Jul 12 - 29 Jun 15 28.34 47,585 - 47,585 - - - 9.58 - 3 Jul 09 1 Jul 12 - 29 Jun 15 28.34 5,911 - 5,911 - - - 9.58 -
01-Jul-10 1 Jul 13 - 29 Jun 16 28.74 - 76,606 76,606 5.47 Aggregate Value $419,035 $27,087,496 - -
1 Equity instruments issued have been valued by PricewaterhouseCoopers (PwC) using a Binomial Option Pricing model at grant date.
There are no options outstanding at 30 June 2012 (2011: nil).
1,966,312
Movement during the year
Executives have not entered into material contracts with the Company or a member of the consolidated entity since the end of the previous financial year and there were no material contracts involving KMP's interests existing at year end.
11,197,9822,084,349
235,8946,911,427
2012$
Consolidated2011
$8,119,849
1,552,70111,243,121
262,101
No. of options
Options granted to the former Managing Director were granted from the Executive Option Plan. No other key management personal hold options over Perpetual shares.
2 Approval for the issue of options to D Deverall was obtained under ASX Listing Rule 10.14 at Perpetual's AGMs held on 19 October 2004, 17 October 2006, 30 October 2007, 28 October 2008 and 22 October 2009.
4 Percentage of total remuneration received as options for the Managing Director and Group Executives was: D Deverall (0%)
3 These options were granted on 19 October 2004 (978; 100% forfeited in the current year), 1 July 2006 (29,950; 100% forfeited in the current year) and 1 July 2007 (236,436; 100% forfeited in the current year). There are no options outstanding as at 30 June 2011.
135
For
per
sona
l use
onl
y

Notes to and forming part of the financial statements for the year ended 30 June 2012
Note 39. Remuneration details provided as part of the financial report (continued)
Unvested share holdings of Executive Director, group and other executives
Name Grant date Issue price Vesting date Held at 1 July 2011
Granted Forfeited Vested Held at 30 June 2012
Fair value per share ($) TSR
Hurdle
Fair value per share ($) non-
TSR hurdleNo of shares No of shares
Executive Director
G Lloyd 10 August 2010 31.33 10 August 2011 12,767 - - 12,767 - N/A 31.331 October 2010 30.80 1 October 2013 21,915 - - - 21,915 20.59 30.801 October 2011 21.05 1 October 2014 - 32,066 - - 32,066 14.60 21.05
Aggregate Value1 $674,989 - $277,172
Former Executive Director
C Ryan2 1 April 2011 29.38 1 April 2013 - 20,422 - - 20,422 18.80 29.381 October 2011 21.05 1 October 2014 - 58,194 - - 58,194 14.60 21.05
Aggregate Value $1,824,982 - -
Group Executives
R Brandweiner 1 October 2008 48.63 1 October 20114 4,112 - - - 4,112 38.97 50.801 October 2009 38.15 1 October 2012 7,208 - - - 7,208 29.02 37.931 October 2010 30.80 1 October 2013 11,931 - - - 11,931 20.59 30.801 October 2011 21.05 1 October 2014 - 19,002 - - 19,002 14.60 21.05
Aggregate Value $399,992 - -
R Burrows 31 March 2008 52.71 31 March 20114 11,383 - 11,383 - - 57.22 52.711 October 2008 48.63 1 October 20114 12,338 - - - 12,338 38.97 50.801 October 2009 38.15 1 October 2012 15,727 - - - 15,727 29.02 37.931 October 2010 30.80 1 October 2013 19,480 - - - 19,480 20.59 30.801 October 2011 21.05 1 October 2014 - 28,503 - - 28,503 14.60 21.05
Aggregate value $599,988 $232,555 - .
C Doyle 20 February 2008 52.28 1 January 20114 9,563 - 9,563 - - N/A 52.281 October 2008 48.63 1 October 20114 7,197 - - - 7,197 38.97 50.801 October 2009 38.15 1 October 2012 9,174 - - - 9,174 29.02 37.931 October 2010 30.80 1 October 2013 22,727 - - - 22,727 20.59 30.801 October 2011 21.05 1 October 2014 - 33,254 - - 33,254 14.60 21.05
Aggregate Value $699,997 $195,370 -
C Green 1 October 2008 48.63 1 October 20114 4,112 - - - 4,112 38.97 50.801 October 2009 38.15 1 October 2012 6,553 - - - 6,553 29.02 37.931 October 2010 30.80 1 October 2013 10,551 - - 10,551 20.59 30.801 October 2011 21.05 1 October 2014 - 15,439 - - 15,439 14.60 21.05
Aggregate Value $324,991 - -
B Henderson 1 October 2011 21.05 1 October 2014 - 8,076 - - 8,076 14.60 21.05Aggregate Value $170,000 - -
I Holyman 1 October 2007 73.54 1 October 2010 6,119 - 6,119 - - 57.22 80.081 October 2008 48.63 1 October 20114 9,253 - - - 9,253 38.97 50.801 October 2009 38.15 1 October 2012 11,795 - - - 11,795 29.02 37.931 October 2010 30.80 1 October 2013 14,610 - - - 14,610 20.59 30.801 October 2011 21.05 1 October 2014 - 21,377 - - 21,377 14.60 21.05
Aggregate Value $449,986 $122,992 -
R Vahtrick 1 October 2011 21.05 1 October 2014 - 9,501 - - 9,501 14.60 21.05Aggregate Value $199,966 - -
Current Executives who were in Acting Group Executive roles during the year
N Langton3 4 January 2011 31.43 4 January 2014 5,727 - - - 5,727 N/A 31.431 April 2011 29.33 15 November 2011 4,773 - - 4,773 - N/A 29.33
1 October 2011 21.05 1 October 2014 - 7,125 - - 7,125 14.60 21.05Aggregate Value $149,981 - $99,660
P Chasemore 1 October 2008 48.63 1 October 2011 416 - 416 - - 38.97 50.801 October 2009 38.15 1 October 2012 1,048 - - - 1,048 29.02 37.931 October 2010 30.80 1 October 2013 2,110 - - - 2,110 20.59 30.801 October 2011 21.05 1 October 2014 - 3,325 - - 3,325 14.60 21.05
Aggregate Value $69,991 $8,362 -
Departed Executives
J Stewart 1 October 2008 48.63 1 October 2011 3,084 - 3,084 - - 38.97 50.801 October 2009 38.15 1 October 2012 3,931 - 3,931 - - 29.02 37.931 October 2010 30.80 1 October 2013 8,668 - 8,668 - - 20.59 30.801 October 2011 21.05 1 October 2014 - 6,342 6,342 - - 14.60 21.05Aggregate Value $133,499 $492,920 -
2 Approval for the issue of shares to Chris Ryan was obtained under ASX Listing Rule 10.14 at Perpetual's AGM held in November 2011.
4 Initial vesting date. KMP LTI Grants prior to 2010 were re-tested at the 4th year if they failed to vest at the 3 year test.
Movement during the year
No of shares
3 4,773 shares vested in November 2011 prior to N Langton becoming Acting Group Executive and are therefore not included in the Actual Remuneration Table.
1 Granted aggregate value is calculated through multiplying the number of shares by the issue price. Vested and forfeited aggregate value is calculated through multiplying the number of shares by the Perpetual closing share price on the vesting date or next business day if the vesting date falls on a weekend or a public holiday.
136
For
per
sona
l use
onl
y

Notes to and forming part of the financial statements for the year ended 30 June 2012
Note 39. Remuneration details provided as part of the financial report (continued)
Unvested share holdings of Executive Director, group and other executives
Name Grant date Issue price Vesting date Held at 1 July 2010
Granted Forfeited Vested Held at 30 June 2011 Fair value per share ($) TSR
Hurdle
Fair value per share ($) non-
TSR hurdleNo of shares No of shares
Executive Director
C Ryan - - - - - - - - - -Aggregate Value - - -
Former Executive DirectorD Deverall 1 Shares granted prior to 1 July 2008 2 51,496 - 51,496 - -
1 July 2008 42.73 1 July 2011 11,993 - 11,993 - - 38.97 50.8029 June 2009 28.34 1 July 2012 18,083 - 18,083 - - 21.30 28.011 July 2010 28.74 1 July 2013 - 17,832 17,832 - - 18.97 27.65
Aggregate Value $512,492 $5,562,385 -
Group Executives
R Brandweiner Shares granted prior to 1 July 2008 3 1,359 - 1,359 - - 1 October 2008 48.63 1 October 2011 4,112 - - - 4,112 38.97 50.801 October 2009 38.15 1 October 2012 7,208 - - - 7,208 29.02 37.931 October 2010 30.80 1 October 2013 - 11,931 - - 11,931 20.59 30.80
Aggregate Value $367,475 $99,941 -
R Burrows Shares granted prior to 1 July 2008 4 11,383 - - - 11,383 1 October 2008 48.63 1 October 2011 12,338 - - - 12,338 38.97 50.801 October 2009 38.15 1 October 2012 15,727 - - - 15,727 29.02 37.931 October 2010 30.80 1 October 2013 - 19,480 - - 19,480 20.59 30.80
Aggregate value $599,984 - -
C Doyle Shares granted prior to 1 July 2008 5 25,531 - 8,030 7,938 9,563 1 October 2008 48.63 1 October 2011 7,197 - - - 7,197 38.97 50.801 October 2009 38.15 1 October 2012 9,174 - - - 9,174 29.02 37.931 October 2010 30.80 1 October 2013 - 22,727 - - 22,727 20.59 30.80
Aggregate Value $699,992 $554,938 $415,005
C Green Shares granted prior to 1 July 2008 6 2,291 - 2,291 - - 1 October 2008 48.63 1 October 2011 4,112 - - - 4,112 38.97 50.801 October 2009 38.15 1 October 2012 6,553 - - - 6,553 29.02 37.931 October 2010 30.80 1 October 2013 - 10,551 - - 10,551 20.59 30.80
Aggregate Value $324,971 $168,480 -
B Henderson - - - - - - - - - -Aggregate Value - - -
I Holyman Shares granted prior to 1 July 2008 7 11,992 - 5,873 - 6,119 1 October 2008 48.63 1 October 2011 9,253 - - - 9,253 38.97 50.801 October 2009 38.15 1 October 2012 11,795 - - - 11,795 29.02 37.931 October 2010 30.80 1 October 2013 - 14,610 - - 14,610 20.59 30.80
Aggregate Value $449,988 $424,970 -
G Lloyd Shares granted prior to 1 July 2008 - - - - - - - 10 August 2010 31.33 10 August 2011 - 12,767 - - 12,767 N/A 27.651 October 2010 30.80 1 October 2013 - 21,915 - - 21,915 20.59 30.80
Aggregate Value $1,074,972
J Stewart Shares granted prior to 1 July 2008 8 584 - 584 - - - 1 October 2008 48.63 1 October 2011 3,084 - - - 3,084 38.97 50.801 October 2009 38.15 1 October 2012 3,931 - - - 3,931 29.02 37.931 October 2010 30.80 1 October 2013 - 8,668 - - 8,668 20.59 30.80
Aggregate Value $266,974 $43,940 -
R Vahtrick - - - - - - - - - -Aggregate Value - - -
Current Executives who were in Acting Group Executive roles during the year
P Ryan Shares granted prior to 1 July 2008 9 1,495 - 1,495 - - 1 October 2008 48.63 1 October 2011 2,287 - - - 2,287 38.97 50.801 October 2009 38.15 1 October 2012 3,538 - - - 3,538 29.02 37.931 October 2010 30.80 1 October 2013 - 4,870 - - 4,870 20.59 30.80
Aggregate Value $149,996 $109,942 -
S Singh Shares granted prior to 1 July 2008 10 1,365 - 1,365 - - 1 October 2008 48.63 1 October 2011 2,261 - - - 2,261 38.97 50.801 October 2009 38.15 1 October 2012 3,538 - - - 3,538 29.02 37.931 October 2010 30.80 1 October 2013 - 4,870 - - 4,870 20.59 30.80
Aggregate Value $149,996 $100,232 - Departed Executives
M Miller Shares granted prior to 1 July 2008 11 1,631 - 1,631 - - 1 October 2008 48.63 1 October 2011 2,467 - 2,467 - - 38.97 50.801 October 2009 38.15 1 October 2012 8,519 - 8,519 - - 29.02 37.931 October 2010 30.80 1 October 2013 - 10,551 10,551 - - 20.59 30.80
Aggregate Value $324,971 $889,885 -
M Pancino Shares granted prior to 1 July 2008 12 2,294 - 2,294 - - 1 October 2008 48.63 1 October 2011 5,140 - 5,140 - - 38.97 50.801 October 2009 38.15 1 October 2012 6,553 - 6,553 - - 29.02 37.93
Aggregate Value - $667,656 -
R MacIntyre Shares granted prior to 1 July 2008 13 7,241 - 2,283 4,958 - 1 October 2008 48.63 1 October 2011 1,028 - 1,028 - - 38.97 50.801 October 2009 38.15 1 October 2012 2,096 - 2,096 - - 29.02 37.93
Aggregate Value - $292,718 $337,094
1 Approval for the issue of shares to David Deverall was obtained under ASX Listing Rule 10.14 at Perpetual's AGM held on 19 October 2004, 17 October 2006, 30 October 2007, 28 October 2008 and October 2009.
Movement during the year
No of shares
2 These shares were granted on 1 July 2006 (7,130; 100% forfeited in the current year) and 1 July 2007 (44,366; 100% forfeited in the current year).3 These shares were granted on 1 October 2007 (1,359; 100% forfeited in the current year).4 These shares were granted on 31 March 2008 (11,383).5 These shares were granted on 4 December 2006 (1,645; 100% forfeited in the current year), 1 October 2007 (4,759; 100% forfeited in the current year) and 20 February 2008 (19,127; 9% forfeited in the current year and 41% vested in the current year).6 These shares were granted on 1 October 2007 (2,291; 100% forfeited in the current year).7 These shares were granted on 2 October 2006 (5,873; 100% forfeited in the current year) and 1 October 2007 (6,119). 8 These shares were granted on 10 September 2007 (584; 100% forfeited in the current year).9 These shares were granted on 1 October 2007 (1,495; 100% forfeited in the current year).10 These shares were granted on 3 July 2006 (139; 100% forfeited in the current year) and 1 October 2007 (1,226; 100% forfeited in the current year).11 These shares were granted on 1 October 2007 (1,631; 100% forfeited in the current year).
Grants of performance shares after 30 June 2003 contain 50% of the shares with a performance hurdle linked to TSR and 50% of the shares granted with a performance hurdle linked to EPS. Where applicable, the fair value of shares with a TSR performance hurdle are disclosed. The fair value of TSR-linked shares is calculated by PwC using valuation techniques which take into account the probability of vesting as reflected in the fair value at grant.
12 These shares were granted on 14 August 2006 (255; 100% forfeited in the current year) and 1 October 2007 (2,039; 100% forfeited in the current year).13 These shares were granted on 1 October 2007 (1,359; 100% forfeited in the current year), 3 December 2007 (2,941: 4% forfeited in the current year and 96% vested in the current year), 3 December 2007 (2,941: 28% forfeited in the current year and 72% vested in the current year).
137
For
per
sona
l use
onl
y

Notes to and forming part of the financial statements for the year ended 30 June 2012
Note 39. Remuneration details provided as part of the financial report (continued)
Vested shareholdings of Managing Director, group and other executives
Name
Managing DirectorG Lloyd - 12,767 - 12,767
Former Managing DirectorC Ryan - - - -
Group ExecutivesR Brandweiner 402 - - 402 R Burrows - - - - C Doyle 825 - - 825 C Green 4,796 - - 4,796 B Henderson - - - - I Holyman 2,736 - - 2,736 R Vahtrick - - - - N Langton - 4,773 - 4,773 P Chasemore - - - -
Departed Group ExecutivesJ Stewart - - - - * Or date of departure for Group Executives that departed in the year.
Name
Managing DirectorC Ryan - - - -
Former Managing DirectorD Deverall 35,540 - - 35,540
Group ExecutivesR Brandweiner 402 - - 402 R Burrows - - - - C Doyle - 7,938 (7,113) 825 C Green 4,796 - - 4,796 B Henderson - - - - I Holyman 2,736 - - 2,736 G Lloyd - - - - J Stewart - - - - R Vahtrick - - - - P Ryan - - - - S Singh - - - -
Departed Group ExecutivesM Miller 234 - (234) - M Pancino - - - - R MacIntyre 16,893 4,958 (440) 21,411
Balance at 1 July 2011
LTI Shares vesting in the period
Other changes during the year
Balance at 30 June 2012 *
No of shares No of shares
Other changes during the year represent shares acquired via bonus sacrifice, conversion of options into shares and disposal of shares. There were no disposals during the year.
No of shares
Balance at 1 July 2010
LTI Shares vesting in the period
Other changes during the year
Balance at 30 June 2011 *
No of shares No of shares No of shares
138
For
per
sona
l use
onl
y

Notes to and forming part of the financial statements for the year ended 30 June 2012
Note 39. Remuneration details provided as part of the financial report (continued)
Remuneration of Non-Executive Directors
Directors’ individual shareholdings
Balance at the start of the year, or for directors
appointed in the year, the
date of appointment
Shares acquired via
salary sacrifice
during the year
Other changes
during the year
Balance at the end of
the year, or for directors who retired in the year, the date of retirement
P V Brasher 1,000 - - 1,000 P Bullock 1,000 - 1,000 2,000
6,156 - 380 6,536 9,203 - 391 9,594 4,401 - 149 4,550 2,291 - 140 2,431 8,107 - - 8,107
Prior year Directors’ individual shareholdings
Balance at the start of the year, or for directors
appointed in the year, the
date of appointment
Shares acquired via
salary sacrifice
during the year
Other changes
during the year
Balance at the end of
the year, or for directors who retired in the year, the date of retirement
9,609 - 178 9,787 P V Brasher 1,000 - - 1,000
5,753 - 403 6,156 P Bullock 1,000 - - 1,000
8,768 - 435 9,203 3,245 - 1,156 4,401 2,140 - 151 2,291 8,107 - - 8,107
E Proust P B Scott
E P McClintock
Directors
M J Brooks
E Proust
Directors
P J Twyman
R M Savage
M J Brooks
E P McClintock
P B Scott P J Twyman
139
For
per
sona
l use
onl
y

Directors' declaration
1 In the opinion of the directors of Perpetual Limited (the "Company"):
a.
(i)
(ii)
b.
c.
2
Signed in accordance with a resolution of the directors:
Dated at Sydney this 30th day of August 2012.
Peter B Scott Geoff LloydDirector Director
The directors have been given the declarations required by Section 295A of the Corporations Act 2001 from the Chief Executive Officer and the Chief Financial Officer for the financial year ended 30 June 2012.
the consolidated financial statements and notes, and the Remuneration report in the Directors' report, set out on pages 24 to 62, are in accordance with the Corporations Act 2001, including:
the financial report also complies with International Financial Reporting Standards as disclosed in Note 2(i);
there are reasonable grounds to believe that the consolidated entity will be able to pay its debts as and when they become due and payable.
giving a true and fair view of the Consolidated Entity's financial position as at 30 June 2012 and of its performance for the financial year ended on that date; and
complying with Australian Accounting Standards (including the Australian Accounting Interpretations) and the Corporations Regulations 2001;
140
For
per
sona
l use
onl
y

ABCD
KPMG, an Australian partnership and a member firm of the KPMG network of independent member firms affiliated with KPMG International Cooperative (“KPMG International”), a Swiss entity.
Liability limited by a scheme approved under Professional Standards Legislation.
Independent auditor’s report to the members of Perpetual Limited
Report on the financial report
We have audited the accompanying financial report of Perpetual Limited (the Company), which comprises the Balance Sheet as at 30 June 2012, and Consolidated Statements of Comprehensive Income, Statements of Changes in Equity and Cash Flow Statements for the year ended on that date, notes 1 to 39 comprising a summary of significant accounting policies and other explanatory information and the directors’ declaration of the Company and the Group comprising the Company and the entities it controlled at the year’s end or from time to time during the financial year.
Directors’ responsibility for the financial report
The directors of the Company are responsible for the preparation of the financial report that gives a true and fair view in accordance with Australian Accounting Standards and the Corporations Act 2001 and for such internal control as the directors determine is necessary to enable the preparation of the financial report that is free from material misstatement whether due to fraud or error.
Auditor’s responsibility
Our responsibility is to express an opinion on the financial report based on our audit. We conducted our audit in accordance with Australian Auditing Standards. These Auditing Standards require that we comply with relevant ethical requirements relating to audit engagements and plan and perform the audit to obtain reasonable assurance whether the financial report is free from material misstatement.
An audit involves performing procedures to obtain audit evidence about the amounts and disclosures in the financial report. The procedures selected depend on the auditor’s judgement, including the assessment of the risks of material misstatement of the financial report, whether due to fraud or error. In making those risk assessments, the auditor considers internal control relevant to the entity’s preparation of the financial report that gives a true and fair view in order to design audit procedures that are appropriate in the circumstances, but not for the purpose of expressing an opinion on the effectiveness of the entity’s internal control. An audit also includes evaluating the appropriateness of accounting policies used and the reasonableness of accounting estimates made by the directors, as well as evaluating the overall presentation of the financial report.
We performed the procedures to assess whether in all material respects the financial report presents fairly, in accordance with the Corporations Act 2001 and Australian Accounting Standards, a true and fair view which is consistent with our understanding of the Company’s and the Group’s financial position and of their performance.
We believe that the audit evidence we have obtained is sufficient and appropriate to provide a basis for our audit opinion.
Independence
In conducting our audit, we have complied with the independence requirements of the Corporations Act 2001.
141
For
per
sona
l use
onl
y

ABCD
Auditor’s opinion
In our opinion:
(a) the financial report of Perpetual Limited is in accordance with the Corporations Act 2001, including:
(i) giving a true and fair view of the Company’s and the Group’s financial position as at 30 June 2012 and of their performance for the year ended on that date; and
(ii) complying with Australian Accounting Standards and the Corporations Regulations 2001.
(b) the financial report also complies with International Financial Reporting Standards as disclosed in note 2(i).
Report on the Remuneration Report
We have audited the Remuneration Report included in paragraphs pages 24 to 62 of the directors’ report for the year ended 30 June 2012. The directors of the Company are responsible for the preparation and presentation of the remuneration report in accordance with Section 300A of the Corporations Act 2001. Our responsibility is to express an opinion on the remuneration report, based on our audit conducted in accordance with auditing standards.
Auditor’s opinion on the Section 300A disclosures in the directors' Remuneration Report
In our opinion, the remuneration report of Perpetual Limited for the year ended 30 June 2012, complies with Section 300A of the Corporations Act 2001.
Auditor’s opinion on the additional remuneration disclosures in the Remuneration Report
In our opinion, the additional remuneration disclosure set out in the Actual Remuneration Received table in section 1.4 of the Remuneration Report of Perpetual Limited for the year ended 30 June 2012 is presented, in all material respects, in accordance with the basis of preparation set out in the footnotes to the Table.
KPMG
Andrew Yates Partner
Sydney
30 August 2012 142
For
per
sona
l use
onl
y

Securities exchange and investor information
2012 Annual General Meeting
Securities exchange listing
Substantial shareholders
Distribution schedule of holdingsas at 2 August 2012
Number of holders
Number of shares
1 – 1,000 shares 18,305 6,891,000 1,001 – 5,000 shares 4,399 9,223,738 5,001 – 10,000 shares 403 2,884,360 10,001 – 100,000 shares 271 5,743,286 100,001 and over shares 33 17,238,294 Total 23,411 41,980,678
Number of shareholders with less than a marketable parcel: 574
Twenty Largest Shareholders as at 2 August 2012
Number of Percentage ofName ordinary shares issued capitalQueensland Trustees Pty Limited¹ 2,305,772 5.49%HSBC Custody Nominees (Australia) Limited¹ 2,162,876 5.15%National Nominees Limited1 1,851,231 4.41%JP Morgan Nominees Australia Limited1 1,789,450 4.26%Queensland Trustees Pty Limited ( LTI Shares)¹ 1,136,155 2.71%J P Morgan Nominees Australia Limited (Cash Income Account)¹ 924,790 2.20%Citicorp Nominees Pty Limited1 862,584 2.05%Milton Corporation Limited 818,126 1.95%Australian Foundation Investment Company Limited 635,802 1.51%Washington H Soul Pattinson & Co Ltd 529,598 1.26%Perpetual Trustee Company Limited¹ 450,889 1.07%Cogent Nominees Pty Limited1 378,636 0.90%RBC CEES Trustee Limited 376,567 0.90%Woodross Nominees Pty Ltd1 371,935 0.89%Bond Street Custodians Limited¹ 345,583 0.82%Enbeear Pty Ltd 310,678 0.74%UBS Wealth Management Australia 276,104 0.66%Carlton Hotel Ltd 262,332 0.62%Argo Investments Limited 238,905 0.57%T Eustace 200,331 0.48%Total 16,228,344 38.64%1 Held in capacity as executor, trustee or agent.
The 2012 Annual General Meeting of the Company will be held in the Heritage Ballroom, Level 6, The Westin Sydney, 1 Martin Place, Sydney on 1 November 2012 commencing at 10:00 am.
The ordinary shares of Perpetual Limited are listed on the Australian Securities Exchange under the ASX code PPT, with Sydney being the home exchange. Details of trading activity are published in most daily newspapers.
Queensland Trustees Pty Limited is a substantial shareholder of Perpetual Limited as at 2 August 2012.
143
For
per
sona
l use
onl
y

Securities exchange and investor information (continued)
Other Information
Perpetual Limited, incorporated and domiciled in Australia, is a publicly listed company limited by shares.
Voting rights
on a show of hands to one vote; and
If a member is present in person, any proxy of that member is not entitled to vote.
Voting by proxy
On-market buy back
There is no current on-market buy back.
Final dividend
Enquiries
Link Market Services Limited Perpetual Shareholder Information Line:1A Homebush Bay Drive 1300 732 806 or (02) 8280 7620Rhodes, NSW 2138 Fax: (02) 9287 0303
Locked Bag A14Sydney South NSW 1235
Principal registered office
Level 12 Tel: (02) 9229 9000123 Pitt Street Fax: (02) 8256 1461Sydney NSW 2000
Company Secretary Joanne Hawkins
Website address: www.perpetual.com.au
If you have any questions about your shareholding or matters such as dividend payments, tax file numbers or change of address you are invited to contact the company’s share registry office below, or visit their website at www.linkmarketservices.com.au or email [email protected]
Any other enquiries which you may have about the Company, can be directed to the Company’s registered office or visit the company’s website.
Under the Company's Constitution, each member present at a general meeting (whether in person, by proxy, attorney or corporate representative) is entitled:
Voting by proxy allows shareholders to express their views on the direction and management of the economic entity without attending a meeting in person.
Shareholders who are unable to attend the 2012 Annual General Meeting are encouraged to complete and return the proxy form that accompanies the notice of meeting enclosed with this report.
The final dividend of 40 cents per share will be paid on 5 October 2012 to shareholders entitled to receive dividends and registered on 13 September 2012 being the record date.
on a poll to one vote for each share held.
144
For
per
sona
l use
onl
y