july vol. copyright society growth staphylococcus …aem.asm.org/content/18/1/68.full.pdf ·...
TRANSCRIPT

APPLIED MICROBIOLOGY, JUly 1969, p. 68-75Copyright @ 1969 American Society for Microbiology
Vol. 18, No. IPrinted in U.S.A.
Growth of Staphylococcus aureus MF 31 on the Topand Cut Surfaces of Southern Custard Pies
D. L. PREONAS, A. I. NELSON, Z. JOHN ORDAL, M. P. STEINBERG, AND L. S. WEIDepartment of Food Science, University of Illinois, Urbana, Illinois 61801
Received for publication 1 April 1969
A Staphylococcus strain was inoculated on the top and cut surfaces of freshlybaked Southern custard pies which were then packaged in a pasteboard carton andheld at 30 C. Daily plate counts of surface sections 0.3 inch (0.76 cm) in thicknesswere made. The top surface inoculum showed a 24-hr lag time. This was due to theprotective action of a top cakelike layer as shown by homogenization of the mix andcoating of the surface. Substitution of all sweeteners with dextrose completely in-hibited growth on the top surface. Further addition of dextrose to lower water ac-tivity (Aw) to 0.9 prevented growth on the cut surface as well, but such pies wereorganoleptically unacceptable. Growth on the top surface could also be preventedby 80 jug of undissociated sorbic acid per g in combination with 100 jig of undis-sociated propionic acid per g in the baked pie. Growth on the cakelike top surfacewas always retarded longer than on the cut surface provided the packaging allowedevaporation of surface moisture. Reducing the Aw of a different type of cream pie to0.907 prevented top surface growth. It was concluded that baked cream pies with acakelike top layer could be marketed with a "refrigerate after opening" label, pro-vided the package maintains the moisture gradient caused by the surface skin andeither a combination of 80 ,g of undissociated sorbic acid per g and 100 Mug undis-sociated propionic acid per g is present in the baked pie or the Aw of the baked pieis 0.920 or lower.
In summarizing food poisoning outbreaks dur-ing a 10-year period, Dauer (8) showed that theoverwhelming majority of outbreaks are due tostaphylococcal food poisoning and to gastro-enteritis of unknown etiology. About 25% of thereported staphylococcal food poisoning out-breaks were traced to custard pies and to custard-filled baked products, e.g., eclairs, cream puffs,cream pies, and cream-filled donuts. Such ready-made desserts are manufactured in large, centra-lized plants and a considerable time is requiredfor distribution. Since the temperature range fortoxin formation is 10 to 47 C (4), public healthauthorities insist upon refrigeration of the productat all times. However, this refrigeration require-ment is difficult to implement and even moredifficult to enforce. Therefore, the purpose of thisresearch was to study formulas and manufactur-ing procedures which would allow distribution ofcream pies without refrigeration but with safetyfrom staphylococcal growth.
Several workers have shown that staphylococciin mixed culture seldom increase to the pointwhich would cause food poisoning (9, 14, 19).Custard pie fillings are cooked as the pie bakes so
they are essentially sterile after baking (5).Therefore, any postbaking contamination withstaphylococci would be on the surface, top or cut,of the pie and can lead to uninhibited growth re-sulting in large numbers of staphylococci. If wecannot depend upon refrigeration for protection,other environmental factors must be changed.Acid foods are not subject to staphylococcal
growth (6). However, this principle cannot beapplied to cream fillings because the bufferingcapacity of the milk and egg present requires theuse of extensive amounts of acid and this in turncauses off-flavors. Several acidified "synthetic"fillings with only starch as a thickener have beenintroduced to the market. Such acidification doesnot stop the growth of Staphylococcus aureus(7). The incorporation of preservatives into theseacidified "synthetic" fillings does prevent staphy-lococcal growth (E. W. Schmidt, M.S. Thesis,Ohio State Univ., Columbus, 1967); however,preservative activity is highly dependent uponthe pH (2).
S. aureus has been shown to be inhibited atwater activities (Aw) below 0.86 (16). Bacterio-static meringue (3) has been produced by lowering
68
on Septem
ber 7, 2018 by guesthttp://aem
.asm.org/
Dow
nloaded from

VOL. 18,1969 GROWTH OF STAPHYLOCOCCI ON SOUTHERN CUSTARD PIES
Aw. Also, "butter cream" fillings are bacterio-static when a sucrose to water ratio of 2.4:1 or adextrose to water ratio of 1.39:1 is used (18).Combinations of low pH and low Aw have
been shown to be additive in reducing staphy-lococcal growth (10, 12,14,17). A combination oflow Aw, low pH, and presence of preservativeshas made feasible the marketing of semimoistpet food which is microbiologically stable.
In an effort to prevent growth of S. aureus MiF31 on the surfaces of custard pies, both formula-tion and processing procedure were studied.Formulation factors included were Aw, pH, pre-servatives, and combinations of these whereapplicable. Because environmental conditionsare more severe in the South where the Southerncustard pie is most popular, this type of pie wasselected as the medium for study.
MATERIAS AND METHODS
The following ingredients were used: frozen pas-teurized whole eggs and egg whites (Standard Brands,Inc., New York, N.Y.); regular conversion 43Dextrose Equivalent corn syrup, 8170 solids (A. E.Staley Mfg., Co., Decatur, Ill.); dextrose monohydrate(Corn Products Co., New York, N.Y.); soft redwinter wheat flour (Dowagiac Milling Co., Dowagiac,Mich.); deodorized lard (Armour and Co., Chicago,II.); canned evaporated skim milk (Pet Inc., St.Louis, Mo.); instant nonfat dry milk (Carnation Co.,Los Angeles, Calif.); highly emulsified shortening(Standard Brands); salt; nutmeg; sugar; vanilla;cocoa;and tap water.
Formula 31 (Table 1) was used in most of the ex-peimental studies. Batches (3,000 g) were made infour sta as follows. First, the flour, shortening,salt, spice, and 50%7O of the sugar were creamed to-gether (model G, Kitchen Aid Mixer, Hobart Mfg.Co., Troy, Ohio) until the specific gravity was 0.9.Second, whole egg with the remaining sugar wasblended at low speed with the first portion until itresembled cake batter. Third, the remiigingre-dients were blended in a Waring Blendor until thecorn syrup had been dispersed. Fourth, these twoportions were blended by hand with a wire whip toeliminate lumps but yet retain the buoyancy of thebatter.Some mixes were homogenized at a tempera
of about 45 C by using 2,500 psi on the first valve and500 ps on the second valve of a laboratory ho-moizer (type 25, CBG Manton-Gaulin Mfg. Co.,Inc., Everett, Mass.).
After being placed in the oven, pastry shells werefilled with about 635 g of filling and baked for 37min at 193 C. After being cooled to room tempera-ture overnight, the pies were packaged in side-ventedpasteboard boxes with moisture-tansparent cello-phane windows.
In surface-coating experiments, Myvacet 7.00 andMyvacet 9.40 acetylated monoglycerides (Distilla-tion Products Industries, Rochester, N.Y.) were
liberally applied with a hand atomizer over the topsurface of the baked pie.
In some experiments, sorbic acid, potassium sor-bate, and calcium propionate were added to the mix(Chas. Pfizer & Co., Inc., New York, N.Y.). Thesepreservatives were completely dissolved in the 635 gof raw mix for each pie or blended into the raw mixin the first stage of mixing.A Beckman Zeromatic H pH meter standardized
with phosphate buffer (pH 6.86) was used to makeduplicate determinations. Sorbic acid content wasanalyzed in duplicate (1). Aw measurements weremade by the method of Landrock and Proctor (13).The water activity was also derived by calculatingthe sugar to water ratios and comparing them to thedata of Robinson and Stokes (15).The test organism was a coagulase-positive strain of
S. aureus designated as MF 31. It was received fromElizabeth Wilson of the Taft Sanitary EngineeringCenter, Cincinnati, and was originally isolated fromcheese containing enterotoxin. The properties whichmade this organism ideal were its short generationtime (about 30 min at 30 C) and relatively high tol-erance to acid, salt, and heat.
Pies were cut into eighths and each piece wasinoculated on top or side (cut) surface by a techniquesimilar to replicate plating. Velveteen cloth was at-tached to curved stainless-steel applicators by sew-ing. The applicators for inoculating the top and cutsurfaces measured 5 by 2 cm and 1.5 by 6.7 cm, re-spectively. A 1-ml amount of sterile 0.1% peptonewas pipetted onto synthetic sponge pads (2 mm inthickness) which had the same area as the appli-cators. Then 1 ml of a 1:1,000 dilution of a 10-hrshake culture of S. aureus MF 31 grown in TrypticaseSoy Broth (BBL) was added to the sponge. Eachapplicator was pressed against an inoculated spongepad to wet it, and the inoculum was transferredwith even pressure to the respective pie surface inone radial motion without breaking the surface. Figure1 shows the area inoculated in each case.The inoculated pies were incubated at 30 C. For
staphylococcal enumeration, a section of pie, 3 to 7mm in thickness, containing the 10-cm inoculatedsurface was removed and blended for 2 min with 100ml of sterile water. Each milliliter of this solution wastaken to represent 0.1 cm' of inoculated surface, andcounts were reported per unit area rather than perweight of filling. Mannitol Salt Agar (Difco) wasused to count staphylococci, whereas the total plate*count was obtained with Tryptone Glucose ExtractAgar (Difco). Triplicate plates were incubated at 37 Cfor 36 to 48 hr and were counted on a dark-fieldQuebec colony counter. Growth curves were labeledas, for example, T250 or C68; T or C indicates thesurface inoculated, top or cut, and the number indi-cates the number of the experimental pie.
All pies were organoleptically evaluated for flavor,off-flavor, odor, texture, and appearance. When ap-propriate, a panel of 12 to 16 judges evaluated thepies on a blindfold basis. A hedonic scale of 1 to 9was used in which 9 was excellent, 5 was acceptable,and 1 was very poor.
69
on Septem
ber 7, 2018 by guesthttp://aem
.asm.org/
Dow
nloaded from

PREONAS ET AL.
I - 6.7 cm. - I
10 sq. cm. 15c
FIG. 1. Area of inoculation of top surface and cutsurface ofpie slices.
RESULTSInoculation technique. Raw custard was inocu-
lated with approximately 1010 cells of the testorganism; after baking, none could be found,confirming earlier reports. However, the topsurface of a baked pie is subject to handling andairborne contamination before final packaging,and both the top and cut surfaces could becomecontaminated during cutting or after the pie hadbeen cut. The surface inoculation procedure usedhere was designed to reflect these conditions.Plate counts of inoculated surfaces were similarfrom trial to trial, indicating that these inoculationprocedures were reproducible. This inoculumlevel for the top surface ranged from 1,860 to10,200/cm2, and for the cut surface it rangedfrom 7,200 to 17,000/cm2. Experiments were runin duplicate or triplicate.
Effect of the top surface. Southern-style custardpies have been marketed in the Southern stateswithout a large number of reported food poison-ing incidents. Besides the sterilizing effect of thefinal baking, the top surface of this pie probablyoffers protection against growth of staphylococci.The mixing procedure used during preparationcauses a batter portion to float on the top as the
pie bakes, thus sealing the surface with an oily,cakelike layer (Fig. 2).
Typical growth response curves of staphy-lococci inoculated on the top (T59) and cut(C59) surfaces of pies made with formula 31(Table 1) are presented in Fig. 3. The growth re-sponse on the cut surface showed no apparent lag,whereas on the top surface the lag was on theorder of 24 to 36 hr. The generation time for thecut surface was on the order of 110 min, whereason the top surface it was approximately 145 min.The cut surface permitted a higher maximumnumber to develop.Homogenization of the raw Southern custard
mix produced pies which did not develop thecakelike top but rather developed a thin skin.Figure 3 also contains representative growth re-sponse curves for staphylococci on the top CT61)and cut (C61) surfaces. Replicate experimentsdemonstrated that homogenization reduced thelag time for growth on the top surface to about15 hr while keeping it at zero for the cut surface.The generation times were not appreciablychanged by homogenization. Thus, it can be con-cluded that the normal cakelike surface affectsonly the lag time and not the ability of the or-ganism to multiply.The extended lag time which was evident when
the cakelike surface layer was present can beattributed to its relatively dry, oily characteristics.It was postulated that this layer retards the migra-tion of moisture from the center to the surface,decreases the Aw at the surface, and thus in-creases the lag time. This was tested by doublingthe fat in the first stage of mixing which shouldfurther prevent moisture migration to the surface;the lag time was increased to 48 hr without affec-ting the generation time.As a further test of the postulate, acetylated
monoglycerides (Myvacet 7.00 and 9.40) weresprayed upon the surface of regular (formula 31)pies to provide an extra moisture barrier. The
FiG. 2. Cross section of Southern custard pieshowing cakelike layer on top surface.
70 APPL. MICROBIOL.
on Septem
ber 7, 2018 by guesthttp://aem
.asm.org/
Dow
nloaded from

VoL. 18,1969 GROWTH OF STAPHYLOCOCCI ON SOUTHERN CUSTARD PIES 71
TABLE 1. Pie filling formulas evaluated for support of S. aureus growth
Ilasicformula seLow Aw DextroseMixing stage Ingredients o3 substituted octe(No.31) o. 75) -No. 88 No. 89 (No. 270)
I ~ ~ ~ ~ ~~~gg g g gFirst IFlour 84.0 84.0 84.0 84.0 50.4
'Shortening, highly emulsified 163.0 167.0 167.0 167.0 201.6!Sucrose 204.0'Nutmeg 1.0 1.0 1.5 1.5'Vanilla 2.0 1.5 2.0 2.0 5.0Salt 5.6 5.0Dextrose 204.0 204.0 204.0 302.4Cocoa 100.8
Second Sucrose 204.0Whole egg 322.0 432.0 320.0 326.0 268.8Dextrose 204.0 204.0 2)4.0 302.4Egg whites 170.0
Third Evaporated skim milk 1,223.0 1,223.2 600.0 1,092.0Corn syrup 530.0 672.0'Water 261.0 261.0 539.9 734.5Dextrose 424.0 758.0 446.0Nonfat dry milk solids 246.0
Total 2,999.6 3,001.7 3,098.4 |2,415.0 3,000.4
TABLE 2. Effect offormulation variation on the lagtime and generation time of S. aureus MF 31
on the top surface of Southern custardpies
Procedure Formulation variation Growth
Myva- Genera-Homog- Double cet Double Lag tflnenized fat y flour tie (hr) time
coated ~~~~(min)
X 24-36 145X 12 145
X X 48 125X IX 48 125X X X 72 125X X X 96-144 135
2
0 24 48 72 96 120 144 168
TIME (Hours)
FiG. 3. Growth response curves ofS. aureus MF 31after inoculation of top and cut surfaces of regularand homogenized Southern custard pies. Storagetemperature, 30 C. Al pies were made withformula 31.Regular mixing: 0, C59; *, T59. Homogenized-El, C61; W T61.
lag time was the same as that in the case of thedouble-fat formula. When Myvacet 7.00 was
sprayed on pies made with the double-fat formula,the lag time was lengthened to 72 hr; again, thegeneration time rined nanged.These results indicate that the lag time was in-
creased by decreasing the migation of moisture.Therefore, the effect of doubling both the fat andflour was investigated. These pies had a cakelike
layer approximately double in thickness and thelag time for surface growth was further increased(96 to 144 hr).
E0
9-
0.
0J.
Ll
0
on Septem
ber 7, 2018 by guesthttp://aem
.asm.org/
Dow
nloaded from

PREONAS ET AL.
E8X
Z
0
0
0
0
0 24 48 72 96 120 144 168
TIME (Hours)
FIG. 4. Growth response curvesfor S. aureus MF 31after inoculation of top and cut surfaces of dextrose-substituted and low Aw Southern custard pies. Storagetemperature, 30 C. Dextrose-substituted pies (0.925Aw): 0, C75; 0, T75. Low Aw pies: E, C89 (0.900Aw); *, T88 (0.893 Aw).
Table 2 summarizes the effect of the variousmethods used to prevent equilibration of surfacemoisture. The factors that tended to maintain a
dry surface were shown to be additive in theireffect on increasing lag time.
Decrease of Aw. Lowering of Aw by nature orman is a common method of preservation. TheAw of Southern custard pies was calculated to be0.965 and measured as 0.968. Since dextrose hasalmost twice the effect of sucrose in lowering Aw(18), the corn syrup solids and sucrose in thestandard formula were replaced by dextrose(formula 75; Table 1). The baked pie was foundto have high organoleptic acceptability and acalculated Aw of 0.925. Figure 4 shows typicalgrowth curves for the top (T75) and cut (C75)surfaces. The viable count for the top surfaceactually decreased with incubation time. How-ever, attenuated growth with a generation time of250 min occurred on the cut surface.
Pies with the Aw further reduced were formu-lated (no. 88 and 89, Table 1) by increasing thedextrose. The calculated and measured Aw valuesfor these pies were 0.893 and 0.913, respectively,for no. 88, and 0.900 and 0.899, respectively, forno. 89. Typical growth response curves are in-cluded in Fig. 4 (T88 and C89). It is apparentthat with these formulations the test organism
TABLE 3. Effect of acidification with phosphoricacid and increase offat on mean scoresfor flavor and off-flavor of Southern
custard piesa
Double- ~ Double-Southern fat Suhr a
Determnation custard Southern csadSuhrDetermination (no acid, custard (HIPO custard
pH60)(no acid, added, (Hs3PO4pH6.00) pH 5.50) added,pH6.05) ~pH 5.51)
Set A (15 panel-ists)Flavor ....... 7.7 7.5 6.7 6.7Off-flavor..... 8.1 8.1 7.0 7.1
Set B (16 panel-ists)Flavor ..... 7.9 7.9 7.2 7.1Off-flavor ... 8.1 8.3 7.6 7.1
Set C (14 panel-ists)Flavor. 7.9 7.9 7.0 6.9Off-flavor..... 8.2 8.3 7.2 6.8
a Score: 9, excellent; 5, acceptable; 1, very poor.
was unable to multiply, and, in fact, there wasevidence that the numbers of viable cells de-creased as the storage time increased. However,both formulas yielded pies which were organo-leptically unacceptable as a result of crystallizationof the dextrose, poor body, and excessive sweet-ness.
Decrease of pH. Many food products are pre-served by lowering the natural pH throughfermentation or addition of acidulants. Schmidt(M.S. Thesis, Ohio State Univ., Columbus, 1967)demonstrated the usefulness of synthetic piefillings acidified with citric acid. It has beenpointed out (10, 12, 14, 17) that a lowered pHand a low Aw do not allow staphylococci to grow.
Pies acidified with adipic, citric, succinic, lactic:malic, fumaric, and tartaric acids were unpalat-able. In each case, the amount of acid needed tobring the pH of the filling to the desired levelcaused an unpleasant sourness. Hydrochloricacid was discarded as an acidulant; because of itsvolatility at baking temperatures, it was difficultto control the residual acid in the baked pies.
In trials with phosphoric acid, 0.154% carboxymethyl cellulose (CMC) was added to controlthe syneresis of the egg-milk system in the acidi-fied pies. An organoleptic comparison of phos-phoric-acidified, regular and double-fat pies withan unacidified control is presented in Table 3.The scores for color, aroma, and texture showedlittle difference and are not included in the table.The scores for flavor and off-flavor were con-sistently lower for the acidified pies. Doublingthe fat content of the pie did not overcome the
72 APPL. MICROBIOL.
on Septem
ber 7, 2018 by guesthttp://aem
.asm.org/
Dow
nloaded from
Vow. 18,1969 GROW[H OF STAPHYLOCOC ON SOUTHERN CUSTARD PIES
detrimental flavor effect of acidification. Sincethe test organism, as well as most staphylococci,can grow at pH 5.5 and above (12), no additionalwork was done with this variable.
Preservatives. Sorbic and propionic acids wereselected as representative preservatives whichmight be incorporated into custard pies. Theamount added was limited by the impartation ofan off-flavor to the pie. Preliminary tests demon-strated that up to 0.15%/c- propionate and 0.2%sorbate could be added without serious adverseflavor defect. The sorbate at 02% required extravanilla to mask a slight characteristic odor.A pH fluctuation of as little as 0.1 pH unit can
have a marked effect on the per cent undissociatedacid. For example, at the normal pie pH of 6.0,only about 6% of these acids are in the undis-sociated form. AtpH 5.75 the value is about 10%,and at pH 6.25 only about 4% is undissociated.Since only the undissociated acid acts as a pre-servative (2), the test concentrations were re-ported as micrograms per gram of undissociatedacid at the pH of the pie. Except when otherwisenoted, the preservatives were added to the originalSouthern custard formula (no. 31, Table 1).
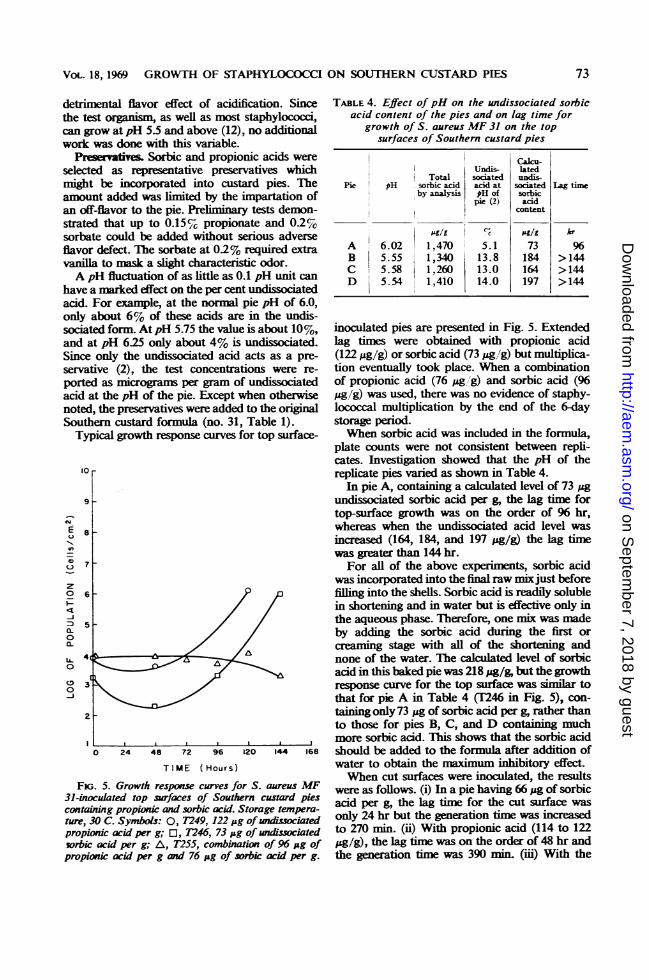
Typical growth response curves for top surface-
10
9-E8
-n
()7_
0.
0a-
LL40
0 3A/0-J
TIME (Hours)
Fw.. 5. Growth response curves for S. aureus MF31-inuxulated top surfaces of Southern custard piescontaining propionic and sorbic acid. Storage tempera-ture, 30 C. Symbols: 0,7249, 122 pg of undissociatedpropionic acid per g; El, 1246, 73 pg of undissociatedsorbic acid per g; A, T255, combination of 96 pg ofpropianc acid per g and 76 pg of sorbic acid per g.
TABLE 4. Effect of pH on the undissociated sorbicacid content of the pies and on lag time for
growth of S. aureus MF 31 on the topsurfaces of Southern custard pies
Total~ ~ Cku!Unis- lated| Total sociated undis-Pie pH sorbic acid acid at socated Lag time
by analysis pH of sorbicpie (2) acid
content
j /g -C Cg/g kr
A 6.02 1,470 5.1 73 96B 5.55 1,340 13.8 184 >144C 5.58 1,260 13.0 164 >144D 5.54 1,410 14.0 197 > 144
inoculated pies are presented in Fig. 5. Extendedlag times were obtained with propionic acid(122 ug/g) or sorbic acid (73 ug/g) but multiplica-tion eventually took place. When a combinationof propionic acid (76 ugjg) and sorbic acid (96ag/'g) was used, there was no evidence of staphy-lococcal multiplication by the end of the 6-daystorage period.When sorbic acid was included in the formula,
plate counts were not consistent between repli-cates. Investigation showed that the pH of thereplicate pies varied as shown in Table 4.In pie A, contining a calculated level of 73 pg
undissociated sorbic acid per g, the lag time fortop-surface growth was on the order of 96 hr,whereas when the undissociated acid level wasincreased (164, 184, and 197 pg/g) the lag timewas greater than 144 hr.For all of the above experiments, sorbic acid
was incorporated into the final raw mix just beforefilling into the shells. Sorbic acid is readily solublein shortening and in water but is effective only inthe aqueous phase. Therefore, one mix was madeby adding the sorbic acid during the first orcreaming stage with all of the shortening andnone of the water. The Calclated level of sorbicacid in this baked pie was 218 pLg/g, but the growthresponse curve for the top surface was similar tothat for pie A in Table 4 ([246 in Fig. 5), con-tainingonly 73 ug of sorbic acid per g, rather thanto those for pies B, C, and D containing muchmore sorbic acid. This shows that the sorbic acidshould be added to the formula after addition ofwater to obtain the maximum inhibitory effect.When cut surfaces were inoculated, the results
were as follows. (i) In a pie having 66 pg of sorbicacid per g, the lag time for the cut surface wasonly 24 hr but the generation time was increasedto 270 min. (ii) With propionic acid (114 to 122pg/g), the lag time was on the order of 48 hr andthe generation time was 390 min. (iii) With the
73
on Septem
ber 7, 2018 by guesthttp://aem
.asm.org/
Dow
nloaded from

PREONAS ET AL.
10l
E
0En
0
0~IL
(9
0
8
7
6
5
TIME (Hours)
FIG. 6. Growth response curvesfor S. aureus MF31inoculated on top and cut surfaces of high-dextrose,high-solids chocolate pies. Storage temperature, 30 C.Symbols: 0, C270; 0, T270; A, C273; A, T273.
combination of propionic acid (96 /ug/g) andsorbic acid (76 Ag/g), the lag time was approxi-mately 72 hr and the generation time was 870min.To explore the effect of sorbic acid content in
combination with a reduced Aw, three levels ofsorbic acid were added to formula 75 (Table 1).As expected from previous results without sorbicacid in this formula (T75, Fig. 4), the top surfacedid not support growth. The cut surfaces of piescontaining 61, 65, and 98 jig of sorbic acid per g allshowed some growth, but at the highest level thelag time was lengthened to 48 hr and the genera-tion time was increased from 250 to 370 min.Although the preservative studies demonstrated
that neither sorbic acid nor propionic acid wasadequate alone, the combination of approxi-mately 80 Mg of undissociated sorbic acid per gwith 100 Mg of undissociated propionic acid per geffectively controlled the top-surface growth ofstaphylococci. Such a combination should permitsafety in normal distribution but the packageshould be labeled "refrigerate after opening."
Chocolate pies. To determine the applicabilityof pertinent findings from the Southern custardpie studies to another variety of cream pie, ahigh-dextrose chocolate pie was used (formula270, Table 1). The baked pie was calculated tohave an Aw of 0.907. Growth response curves for
the inoculated surfaces are shown in Fig. 6. Thetop surfaces of the baked pies did not supportgrowth, and there was a gradual decrease in re-coverable organisms as the storage time was ex-tended. Likewise, growth on the cut surface wasretarded showing both an extended lag andgeneration time. This pie was found quite accept-able from the organoleptic standpoint and did notshow sugar crystallization. Therefore, such amodified chocolate pie could be marketed with a"refrigerate after opening" label.Holding study. To determine whether a pie
purchased several days after manufacture wouldsupport growth of staphylococci, a longer studywas conducted with five Southern custard piesheld at room temperature. The packaged pieswere visually acceptable up to 7 days; slight moldappeared after 9 days. Total plate counts re-mained below 300/cm2. On the 3rd day afterbaking and each day thereafter, one pie was re-moved from the holding study and inoculated onthe cut surface. The cut pieces appeared inedibleto the panel after about 3 days, probably due todrying out. The growth response curves on thesecut surfaces were similar in shape, but the maxi-mum number of organisms obtained was loweras the days since baking increased. Thus, as thepies became older and more evaporation hadtaken place, a poorer growth medium resulted.
DISCUSSION
Throughout these experiments an effort wasmade to simulate the conditions which are be-lieved to be present when a baked custard pie isinvolved in a staphylococcal food poisoning inci-dent. As was shown, the baked pie is essentiallysterile as it is placed in the package, unless it hasbeen contaminated by handling or by airborneorganisms. After the pie is removed from thepackage and has been cut, another surface is opento infection. Most workers have evaluated foodsfor their ability to support growth of staphylococciby intimately mixing the organism with the foodand characterizing the resulting growth. This doesnot reflect the possibility that the surface mayimpede or accentuate growth. By using a surfaceinoculation which assured aerobic conditions, itwas shown that the top surface impedes growthwhen compared to the cut surface.When a cut piece of pie was stored, marked
surface dehydration occurred. A holding studyshowed that 3 days after being cut the piece of pieappeared organoleptically unacceptable.The lag times in all cases were longer for the
top surfaces than the cut surfaces. It is postulatedthat the skin layer formed during baking set up amoisture gradient between the center of the pie
74 APPL. MICROBIOL.
on Septem
ber 7, 2018 by guesthttp://aem
.asm.org/
Dow
nloaded from

VOL. 18,1969 GROWTH OF STAPHYLOCOCCI ON SOUTHERN CUSTARD PIES
and the pie-air interface resulting in less availablemoisture on the top. Growth did not occur untilthis gradient had gradually disappeared. As seenin Table 2, the type of surface had a great effectupon the lag times, but once the moisture gradi-ent disappeared generation times were quitesimilar. The lag times were longer when the piewas formulated to have a lowered Aw or whenpreservatives were added.However, these studies have demonstrated that
in no case was the generation time less than 100min, showing that even pies made with the originalformula were not an ideal substrate for the multi-plication of the test organism. The generationtimes were further extended when the pie formulawas altered to reduce the Aw or when preserva-tives were added.A number of investigators (9, 19) have con-
cluded that if a food is to be responsible for afood poisoning incident it must contain in excessof 107 staphylococci per g of food. It has alsobeen shown that the right growth conditions maybe more important than the total population ifenterotoxin is to be produced (S. I. Martins,PhD. Thesis, Massachusetts Institute of Tech-nology, Cambridge, 1964). Although it is notexpedient to relate counts per gram to counts persquare centimeter of surface, in no case did thecount exceed 1010 organisms/cm2.The staphylococcal counts recorded were based
on the use of the selective medium MannitolSalt Agar. This medium has good productivityfor normal or healthy cells but its productivity ismarkedly reduced when used to enumerate viablebut stressed or aged cells (11). Hence, underconditions in which the lag time was extended orthe generation time was especially long, the countsreported would have to be considered minimumcounts. Whether enterotoxin was produced inany of these situations could only be answeredby specifically assaying for enterotoxin. However,other workers (10) have shown that under stressedgrowth conditions it is unlikely that enterotoxinwould be formed.Packaged Southern custard pies maintain an
acceptable appearance and are organolepticallyacceptable when stored at ambient temperaturefor as long as 10 days after beking. Such a pro-longed market stability makes it desirable to usea pie formulation which would prevent the growthof staphylococci on the top surface. Unless it issubsequently demonstrated that the retardedgrowth on the cut surface of pies made from amodified formula will not produce enterotoxin,
such pies should be held under refrigeration aftercutting.
ACKNOWLEDGMENT
The W. E. Long Memorial Award for ment and excellence inresearch was granted to the senior author by the Southern BakersAssociation.
LI'ERATURE CITED
1. Alderton, G., and J. C. Lewis. 1958. Determination of sorbicacid and its disappearance from pickle brines. Food Res.23:338-344.
2. American Hoechst Corporation. 1967. Effectiveness of sorbicac. Tech. Bull. No. S102, American Hoechst Corp., Moun-tainside, N.J.
3. American Institute of Baling. 1955. Practices designed to pre-vent growth of food poisoning bacteria m e s Bull.No. 84, American Institute of Baking, Chicago, III.
4. Angeodoti, R., M. J. Foter, and K. H. Lewis. 1961. Time tem-perature effects on samI eLae and staphylococci in foods.IL Behavior in warm holding erature foods. Amer. J.Public Health Nat. Health 51:83-88.
5. Angelot, R., M. J. Foter, and K. H Lewis. 1961. Ttme-tem-perature effects on saimonellae and staphylococci in foods.1m Thermal death tine studies. AppL MicrobioL SUMS-315.
6. Cathcart, W. H., W. J. Godkin, and G. Barnett. 1947. Growthof Staphyloccas arads in various pastry fillings FoodRe. 12:142-150.
7. Crisley, F. D., R. Angelotti, and M. J. Focer. 1964. Multiplica-tion of Skphylcocaaweus in synthetic cream fillin andpies. Pub. Health Rep. 79.369.
8. Dauer, C. C. 1961. L960 Summary of diAse outbreaks and aten year resume. Pub. Health Rep. 764915-922.
9. DIonnely, C. B., J. E. Ieslie, andL A. Bbck. 1968. Productionof enterotoxin A in milk AppL Microbiol. 16:917-924.
10. Genigeorgis, C., and W. W. Sadler. 1966. Effect of NaG andpH on enterotoxin B production. J. Bacteriol 92:1383-1387.
11. landolo, J. J., and Z. J. OrdaL 1966. Repair of thermal inryof Staphylocm Uas. J. Bacteiol. 91:134-142.
12. landolo, J. J., Z J. Ordal, and L D. Witter. 1964. The dect ofincubation temperature and controled pH on the growth ofStaphylcoccus owrw MF 31 at various concentrations ofNaC. Can. J. Microbiol. 1.808-810.
13. Landrock, A. H., and B. E. Proctor. 1951. A new graphicalinterpolation method for obtaining humidity eqdata, with special reference on its role in food pacaingstudies Food Technol. 5:332-337.
14. Peterson, A. C., J. J. Blac, and M. F. Gunderson. 1964.Staphylococc in competition. III. Influence of pH and salton staphylococcal growth in a minxed population. AppLMicrobiol. 12:70-76.
15. Robinson, R. A, and R. H. Stokes. 1959. Elctrolyte solu-tions, p. 476-478. 2nd ed. Butterworths Scitific Publisbers,LU.on, Ensdand
16. Scott, W. J. 1957. Water relations of food spoie microors. Advan. Food Res. 7:84-130.
17. Scott, W. J. 1961. Available water and microbial growth, p.89-105. In Proceedings low temperature microbiology sym-possum 1961. Campbeil Soup Co., Camden, NJ.
18. Silliker, J. H., and S. A. McHugh. 1967. Factors inumicrobial stability of butter-cream type fillings Cereal SToday 12:63-65, 73-74.
19. Troller, J. A., and W. C. Frazier. 1963. Repression of Stophvyococcus aures by food bactera. L Effect of environmentalfactors on inhibition. AppL Microbiol. 11:11-14.
75
on Septem
ber 7, 2018 by guesthttp://aem
.asm.org/
Dow
nloaded from