july 4 blufax demo briefing
TRANSCRIPT

Demonstration of Bluetooth-based Traffic Monitoring Technology
Demonstration Results 4th of July Weekend 2009
Prepared for:District of Columbia Department of Transportation
Donna C. Nelson, PhDTransportation Perspectives [email protected]
Stan Young, PhDTraffax [email protected]

Acknowledgements
Traffax, Inc
This demonstration was conducted as a collaborative effort by:
Transportation Perspectives, Inc
District of Columbia Department of Transportation
University of Maryland
Transportation Perspectives [email protected]

Presentation
Background/overview Purpose and objectives of the test Overview of Blu-FAX Technology (the basics) Study Approach (what we did) Presentation of Test Results Lessons Learned Applications of BluFAX for a wide-scale test Additional applications of BluFAX
Transportation Perspectives [email protected]
Background
The 4th of July celebrations present a unique opportunity to collect data to test and refine traffic management strategies. Evacuation routes and strategies Signal timing and traffic management strategies Special events planning and management.
Transportation Perspectives [email protected]
Background
Do not provide sufficient data to support DDOT analysis and modeling needs.
Travel time runs (floating car techniques) yield limited data on congested roadways.
Cost of traditional data collection approaches is labor intensive and expensive.
Data collection efforts limited to 9:00PM to 12:00 AM on July 4.
Transportation Perspectives [email protected]
Traditional Traffic Studies

Background
Providing real-time freeway travel time data Evaluation of Signal Timing Improvements along arterial roadways. Monitoring pedestrian and vehicle traffic at Indianapolis Speedway (The
Brick Yard) Events. Estimating passenger delay at airport security check points
BluFAX has performed well for a variety of applications that are similar to those needed to support Operation Fast Forward. Examples include:
These studies suggest that BluFAX is suitable for use in the Capital Mall area, however the technology has not yet been tested in a dense, urban environment.
Transportation Perspectives [email protected]
Demonstration Objectives
Use in dense urban environments Extremely heavy pedestrian volumes Pedestrian travel speeds that may be higher than vehicle speeds at times Roadway environment and security considerations dictate available locations
of data collection units.
Technology Filtering approaches (BluStat Software) developed for freeway and/or
higher-speed arterial roadways may require adjustment for application. Addressing bi-modal distributions among pedestrian and vehicle traffic Antenna footprint /or other factors related to detection rates.
A demonstration on the 4th of July is an opportunity to assess the capabilities and performance of BluFAX
Transportation Perspectives [email protected]

Demonstration Objectives
Obtain Data set to support evaluation of BluFAX processes and performance Detection rates and matched detections along study corridor. Familiarization with BluFAX data processing features and capabilities. Organization and format of BluStat output. .
Define and assess potential for BluFAX use BluFAX capabilities and applications as part of comprehensive data
collection efforts. Potential use in a multi-corridor data collection effort on the 4th of July Additional applications of interest to DDOT, that build on BluFAX
capabilities. Consider strategies/options for locating portable as well as permanently
installed units.
Transportation Perspectives [email protected]

BluFAX Technology
Overview of capabilities and features
Transportation Perspectives [email protected]

BluFax Technology
10
2 miles
Traffax Equipment**
* Bluetooth signals come from cell phones, PDAs, laptops, GPS, car radios…** Provisional patent received
BluetoothSignal *
Time = 8:03:26 AM
Time = 8:05:58 AM
Travel Time = 2:32 MinutesSpeed = 51.7 MPH
How it works
Transportation Perspectives [email protected]

Detection Zone
A BL = Length of segment
Detection Zones
A Bluetooth enabled device may be detected more than once as it passes through a detection zone.
As traffic slows, the probability of getting multiple observation of the same MAC ID from a single device increases.
BluFAX detects and records Mac addresses present within the detection zone.
Size of detection zone depends on antenna strength, placement of units, and other factors related to the environment.
Processing software configured to detect and address multiple detections.
Transportation Perspectives [email protected]

BluFAX Capabilities
Ability to collect data continuously over an extended period of time. BluStat software processes raw data and delivers output in graphic and
tablular formats (CSV and Excel). Substantially lower labor costs associated with conducting travel time studies
and manual turning movement counts. Can be deployed to obtain information not available by other means:
Time-based origin-destination data for both pedestrians and vehicles. Direct measures of travel time and delay along routes.
Technology minimizes concerns related to public privacy.
Key features of BluFAX
Additional information available at www. Traffaxinc.com
Transportation Perspectives [email protected]

Details-Study Area
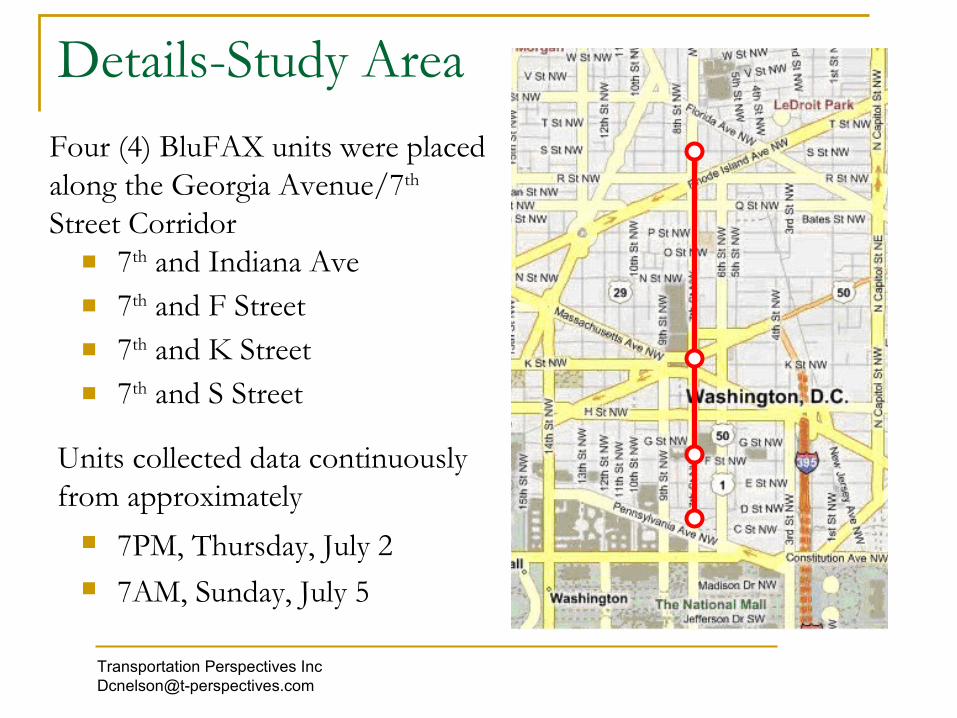
7th and Indiana Ave 7th and F Street 7th and K Street 7th and S Street
Four (4) BluFAX units were placed along the Georgia Avenue/7th Street Corridor
Units collected data continuously from approximately
7PM, Thursday, July 2 7AM, Sunday, July 5
Transportation Perspectives [email protected]

Details-Placement of Sensors
Vehicles were placed on side streets, generally within 50 feet of the intersection of interest. Closest parking space to intersection was reserved by DDOT for study. Portable units placed on floor of vehicle and covered. Antenna affixed to window of vehicle using adhesive fasteners. Location of antenna provided a clear view of intersection Demo employed Class I antennae with a rated open air range of 100 m. Detection during demo limited by line of site obstructions (buildings and
other structures)
Transportation Perspectives [email protected]

Sensor Locations Adjacent to 7th Street
Indiana Avenue, NW
One-way traffic
Metro Entrance
Sensor Location
F Street, NW

Sensor Locations Adjacent to 7th Street
K Street S Street
Sensor Location
Sensor Location
Transportation Perspectives [email protected]


Data Collection & Processing
Station Processing Invalid codes Multiple detections combined 5 minute detection rates
Segment Processing Matched pairs Filter outliers and data points Calculate travel time, speed Output 5, 15 minute, & 1 hour
At the end of the study, raw data were downloaded and processed using BluSTAT software provided with the equipment.
Data Recorded Device ID Sensor location (GPS) Time Mac Address
Station Processing
Segment Processing
Data Recorded
Transportation Perspectives [email protected]
Station Analysis
Detections include all valid IDs recorded within the detection zone. The software discards invalid MAC IDs. Identifies and addresses multiple detections from the same ID Multiple detections within a 4 minute threshold are treated as a single
detection. Detections that are separated by a larger time gap are treated as separate
detections.
Data stored on memory media from each unit are downloaded to a PC.

Study Detection Rates 2nd – 5th July
5 Minute Detection Rates General patterns similar for all stations. 5 Min. rates at Indiana Ave, F St, and K St range from 10
to 60 per 5 minute period between 9AM and 12AM. Detections at S St much lower but could be due to
differences in cross-street traffic and pedestrian traffic.
Detections include all valid IDs recorded within the detection
zone. Invalid MAC IDs discarded. Multiple detections from the same ID w/in 4
minute threshold treated as one detection Detections > min apart treated as separate
detections.
Transportation Perspectives [email protected]

Study Detection Rates 2nd – 5th July
Spike in traffic due to exodus from fireworks display is shown at all stations.

Segment Processing
Segments are defined in the BluFAX Software Detection records from two sensors are compared to identify “matched”
pairs. Direction of travel is determined based on the order in which IDs are
recorded (based on segment definitions_ Station A to Station B Station B to Station A
Sensors use GPS coordinates to determine straight-line distance between units, time references for sensor units are synchronized.
Once Station and Segment data are processed, segments can be defined as a “corridor”.
Travel time and speed data are determined by matching detection records from two sensors.
Transportation Perspectives [email protected]

15 Minute/1 Hour Segment Reports
15 minute and 1 hour summary reports By travel direction and study date Number of good data points on segment represents matched pairs, which
also indicates sample size Travel time summaries for section/time period.
BluStat exports data in CSV and Excel formats based on filtered data.
Excel Output Format for 15 minute and 1 hour summaries
Summary Statistics for 15 minute periods
Transportation Perspectives [email protected]
Travel Time Plots
182124 3 6 9 1215182124 3 6 9 1215182124 3 6 9 120
5
10
15
20
25
30
Tra
vel T
ime
- M
inut
es
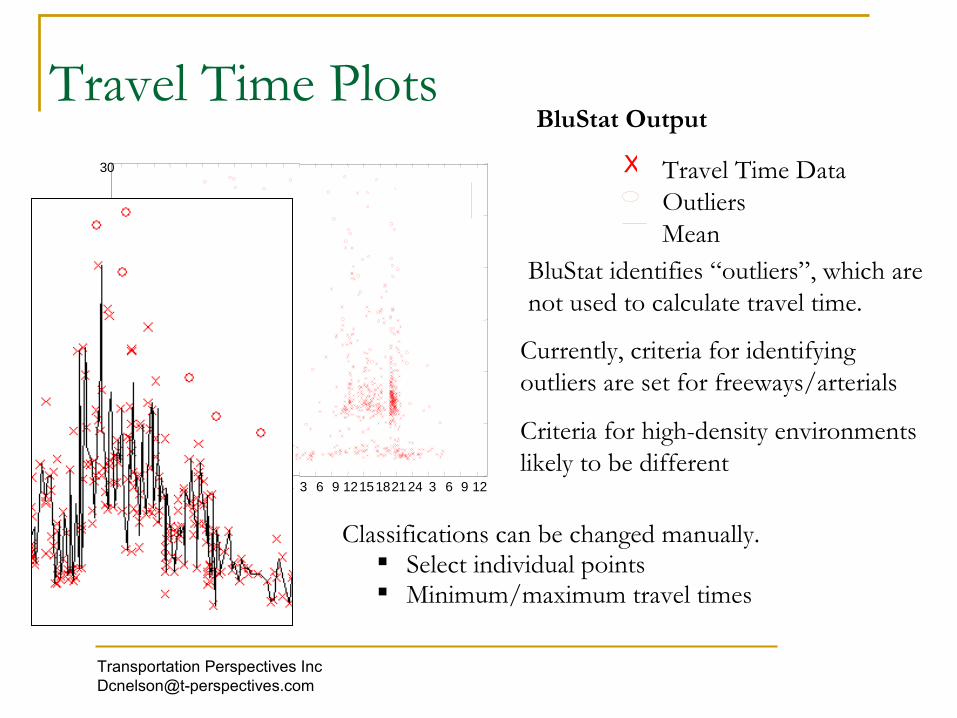
Travel Time DataOutliersMean
X
BluStat Output
BluStat identifies “outliers”, which are not used to calculate travel time.
Classifications can be changed manually. Select individual points Minimum/maximum travel times
Currently, criteria for identifying outliers are set for freeways/arterials
Criteria for high-density environments likely to be different
Transportation Perspectives [email protected]

Segment Processing
182124 3 6 9 1215182124 3 6 9 1215182124 3 6 9 120
5
10
15
20
25
30
Tra
vel T
ime
- M
inut
es
These results have not been confirmed through statistical analysis!.
BluFAX plots a mean travel time based on all data points.
Once that line is removed, the data points appear to group into three categories based on travel times:
2 to 3 minutes
5 to 15 minutes
> 15 minutes
Transportation Perspectives [email protected]

Traffic passing through study intersections on cross streets
Pedestrians entering metro at or between sensor locations.
Vehicles turning off or onto segment between sensors.
Sample size is the number of matched pairs between two stations.
The number of matches can be reduced by
Intersections marked with blue circles are locations where 2008 data indicate points where vehicles could enter or exit route between sensors.
Sensors can be placed at intersections or mid-block.
Matching Pair and Sample Sizes
Transportation Perspectives [email protected]

Building on time/location data
Sensors record the time and location a specific ID is identified.
Segments can be defined between stations for different purposes.
A series of segments can be defined as a corridor to estimate through that corridor, but depending on how links are defined, may not reflect travel times on a specific roadway segment. .
Travel time data will be based on the shortest distance between the two stations that form a segment.
Time and location matches can be used to provide O-D data and/or derive turning movements.
Transportation Perspectives [email protected]

Summary
The BluFAX performed well for collection of travel time data along 7th Street on the 4th of July Capable of collecting high-quality data over a period of several days. Units
were checked during the study period, however no problems were encountered.
Placement and monitoring BluFAX units for the demonstration involved four field staff and a supervisor for approximately 10 hours total to place, monitor, and retrieve sensor units and to download data from sensor units. Time requirements per unit should be less for larger-scale studies.
The demonstration did not specifically address the use of BluFAX to collect pedestrian data, however, this capability could provide an added dimension to DDOTs ability to manage and monitor vehicle and pedestrian travel times.
Transportation Perspectives [email protected]

Summary
BluStat software processes and packages data in graphic and tabular formats.
Tabular data is comparable with formats used for traditional traffic studies. Data can be exported to CVS and Excel formats for further analysis. It should be feasible to develop approaches to data analysis to address
issues related to high pedestrian volumes and congested roadway conditions following special events.
Developing a study design that addresses vehicles turning off the study corridor at key routes between sensor units should increase. Data from 2008 suggest that 22% of vehicles turn right onto New York
Avenue alone. . A thorough analysis of 2008 study data along the corridor may provide
more robust estimates of how turning movements impact matched pairs on some roadway segments.
Data Processing and Analysis
Transportation Perspectives [email protected]

Study Design Considerations
The output provided by BluFAX is a sample and cannot provide traffic volumes or classification counts. Other studies indicate that sampling rate for specific locations remains somewhat constant over time.
Volume counts may be needed at some locations, to provide a basis for estimating volumes.
Placement of units in subsequent studies should allow demonstration of O-D capabilities.
A study design that builds on BluFAX capabilities may be able to fully or partially replace manual turning movement counts.
Study Design Considerations
Transportation Perspectives [email protected]
Summary
Location in vehicles worked well for this study, but is not appropriate for all situations (such as along Constitution Avenue)
Sensors locations Advance lead time is needed to identify candidate locations Units may be placed in vehicles or secured to the
infrastructure Mounting brackets needed to allow portable units to be
mounted above ground level, to poles or elevated structures. DDOT should consider permanent installations at some
locations that support on-going use for a range of applications, supplemented by portable units for short-term, special studies.
Securing Units
Transportation Perspectives [email protected]

For Information
Donna Nelson, PhD. [email protected] www.t-perspectives.com
Stan Young, PhD [email protected] www.traffaxinc.com
Transportation Perspectives [email protected]