july 2001brent w. ambrose, university of kentucky1 commercial mortgage-backed securities national...
TRANSCRIPT

July 2001 Brent W. Ambrose, University of Kentucky 1
Commercial Mortgage-Backed Securities
National University of Singapore
July 27, 2001
Notes from lecture given by Brent Ambrose at
National University of Singapore – July 2001
July 2001 Brent W. Ambrose, University of Kentucky 2
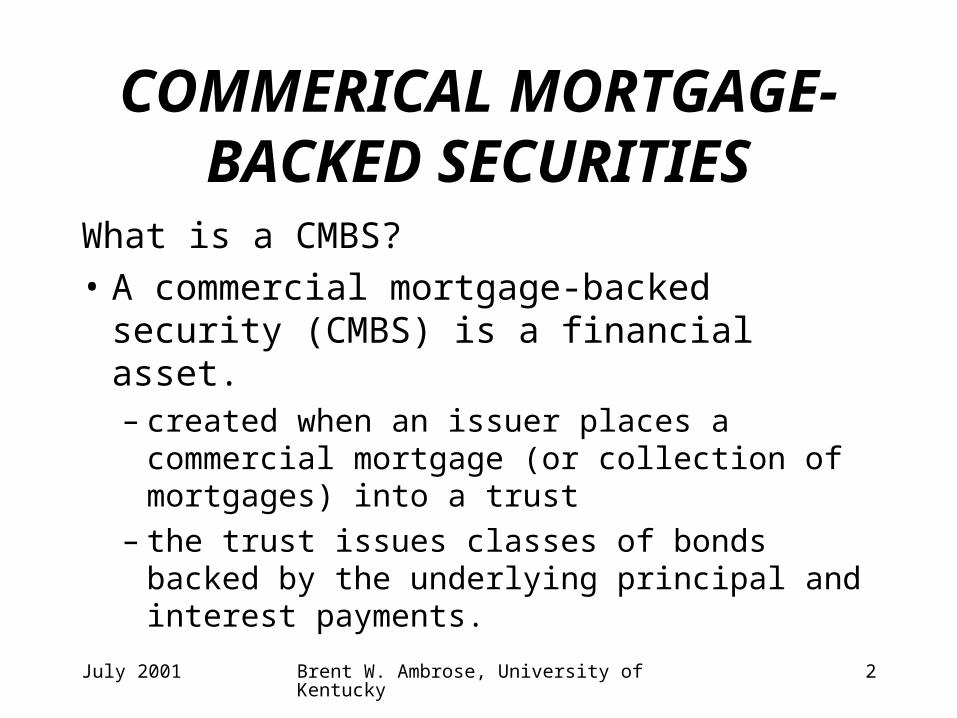
COMMERICAL MORTGAGE-BACKED SECURITIES
What is a CMBS?
• A commercial mortgage-backed security (CMBS) is a financial asset.– created when an issuer places a commercial
mortgage (or collection of mortgages) into a trust
– the trust issues classes of bonds backed by the underlying principal and interest payments.
July 2001 Brent W. Ambrose, University of Kentucky 3
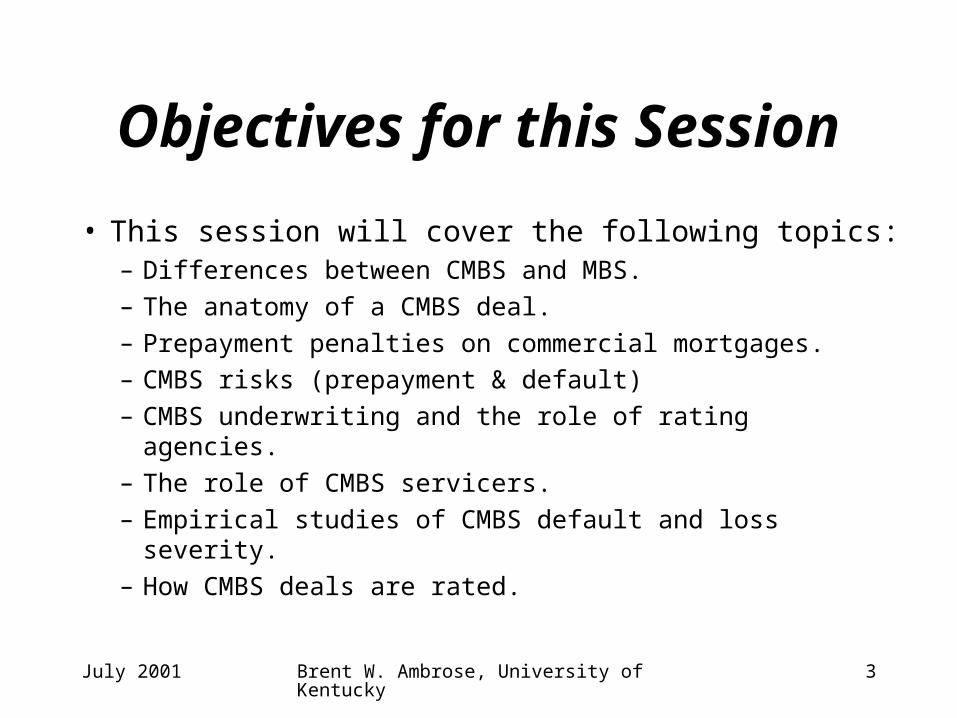
Objectives for this Session
• This session will cover the following topics:– Differences between CMBS and MBS.
– The anatomy of a CMBS deal.
– Prepayment penalties on commercial mortgages.
– CMBS risks (prepayment & default)
– CMBS underwriting and the role of rating agencies.
– The role of CMBS servicers.
– Empirical studies of CMBS default and loss severity.
– How CMBS deals are rated.
July 2001 Brent W. Ambrose, University of Kentucky 4
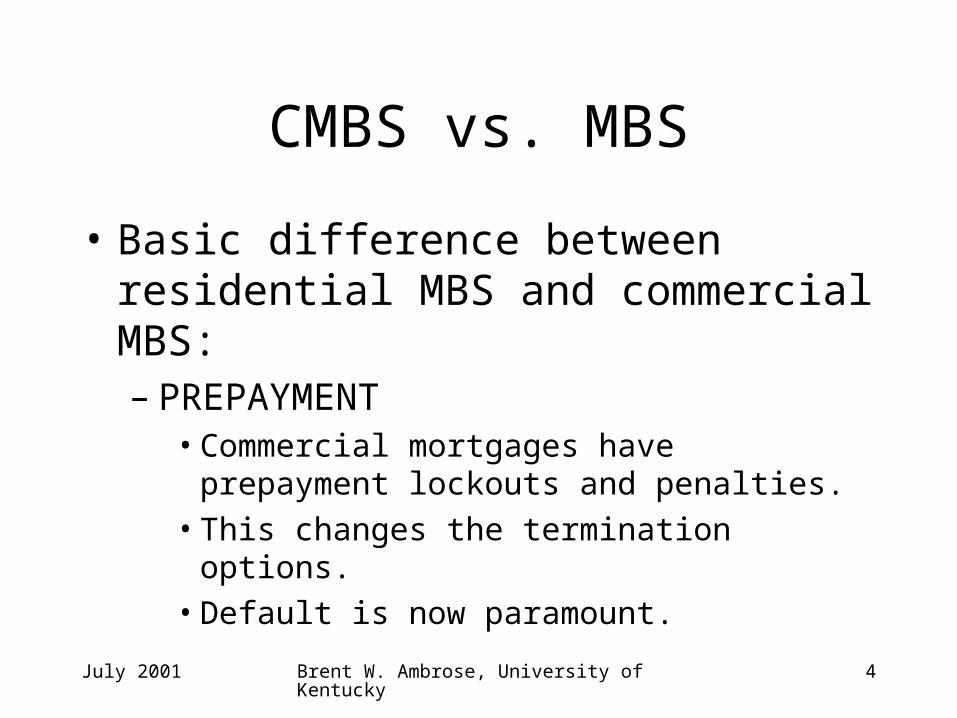
CMBS vs. MBS
• Basic difference between residential MBS and commercial MBS:– PREPAYMENT
• Commercial mortgages have prepayment lockouts and penalties.
• This changes the termination options.
• Default is now paramount.

July 2001 Brent W. Ambrose, University of Kentucky 5
U.S. CMBS Legalities
• Real Estate Mortgage Investment Conduits (REMIC)– U.S. tax code provision that allows the pooling
and securitization of mortgages. Once pool is formed, not allowed to substitute mortgages.

July 2001 Brent W. Ambrose, University of Kentucky 6
U.S. CMBS Legalities
• Financial Asset Securitization Investment Trust (FASIT)– created in 1997– allows issuers to substitute and add collateral
after securitization• now issuer can add mortgages to pool as they are
originated

July 2001 Brent W. Ambrose, University of Kentucky 7
U.S. CMBS Legalities
FASIT – Allow securitization of a broader class of assets including:
1. construction loans
2. commercial property bridge loans
3. automobile loans
4. credit card receivables
5. home equity loans

July 2001 Brent W. Ambrose, University of Kentucky 8
CMBS Anatomy• Cash Flows• Subordination• Prepayment Penalties• CMBS Risks• Call Protection• Property Diversification• Credit Enhancements• Underwriting• Role of Servicers
July 2001 Brent W. Ambrose, University of Kentucky 9
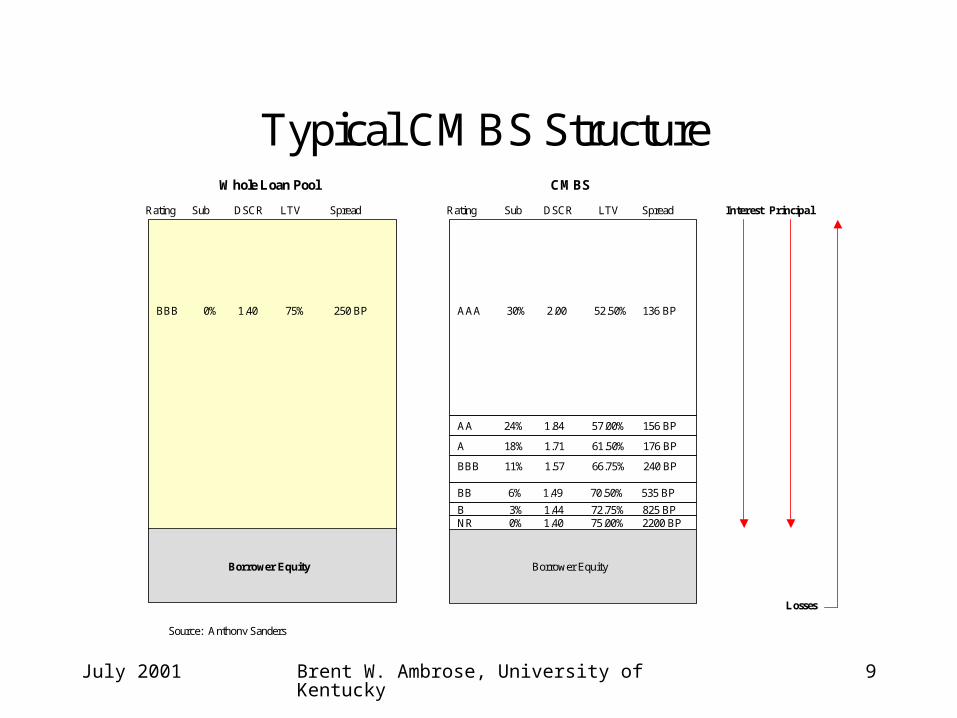
Typical CMBS Structure
Rating Sub DSCR LTV Spread
AAA 30% 2.00 52.50% 136 BP
AA 24% 1.84 57.00% 156 BP
A 18% 1.71 61.50% 176 BP
BBB 11% 1.57 66.75% 240 BP
BB 6% 1.49 70.50% 535 BP
NR 0% 1.40 75.00% 2200 BPB 3% 1.44 72.75% 825 BP
Borrower Equity
Rating Sub DSCR LTV Spread
BBB 0% 1.40 75% 250 BP
Borrower Equity
Whole Loan Pool CMBS
Interest Principal
Losses
Source: Anthony Sanders

July 2001 Brent W. Ambrose, University of Kentucky 10
Actual CMBS Examples
• GMAC Mortgage Pass-through Certificates
• NationsLink Commercial Mortgage Pass-through Certificates Series 1998-1
July 2001 Brent W. Ambrose, University of Kentucky 11
Geographic distribution
California 17.29%New York 12.25%Pennsylvania 7.54%Connecticut 6.07%New Jersey 6.01%Texas 5.41%
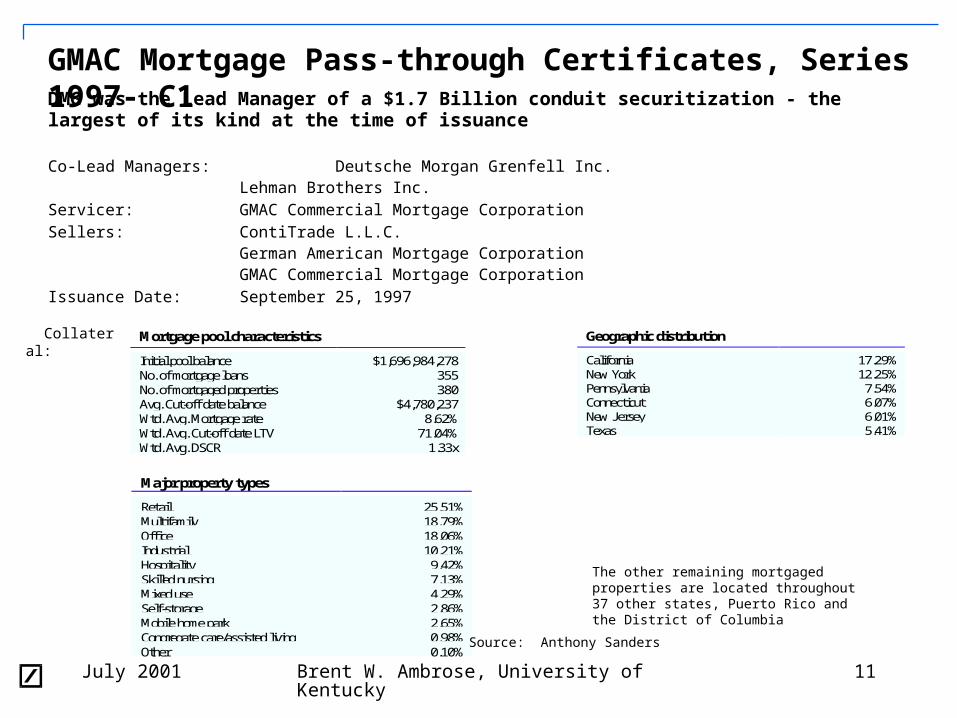
GMAC Mortgage Pass-through Certificates, Series 1997- C1DMG was the Lead Manager of a $1.7 Billion conduit securitization - the largest of its kind at the time of issuance
Co-Lead Managers: Deutsche Morgan Grenfell Inc. Lehman Brothers Inc.
Servicer: GMAC Commercial Mortgage CorporationSellers: ContiTrade L.L.C.
German American Mortgage CorporationGMAC Commercial Mortgage Corporation
Issuance Date: September 25, 1997
Mortgage pool characteristics
Initial pool balance $1,696,984,278No. of mortgage loans 355No. of mortgaged properties 380Avg. Cut-off date balance $4,780,237Wtd. Avg. Mortgage rate 8.62%Wtd. Avg. Cut-off date LTV 71.04%Wtd. Avg. DSCR 1.33x
Major property types
Retail 25.51%Multifamily 18.79%Office 18.06%Industrial 10.21%Hospitality 9.42%Skilled nursing 7.13%Mixed use 4.29%Self-storage 2.86%Mobile home park 2.65%Congregate care/assisted living 0.98%Other 0.10%
The other remaining mortgaged properties are located throughout 37 other states, Puerto Rico and the District of Columbia
Collateral:
Source: Anthony Sanders

July 2001 Brent W. Ambrose, University of Kentucky 12
Class
Initial Cert.Balance or
Notional Amt. Spread
Rating(Moody's/
Fitch)
Percent of Initial Pool Balance Sub-ordination
Initial Pass-Through Rate
(approx.)
WeightedAverage Life
(yrs) Payment Window
A-1 $261, 582,000 48 Ass/AAA 15.4% 28.5% 6.830% 4.00 1 - 75A-2 $227, 661,000 62 Aaa/AAA 13.4% 28.5% 6.853% 7.50 75-108A-3 $724,100,000 65 Aaa/AAA 42.7% 28.5% 6.869% 9.71 108-119B $67,879,000 70 Aa2/AA+ 4.0% 24.5% 6.918% 9.94 119-120C $50,909,000 75 A1/AA 3.0% 21.5% 6.898% 9.96 120-120D $50,909,000 85 A2/A+ 3.0% 18.5% 6.997% 10.01 120-125E $93,334,000 100 Baa2/BBB 5.5% 13.0% 7.085% 11.45 125-158F $25,454,000 118 Baa3/BBB- 1.5% 11.5% 7.222% 13.53 158-170G $84,849,000 BB/BB 5.0% 6.5% 7.414% 14.93 170-195H $59,394,000 B 3.5% 3.0% 6.600% 17.99 195-235J $16,969,000 B- 1.0% 2.0% 6.600% 19.78 235-242K $33,944,278 Unrated 2.0% 0.0% 6.600% 22.0 242-358
X $1,696,984,278 Notional Amt Aaa/AAA N/A N/A 1.629% N/A 1-358
Total $1,696,984,278 Securities
Bonds:
GMAC Mortgage Pass-Through Certificates, Series 1997-C1
Source: Anthony Sanders
July 2001 Brent W. Ambrose, University of Kentucky 13
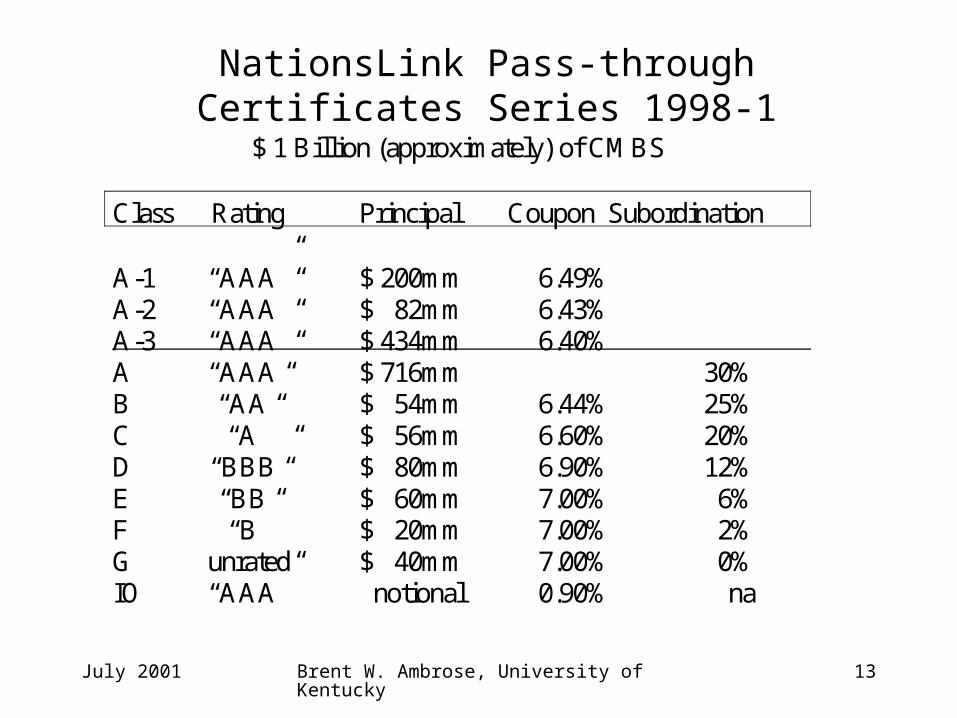
NationsLink Pass-through Certificates Series 1998-1
$ 1 Billion (approximately) of CMBS
Class Rating Principal Coupon Subordination A-1 “AAA” $ 200mm 6.49% 101.00% A-2 “AAA” $ 82mm 6.43% 101.00% A-3 “AAA” $ 434mm 6.40% 101.00% A “AAA” $ 716mm 30% B “AA” $ 54mm 6.44% 25% 101.00% C “A” $ 56mm 6.60% 20% 100.75% D “BBB” $ 80mm 6.90% 12% 100.50% E “BB” $ 60mm 7.00% 6% 85.00% F “B” $ 20mm 7.00% 2% 75.00% G unrated $ 40mm 7.00% 0% 45.00% IO “AAA” notional 0.90% na 4.75%

July 2001 Brent W. Ambrose, University of Kentucky 14
CMBS Anatomy
• Cash flow prioritization:– 1) Principal repayments (both scheduled amortization
and unscheduled prepayments) go to retire senior class debt first.
• CF go to senior classes AAA through BBB
• Intermediate class
• Junior class
• Unrated
• Equity holder
– 2) Coupon interest paid to all classes
July 2001 Brent W. Ambrose, University of Kentucky 15
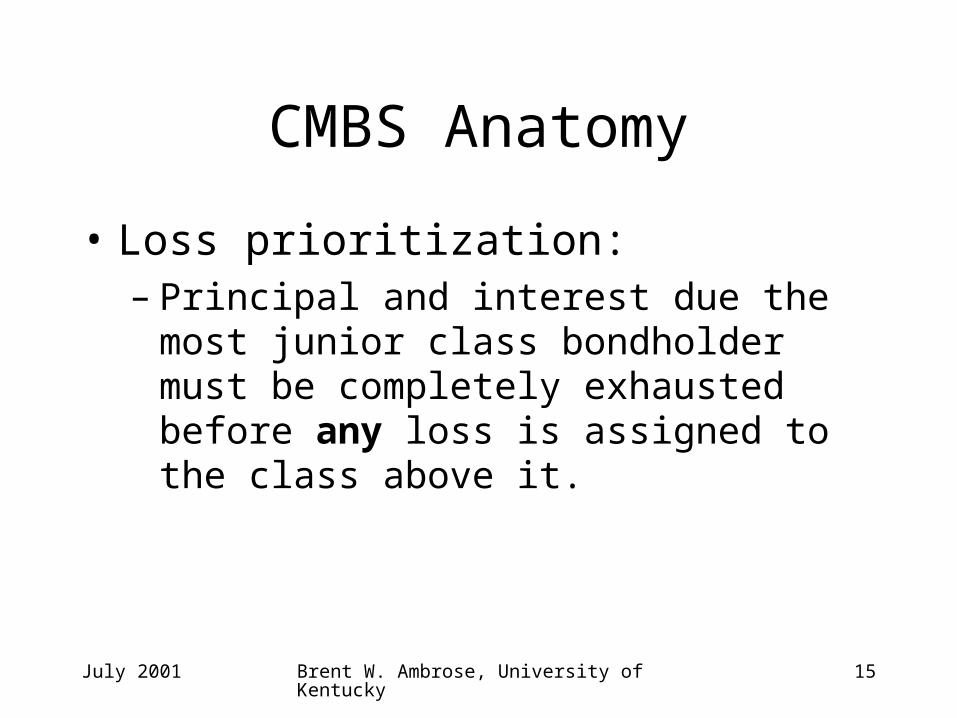
CMBS Anatomy
• Loss prioritization:– Principal and interest due the most junior class
bondholder must be completely exhausted before any loss is assigned to the class above it.

July 2001 Brent W. Ambrose, University of Kentucky 16
The Anatomy of a CMBS
Required Subordination
The required level of subordination is computed as the expected lossin the event of a recession in the real property market. Morespecifically,
required subordination = probability of loss (given a recession) x severity of loss (given a default)
The probability of loss varies from small (say 10%) to large (say50%), depending on the magnitude of the real property recession.The severity of loss is the amount of the loss conditional on a default.For example, a “Class B” real property recession will result in loanlosses with a 10% probability. The severity of the loss is typically20% of the loan balance. Therefore, the required subordination for a“Class B” real property recession is 10% x 20% = 2%.

July 2001 Brent W. Ambrose, University of Kentucky 17
The Anatomy of a CMBS
Example of Required Subordination Level Calculation (NationsLink Example)
Type of Probability x Severity = Required Recession of Loss of Loss Subordination “AAA” 50% x 60% 30% “AA” 45% x 55% 25% “A” 40% x 50% 20% “BBB” 30% x 40% 12% “BB” 20% x 30% 6% “B” 10% x 20% 2%

July 2001 Brent W. Ambrose, University of Kentucky 18
The Anatomy of a CMBS
The Unrated Piece
The unrated piece is used to provide subordination for the lowestrated junior piece.
The size of the unrated bond reflects rating agency requirements forloans that are not cross-collateralized and cross-defaulted.
The unrated piece is sold privately and typically purchased by thespecial servicer.
July 2001 Brent W. Ambrose, University of Kentucky 19
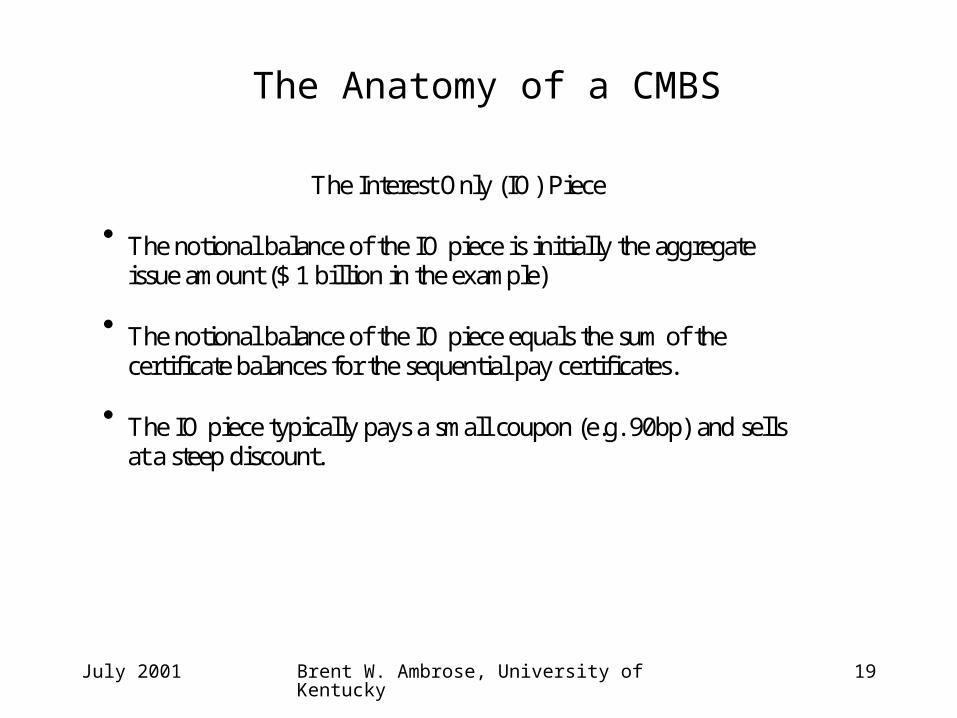
The Anatomy of a CMBS
The Interest Only (IO) Piece
The notional balance of the IO piece is initially the aggregate issue amount ($ 1 billion in the example)
The notional balance of the IO piece equals the sum of the
certificate balances for the sequential pay certificates. The IO piece typically pays a small coupon (e.g. 90bp) and sells
at a steep discount.

July 2001 Brent W. Ambrose, University of Kentucky 20
CMBS Anatomy
• Expected Cash Flows – Review– Principal repayment
• Scheduled amortization• Unscheduled prepayment
– Interest– Penalties
• Hyperamortization• Prepayment Penalty• Balloon Default

July 2001 Brent W. Ambrose, University of Kentucky 21
CMBS Anatomy (Penalties)
A. Hyperamortization (cash trap): • all cash flows in excess of operating expenses go
to retire debt.
• Triggered byi. Delinquency
ii. failure to maintain required DSCR
iii. failure to maintain debt rating
iv. failure to maintain adequate reserves

July 2001 Brent W. Ambrose, University of Kentucky 22
CMBS Anatomy (Penalties)
B. Prepayment penalty: » penalty assessed the borrower for early repayment
of debt.
» Penalty may be computed in various ways.

July 2001 Brent W. Ambrose, University of Kentucky 23
CMBS Anatomy (Penalties)
C. Balloon default: • penalty assessed the borrower for failing to
refinance at the end of the loan term.
July 2001 Brent W. Ambrose, University of Kentucky 24
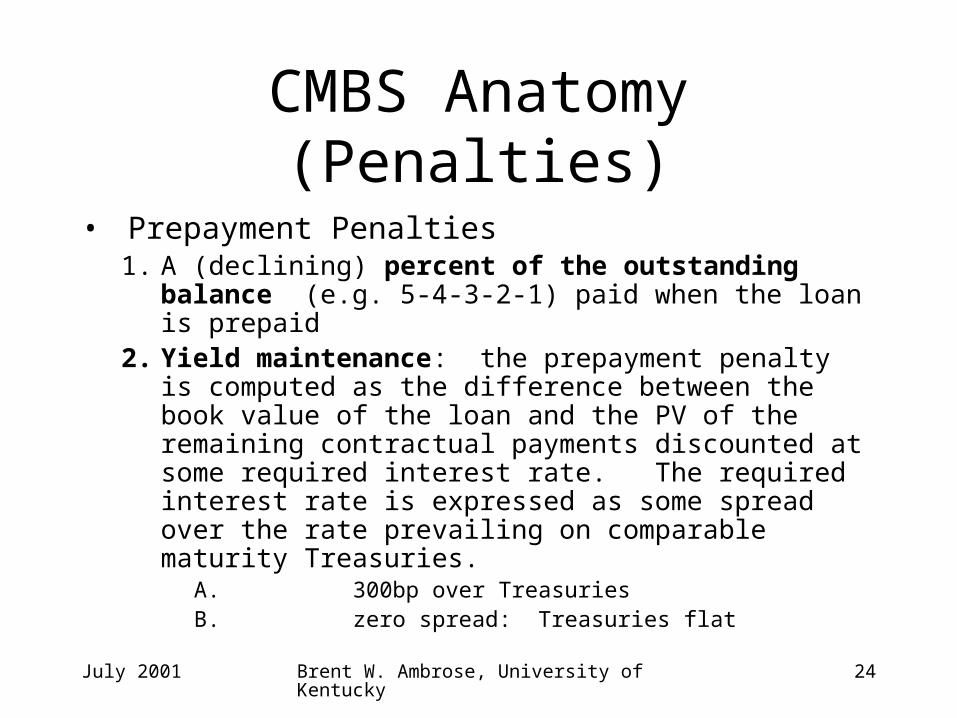
CMBS Anatomy (Penalties)
• Prepayment Penalties1. A (declining) percent of the outstanding balance
(e.g. 5-4-3-2-1) paid when the loan is prepaid2. Yield maintenance: the prepayment penalty is
computed as the difference between the book value of the loan and the PV of the remaining contractual payments discounted at some required interest rate. The required interest rate is expressed as some spread over the rate prevailing on comparable maturity Treasuries.
A. 300bp over TreasuriesB. zero spread: Treasuries flat

July 2001 Brent W. Ambrose, University of Kentucky 25
CMBS Anatomy (Penalties)
• Prepayment Penalties:3. Lockout – complete prohibition of prepayment
of principal. Usually only in effect during the first few years of the mortgage.

July 2001 Brent W. Ambrose, University of Kentucky 26
Simple Prepayment Example
• Mortgage Assumptions:– Two year, $10 million interest only mortgage
• 10% interest rate on the loan at date of issuance
• Loan is repaid after 1 year when interest rates fall to 8%.

July 2001 Brent W. Ambrose, University of Kentucky 27
Simple Prepayment Example
• Prepayment Penalties– Yield Maintenance penalty provision
• Penalty = ($1,000,000 - $800,000) / (1+0.08)
• = $185,185
– Percent of Prepaid Amount penalty provision• Assume 1% penalty in this example
• Penalty = 1% * $10 million = $100,000
July 2001 Brent W. Ambrose, University of Kentucky 28
Allocation of Prepayment Penalties
• Allocation is based on the language in the CMBS prospectus– Ultimately determined by investment bankers
and lawyers during the creation of CMBS– Underwriters have a great deal of latitude– No standard approach exists

July 2001 Brent W. Ambrose, University of Kentucky 29
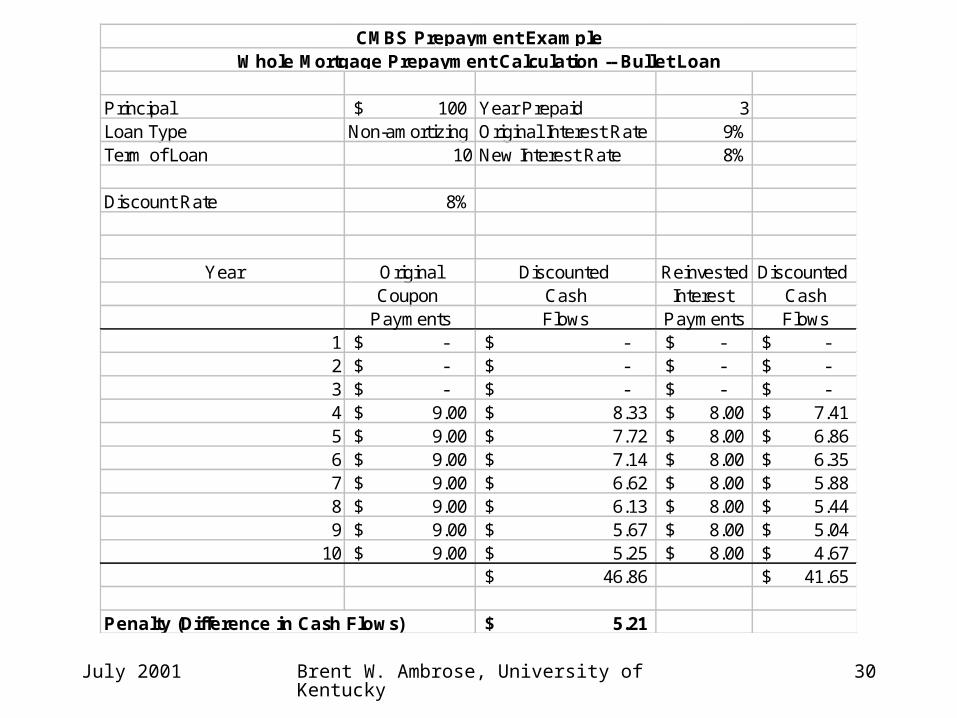
Yield Maintenance Calculations
• One bullet loan tranched into two classes:– Assumptions:
1. Underlying loan is a ten year bullet loan priced at par and pays a 9% coupon
2. Multi-class structure: • Senior class is $90 million and pays an 8% coupon
(priced at par). • Subordinate class is a $10 million classs that pay an 18%
coupon (priced at par).
3. Borrower prepays in full at at year 3. Current interest rates are 100bps lower than in year 0.
July 2001 Brent W. Ambrose, University of Kentucky 30
Principal 100$ Year Prepaid 3Loan Type Non-amortizing Original Interest Rate 9%Term of Loan 10 New Interest Rate 8%
Discount Rate 8%
Year Original Discounted Reinvested Discounted Coupon Cash Interest Cash
Payments Flows Payments Flows1 -$ -$ -$ -$ 2 -$ -$ -$ -$ 3 -$ -$ -$ -$ 4 9.00$ 8.33$ 8.00$ 7.41$ 5 9.00$ 7.72$ 8.00$ 6.86$ 6 9.00$ 7.14$ 8.00$ 6.35$ 7 9.00$ 6.62$ 8.00$ 5.88$ 8 9.00$ 6.13$ 8.00$ 5.44$ 9 9.00$ 5.67$ 8.00$ 5.04$
10 9.00$ 5.25$ 8.00$ 4.67$ 46.86$ 41.65$
Penalty (Difference in Cash Flows) 5.21$
CMBS Prepayment ExampleWhole Mortgage Prepayment Calculation -- Bullet Loan

July 2001 Brent W. Ambrose, University of Kentucky 31
• Allocation of Penalty:
1. Percentage Prepayed Senior Class (90%) 4.69$ Junior Class (10%) 0.52$
5.21$

July 2001 Brent W. Ambrose, University of Kentucky 32
Principal 90$ Year Prepaid 3Loan Type Non-amortizing Original Interest Rate 8%Term of Loan 10 New Interest Rate 7%
Discount Rate 7%
Year Original Discounted Reinvested Discounted Coupon Cash Interest Cash
Payments Flows Payments Flows1 -$ -$ -$ -$ 2 -$ -$ -$ -$ 3 -$ -$ -$ -$ 4 7.20$ 6.73$ 6.30$ 5.89$ 5 7.20$ 6.29$ 6.30$ 5.50$ 6 7.20$ 5.88$ 6.30$ 5.14$ 7 7.20$ 5.49$ 6.30$ 4.81$ 8 7.20$ 5.13$ 6.30$ 4.49$ 9 7.20$ 4.80$ 6.30$ 4.20$
10 7.20$ 4.48$ 6.30$ 3.92$ 38.80$ 33.95$
Penalty (Difference in Cash Flows) 4.85$
Using a Make-whole CalculationSenior Tranche

July 2001 Brent W. Ambrose, University of Kentucky 33
Principal 10$ Year Prepaid 3Loan Type Non-amortizing Original Interest Rate 18%Term of Loan 10 New Interest Rate 17%
Discount Rate 17%
Year Original Discounted Reinvested Discounted Coupon Cash Interest Cash
Payments Flows Payments Flows1 -$ -$ -$ -$ 2 -$ -$ -$ -$ 3 -$ -$ -$ -$ 4 1.80$ 1.54$ 1.70$ 1.45$ 5 1.80$ 1.31$ 1.70$ 1.24$ 6 1.80$ 1.12$ 1.70$ 1.06$ 7 1.80$ 0.96$ 1.70$ 0.91$ 8 1.80$ 0.82$ 1.70$ 0.78$ 9 1.80$ 0.70$ 1.70$ 0.66$
10 1.80$ 0.60$ 1.70$ 0.57$ 7.06$ 6.67$
Penalty (Difference in Cash Flows) 0.39$ Total Penalty Payment (Junior + Senior) 5.24$ Difference in Penalty Payments (0.04)$
Using a Make-whole CalculationJunior Tranche
July 2001 Brent W. Ambrose, University of Kentucky 34
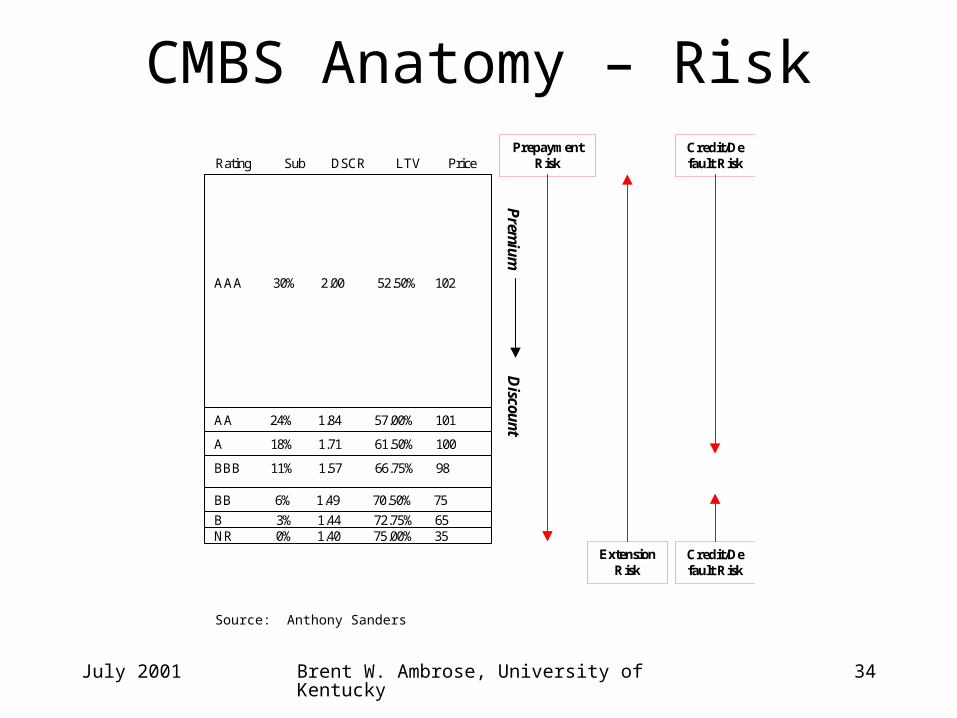
CMBS Anatomy – Risk
Rating Sub DSCR LTV Price
AAA 30% 2.00 52.50% 102
AA 24% 1.84 57.00% 101
A 18% 1.71 61.50% 100
BBB 11% 1.57 66.75% 98
BB 6% 1.49 70.50% 75
NR 0% 1.40 75.00% 35B 3% 1.44 72.75% 65
PrepaymentRisk
ExtensionRisk
Credit/Default Risk
Prem
iumD
iscount
Credit/Default Risk
Source: Anthony Sanders
July 2001 Brent W. Ambrose, University of Kentucky 35
CMBS Anatomy
• CMBS Risk impacted by:– property quality– geographic location– tenant creditworthiness

July 2001 Brent W. Ambrose, University of Kentucky 36
CMBS Risks
• Default risk: – Income property loans are typically
nonrecourse.• Borrower has the financial incentive to default when
the market value of the property falls below the outstanding balance of the loan (negative equity).
• Also referred to as “optimal”, “strategic”, or “financial” default.

July 2001 Brent W. Ambrose, University of Kentucky 37
CMBS Risks
• Balloon risk: – income property mortgages typically have
terms that are less than the loan amortization period, thus the borrower must refinance to continue making mortgage payments.
– Circumstances in the property and capital markets may have changed in ways that make refinancing difficult or even impossible.
• Also referred to as “refinancing risk”

July 2001 Brent W. Ambrose, University of Kentucky 38
CMBS Risks
• Prepayment risk: – Many income property mortgages provide some
call protection.• lock-out provisions
• prepayment penalties
• Treasury defeasance
– Some income property mortgages do not have any of these features.

July 2001 Brent W. Ambrose, University of Kentucky 39
CMBS Call Protection
• Lock-out provisions:– prohibit loan prepayment over given period
• Prepayment penalties: – paid in a lump sum at the time of prepayment; – Cash flows are proportionally allocated to
remaining certificate classes.• See previous examples of a (declining) percent of
the outstanding loan balance or yield maintenance agreements
July 2001 Brent W. Ambrose, University of Kentucky 40
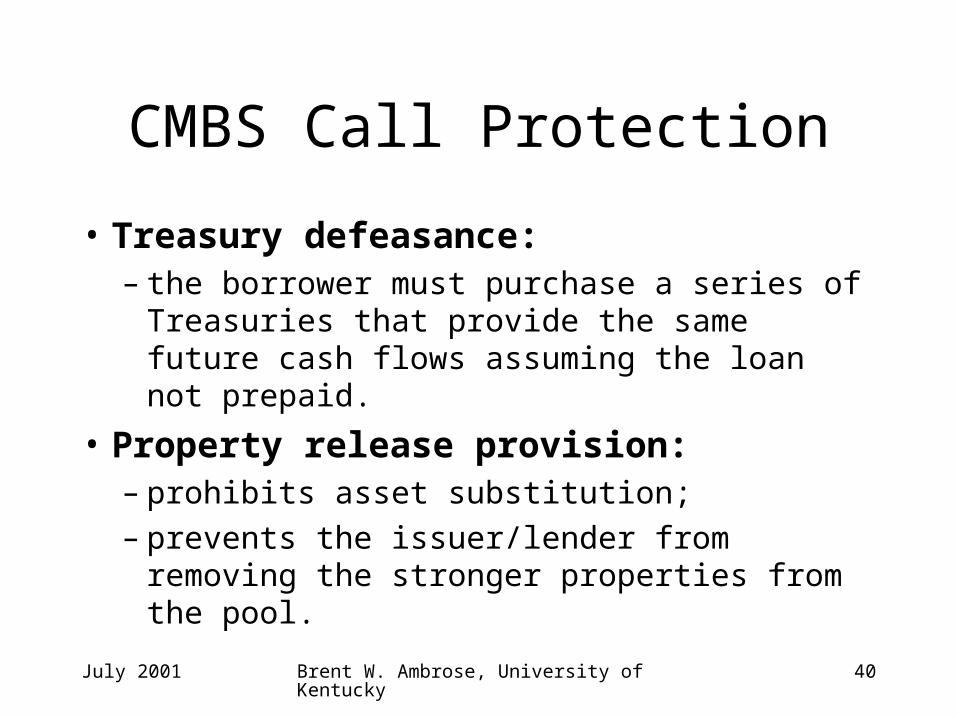
CMBS Call Protection
• Treasury defeasance:– the borrower must purchase a series of
Treasuries that provide the same future cash flows assuming the loan not prepaid.
• Property release provision: – prohibits asset substitution;– prevents the issuer/lender from removing the
stronger properties from the pool.

July 2001 Brent W. Ambrose, University of Kentucky 41
Property Diversification
• Diversification across:– Loan size:
• usually no single loan exceeds 5% of the aggregate issue amount.
• An exception to this is a fusion deal, where a single large loan is packaged with several smaller loans.
– Property type
– Property location• State
• metropolitan area

July 2001 Brent W. Ambrose, University of Kentucky 42
Table 2. The twenty largest loans underlying the GMAC 1999-C3 deal.
Name Location, MSA Category Loan Amount 1 Biltmore Fashion Phoenix, Arizona Retail $80,000,000 2 Prime Outlets Niagara Falls, New York Retail $62,835,426 3 Equity Inns Various Hotel $46,511,317 4 One Colorado Pasadena, California Retail $42,628,093 5 Comerica Bank San Jose, California Office $33,640,510 6 120 Monument Indianapolis, Indiana Office $28,955,362 7 125 Maiden New York, New York Office $28,500,000 8 Texas Development Houston, Texas Apartment $26,926,701 9 Sherman Plaza Van Nuys, California Office $25,984,904 10 Alliance TP Various Apartment $24,888,157 11 Bush Tower New York, New York Office $23,000,000 12 County Line Jackson, Mississippi Retail $20,990,264 13 Sherwood Lakes Schererville, Indiana Apartment $20,162,442 14 Laurel Portfolio Various Apartment $17,950,331 15 Sweet Paper Various Warehouse $17,420,000 16 Sheraton Portsmouth Portsmouth, New Hampshire Hotel $15,949,087 17 Trinity Commons Fort Worth, Texas Retail $15,242,981 18 Village Square Indianapolis, Indiana Apartment $14,993,950 19 Golden Books Fayetteville, North Carolina Warehouse $14,493,350 20 Air Touch Dublin, Ohio Office $13,992,523
Source: Charter Research.
Loan Diversification

July 2001 Brent W. Ambrose, University of Kentucky 43
Table 4. Aggregate loan amounts by state for GMAC 1999-C3 deal.
State Loan Amount No. of Loans % of Pool California $257,522,410 33 22.35% Texas $162,355,125 26 14.09% New York $130,070,471 7 11.29% Arizona $99,942,794 5 8.68% Indiana $68,623,516 5 5.96% Ohio $44,982,528 5 3.90% Mississippi $23,067,864 2 2.00% New Jersey $22,983,973 5 2.00% Other $342,473,371 50 29.73%
Total $1,152,022,052 138 100.00%
Source: Charter Research.
Geographic Diversification

July 2001 Brent W. Ambrose, University of Kentucky 44
Table 5. Aggregate loan amounts by property type for GMAC 1999-C3 deal.
Property Type Loan Amount No. of Loans % of Pool
Apartment $259,779,802 39 22.55% Office $322,053,844 36 27.96% Retail $350,683,062 34 30.44% Warehouse $99,126,075 15 8.60% Hotel $105,832,139 8 9.19% Other $14,547,130 6 1.26%
Total $1,152,022,052 138 100.00%
Source: Charter Research.
Property Type Diversification

July 2001 Brent W. Ambrose, University of Kentucky 45
Credit Enhancements
• Subordination
• Cross collateralization: – properties that collateralize individual loans are
pledged against all loans in the pool
• Cross default:– allows the lender to call ALL LOANS in the
event a single loan is in default.

July 2001 Brent W. Ambrose, University of Kentucky 46
Credit Enhancements• Lock box:
– Gives the trustee control of the property gross revenues. The trustee assigns priority in the following order:
• (1) taxes and insurance;
• (2) operating expenses;
• (3) debt service;
• (4) management fees;
• (5) reserves for replacements;
• (6) equity investor

July 2001 Brent W. Ambrose, University of Kentucky 47
Credit Enhancements
• Overcollateralization: – When the book value of the loans exceed the
par value of the bonds issued.– Most common in residential MBS
• Especially common in CMO structure

July 2001 Brent W. Ambrose, University of Kentucky 48
Reserve Funds
• Established at loan closing to:– Provide liquidity:
• to pay interest for investment grade bonds
– Service the asset: • to pay
– property taxes
– property insurance
– legal fees
– Maintenance

July 2001 Brent W. Ambrose, University of Kentucky 49
Standardized CMBS Underwriting
• Key Underwriting Characteristics– Debt Service Coverage Ratio (DSCR)– Loan to Value Ratio (LTV)– Average loan size– Max loan not to exceed certain percentage (e.g. 5%)– Diversification across
• Property types• Geographic locations
– Prepayment terms– Loan maturities

July 2001 Brent W. Ambrose, University of Kentucky 50
Role of rating agencies
• Establish different rating criteria for various property types.
• Negotiate subordination levels with issuers.• Track property performance/delinquencies• Servicer and trustee report ongoing loan level
performance– Monthly/quarterly DSCRs– occupancy levels– updated bond information

July 2001 Brent W. Ambrose, University of Kentucky 51
Role of Servicers
• Master Servicer:– Oversees the deal and servicing agreements– Facilitates timely payment of principal and
interest– May provide (servicer) advances for
delinquent/defaulted loans
• Sub-Servicer: – loan originator in a conduit deal who retains
servicing
July 2001 Brent W. Ambrose, University of Kentucky 52
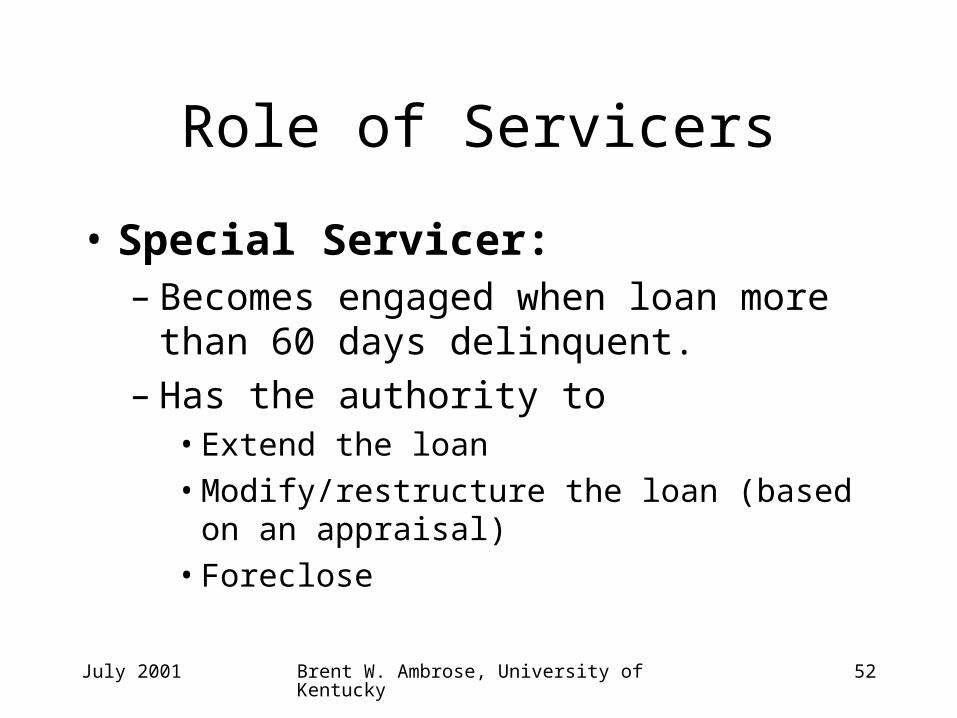
Role of Servicers
• Special Servicer:– Becomes engaged when loan more than 60 days
delinquent.– Has the authority to
• Extend the loan
• Modify/restructure the loan (based on an appraisal)
• Foreclose
July 2001 Brent W. Ambrose, University of Kentucky 53
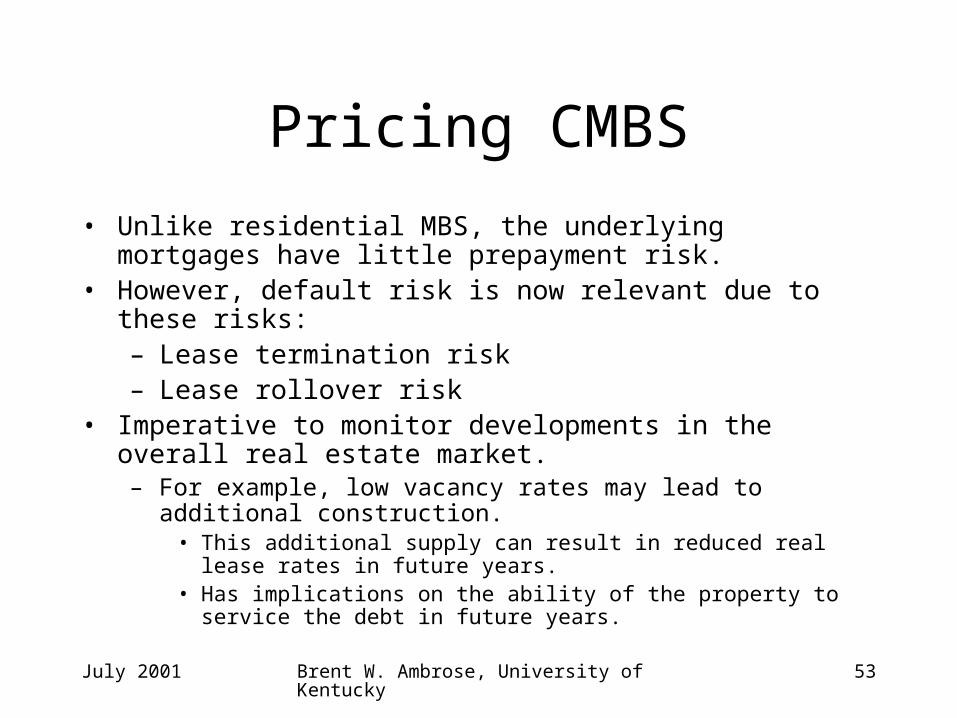
Pricing CMBS
• Unlike residential MBS, the underlying mortgages have little prepayment risk.
• However, default risk is now relevant due to these risks:– Lease termination risk– Lease rollover risk
• Imperative to monitor developments in the overall real estate market.– For example, low vacancy rates may lead to additional construction.
• This additional supply can result in reduced real lease rates in future years.
• Has implications on the ability of the property to service the debt in future years.

July 2001 Brent W. Ambrose, University of Kentucky 54
Pricing CMBS
• Rating agencies play a critical role in the CMBS pricing process.– S&P, Moodys, and Duff & Phelps maintain internal models of
collateral risk in order to rate default risk associated with CMBS deals.
• In addition to having to price deals in accordance with rating agency opinions, it is wise to understand the underlying real estate markets in order to anticipate payments delays or defaults. – Example. Lease rates and vacancy rates may look great at
the moment, but will these indicators prompt developers/banks into another frenzy of construction?

July 2001 Brent W. Ambrose, University of Kentucky 55
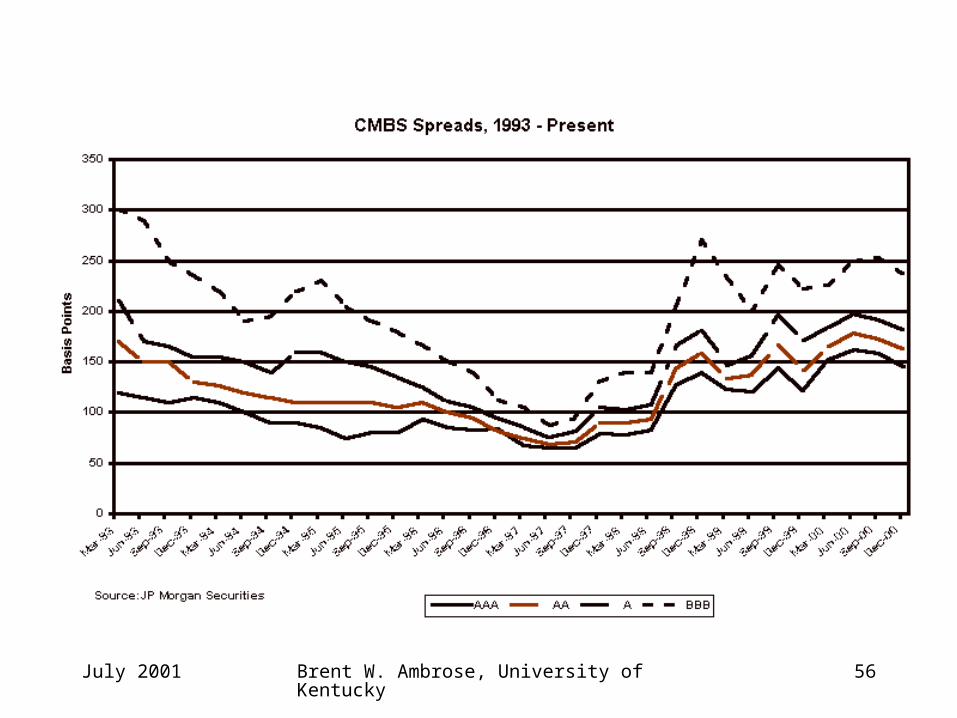
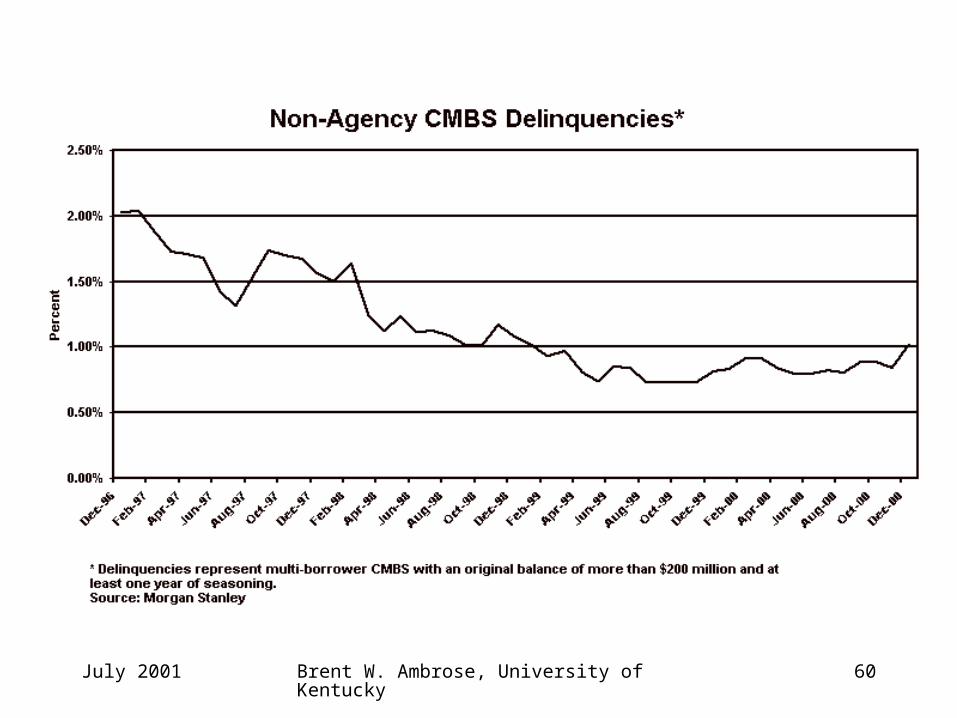
Pricing CMBS
• Remember – CMBS product is part of the fixed-income universe.– Capital markets are linked such that
shocks in one market impact others.• For example – Russian debt crises in
1998– See following charts.
July 2001 Brent W. Ambrose, University of Kentucky 56

July 2001 Brent W. Ambrose, University of Kentucky 57
NCREIF Total Returns
-0.05
-0.04
-0.03
-0.02
-0.01
0
0.01
0.02
0.03
0.04
1990 1991 1992 1993 1994 1995 1996 1997 1998 1999 2000 2001
Date
Re
turn

July 2001 Brent W. Ambrose, University of Kentucky 58

July 2001 Brent W. Ambrose, University of Kentucky 59
July 2001 Brent W. Ambrose, University of Kentucky 60

July 2001 Brent W. Ambrose, University of Kentucky 61
Bond Market Yields
0
2
4
6
8
10
12
Jan-90 Jan-91 Jan-92 Jan-93 Jan-94 Jan-95 Jan-96 Jan-97 Jan-98 Jan-99 Jan-00 Jan-01
Date
%
AAA
BBB
Treas

July 2001 Brent W. Ambrose, University of Kentucky 62
Bond SpreadsBond Credit Spreads
0
0.5
1
1.5
2
2.5
3
Jan-90 Jan-91 Jan-92 Jan-93 Jan-94 Jan-95 Jan-96 Jan-97 Jan-98 Jan-99 Jan-00 Jan-01
Date
Sp
rea
d
AAA
BBB
July 2001 Brent W. Ambrose, University of Kentucky 63
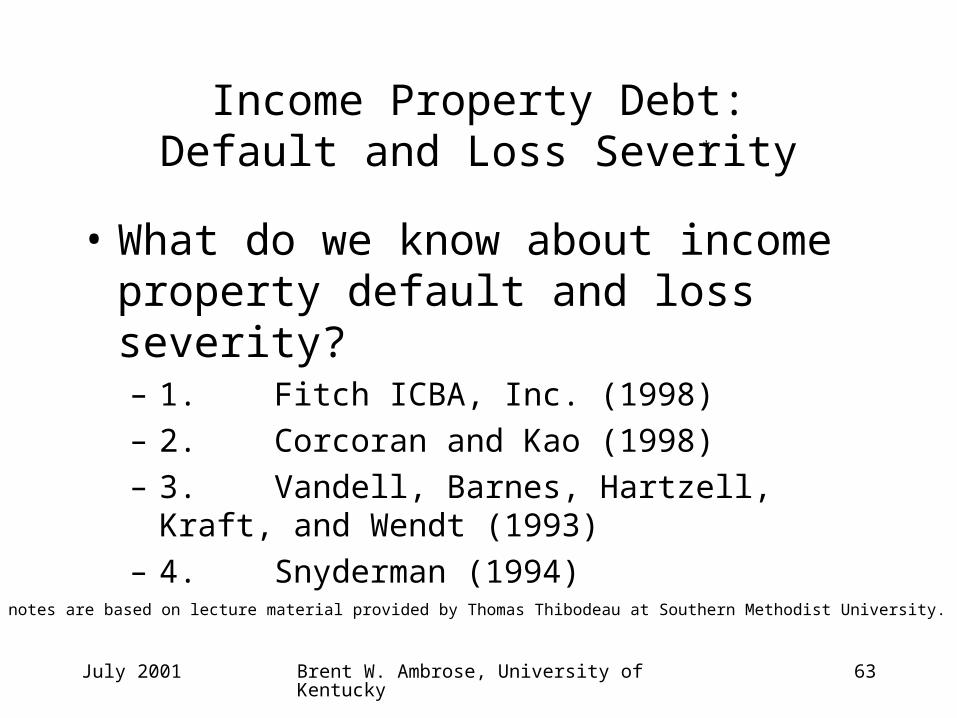
Income Property Debt:Default and Loss Severity
• What do we know about income property default and loss severity?– 1. Fitch ICBA, Inc. (1998)
– 2. Corcoran and Kao (1998)
– 3. Vandell, Barnes, Hartzell, Kraft, and Wendt (1993)
– 4. Snyderman (1994)
*
*-these notes are based on lecture material provided by Thomas Thibodeau at Southern Methodist University.
July 2001 Brent W. Ambrose, University of Kentucky 64
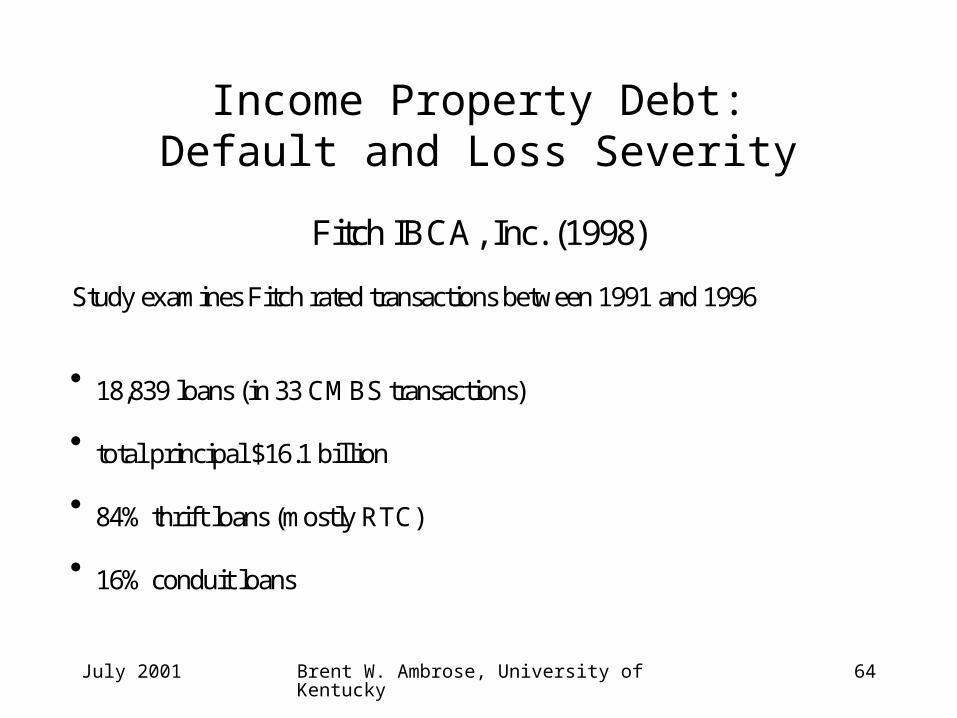
Income Property Debt:Default and Loss Severity
Fitch IBCA, Inc. (1998)
Study examines Fitch rated transactions between 1991 and 1996
18,839 loans (in 33 CMBS transactions)
total principal $16.1 billion
84% thrift loans (mostly RTC)
16% conduit loans

July 2001 Brent W. Ambrose, University of Kentucky 65
Income Property Debt:Default and Loss Severity
Fitch IBCA, Inc. (1998)
Examines relationship between default/loss severity and:
Debt service coverage ratio (DSCR) Property type State Loan Size Fixed/floating rate loan Loan type (e.g. amortizing, balloon) Servicer flexibility Foreclosure type
July 2001 Brent W. Ambrose, University of Kentucky 66
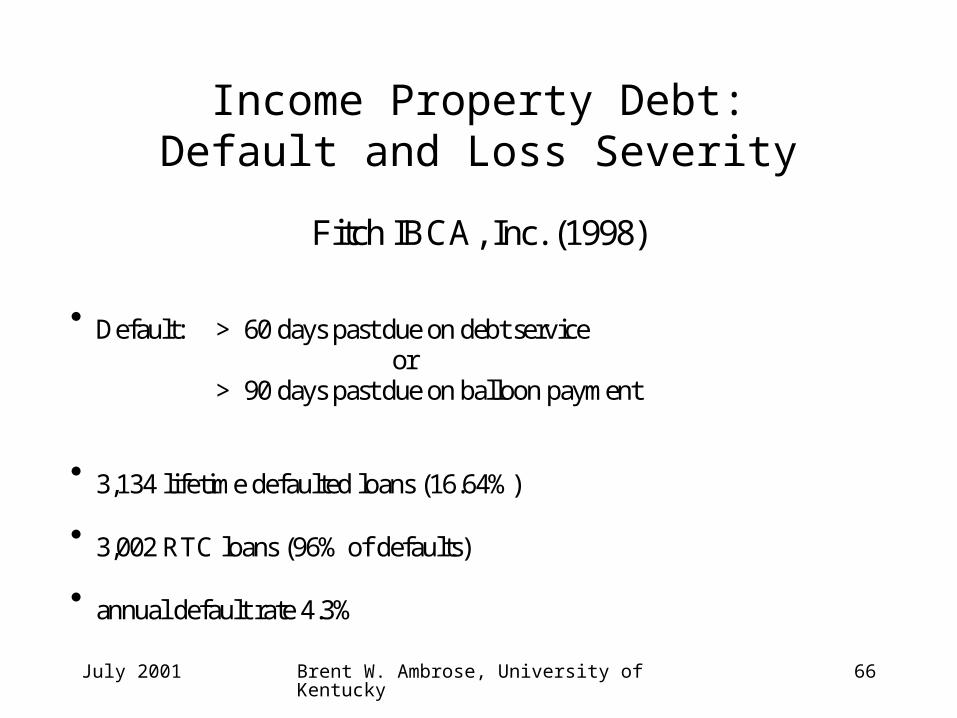
Income Property Debt:Default and Loss Severity
Fitch IBCA, Inc. (1998)
Default: > 60 days past due on debt service or
> 90 days past due on balloon payment
3,134 lifetime defaulted loans (16.64%)
3,002 RTC loans (96% of defaults)
annual default rate 4.3%

July 2001 Brent W. Ambrose, University of Kentucky 67
Income Property Debt:Default and Loss Severity
Fitch IBCA, Inc. (1998)
Loss = loan balance at securitization+ interest advanced+ property protection expenses- loan amortization- property income- net sales proceeds
Losses reported as a percent of loan balance at securitization for loansCOMPLETELY resolved (e.g. properties sold).

July 2001 Brent W. Ambrose, University of Kentucky 68
Income Property Debt:Default and Loss Severity
Fitch IBCA, Inc. (1998)
Source of losses:
Decrease in property value 35.8%+ advanced interest 10.5%+ advanced property protection expenses 7.7%- amortization- property income (combined) 14.9%
Average Loss Rate: 39.1%

July 2001 Brent W. Ambrose, University of Kentucky 69
Income Property Debt:Default and Loss Severity
Fitch IBCA, Inc. (1998)
DSCR Default Rate Loss
0.01-0.49 8.0% 47%0.50-0.79 7.0% 52%0.80-0.89 6.6% 42%0.90-0.99 6.5% 41%1.00-1.14 4.4% 29%1.15-1.24 2.6% 48%1.25-1.34 2.4% 27%1.35-1.49 2.8% 36%1.50-1.74 3.1% 41% 1.75+ 2.9% 22%

July 2001 Brent W. Ambrose, University of Kentucky 70
Income Property Debt:Default and Loss Severity
Fitch IBCA, Inc. (1998)
Property Type Default Rate Loss
Lodging 4.2% 27%Multifamily 3.9% 46%Nursing 4.0% 11%Office 4.8% 38%Industrial 4.7% 27%Other 4.2% 46%Retirement 4.7% 34%Warehouse 2.5% 29%

July 2001 Brent W. Ambrose, University of Kentucky 71
Income Property Debt:Default and Loss Severity
Fitch IBCA, Inc. (1998)
State Default Rate Loss
Highest 5: New York 6.8% 32%Louisianna 5.8% 69%New Mexico 5.5% 25%Arizona 5.2% 22%Massachusetts 5.2% 40%
Lowest 5: Iowa 3.5% 65%Florida 3.1% 44%Texas 3.1% 45%Washington 2.4% 25%Oregon 1.9% 34%
July 2001 Brent W. Ambrose, University of Kentucky 72
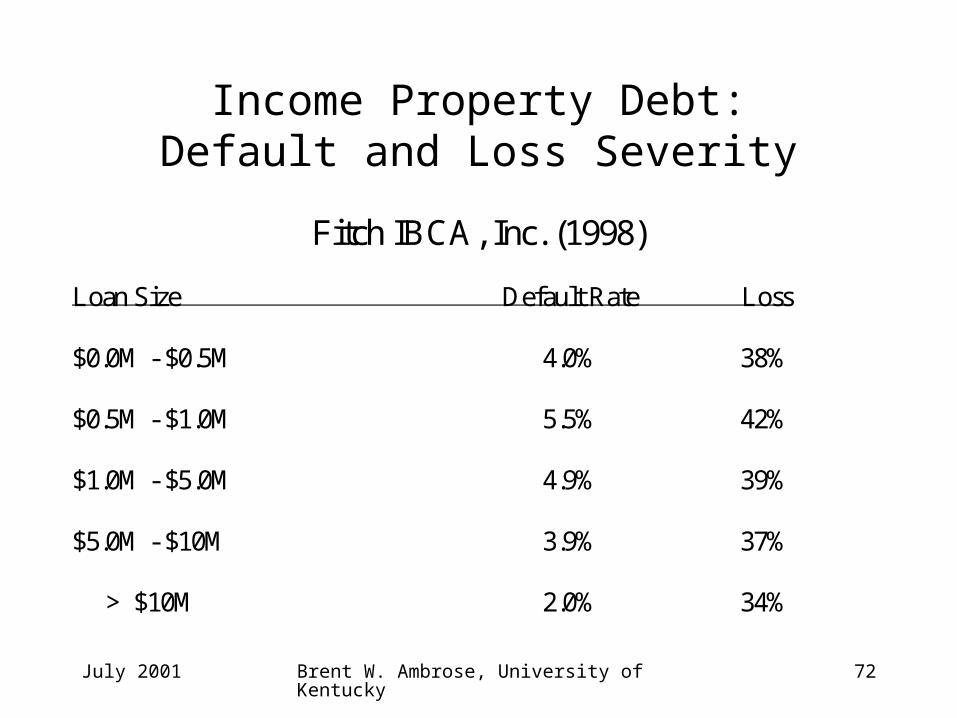
Income Property Debt:Default and Loss Severity
Fitch IBCA, Inc. (1998)
Loan Size Default Rate Loss
$0.0M - $0.5M 4.0% 38%
$0.5M - $1.0M 5.5% 42%
$1.0M - $5.0M 4.9% 39%
$5.0M - $10M 3.9% 37%
> $10M 2.0% 34%
July 2001 Brent W. Ambrose, University of Kentucky 73
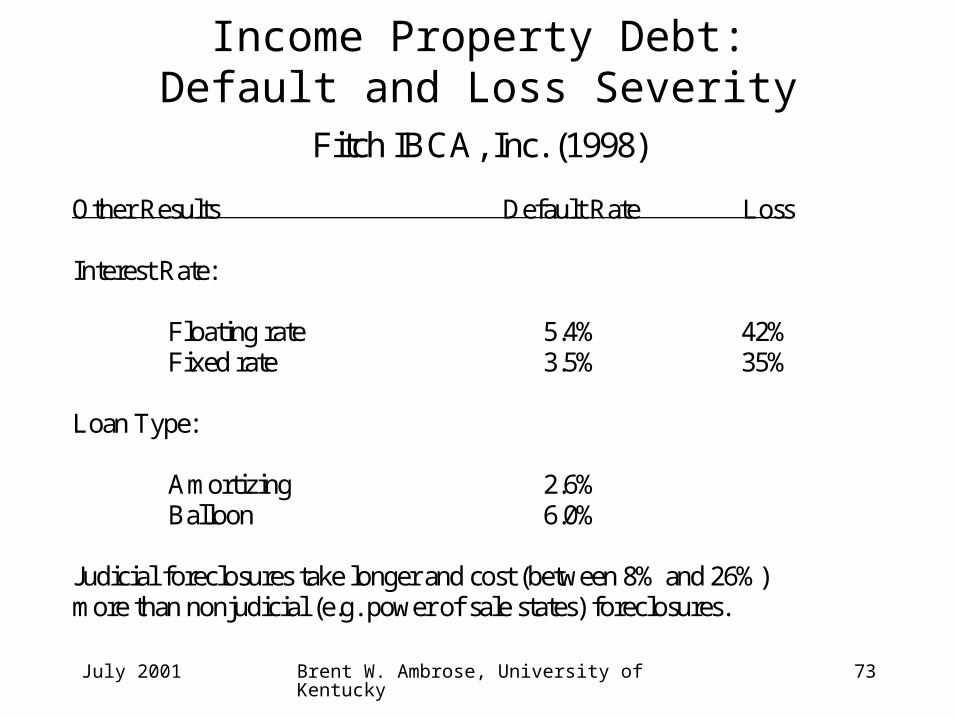
Income Property Debt:Default and Loss Severity
Fitch IBCA, Inc. (1998)
Other Results Default Rate Loss
Interest Rate:
Floating rate 5.4% 42%Fixed rate 3.5% 35%
Loan Type:
Amortizing 2.6%Balloon 6.0%
Judicial foreclosures take longer and cost (between 8% and 26%)more than nonjudicial (e.g. power of sale states) foreclosures.

July 2001 Brent W. Ambrose, University of Kentucky 74
Income Property Debt:Default and Loss Severity
Vandell et. al. (1993)
Use a proportional hazards model to examine the joint effect of loan,borrower, property and market characteristics on the length of time todefault.
The hazard function is the conditional probability of default in the nextperiod given the loan is currently a performing loan.
Data: 2,899 completed loans originated during 1962-1989:3 period175 defaults (6%)
Use the Frank Russell Company Index to market property values tomarket over time.

July 2001 Brent W. Ambrose, University of Kentucky 75
Income Property Debt:Default and Loss Severity
Vandell et. al. (1993) Estimation results: Higher L/V higher default rate Higher interest rate higher default rate DSCR is not a contributing influence All property types have higher default rates RELATIVE TO RETAIL
Greatest risk: hotel, office, apartment Least risk: retail, industrial
Partnerships exhibit greater default risk compared to alternatives

July 2001 Brent W. Ambrose, University of Kentucky 76
Income Property Debt:Default and Loss Severity
Snyderman (1994)
Snyderman examines:
(1) incidence of lifetime default for 10,955 Insurance Co. loans:a. originated between 1972 and 1989b. tracked over 1972-1991 periodc. 1,512 lifetime defaults (13.8%)
(2) severity of losses:a. defaults that end in foreclosure (46% of defaults)b. defaults resolved some other way (e.g. workout)
(3) estimates “yield cost” of default between 31 and 52 basis points
July 2001 Brent W. Ambrose, University of Kentucky 77
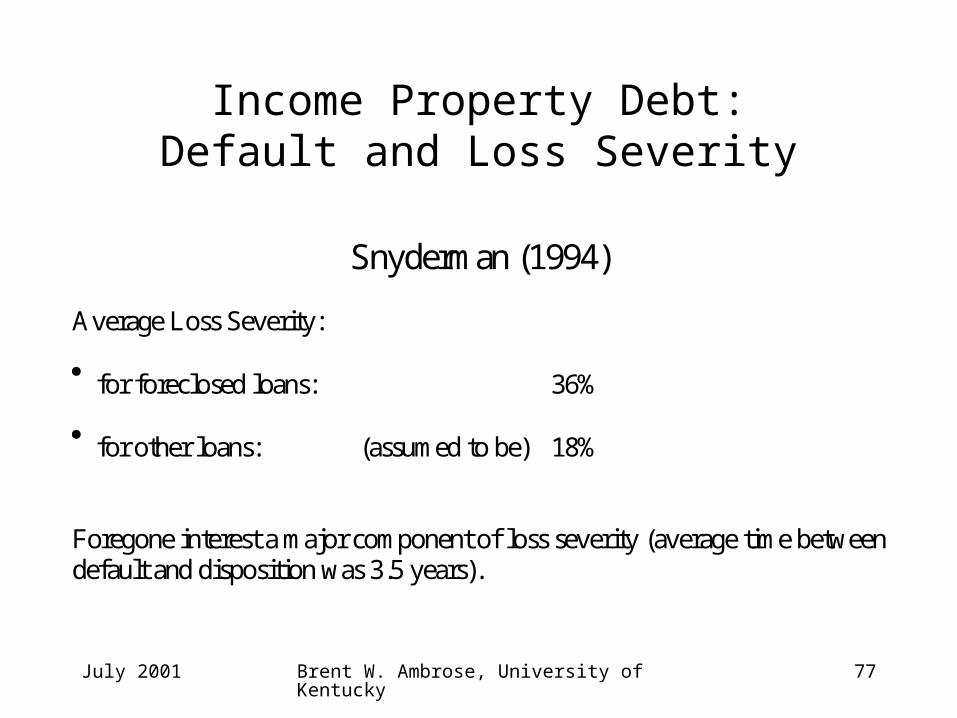
Income Property Debt:Default and Loss Severity
Snyderman (1994)
Average Loss Severity:
for foreclosed loans: 36%
for other loans: (assumed to be) 18%
Foregone interest a major component of loss severity (average time betweendefault and disposition was 3.5 years).
July 2001 Brent W. Ambrose, University of Kentucky 78
Income Property Debt:Default and Loss Severity
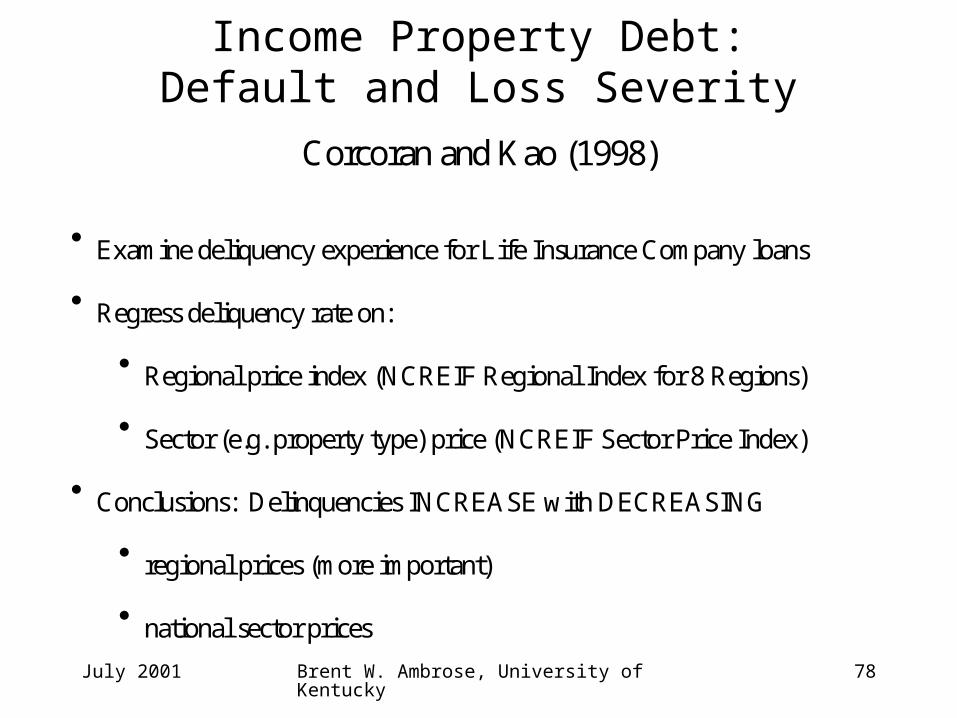
Corcoran and Kao (1998)
Examine deliquency experience for Life Insurance Company loans
Regress deliquency rate on:
Regional price index (NCREIF Regional Index for 8 Regions)
Sector (e.g. property type) price (NCREIF Sector Price Index)
Conclusions: Delinquencies INCREASE with DECREASING
regional prices (more important)
national sector prices
July 2001 Brent W. Ambrose, University of Kentucky 79
Income Property Debt:Default and Loss Severity
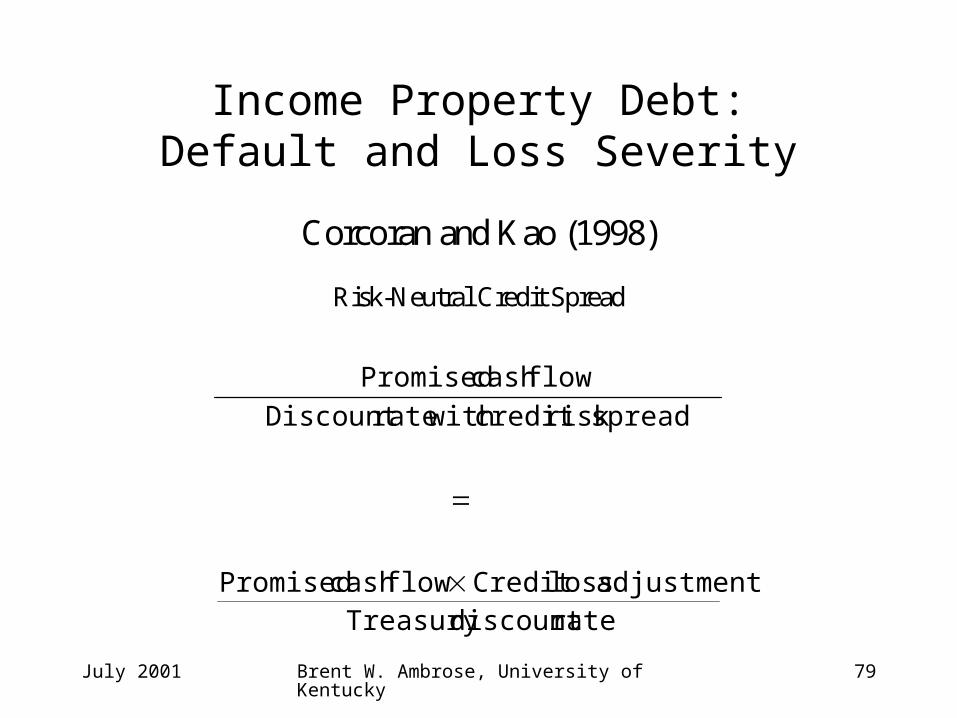
Corcoran and Kao (1998)
Risk-Neutral Credit Spread
ratediscount Treasury adjustment lossCredit flowcash Promised
spreadrisk credit with rateDiscount
flowcash Promised
July 2001 Brent W. Ambrose, University of Kentucky 80
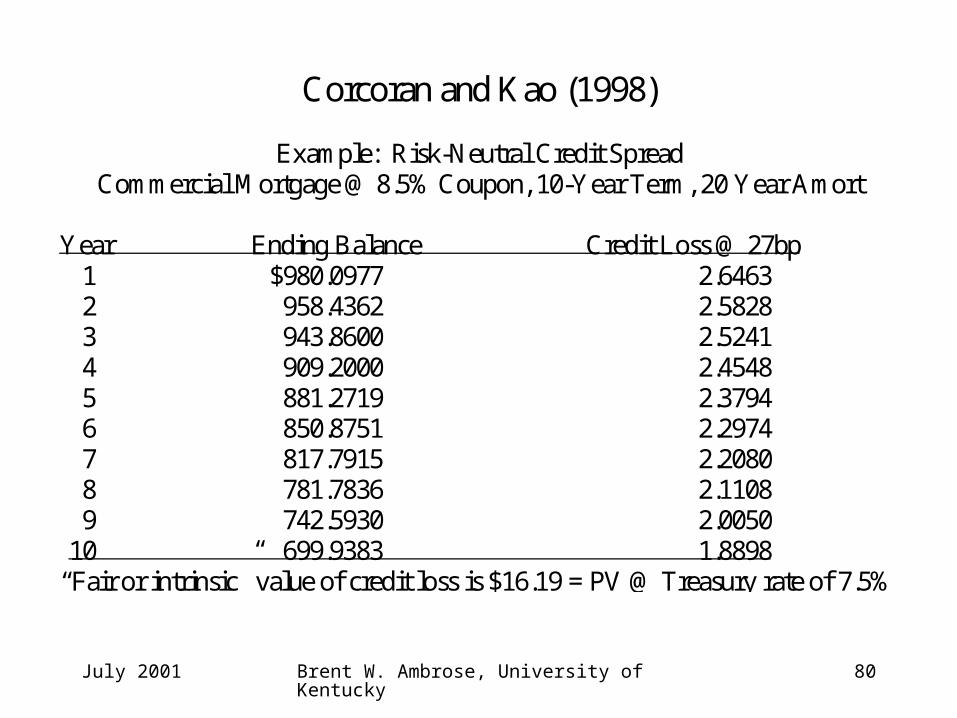
Corcoran and Kao (1998)
Example: Risk-Neutral Credit SpreadCommercial Mortgage @ 8.5% Coupon, 10-Year Term, 20 Year Amort
Year Ending Balance Credit Loss @ 27bp1 $980.0977 2.64632 958.4362 2.58283 943.8600 2.52414 909.2000 2.45485 881.2719 2.37946 850.8751 2.29747 817.7915 2.20808 781.7836 2.11089 742.5930 2.0050
10 699.9383 1.8898“Fair or intrinsic” value of credit loss is $16.19 = PV @ Treasury rate of 7.5%

July 2001 Brent W. Ambrose, University of Kentucky 81
Default and Loss Severity
• To summarize, the studies show that:– Commercial mortgage default estimates are
highly dependent upon the data source.– Most CMBS deals were originated during
period of unprecedented economic growth and expansion.
• Loans have not been tested through full economic cycle.

July 2001 Brent W. Ambrose, University of Kentucky 82
Rating CMBSs
• Property Cash Flow Adjustments
• Capitalization Rate Adjustments
• Pool analysis
• Ideal Pool for Small Income Property Loans

July 2001 Brent W. Ambrose, University of Kentucky 83
Rating CMBSsProperty Cash Flow Adjustments
Rental income = min {contract rent, market rent}
Non-rental income = frequently ignored
Vacancy loss = max {actual, market, 10%}
Operating expenses = max {historical, industry standards, appraisal}
Management fees = max {historical, appraisal, 5% for MF}= max {historical, appraisal, 4% for commercial}
Capital reserves = $250 - $450 per unit for MF= $0.15 - $0.30 per square foot for office= $0.15 - $0.25 psf for retail= 4-5% of Gross Revenues for hotel

July 2001 Brent W. Ambrose, University of Kentucky 84
Rating CMBSs
Property Cash Flow Adjustments
Sources of Information for Industry Standard Operating Expenses
(1) Building Owners and Managers Association (BOMA)
(2) Institute of Real Estate Management (IREM)
(3) Urban Land Institute (ULI)a. Dollars and cents of shopping centersb. Dollars and cents of retailc. Etc.

July 2001 Brent W. Ambrose, University of Kentucky 85
Rating CMBSs
Property Cash Flow Adjustments
Expected property cash flows also adjusted for:
(1) Average lease term (by property type)
(2) Tenant retention (50-60%)a. new tenant improvementsb. renewal tenant improvements
(3) Leasing commissionsa. new leasing commissions (4-6%)b. renewal leasing commissions (varies by property type)

July 2001 Brent W. Ambrose, University of Kentucky 86
Rating CMBSs
Property Cash Flow Adjustments
Financing cash flows adjustments:
(1) below market interest rates increased
(2) loan term adjusted for remaining economic life of the property
July 2001 Brent W. Ambrose, University of Kentucky 87
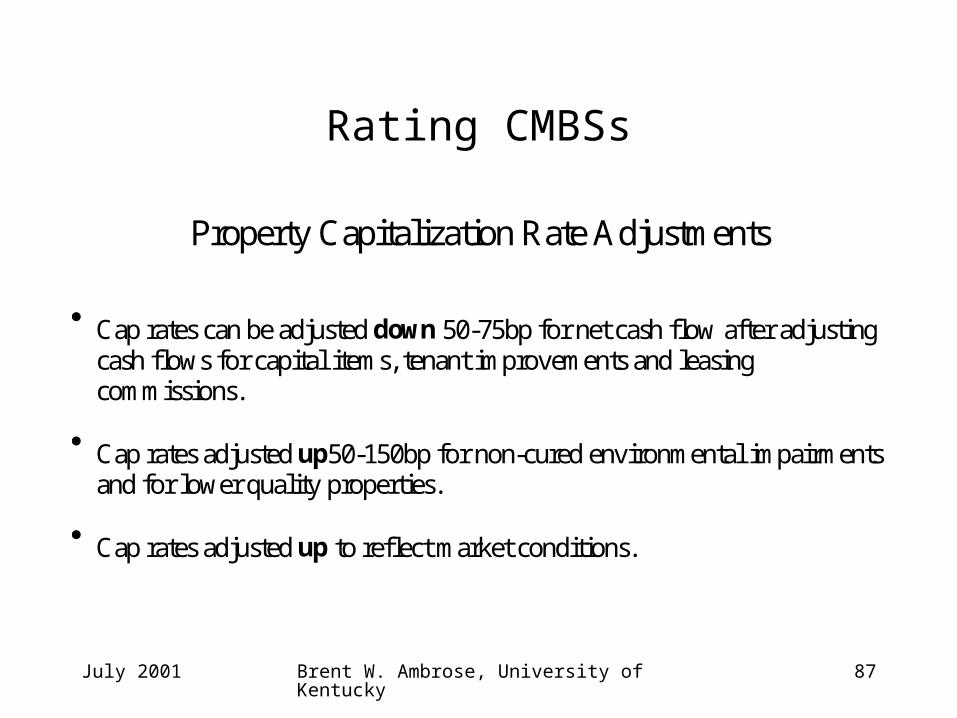
Rating CMBSs
Property Capitalization Rate Adjustments
Cap rates can be adjusted down 50-75bp for net cash flow after adjustingcash flows for capital items, tenant improvements and leasingcommissions.
Cap rates adjusted up50-150bp for non-cured environmental impairmentsand for lower quality properties.
Cap rates adjusted up to reflect market conditions.

July 2001 Brent W. Ambrose, University of Kentucky 88
Rating CMBSs
Pool Analysis
Probability of loss: the probability that any loan will default, beforeclosed on, and be liquidated.
Probability of loss = f(LTV, DSCR, property type, loan structure,fixed/floating rate, loan quality, seasoning,management, ownership structure, barriers toentry (loan to replacement cost, CF volatility,recourse)
Loan loss = f (cost to obtain the asset, time to sell, cost to sell)

July 2001 Brent W. Ambrose, University of Kentucky 89
Rating CMBSs
Ideal Pool for Small Income Property Loans
At least 500 loans
No one loan > 1% of loan balance
Geographically diversified
Taxes, insurance, and capital reserves escrowed
Full recourse

July 2001 Brent W. Ambrose, University of Kentucky 90
CMBS in Singapore
• MAS declared that real estate securitization is a strategic goal.
• Current debt securitization programs:– Mortgage-Backed bonds
• Similar to single mortgage securitization.
• Typical deal will have additional credit enhancements from mortgage borrower.
• Does not have credit rating or credit enhancements from 3rd parties.
– Asset-Backed Securitization• One step further than mortgage-backed bonds in that property securing the
debt is transferred to a “special-purchase vehicle”.