july 18, 2016 monthly report (july) oil seeds · to the soybean processors association of india....
TRANSCRIPT

Monthly Report (July)
Oil Seeds
July 18, 2016
®

2
Price movement of Oilseeds on CBOT, BMD, NCDEX & MCX (June 2016)
Source: SMC Research
Price movement of Oilseeds on Spot markets (June 2016)
Source: SMC Research
®
-11.40
-4.72
-2.22-1.63 -1.26
7.22
9.23
-15.00
-10.00
-5.00
0.00
5.00
10.00
15.00
Crude Palm Oil (BMD)
Crude Palm Oil (MCX)
Soybean (NCDEX)
Soy oil (NCDEX)
Soy oil (CBOT)
Mustard (NCDEX)
Soybean (CBOT)
(% Change)
-5.51
-3.23
-0.86
6.95
-8.00
-6.00
-4.00
-2.00
0.00
2.00
4.00
6.00
8.00
Crude Palm Oil (Kandla) Soybean (Indore) Refined Soy oil (Indore) Mustard (Jaipur)

3
®
Market Movements Ahead
Domestic Fundamentals: Soybean
�Soybean futures (Oct) giving a month on month lower closing is expected to trade with a negative bias & remain below 3930 levels. While the downside may get extended towards 3650-3550 levels, if breaks the support near 3670 levels.
�Weak demand for soybean meal is pressuring prices, while reports of heavy rains disrupting sowing activity in Madhya Pradesh are supporting.
�Market is still awaiting for more clear picture about how much farmland is affected, as the major sowing region Malwa sector was not affected by watter logging.
�In addition to it, picture is getting clearer that most of the sowing areas in Madhya Pradesh has been diverted from soybean to pulses or maize, due to better returns, which is also supporting prices.
�However, tepid demand for soybean meal has capped big upside for prices.
�In coming days, market will continue to focus distribution of rainfall in sowing areas.
�Soybean arrivals in the country as on June of the current season that begins from October 1, 2015 estimated at 50 lakh tonnes, according to The Soybean Processors Association of India.
�SOPA pegged June soybean crushing flat at 4.50 lakh tonnes versus previous month. Total crushing so far this season projected at 47 lakh tonnes.
�Stock with crushers and traders are likely to around 2.57 lakh tonnes as on June 31, while holding with farmers are expected to be around 11.96.
�The country has produced around 38.54 lakh tonnes of soybean meal as on June and around 33.75 lakh tonnes were consumed domestically (feed+food) followed by 2.97 lakh tonnes shipped to various destinations. The stocks with crushers/traders were estimated at 2.02 lakh tonnes.
�SOPA projected current year 2015-16 soybean crop at 69.29 lakh tonnes with opening stock of 6.12 lakh tonnes and the total availability sum up at 75.41 lakh tonnes.
�As per balance sheet drawn by SOPA the consumption break up are as follows 11 tonnes will be retained by farmers for sowing, while 60.10 will be used for crushing or direct consumption and 2.10 lakh tonnes to be shipped to SAARC nations. The ending stocks thus will fall to multi-year low at 2.21 lakh tonnes.
�The Soyabean Oil Producers Association (SOPA) has estimated a 3-5 per cent dip in kharif soyabean sowing to 112.173 lakh hectares (lh). The shrinkage is being attributed to a decline in the soyabean sowing in key growing States Madhya Pradesh and Rajasthan.
�Meanwhile, Maharashtra, the second largest grower after Madhya Pradesh, is likely to see an increase of 6 per cent in soyabean acreage. But in the Vidarbha region, acreage is likely to fall by 10-20 per cent as farmers chose urad, moong and maize.
Indian Oil meal Exports Scenario
The export of oilmeals during June 2016 is reported at 88,514 tons compared to 169,699 tons i.e. down by 48%. The overall export of oilmeals during April to June 2016 is reported at 186,293 tons compared to 473,676 tons during the same period of last year i.e. down by 61% due to lesser availability of oilseeds for crushing and continuous disparity in exporting oilmeals in International Market.
South Korea, Iran and Thailand – Major Importers of Oilmeals:-
�Oilmeal import by South Korea from India during April-June 2016 is reported at 123,977 tons compared to 305,849 tons; consisting 48,277 tons of rapeseed meal and 75,700 tons of castor meal.
�Vietnam imported 40,036 tons compared to 88,172 tons last year; consisting of 2,840 tons of rapeseed meal and 37,196 tons of Deoiled Rice Bran Extraction.
�Taiwan imported 6,438 tons compared to 14,779 tons last year; consisting of 3,924 tons of rapeseed meal, 115 tons of groundnut meal and 2,399 tons of castor meal.
�Myanmar imported 4,346 tons compared to 9,125 tons last year; consisting 975 tons of soybean meal , 1,747 tons of rapeseed meal and 1,624 tons of Deoiled Rice Bran Extraction.
Port-wise Export:
The export from Kandla is reported at 123,857 tons (66%), followed by Kolkata handled 39,352 tons (21%), Mumbai including JNPT handled 5,150 tons (3%), and Mundra handled 17,934 tons (10%).
Crush Margin
Source: NCDEX
�As per SOPA estimates, the soyabean area in Madhya Pradesh is likely to fall by 8 per cent to 54.246 lh (59.062 lh), while that in Rajasthan may decline by about 15-20 per cent to 8.82 lh (11.047 lh).
�In days to come, India is expected to export 1.0-2.0 mln tn soymeal in 2016-17 (Apr-Mar), sharply up from 70,820 tn a year ago, as cited by the Solvent Extractors' Association of India.
�Exports are seen rising gradually, and will pick up pace from October with the arrival of fresh crop in physical markets.
4
®
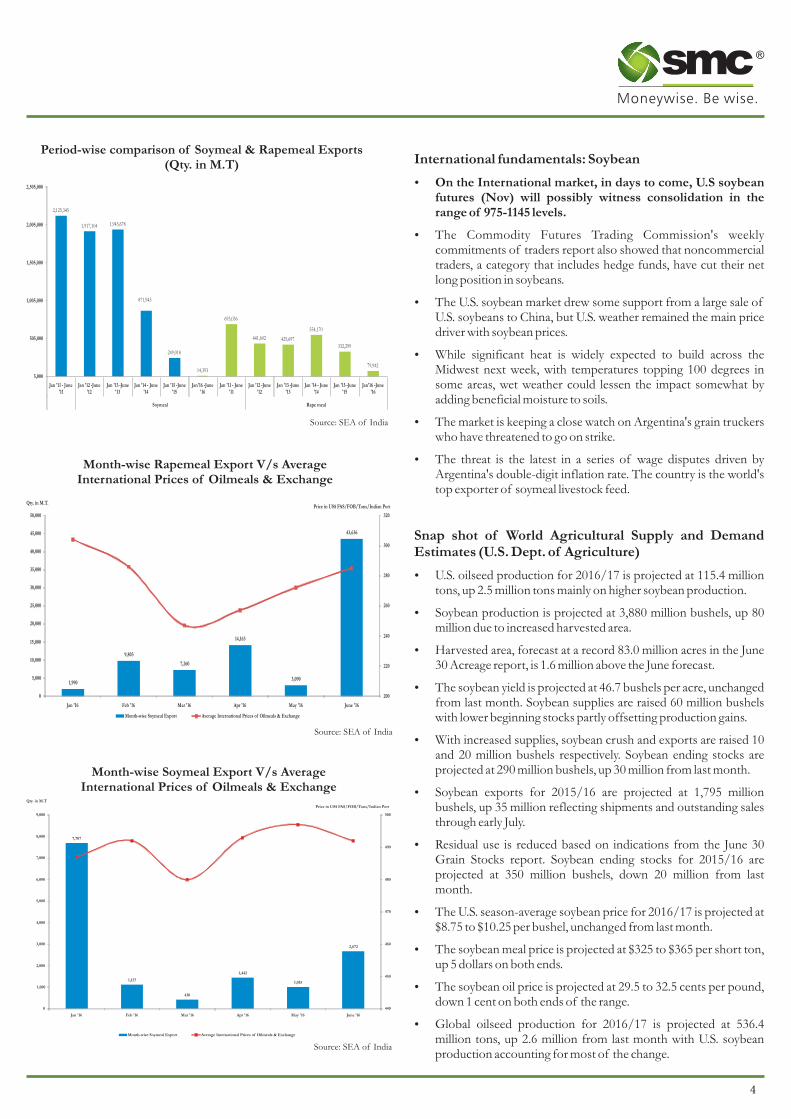
Period-wise comparison of Soymeal & Rapemeal Exports (Qty. in M.T)
Source: SEA of India
Month-wise Soymeal Export V/s Average International Prices of Oilmeals & Exchange
Source: SEA of India
Month-wise Rapemeal Export V/s Average International Prices of Oilmeals & Exchange
Source: SEA of India
International fundamentals: Soybean
�On the International market, in days to come, U.S soybean futures (Nov) will possibly witness consolidation in the range of 975-1145 levels.
�The Commodity Futures Trading Commission's weekly commitments of traders report also showed that noncommercial traders, a category that includes hedge funds, have cut their net long position in soybeans.
�The U.S. soybean market drew some support from a large sale of U.S. soybeans to China, but U.S. weather remained the main price driver with soybean prices.
�While significant heat is widely expected to build across the Midwest next week, with temperatures topping 100 degrees in some areas, wet weather could lessen the impact somewhat by adding beneficial moisture to soils.
�The market is keeping a close watch on Argentina's grain truckers who have threatened to go on strike.
�The threat is the latest in a series of wage disputes driven by Argentina's double-digit inflation rate. The country is the world's top exporter of soymeal livestock feed.
Snap shot of World Agricultural Supply and Demand Estimates (U.S. Dept. of Agriculture)
�U.S. oilseed production for 2016/17 is projected at 115.4 million tons, up 2.5 million tons mainly on higher soybean production.
�Soybean production is projected at 3,880 million bushels, up 80 million due to increased harvested area.
�Harvested area, forecast at a record 83.0 million acres in the June 30 Acreage report, is 1.6 million above the June forecast.
�The soybean yield is projected at 46.7 bushels per acre, unchanged from last month. Soybean supplies are raised 60 million bushels with lower beginning stocks partly offsetting production gains.
�With increased supplies, soybean crush and exports are raised 10 and 20 million bushels respectively. Soybean ending stocks are projected at 290 million bushels, up 30 million from last month.
�Soybean exports for 2015/16 are projected at 1,795 million bushels, up 35 million reflecting shipments and outstanding sales through early July.
�Residual use is reduced based on indications from the June 30 Grain Stocks report. Soybean ending stocks for 2015/16 are projected at 350 million bushels, down 20 million from last month.
�The U.S. season-average soybean price for 2016/17 is projected at $8.75 to $10.25 per bushel, unchanged from last month.
�The soybean meal price is projected at $325 to $365 per short ton, up 5 dollars on both ends.
�The soybean oil price is projected at 29.5 to 32.5 cents per pound, down 1 cent on both ends of the range.
�Global oilseed production for 2016/17 is projected at 536.4 million tons, up 2.6 million from last month with U.S. soybean production accounting for most of the change.
7,707
1,127
430
1,442
1,015
2,672
440
450
460
470
480
490
500
0
1,000
2,000
3,000
4,000
5,000
6,000
7,000
8,000
9,000
Jan '16 Feb '16 Mar '16 Apr '16 May '16 June '16
Price in US$ FAS/FOB/Tons/Indian Port
Qty. in M.T
Month-wise Soymeal Export Average International Prices of Oilmeals & Exchange
1,990
9,803
7,260
14,163
3,090
43,636
200
220
240
260
280
300
320
0
5,000
10,000
15,000
20,000
25,000
30,000
35,000
40,000
45,000
50,000
Jan '16 Feb '16 Mar '16 Apr '16 May '16 June '16
Price in US$ FAS/FOB/Tons/Indian PortQty. in M.T.
Month-wise Soymeal Export Average International Prices of Oilmeals & Exchange
2,125,345
1,917,104 1,943,678
871,943
249,018
14,393
693,036
441,602 425,697
554,170
332,299
79,942
5,000
505,000
1,005,000
1,505,000
2,005,000
2,505,000
Jan '11 - June '11
Jan '12 -June '12
Jan '13 -June '13
Jan '14 - June '14
Jan '15 -June '15
Jan'16 -June '16
Jan '11 - June '11
Jan '12 -June '12
Jan '13 -June '13
Jan '14 - June '14
Jan '15 -June '15
Jan'16 -June '16
Soymeal Rape meal

5
®
�Foreign oilseed production is projected at 421.1 million tons, up 0.1 million with higher rapeseed and sunflowerseed production mostly offset with lower forecasts for cottonseed and copra.
�Rapeseed production is raised for Canada mainly on increased planted area reported by Statistics Canada.
�Rapeseed production is reduced for the EU on lower harvested area and yields. Lower yields reflect excessive June rainfall, mainly in France.
�Other changes include increased soybean production for Canada and increased peanut production for the United States. Cottonseed production is reduced for India and Pakistan with partly offsetting increases for the United States and Australia.
�Global oilseed ending stocks for 2016/17 are projected at 76.1 million tons, up 1.0 million with higher soybean, rapeseed, and sunflowerseed stocks only partly offset with lower peanut stocks. Global vegetable oil stocks are raised mainly reflecting historical revisions for Indonesia.
China import of soybean
�China, the world's largest soy buyer, imported 7.56 million tonnes of soybeans in June, down 1.3 percent from 7.66 million tonnes in May, figures from the General Administration of Customs of China showed.
�According to the Global Trade Atlas data, China's soybean imports continue to be strong hitting 53 MMT in the first eight months of MY15/16, up 15 percent over the previous year.
�Currently, China's government's “tentative soybean reserve,” holding more than 6 MMT of old soybeans, will have to be used before there is further quality deterioration. Thus, the government's decision to release soybean reserves sometime in 2016 could slightly impact import growth in 2016. In addition, China's strengthened restrictions in using imported biotech soybeans for food processing is expected to moderately impact the import growth rate for soybeans in MY16/17 and beyond.
Mustard:
�Mustard futures (Aug) is looking bullish & has the potential to test 5200-5400 levels in days to come. The counter is expected to take support near 4880-4850 levels.
�The undertone in mustard is positive due to lower supply, increased demand in mustard oil. Further anticipation of lower than expected previous mustard crop also helping bullish momentum.
�The Central Organisation for Oil Industry and Trade (COOIT) sees mustard crop at 55 lakh tonnes from its previous estimate of 58 lakh tonnes, a trader are not excepting and putting their crop numbers somewhere around 42-45 lakh tonnes.
�Mustard oil demand is improving specially from North East states and likely to improve further in coming weeks, as consumption for the same rises during monsoon season.
�Mustard seed rose to 10-month high in benchmark Jaipur market.
�Demand is steady to strong specially from North East state, for retail consumption
�In addition to it, reports of South Korea booking 13,000 tonne of Mustard meal also supported market sentiment.
�Mustard meal export demand has risen since last month, which is also supporting prices for raw material.
�India has exported 43,636 tonnes of mustard meal in June compared with 3,090 tonnes June-2015, according to report published by The Solvent Extractor's Association of India (SEA).
�Mustard seed arrivals have nearly halved in last one month from 1.63 lakh bags on early June.
Crush Margin
Source: NCDEX
Edible oil complex (Domestic Fundamentals)
�Refined soy oil futures (Aug) is expected to trade with a downside bias in the range of 610-645 levels.
�The downtrend in CPO futures (Aug) is expected to consolidate in the range of 460-520 levels, with a negative bias.
�Refined soy oil is under pressure tracking weakness in palm oil prices, which is falling due to sentiment in Malaysian palm oil futures.
�Any big upside will be limited as the rival palm oil is still trading lower, which is pressuring other veg oil prices, as the same is cheapest in oil complex and directs other veg oil market.
�Import of vegetable oils during June, 2016 is reported at 1,169,456 tons compared to 1,016,297 tons in June, 2015, consisting of 1,158,902 tons of edible oils and 10,554 tons of non-edible oils i.e. up by 15%. The overall import of vegetable oils during first eight months of the current oil year 2015-16, Nov.'15 – June'16 is reported at 9,763,043 tons compared to 8,849,821 tons i.e. up by 10%.
�The import of RBD Palmolein during the first eight months of the current oil year i.e. from November 2015 to June 2016

6
®
doubled and reached at 17.77 lakh tons from 9.13 lakh tons replacing import of CPO and expected to increase further in the coming months.
�Current stock of edible oils as on 1st July, 2016 at various ports is estimated at 878,000 tons.
�Total stock at ports and in pipelines marginally decreased to 2,320,000 tons from 2,330,000 tons in June 2016.
�India's monthly requirement is about 16.5 lakh tons and operates at 30 days stock against which currently holding stock over 23.20 lakh tons equal to 42 days requirements.
�The overall stock as on 1st July, 2016 has decreased by 10,000 tons compared to 1st June, 2016.
�During Nov.15 – June '16, Palm Oil import has decreased to 5,605,473 tons from 5,850,719 tons during the same period of last year, while, soft oils import sharply increased to 4,064,343 tons from 2,871,555 tons last year. The share of soft oils import increased to 42% from 33% last year while, share of palm oil products down to 58% from 67%.
Parity calculator
Source: NCDEX
Edible oil complex (International market fundamentals)
�CPO futures (Oct) is expected to trade in the range of 2170-2405 levels.
�The upside may remain limited as exports fell and production picked up.
�Malaysian palm oil futures recently plunged to a near 10-month low after data showed exports plummeted more than expected and on a appreciating ringgit.
�Malaysia's palm oil stocks at the end of June rose 7.7 percent to 1.78 million tonnes from 1.65 million tonnes at the end of May, industry regulator Malaysian Palm Oil Board (MPOB) said.
�Output rose by 12.3 percent from the previous month to 1.53 million tonnes in June. Exports declined 11.7 percent on the month to 1.13 million tonnes.
�The country will lower its crude palm oil export tax to 5 percent in August from 6 percent in July, a move that is likely to encourage outbound shipments, but traders cautioned that a pick-up in output could pressure prices.
�The Southeast Asian nation calculated a reference price of 2,522.36 ringgit ($639.38) per tonne for August. A price above 2,250 ringgit incurs a tax, which starts from 4.5 percent and can reach a maximum of 8.5 percent.
�Dryness across Southeast Asia related to an El Nino weather event that recently ended is expected to curb global palm output this year but an emergence of La Nina and resultant rains in the region could help improve fresh fruit yields.

7
Forward Curves
Forward Curve of U.S Soybean futures (Cents per bushel)
Forward Curve of Soybean Futures (NCDEX) (Rs./Qtl.)
Forward Curve of Refined Soy oil futures (NCDEX) (Rs. 10/Kgs)
Forward Curve of Mustard futures (NCDEX) Rs./Qtl
Forward curve of U.S Soybean Oil Futures (Cents per pound)
Forward curve of CPO futures (MCX)
Source: barchart.com
Source: barchart.com
Source: NCDEX
Source: NCDEX
Source: MCXSource: NCDEX
As per closing on 15 July 2016
As per closing on 15 July 2016
As per closing on 15 July 2016
As per closing on 15 July 2016
As per closing on 15 July 2016
As per closing on 15 July 2016
®
30.89
31.02
31.14
31.42
30.60
30.70
30.80
30.90
31.00
31.10
31.20
31.30
31.40
31.50
Aug Sept Oct Dec
1072.40
1065.40
1057.20
1,045.00
1,050.00
1,055.00
1,060.00
1,065.00
1,070.00
1,075.00
August September November
3629.00
3770.00
3749.00
3801.00
3863.00
3945.00
3600.00
3650.00
3700.00
3750.00
3800.00
3850.00
3900.00
3950.00
4000.00
Jul Oct Nov Dec Jan Feb
625.00
634.20 637.60
636.15 632.00
632.05
637.70
643.35
620.00
625.00
630.00
635.00
640.00
645.00
Jul Aug Sep Oct Nov Dec Jan Feb
4,928.00
4,977.00
5,042.00
5,142.00
5,245.00
4,750.00
4,800.00
4,850.00
4,900.00
4,950.00
5,000.00
5,050.00
5,100.00
5,150.00
5,200.00
5,250.00
5,300.00
Jul Aug Sep Oct Nov
503.90
491.20
482.90
477.60
471.80
450.00
460.00
470.00
480.00
490.00
500.00
510.00
Jul Aug Sep Oct Nov

®
SMC Global Securities Limited is proposing, subject to receipt of requisite approvals, market conditions and other considerations, a further public offering of its equity shares and has filed the Draft Red Herring Prospectus with the Securities and Exchange Board of India (“SEBI”) and the Stock Exchanges. The Draft Red Herring Prospectus is available on the website of SEBI at www.sebi.gov.in and on the websites of the Book Running Lead Manager i.e., ICICI Securities Limited at www.icicisecurities.com and the Co- Book Running Lead Manager i.e., Elara Capital (India) Private Limited at www.elaracapital.com . Investors should note that investment in equity shares involves a high degree of risk and for details relating to the same, please see the section titled “Risk Factors” of the aforementioned offer document.
Disclaimer:
This report is for the personal information of the authorized recipient and doesn’t construe to be any investment, legal or taxation advice to you. It is only for private circulation and use .The report is based upon information that we consider reliable, but we do not represent that it is accurate or complete, and it should not be relied upon as such. No action is solicited on the basis of the contents of the report. The report should not be reproduced or redistributed to any other person(s)in any form without prior written permission of the SMC. The contents of this material are general and are neither comprehensive nor inclusive. Neither SMC nor any of its affiliates, associates, representatives, directors or employees shall be responsible for any loss or damage that may arise to any person due to any action taken on the basis of this report. It does not constitute personal recommendations or take into account the particular investment objectives, financial situations or needs of an individual client or a corporate/s or any entity/s. All investments involve risk and past performance doesn’t guarantee future results. The value of, and income from investments may vary because of the changes in the macro and micro factors given at a certain period of time. The person should use his/her own judgment while taking investment decisions. Please note that we and our affiliates, officers, directors, and employees, including persons involved in the preparation or issuance if this material;(a) from time to time, may have long or short positions in, and buy or sell the commodities thereof, mentioned here in or (b) be engaged in any other transaction involving such commodities and earn brokerage or other compensation or act as a market maker in the commodities discussed herein (c) may have any other potential conflict of interest with respect to any recommendation and related information and opinions. All disputes shall be subject to the exclusive jurisdiction of Delhi High court.
For further any queries, please contact
Subhranil Dey Sr. Research Analyst [email protected]
Ph.: 011-30111000
Extn.: 674