juliana de melo fin 2200 intel’s financial statement
TRANSCRIPT

Juliana De Melo �1
Juliana De Melo FIN 2200 Date: 04/20/2017
Chapter 5 - Intel Case
Intel’s Financial Statement Analysis
Introduction
Intel’s business operates the design and manufacture of advance integrated digital and technology platforms. Those platforms consist of a microprocessor and chipset, and may be enhanced by additional hardware, software, and services. The platforms are used in a wide range of computing applications, such as notebooks, desktops, servers, tablets, smartphones, automobile infotainment systems, automated factory systems, and medical devices. They also develop and sell software and services primarily focused on security and technology integration (Intel 2013 Annual Report).
Intel has progressed in many areas along the years. The CEO and chairman letter has pointed lots of items that may be useful to discuss, and we will discuss and understand throughout this financial statement analysis. It is important to mention that the results for fiscal year 2013 delivered revenue of $52.7 billion, net income of $9.6 billion, and earnings per share of $1.89. Clients computing products generated $33 billion in revenue and approximately $12 billion in operating profits. The datacenter business revenue grew to more than $11 billion, driven by rising demand for cloud services, high performance computing, storage, and networking. They generated almost $21 billion in cash from operations and returned $6.6 billion to stockholders in form of dividends and share repurchases. Intel used in 2013 $2.1 billion to repurchase shares (Intel 2013 Annual Report).
Employees at Intel share the public’s concerns about safety, security, privacy, and sustainability. They have high levels of profits, strong cash generation, and a health balance sheet. They are reinvigorating and innovating new products. Intel leads the industry of semiconductor manufacturer in the world. In 2013, they shipped more than 10 million microprocessors, and for 2014 they have set a goal to increase that number to 40 million. This financial statements are presented fairly compared with the industry average. “It’s in conformity with U.S. generally accepted accounting principles. The internal financial control is

Juliana De Melo �2
in accordance with GAAP” (Intel 2013 Annual Report). The important items discussed in this audit report are: to maintain records in reasonable detail, accurately and fairly reflecting the transactions and dispositions of the assets of the company; provide reasonable assurance that transactions are recorded as necessary to permit preparation of financial statements in accordance with generally accepted principles, and that receipts and expenditures of the company are being made only in accordance with management and directors of the company; and provide reasonable assurance regarding prevention or timely detection of unauthorized acquisition, use, or disposition of the company’s assets that could have a material effect on the financial statements.
The items addressed in the MD&A are internal and external sources of liquidity, material deficiencies in liquidity and how they will be remedied, commitments for capital expenditures, the purpose of such commitments, and expected sources of funding, anticipated changes in the mix and cost of financing resources, unusual or infrequent transactions that affect income from continuing operations, events that cause material changes in the relationship between costs and revenues, and breakdown of sales increases into price and volume components (Fraser and Ormiston).
The projections for the future are to continue research and development for new products and customer approach to give incentives to the company’s future. They also have a good inventory control. Inventory is valued at the lower of cost or market based upon assumptions about future demand and market conditions, the valuation process include a review of customer base, the stage of the product life cycle of the products, consumer confidence, customer acceptance of the products, and an assessment of selling price in relation to product cost. The forecast demand is utilized in the development of short-term manufacturing plans. The estimate of future demand is compared to work-in-process and finished goods inventory levels to determine the amount. The biggest concern would be the investment in non-marketing security, like savings bonds and certificates of deposits that may not be negotiable and do not generate cash flow, another fact is competition that has been increasing and the borrowing money act to pay for liabilities. Intel seems to be doing a good job to keep themselves in the competitive market of technology.
Reading the letter from the CEO and chairman, we noticed the excitement about the results of net revenue of $52.7 billion, net income of $9.6 billion, and earnings per share of $1.89. But analyzing the trends over the years for those results, we know that it has exactly decreased in dollar amount and percentage in comparison with the years from 2011 to 2013.

Juliana De Melo �3
They proudly talk about plans and investments made for the research and development department, which we can really prove through the numbers analyzed in my vertical and horizontal statement of income as well their interest in marketing. The analyze the statement of cash flows include the $4.5 billion paid in dividends, $2.1 billion spent to repurchase share, bringing the accumulative return to stockholders from dividends and repurchases to $125 billion. The business revenue grew more than $11 billion and generated almost $21 billion in cash from operations, returning $6.6 billion to stockholders in the form of dividends and share repurchases. The chairman also mention the life-threatening challenges, including a shortage of capital, operating losses and fierce competition in the past in comparison with the growth and recognition in the market until 2013. He announces the release of new products and ideas for the next year with the enthusiasm to reach new records. Intel enters 2014 with leadership positions in important business segment.
The Balance Sheet
On the balance sheet we will pay attention on the assets, liabilities and stockholders’ equity of the company. The types of assets Intel owns are: trading securities, accounts receivable, inventory, deferred taxes, property, plant, equipment, equity securities, goodwill, and other intangibles. The most significant assets are the property, plant and equipment that increased $3,445 million from 2012 to 2013 and represents around 34% of the Intel’s assets. The company has been investing in property, plant and equipment for the growth of the business and production. “The increase in those assets increases also the net of accumulated depreciation. The method used for depreciation on properties, plants and equipment is the straight-line method. The useful lives for machinery and equipment is 2 to 4 years, and buildings 10 to 25 years” (Intel Annual Report 2013). The straight-line method is designed to reflect the consumption pattern of the underlying asset, and is used when there is no particular pattern to the manner in which the asset is to be used over time. The use of the straight-line method is highly recommended, since it is the easiest depreciation method to calculate, and so results in few calculation errors.

Juliana De Melo �4
Common-size (vertical) analysis Balance Sheet
!
2013
%ofTotalAssets 2012
%ofTotalAssets
AssetsCurrentassets:
Cashandcashequivalent 5,674$ 6.14 8,478$ 10.05Short-terminvestment 5,972 6.47 3,999 4.74Tradingassets 8,441 9.14 5,685 6.74Accountsreceivable,netof$38($38in2012) 3,582 3.88 3,833 4.54Inventories 4,172 4.52 4,734 5.61Deferredtaxassets 2,594 2.81 2,117 2.51Othercurrentassets 1,649 1.79 2,512 2.98
Totalcurrentassets 32,084 34.74 31,358 37.18Property,plantandequipment,net 31,428 34.03 27,983 33.17Marketableequitysecurities 6,221 6.74 4,424 5.24Otherlong-terminvestments 1,473 1.59 493 0.58Goodwill 10,513 11.38 9,710 11.51Identifiedintangibleassets,net 5,150 5.58 6,235 7.39Otherlong-termassets 5,489 5.94 4,148 4.92Totalassets 92,358$ 100.00 84,351$ 100.00Liabilitiesandstockholders'equityCurrentliabilities:
Short-termdebt 281$ 0.30 312$ 0.37Accountspayable 2,969 3.21 3,023 3.58Accruedcompensationandbenefits 3,123 3.38 2,972 3.52Accruedadvertising 1,021 1.11 1,015 1.20Deferredincome 2,096 2.27 1,932 2.29Otheraccruedliabilities 4,078 4.42 3,644 4.32
Totalcurrentliabilities 13,568 14.69 12,898 15.29Long-termdebt 13,165 14.25 13,136 15.57Long-termdeferredtaxliabilities 4,397 4.76 3,412 4.05Otherlong-termliabilities 2,972 3.22 3,702 4.39Commitmentsandcontingencies(Notes18and26) - -Stockholders'equity
Preferredstock - - - -Commonstock 21,536 23.32 19,464 23.08Accumulatedothercomprehensiveincome(loss) 1,243 1.35 399- 0.47-Retainedearnings 35,477 38.41 32,138 38.10
Totalstockholders'equity 58,256 63.08 51,203 60.70Totalliabilitiesandstockholders'equity 92,358$ 100.00 84,351$ 100.00
IntelCorporationConsolidatedBalanceSheet
December28,2013,andDecember29,2012(InMillions,ExceptParValue)
Juliana De Melo �5
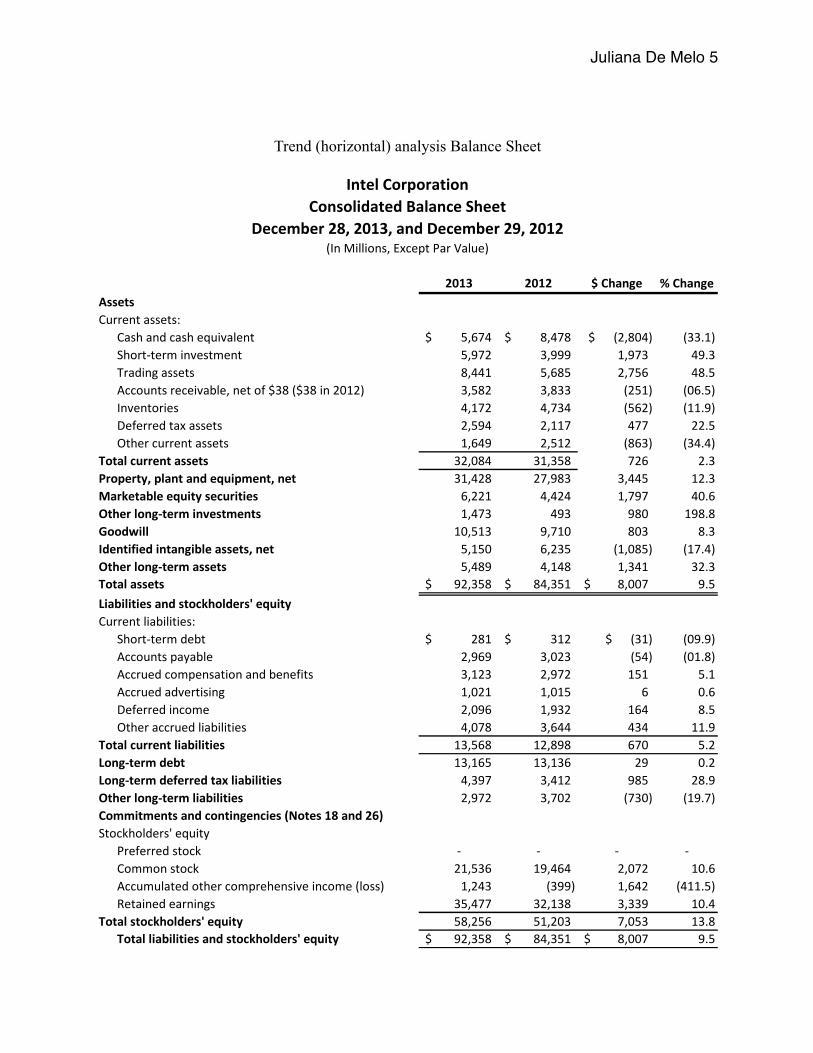
Trend (horizontal) analysis Balance Sheet
!
2013 2012 $Change %ChangeAssetsCurrentassets:
Cashandcashequivalent 5,674$ 8,478$ $(2,804) (33.1)Short-terminvestment 5,972 3,999 1,973 49.3Tradingassets 8,441 5,685 2,756 48.5Accountsreceivable,netof$38($38in2012) 3,582 3,833 (251) (06.5)Inventories 4,172 4,734 (562) (11.9)Deferredtaxassets 2,594 2,117 477 22.5Othercurrentassets 1,649 2,512 (863) (34.4)
Totalcurrentassets 32,084 31,358 726 2.3Property,plantandequipment,net 31,428 27,983 3,445 12.3Marketableequitysecurities 6,221 4,424 1,797 40.6Otherlong-terminvestments 1,473 493 980 198.8Goodwill 10,513 9,710 803 8.3Identifiedintangibleassets,net 5,150 6,235 (1,085) (17.4)Otherlong-termassets 5,489 4,148 1,341 32.3Totalassets 92,358$ 84,351$ 8,007$ 9.5Liabilitiesandstockholders'equityCurrentliabilities:
Short-termdebt 281$ 312$ $(31) (09.9)Accountspayable 2,969 3,023 (54) (01.8)Accruedcompensationandbenefits 3,123 2,972 151 5.1Accruedadvertising 1,021 1,015 6 0.6Deferredincome 2,096 1,932 164 8.5Otheraccruedliabilities 4,078 3,644 434 11.9
Totalcurrentliabilities 13,568 12,898 670 5.2Long-termdebt 13,165 13,136 29 0.2Long-termdeferredtaxliabilities 4,397 3,412 985 28.9Otherlong-termliabilities 2,972 3,702 (730) (19.7)Commitmentsandcontingencies(Notes18and26)Stockholders'equity
Preferredstock - - - -Commonstock 21,536 19,464 2,072 10.6Accumulatedothercomprehensiveincome(loss) 1,243 (399) 1,642 (411.5)Retainedearnings 35,477 32,138 3,339 10.4
Totalstockholders'equity 58,256 51,203 7,053 13.8Totalliabilitiesandstockholders'equity 92,358$ 84,351$ 8,007$ 9.5
IntelCorporationConsolidatedBalanceSheet
December28,2013,andDecember29,2012(InMillions,ExceptParValue)

Juliana De Melo �6
Intel uses two methods to value assets, in conformity with the U.S. generally accepted
accounting principles, they make estimates and judgments to value inventory, property, plant, equipment, goodwill and other intangibles, and as well, Intel uses market Fair Value to measured theirs assets. Other important information learned in the notes are: all investments with original maturities from the date of purchase until three months or less are considered cash equivalent, such as short-term investments, trading assets, equity securities, long-term assets and long-term investments.
The inventory valuation method used is FIFO (first in, first out), which can give a more
accuracy for ending inventory on the balance sheet, but increases net income and subsequent net income increases taxes expenses. The inventory method a company’s uses affect its cost of goods sold which has an impact on its profitability ratios. The formula for COGS is beginning inventory plus purchases less ending inventory. A company using FIFO to value its inventory reports lower COGS, which increases all three profit margin and its net income all else being equal. Higher net income means higher profit margin. A company using LIFO reports higher COGS, translating into lower gross profit, net income and profit margins. FIFO companies will report higher inventory in their current assets. This result in a higher current ratio. In contrast, a company using LIFO reports lower ending inventory, producing a lower current ratio. The accounting method used to account for inventory has an effect on the income statement, balance sheet, and cash flow statement.
Accounts receivables had a decrease in comparison with 2012 and 2013 rates of 6.5%. The valuation and qualifying account schedule for Intel shows the balance for allowances are the same at beginning and ending balance with some small additions and write-off on the way. If we calculate the ratios for allowance for doubtful accounts we get 0.07% increase relate to accounts receivables and 0.05% increase related to net sales. See the calculations below: Allowance for doubtful accounts as a percentage of total accounts receivable:
2013: ($38/$3,620)*100 = 1.05% 2012: ($38/$3,871)*100 = 0.98%
Allowance for doubtful accounts as a percentage of net sales:

Juliana De Melo �7
2013: ($38/$9,620)*100 = 0.40% 2012: ($38/$11,005)*100 = 0.35%
The three major significant customers for Intel are Hewlett-Packard Company responsible for 17% of the revenue, Dell Inc. responsible for 15% of revenue, and Lenovo Group Limited responsible for 12% of the revenue (Intel Annual Report 2013).
The liabilities Intel has incurred are short-term and long-term debts, accounts payable, accrued compensation and benefits, accrued advertising, deferred income, deferred taxes, and contingents. The current liabilities according to the horizontal and vertical analysis does not represent any concern at this moment. There are no major changes in the results. The long-term debt in my analysis for 2012 and 2013 does not represent any concern but calculating since 2009 to 2013 had an increase of $11,116 or about 16%. A high rate in long-term debt represents risks in the ability to thrive over time, commits your cash flow and may turn your financial status vulnerable.
Some of Intel commitments include payments due over various types of licenses and agreements to purchase goods and services, as well funding obligations include agreements to fund various projects with other companies. They have the commitment for construction or purchase of property, plant and equipment totaled $5.5 billion. Other purchase obligations totaled $1.9 billion. Projects of development of new products totaling €829 million over 5 years, and a milestone project that will cost approximately $1.0 billion (Intel Annual Report 2013).
In the contingencies notes it is declared that all legal proceedings will not cause materially harm to the financial position results of operations or cash flows for Intel. Some legal proceedings related to government investigations are subject to uncertainties and unfavorable resolutions, but is believed that Intel compete lawfully and the marketing, business, intellectual property, and other challenged practices benefit theirs customer and stockholders.
Deferred taxes are listed under current assets and long-term liabilities. The most significant component of deferred taxes is the accrued compensation and other benefits because has a high amount available what may reduce taxable income. The equity accounts included on Intel’s balance sheet are preferred stock, common stock, accumulated other comprehensive income and retained earnings. The most significant change is the retaining earnings category that had a change of 10.4% and an impact of 38.1% over the assets.

Juliana De Melo �8
Statement of Equity and Income Statement
Common-size analysis for income statement.
!
Horizontal analysis for income statement
!
2013 %ofsales 2012 %ofsales 2011 %ofsalesNetrevenue 52,708$ 100.00 53,341$ 100.00 53,999$ 100.00Costofsales 21,187 40.20 20,190 37.85 20,242 37.49Grossmargin 31,521 59.80 33,151 62.15 33,757 62.51Researchanddevelopment 10,611 20.13 10,148 19.02 8,350 15.46Marketing,generalandadministrative 8,088 15.34 8,057 15.10 7,670 14.20Restructuringandassetimpairmentcharges 240 0.46 - - - -Amortizationofacquisition-relatedintangibles 291 0.55 308 0.58 260 0.48Operatingexpenses 19,230 36.48 18,513 34.71 16,280 30.15Operatingincome 12,291 23.32 14,638 27.44 17,477 32.37Gains(losses)onequityinvestments,net 471 0.89 141 0.26 112 0.21Interestandother,net (151) -0.29 94 0.18 192 0.36Incomebeforetaxes 12,611 23.93 14,873 27.88 17,781 32.93Provisionfortaxes 2,991 5.67 3,868 7.25 4,839 8.96Netincome 9,620$ 18.25 11,005$ 20.63 12,942$ 23.97
IntelCorporationConsolidatedStatementsofIncome
ThreeYearsEndedDecember28,2013(InMillions,ExceptPercentage)
2013 2012 $change %change 2011 $change %changeNetrevenue 52,708$ 53,341$ $(633) (1.2) 53,999$ $(658) (1.2)Costofsales 21,187 20,190 997 4.9 20,242 (52) (0.3)
Grossmargin 31,521 33,151 (1630) (4.9) 33,757 (606) (1.8)Researchanddevelopment 10,611 10,148 463 4.6 8,350 1,798 21.53
Marketing,generalandadministrative 8,088 8,057 31 0.4 7,670 387 5.05
Restructuringandassetimpairmentcharges 240 - - - - - -
Amortizationofacquisition-relatedintangibles 291 308 (17) (5.5) 260 48 18.46
Operatingexpenses 19,230 18,513 717 3.9 16,280 2,233 13.72Operatingincome 12,291 14,638 (2347) (16.0) 17,477 (2839) (16.2)
Gains(losses)onequityinvestments,net 471 141 330 234.0 112 29 25.89
Interestandother,net (151) 94 (245) (260.6) 192 (98) (51.0)
Incomebeforetaxes 12,611 14,873 (2262) (15.2) 17,781 (2908) (16.4)
Provisionfortaxes 2,991 3,868 (877) (22.7) 4,839 (971) (20.1)
Netincome 9,620$ 11,005$ $(1,385) (12.6) 12,942$ (1937) (15.0)
IntelCorporationConsolidatedStatementsofIncome
ThreeYearsEndedDecember28,2013(InMillions,ExceptPercentage)

Juliana De Melo �9
Profit = revenue – expenses. The best way to improve profitability is increasing sales revenue. Sales are the major revenue resource for the Intel Corporation. We can easily find the change in sales in nominal terms calculating the figures reported on the income statement and analyzing the vertical and horizontal statements. If we want to find out the increase or decrease in sales in real terms is necessary to adjust the sales figure with the Consumer Price Index (CPI). CPI is a reflex of inflation and determine the change in sales revenue in real terms or inflation-adjusted terms.
CPI = Current CPI or 232.96 = 1.015*53,341 = 54,141 = adjusted CPI Prior CPI 229.59
!
After the CPI calculation, we can conclude that the sales decline in real terms (inflation-adjusted) is 2.6%. It is higher than the nominal term (as reported) analysis of 1.2%. Sales when adjusted for inflation decreased even more because of decrease in sales and the prices do not adjust in prices. Inflation rate was about 1% between 2012 and 2013.
To get a better analyses of Intel’s profitability, let’s take a look at the gross margin of the company. Gross margin = revenue – cost of sales. Companies with a high gross margin will have more money to spend on other areas of the company, such as R&D (Research and Development) and Marketing. So a downward trends in the gross margin rate over the time, means future problems for the company. Below, you will find a 5 years Income statement analysis.
2013 2012(adj) $change %changeNetrevenue 52,708$ 54,141$ $(1,433) (2.6)

Juliana De Melo �10
!
Intel has been very constant in their gross margin rate. They had slightly changes in dollars amount through the years, keeping the gross margin percentage around 61.0% average. In 2009, the U.S.A was trying to restart from the great recession in a weak and slow pace, so that explain lowers numbers for net revenue, gross margin and net income. The country economic factors has a great influence in the growth and development of the company.
Cost of goods sold (COGS) and gross profit
COGS reflects the production and shipping expenses related to selling a product. If sales increases in volume or inflation, cost of goods sold increases too. The inventory method adopted by the company will also influence that increase or decrease of cost of goods sold. Intel uses FIFO (First In, First Out) which means that the first cost are the first one to leave inventory and become the cost of goods sold on the income statement. The last cost will be reported as inventory on the balance sheet. FIFO tends to result in a more profitability gross profit that any other inventory method because the first cost is always lower and will reflect a lower cost of goods sold. LIFO (Last In, First Out) will have higher cost of goods sold in dollar amount and percentage change. They use the newest inventory first and most of the times are sold for less than it is acquired, generating lower net income and lower taxable income, but may generate loss of inventory, as well.
Gross profit = net revenue – cost of goods sold, that is why gross profit is always influenced by cost of goods sold. Gross profit represent the productivity of the company’s operation and they have a very close relationship. This relationship is called the cost of goods sold percentage, as you can see on the example below.
2013 2012 2011 2010 2009Netrevenue 52,708$ 53,341$ 53,999$ 43,623$ 35,127$Grossmargin 31,521 33,151 33,757 28,491 19,561Grossmarginpercentage 59.8% 62.1% 62.5% 65.3% 55.7%Researchandevelopment 10,611 10,148 8,350 6,576 5,653Marketing,generalandadministrative 8,088 8,057 7,670 6,309 7,931R&DandMG&Aaspercentageofrevenue 35.5% 34.1% 29.7% 29.5% 38.7%Operatingincome 12,291 14,638 17,477 15,588 5,711Netincome 9,620$ 11,005$ 12,942$ 11,464$ 4,369$
IntelCorporationFinancialData
FiveYearsEndedDecember28,2013(DollarsInMillions)

Juliana De Melo �11
!
The cost of goods sold percentage for Intel increased between 2011, 2012 and 2013. This is a result of the firm lowering net revenue due to a reduction in volume sales or prices or increasing costs. If net sales increases by 10%, per example, cost of goods sold percentage will decrease, but not necessarily the costs in dollars amount as you can see below. This happened because of the increase in sales decreases the ratio in the relationship between COGS and sales, but not necessarily occur an increase in expenses.
!
The analyze for net revenue found in the management’s discussion and analysis of financial condition and results of operations (MD&A) shows a better net revenue for Intel in 2012 than 2013. Net revenue increased 1% or $633 million, the decrease is due to a decrease in unit sales, or to better explain the decrease of volume in sales. The decreased in gross margin dollar from 2013 to 2012 was $1.6 billion, or 5% and was due in large part for the higher costs to introduce new products technology. The decrease in net revenue from 2012 and 2011 was $658 million or 1% due by some product unit sales decreased while average sales price were unchanged. The decrease in gross margin was $606 million or 2%, due in large because of the increase of expenses, costs and the lower revenue from some of the products. We can conform this information looking at the vertical and horizontal analysis.
Operation Expense
1-Research & development (R&D) expenses
Intel is committed to invest in R&D expenditures $10.6 billion in 2013, $10.1 billion in 2012 and $8.4 billion in 2011. They are focused on developing new technology innovations to
2013%ofNetSales 2012
%ofNetSales 2011
%ofNetSales
Netrevenue 52,708$ 100.00 53,341$ 100.00 53,999$ 100.00Costofsales 21,187 40.20 20,190 37.85 20,242 37.49
2013%ofNetSales 2012
%ofNetSales 2011
%ofNetSales
Netrevenue 57,979$ 100.00 58,675$ 100.00 59,399$ 100.00Costofsales 21,187 36.5% 20,190 34.4% 20,242 34.1%

Juliana De Melo �12
delivery much better and innovated products. According with MD&A, research and development expenses has increased significantly over the years. Intel is really committed to improve their products and consequently their sales. In comparison with 2013 and 2012 the increased was 4.6% and in 2012 and 2011 the increase was even higher with 21.5% growth. The percentage change in net sales was 20.1 % in 2013, 19.0% in 2012 and 15.5% in 2011. The increase average was 18.2% over the years. Intel is a company that design and manufacture advanced integrated digital technology platforms, so an average of 18.2% in expenses increase is very reasonable for the industry. MD&A display important information about R&D tax credit. The U.S government R&D tax credit was reenacted in 2013 and in the beginning of 2012, decreasing the effective rate and producing a positively impact in the R&D tax credit and helping generate a higher percentage of profit.
2-Marketing, general, and administrative (MG&A) expense
Intel intention for marketing is to build a well-know and strong company with business and consumers. Their marketing activities include television, print, internet advertising, social media, consumer and trade events, industry communication, and joint marketing agreements. Marketing cost should be a major expense in the budgets of companies for which marketing is an important element for success. In other hand, general and administrative expenses are expenses related to costs that occur during the daily operation of the company and not direct related to the manufacturing of the product. This include salaries, rent, insurance, utilities, supplies, and depreciation. That is why those expenses are not displayed with the cost of goods sold. Although the decrease in sales and net revenue, MG&A had an average increase of 2.7% over the years in change. MG&A expenses are most of the time fixed expenses and more difficult to be analyzed. Decrease in MG&A will be due a reduction in marketing or laying off employees, which in both options are not good decisions to the reputation of the company. The marketing, general and administrative expenses increased by $31million in 2013 compared to 2012, and increase by $387 million, or 5%, in 2012 compared to 2011. The increase in 2012 compared to 2011 was primarily due to two additional months of McAfee expenses in 2012 (company acquired by Intel in 2011) and higher compensation expenses, due to annual salary increases as well as an increase in the number of employees.
Increases in MG&A expenses for Intel seems to be very reasonable for me. According with the notes to the financial statements, 23% of the MG&A expenses in 2013 was for

Juliana De Melo �13
advertising, 25% in 2012, and 27% in 2011, including direct marketing costs. Marketing is an important investment for any company.
Operating profit
We can analyze the change trends in operating profit for Intel observing the horizontal analysis. The average dollar amount change from 2013 to 2011 was $2,593 million, or 16.1% average. The operating profit margin can be observed on the vertical analysis, 23.3% in 2013, 27.4% in 2012, and 32.4% in 2011, occurring a decrease over the years. This analysis is important because it is an indirect measure of efficiency. The higher the operating profit, the more profitable a company’s core business is. It demonstrate how much revenues are left over after all the operating costs have been paid. The industry average are:
! Source: Mergent Intellect
The trend for Intel is negative, or in other words, has been declining over the years, but Intel continue in the industry company’s average, competing in the marketing.
Effective tax rate
The effective tax rate is the average rate which an individual or company is taxed. It was calculate provision for taxes by income before taxes. As shown below in the graphic, Intel has a higher rate of money taxed and it is influenced by the amount of taxes expense in a given period.
!
Net Earnings
2013 2012Intel 23.3% 27.4%Apple 28.7 35.3IBM 18.2 19.6Symantec 16.3% 16.0%
2013 2012 2011Incomebeforetaxes 12,611 14,873 17,781Provisionfortaxes 2,991 3,868 4,839Effectivetaxrate 23.7% 26.0% 27.2%

Juliana De Melo �14
Net earnings represents the company’s profit after consideration of all revenue and expenses reported in a given period. The net profit margin shows the percentage of profit earned on every sales dollar. The net profit margin was calculated in the vertical analysis and shown a decrease in percentage due probably for the decrease in sales and the increase in expenses.
!
Earnings per common share
Earnings per share is the net earnings available to common stockholders for the period divided by the average number of common stock shares outstanding. The result shows the return to the common stock shareholder for every share owned. The basic and diluted amounts are calculated for companies with bonds converted into common stock, stock options and warrants. I have the number for Intel Corporation below showing a decreasing in the earnings per share, in other words means that the company has lost from 2012 to 2013 26 cents of cash per share and from 2011 to 2012 another 26 cents of cash per share.
!
Comprehensive income
The most significant item included in comprehensive income is the change in available-for-sale investment. The investment came from a loss in 2011 to an increase in 2012 and 2013. This is favorable increase in comprehensive income over the years.
2013%ofNetSales 2012
%ofNetSales 2011
%ofNetSales
Netincome 9,620$ 18.25 11,005$ 20.63 12,942$ 23.97
2013 2012 2011Basicearningspercommonshare 1.94 2.20 2.46Dilutedearningspercommonshare 1.89 2.13 2.39Weightedaveragecommonsharesoutstanding:Basic 4,970 4,996 5,256Diluted 5,097 5,160 5,411

Juliana De Melo �15
!
Segment analysis
Intel major sources of revenue are probably the sales of their products and interest revenue from investments. Gross profit was calculated on the common-size income statement.
Statement of Equity analysis
Common-size statement
!
2013 2012 2011Netincome 9,620$ 11,005$ 12,942$Othercomprehensiveincome:
Changeinnetunrealizedholdingsgain(losses)onavailable-for-saleinvestments 1,181 470 (170)Changeinnetdeferredtaxassetvaluationallowance (26) (11) (99)Changeinnetunrealizedholdingsgain(losses)onderivatives (89) 85 (119)Changeinnetpriorservicecosts 18 - 4Changeinactuarialvaluation 520 (172) (588)Changeinnetforeigncurrencytranslationadjustiment 38 10 (142)
Othercomprehensiveincome(loss) 1,642 382 (1114)Totalcomprehensiveincome 11,262$ 11,387$ 11,828$
IntelCorporationConsolidatedStatementsofComprehensiveIncome
ThreeYearsEndedDecember28,2013(InMillions)
2013%ofTotalEquity 2012
%ofTotalEquity
Stockholders'equityPreferredstock - - - -Commonstock 21,536 36.97 19,464 38.01Accumulatedothercomprehensiveincome(loss) 1,243 2.13 (399) (0.78)Retainedearnings 35,477 60.90 32,138 62.77
Totalstockholders'equity 58,256 100.00 51,203 100.00Totalliabilitiesandstockholders'equity 92,358$ 158.54 84,351$ 164.74
IntelCorporationConsolidatedStatementofEquity
December28,2013,andDecember29,2012(InMillions,ExceptPercentage)
Juliana De Melo �16
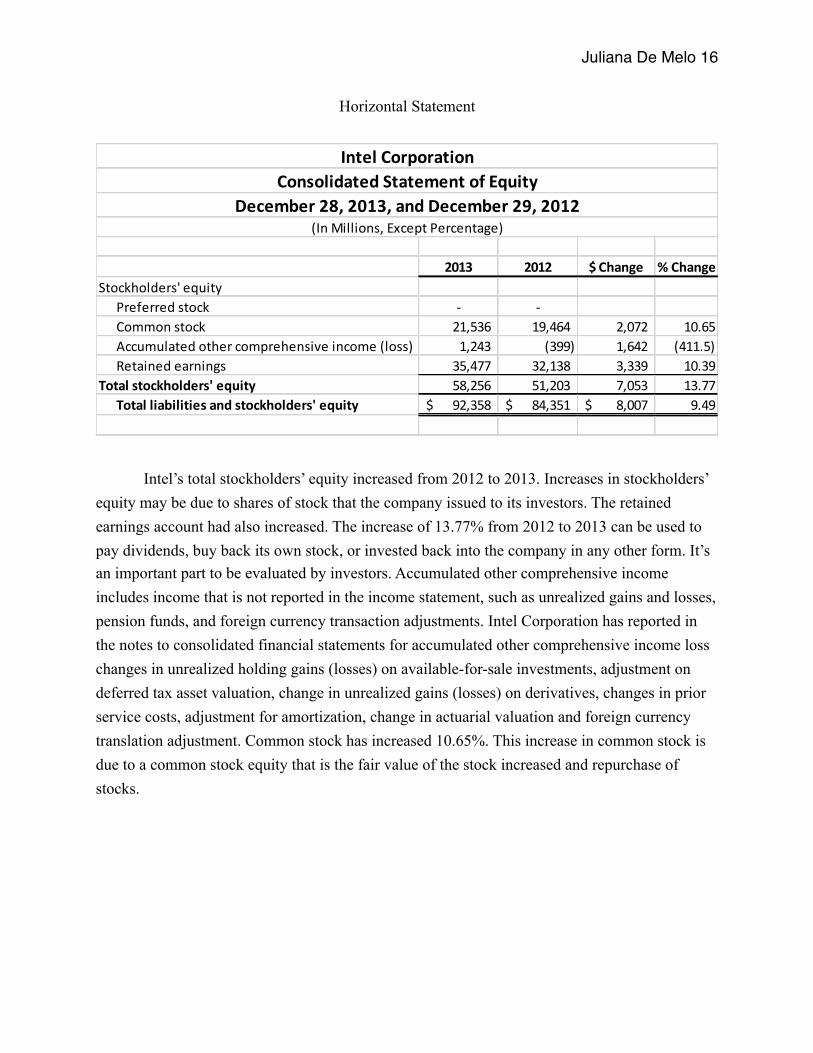
Horizontal Statement
!
Intel’s total stockholders’ equity increased from 2012 to 2013. Increases in stockholders’ equity may be due to shares of stock that the company issued to its investors. The retained earnings account had also increased. The increase of 13.77% from 2012 to 2013 can be used to pay dividends, buy back its own stock, or invested back into the company in any other form. It’s an important part to be evaluated by investors. Accumulated other comprehensive income includes income that is not reported in the income statement, such as unrealized gains and losses, pension funds, and foreign currency transaction adjustments. Intel Corporation has reported in the notes to consolidated financial statements for accumulated other comprehensive income loss changes in unrealized holding gains (losses) on available-for-sale investments, adjustment on deferred tax asset valuation, change in unrealized gains (losses) on derivatives, changes in prior service costs, adjustment for amortization, change in actuarial valuation and foreign currency translation adjustment. Common stock has increased 10.65%. This increase in common stock is due to a common stock equity that is the fair value of the stock increased and repurchase of stocks.
2013 2012 $Change %ChangeStockholders'equity
Preferredstock - -Commonstock 21,536 19,464 2,072 10.65Accumulatedothercomprehensiveincome(loss) 1,243 (399) 1,642 (411.5)Retainedearnings 35,477 32,138 3,339 10.39
Totalstockholders'equity 58,256 51,203 7,053 13.77Totalliabilitiesandstockholders'equity 92,358$ 84,351$ 8,007$ 9.49
ConsolidatedStatementofEquityDecember28,2013,andDecember29,2012
(InMillions,ExceptPercentage)
IntelCorporation

Juliana De Melo �17
Summary Analysis
!
2013%ofTotalInflows 2012
%ofTotalInflows 2011
%ofTotalInflows
Inflows(dollarsinmillions)Operatingactivities 20,776$ 45.17 18,884$ 36.26 20,963$ 34.35Maturitiesofavailableforsaleinvestments 8,336 18.12 5,369 10.31 11,029 18.07Salesofavailableforsaleinvestments 934 2.03 2,282 4.38 9,076 14.87Maturities&salesoftradingassets 13,677 29.74 15,786 30.31 11,771 19.29Collectionofloansreceivables 132 0.29 149 0.29 134 0.22ProceedsfromthesaleofIMandLLP - 0.00 605 1.16 - 0.00Returnonequitymethodinvestments 45 0.10 137 0.26 263 0.43Proceedsfromdivestitures - 0.00 - 0.00 50 0.08Proceedsfromgovernmentgrants 129 0.28 63 0.12 124 0.20Excesstaxbenefits 49 0.11 142 0.27 37 0.06Increaseinshort-termdebt - 0.00 65 0.12 209 0.34Increaseinlong-termdebt - 0.00 6,124 11.76 4,962 8.13Proceedsfromsalesofshares 1,588 3.45 2,111 4.05 2,045 3.35Investingactivities 326 0.71 369 0.71 370 0.61TotalInflows 45,992$ 100.00 52,086$ 100.00 61,033$ 100.00
Outflows(dollarsinmillions)%ofTotalOuflows
%ofTotalOuflows
%ofTotalOuflows
Additionstoplantandequipment 10,711$ 21.95 11,027$ 22.66 10,764$ 17.51Acquisitionsnetofcash 925 01.90 638 01.31 8,721 14.19Purchaseofavailableforsaleinvestments 12,493 25.61 8,694 17.86 11,230 18.27Purchaseoflicensedtechnologyandpatents 36 00.07 815 01.67 66 0.11Investingactivities - - - - - -Purchaseoftradingassets 16,718 34.27 16,892 34.71 11,314 18.41Originationofloansreceivable 200 00.41 216 00.44 206 0.34Investmentsinnonmarketableequityinvestments 440 00.90 475 00.98 693 1.13Decreaseinshort-termdebt 31 00.06 - - - -Repaymentofdebt - - 125 00.26 - -Repurchaseofcommonstock 2,440 05.00 5,110 10.50 14,340 23.33Paymentofdividends 4,479 09.18 4,350 08.94 4,127 6.71Otherfinancing 314 00.64 328 00.67 10 0.02TotalOutflows 48,787$ 100.00 48,670$ 100.00 61,471$ 100.00
Changeincash $(2,795) 3,416$ $(438)
IntelCorporationSummaryAnalysisStatementofCashFlowsThreeYearsEndedDecember28,2013
(InMillions,ExceptPercentage)

Juliana De Melo �18
Horizontal Analysis
!
2013 2012 $Change %Change 2011 $Change %ChangeCashandcashequivalents,beginningofyear 8,478$ 5,065$ 3,413$ 67.38 5,498$ $(433) (07.88)Cashflowsprovidedbyoperatingactivities:
Netincome 9,620 11,005 (1,385) (12.59) 12,942 (1,937) (14.97)Adjustmentstoreconcilenetincometonetcashprovidedbyoperatingactivities
Depreciation 67,990 6,357 61,633 969.53 5,141 1,216 23.65Share-basedcompensation 1,118 1,102 16 01.45 1,053 49 4.65Restructuringandassetimpairmentcharges 240 - - - - - -Excesstaxbenefit (49) (142) 93 (65.49) (37) (105) 283.78Amortizationofintangibles 1,242 1,165 77 06.61 923 242 26.22(Gains)lossesonequityinvestments,net (425) (141) (284) 201.42 (112) (29) 25.89(Gains)lossesondivestitures - - - - (164) - -Deferredtaxes (900) (242) (658) 271.90 790 (1,032) (130.63)
Changesinassetsandliabilities:Accountsreceivable 271 (176) 447 (253.98) (678) 502 (74.04)Inventories 563 (626) 1,189 (189.94) (243) (383) 157.61Accountspayable 267 67 200 298.51 596 (529) (88.76)Accruedcompensationandbenefits 155 192 (37) (19.27) (95) 287 (302.11)Incometaxespayableandreceivable 1,019 229 790 344.98 660 (431) (65.30)Otherassetsandliabilities 865 94 771 820.21 187 (93) (49.73)Totaladjustments 11,156 7,879 3,277 41.59 8,021 (142) (01.77)
Netcashprovidedbyoperatingactivities 20,776 18,884 1,892 10.02 20,963 (2,079) (09.92)Cashflowsprovidedbyinvestingactivities:
Additionstoproperty,plantandequipment (10,711) (11,027) 316 (02.87) (10,764) (263) 2.44Acquisitions,netofcashacquired (925) (638) (287) 44.98 (8,721) 8,083 (92.68)Purchasesofavailable-for-saleinvestments (12,493) (8,694) (3,799) 43.70 (11,230) 2,536 (22.58)Salesofavailable-for-saleinvestments 934 2,282 (1,348) (59.07) 9,076 (6,794) (74.86)Maturitiesofavailable-for-saleinvestment 8,336 5,369 2,967 55.26 11,029 (5,660) (51.32)Purchasesoftradingassets (16,718) (16,892) 174 (01.03) (11,314) (5,578) 49.30Maturitiesandsalesoftradingassets 13,677 15,786 (2,109) (13.36) 11,771 4,015 34.11Collectionofloansreceivable 132 149 (17) (11.41) 134 15 11.19Originationofloansreceivable (200) (216) 16 (07.41) (206) (10) 4.85Investmentsinnon-marketableequityinvestments (440) (475) 35 (07.37) (693) 218 (31.46)ProceedsfromthesaleofIM,LLPandLLCassets - 605 - - - - -Returnofequitymethodinvestments 45 137 (92) (67.15) 263 (126) (47.91)Purchasesoflicensedtechnologyandpatents (36) (815) 779 (95.58) (66) (749) 1134.85Proceedsfromdivestitures - - - - 50 - -Otherinvesting 326 369 (43) (11.65) 370 (01) (00.27)
Netcashusedforinvestingactivities (18,073) (14,060) (4,013) 28.54 (10,301) (3,759) 36.49Cashflowsprovidedbyfinancingactivities:
Increase(decrease)inshort-termdebt,net (31) 65 (96) (147.69) 209 (144) (68.90)Proceedsfromgovernmentgrants 129 63 66 104.76 124 (61) (49.19)Excesstaxbenefit 49 142 (93) (65.49) 37 105 283.78Issuanceoflong-termdebt,netofissuancecosts - 6,124 4,962 1,162 23.42Repaymentofdebt - (125) - - - - -Proceedsfromsalesofsharesthroughemployeeequityincentiveplans 1,588 2,111 (523) (24.77) 2,045 66 3.23Repurchaseofcommonstock (2,440) (5,110) 2,670 (52.25) (14,340) 9,230 (64.37)Paymentofdividendstostockholders (4,479) (4,350) (129) 02.97 (4,127) (223) 5.40Otherfinancing (314) (328) 14 (04.27) (10) (318) 3180.00
Netcashusedforfinancingactivities (5,498) (1,408) (4,090) 290.48 (11,100) 9,692 (87.32)Effectofexchangeratefluctuationsoncashandcashequivalents (09) (03) (06) 200.00 5 (08) (160.00)Netincrease(decrease)incashandcashequivalents (2,804) 3,413 (6,217) (182.16) (433) 3,846 (888.22)Cashandcashequivalents,endofyear 5,674 8,478 (2,804) (33.07) 5,065 3,413 67.38Supplementaldisclosuresofcashflowinformation:Cashpaidduringtheyearfor:
Interest,netofcaputalizationinterest 204$ 71$ 133$ 187.32 - - -Incometaxes,netofrefunds 2,874$ 3,930$ $(1,056) (26.87) 3,338$ 592$ 17.74
IntelCorporationConsolidatedStatementofCashFlowsThreeYearsEndedDecember28,2013
(InMillions,ExceptPercentage)

Juliana De Melo �19
Analyze of Intel’s Cash Flows for Three Years
Operating Activities
Cash flow from operating activities represents the cash generated internally in a company. For Intel, include delivering and producing goods for sale and the cash effects of transactions and other events that enter into the determination of income. The Intel’s cash flow from operating activities increased in 2013 significantly to 45.17% as compared to the year 2012 and 2011 when it was only 36.26% and 34.35%. Operating activities represented 45.17% of total inflows for Intel in 2013, it is a good improvement. Increases in operating activities occur mainly by decreases in accounts receivable and inventory or an increase in accounts payable. Analyzing the horizontal statement we can clearly see an increase in accounts receivable of $447 billion from 2012 to 2013 and increase of $1,189 billion in inventories. But we also noticed the change in accounts payable was also an increase of $200 billion from 2012 to 2013 contributing for the increase in operating activities, so the increase of operating activities is due to the increase in accounts payable. Even though with the decrease of net income in 2013 of $1,385 billion compared to 2012, the increase in operating activities represents enough cash to repay debt, pay for dividends and repurchase of common stock, and trading assets, and consequently, represents a decrease of $31 billion in short-term debt occurred in 2013. The changes and assets and liabilities in 2013 compared to 2012 include lower income taxes payable and receivable resulting from a reduction in taxes due in 2013, and lower inventory.
Any change in inventory also decrease or increase operating activities. Inventory is part of the current assets. So, if the inventory method change the ending inventory balance, the calculation for operating activities will change as well. The inventory method is the only cause of differences in amounts on the income statement, the amount of tax expenses will also be greater when FIFO method is used rather than LIFO. Profit margins would be higher using FIFO, and cash flow from operations activities would be higher using LIFO because FIFO assumes that the oldest cost will be removed from inventory and will be expensed on the income statement as the cost of goods sold, but LIFO assumes that the most recent cost will be removed from inventory first and if an increase in cost occur net income will be decreased.
Investing Activities
The investing activities include acquiring, selling, or disposing of securities that are not cash equivalents and productive assets that are expected to benefit the firm for long period of

Juliana De Melo �20
time, lending money and collecting on loans. Intel’s large portion of inflows in investing activities is from maturities and sale of investments and trading assets. Total inflows amounted to 20.16% for available-for-sale investments in 2013 as compared to the year 2012 in which it was only 14.69%. Maturities and sale from trading assets declined slightly to 29.74% in 2013 compared to 30.31% in 2012. The company has spent major portion of its inflows in making additions to property, plant, and equipment to $10,711 billion in 2013 as compared to $11,027 billion and $10,764 billion in the 2012 and 2011, respectively. Additions to property, plant, and equipment represents a cash outflows. So the increase in cash used for investing activities in 2013 compared to 2012 was primarily due to an increase in purchases of available-for-sale investments and a decrease in maturities and sales of trading assets, partially offset by an increase in maturities and sales of available-for-sale investments and a decrease in purchase of licensed technology and patents. The capital expenditures were $10.7 billion in 2013, $11 billion in 2012, and $10.8 billion in 2011. The changes in investing activities depends exclusively on management decisions. Decisions about buying, selling or repurchasing investment are made according with the need of cash in the company. The company’s decrease in investments in property, plant, and equipment could mean a deficiency in Intel’s production growth. The cash flows in investing activities for Intel is due primarily of capital expenditures, investment purchases, sales, maturities, disposals and acquisition.
Financing Activities
Financing activities include borrowing from creditors and repaying the principal and obtaining resources from owners and providing them with a return on the investment. Intel’s inflows from proceeds from sales of shares had an outflow of $1,588 billion in 2013, $2,111 billion in 2012, and $2,045 billion in 2013. Repurchase of common stock had a significant outflow of $2,440 billion in 2013, but represented a decrease from 2012 of $2,670 billion. There were no issuance of long-term debit in 2013, in 2012 was $6,124 billion increase and $4,962 billion in 2011 increase. Payment of dividends has an impact of 9.18% of the total outflows in 2013, 8.94% in 2012, and 6.71% in 2011. The raise in dividends payout is not impressive for shareholders, but is still growing. The increase in dividends paid by the company can have two reasons, the percentage of the operating cash flow going toward the dividend increased, or the operating cash flow itself increased. If we go back to the operating activities analysis we can see that the operating activities itself increased. The increase in cash used for financing activities in 2013 compared to 2012 was primary due to the issuance of long-term debt in 2012 and fewer repurchase of common stock in 2013. The decrease in cash used for financing activities in 2012
Juliana De Melo �21
compared to 2011, was primarily due to fewer repurchase of common stock, and the issuance of a higher amount of long-term debt in 2012 compared to 2011.
Cash and Cash Equivalents
The changes in cash and cash equivalents are explained in the statement of cash flows. The statement of cash flows begins with the amount of cash and cash equivalent in the beginning of the year and ends of the cash and cash equivalents in the end of the year. The way the company take decisions for investing and financing activities will determine if the cash going up is a good sign for the profitability of a company and/or the cash going down is a bad sign for the profitability of a company. The cash generated by operating activities is the primary source for liquidity for Intel. The $1.9 billion cash increased in 2013 compared to 2012 provided by operating activities was due to changes in working capital and lower net income in 2013.
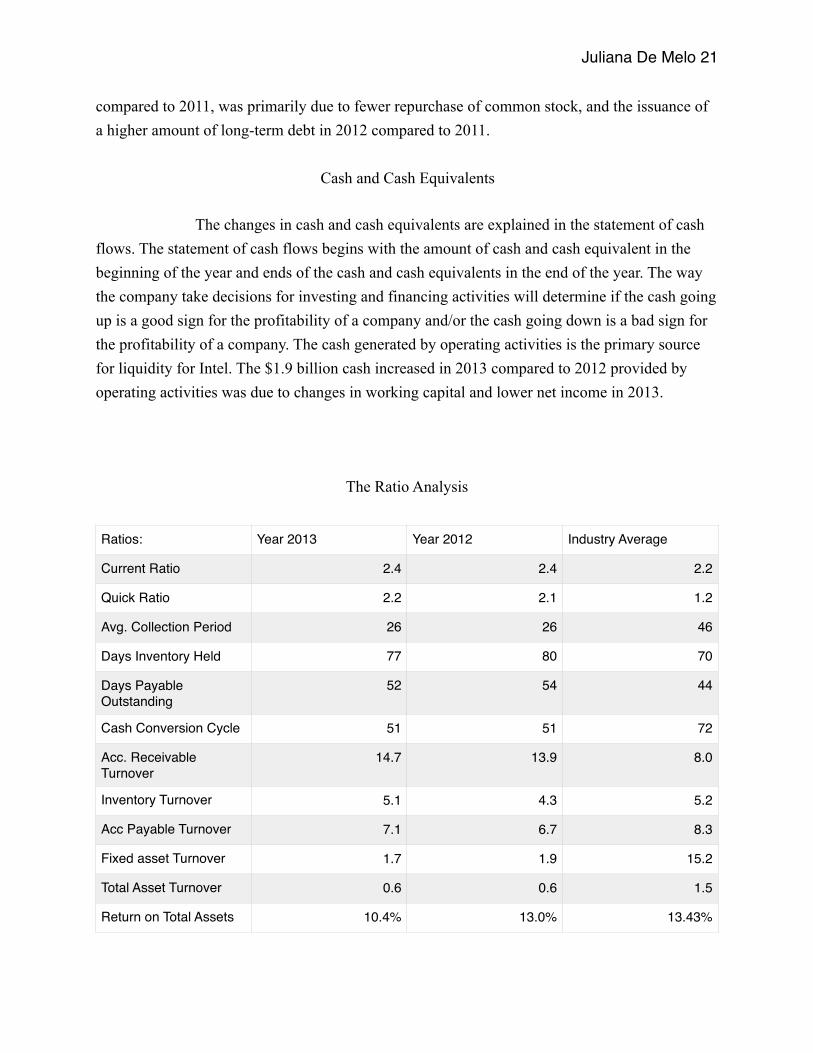
The Ratio Analysis
Ratios: Year 2013 Year 2012 Industry Average
Current Ratio 2.4 2.4 2.2
Quick Ratio 2.2 2.1 1.2
Avg. Collection Period 26 26 46
Days Inventory Held 77 80 70
Days Payable Outstanding
52 54 44
Cash Conversion Cycle 51 51 72
Acc. Receivable Turnover
14.7 13.9 8.0
Inventory Turnover 5.1 4.3 5.2
Acc Payable Turnover 7.1 6.7 8.3
Fixed asset Turnover 1.7 1.9 15.2
Total Asset Turnover 0.6 0.6 1.5
Return on Total Assets 10.4% 13.0% 13.43%

Juliana De Melo �22
Conclusion
It’ s now a good time for long-term investment in Intel stocks. Intel has shown significant growth in the market. The economy is finishing the year in a stronger place than where it began the year, so the company only tend to grow in economic aspects. The current and quick ratios show an ability of 2.4 times to pay for liabilities, this is the industry average. Even the days of account payables been higher than the industry average it is not a concern, the company meet the suppliers term and can earn a return on cash held. Intel’s cash conversion cycle is lower than the industry average. It is possible to improve by moving inventory faster, the days of inventory held is too high for the industry. Asset turnover ratios are low relative to the industry, this can be fixed by lowering investment in assets, like in property, plant and equipment that we already know that the company was investing too heavy in 2013. Intel has an incredible ability to control the growth of operating expenses and sales. The operating profit margin and gross profit margin show ratios way over the average. Intel has generated profit after considering all the cost of products sold and operating expenses.
Gross Profit Margin 59.8% 62.1% 28.7%
Operating Profit Margin 23.32% 27.44% 1.6%
Earnings per Share 1.89 2.13 15.06
Price to Earnings 13.16 9.17 11.58
Debt to Assets 36.9% 39.3% 49.7%
Debt to Equity 0.2 0.3 1.1
Times Interest Earned 8.1 15.5 8.2
Return on Equity 17.58% 22.66% 79.15%

Juliana De Melo �23
Works Cited
Intel Annual Report 2013 (Rep.). (n.d.).
Fraser, L. M., & Ormiston, A. (n.d.). Understanding Financial Statements (11th ed.). Pearson.
Intel Corp. (n.d.). Retrieved April 20, 2017, from http://financials.morningstar.com/ratios/r.html?t=INTC