jqsrt 26/11/2013 light pollution special issue evolution
TRANSCRIPT
Evolution of street lighting in Spain, Sánchez de Miguel
Accepted in JQSRT 26/11/2013 – Light pollution special Issue 1
Evolution of the energy consumed by street lighting in Spain
estimated with DMSP-OLS data
Alejandro Sánchez de Miguel, 1 Jaime Zamorano, 1 José Gómez Castaño1 and Sergio Pascual1
1 Dept. Astrofísica y CC. de la Atmósfera. Universidad Complutense de Madrid,
Avda. Complutense s/n, Madrid, 28040 Spain
tel: +34 91 394 52 38, fax: +34 91 394 4635, e-mail: [email protected]
Abstract
We present the results of the analysis of satellite imagery to study light pollution in
Spain. Both calibrated and non-calibrated DMSP-OLS images were used. We describe
the method to scale the non-calibrated DMSP-OLS images which allows us to use
differential photometry techniques in order to study the evolution of the light pollution.
Population data and DMSP-OLS satellite calibrated images for the year 2006 were
compared to test the reliability of official statistics in public lighting consumption. We
found a relationship between the population and the energy consumption which is valid
for several regions. Finally the true evolution of the electricity consumption for street
lighting in Spain from 1992 to 2010 was derived, it have been doubled in the last 18 years
in most of the provinces.
1 Introduction
Satellite images taken during the night have changed our image of the Earth and they are now one of the
most efficient tools in the fight against light pollution. Many studies on the relationship between the
amount of light registered by satellites, as DMSP with OLS, with parameters as population density and
distribution, power consumption, and economic activities, to name but a few, have been published
([10][11][12][13][14][15][37][23][46][47][48]).
The relationship between the light pollution and the emission registered from satellites has been treated
by Cinzano et al. in several papers ([3][4][5][6][7][8]). The main contributor to light pollution is public
street lighting ([14] [16] [22]). It is for this reason that our group has worked on this area since 2007 with
the aim of finding a procedure to estimate energy power consumption in public electric lighting using
both statistics and satellite data ([3][25][26][27][28][29]). This paper improves on the previous findings
and analyses by explaining the specific method to intercalibrate images and to compare these data with
the statistics.
We outline our method and results for Spain. Our goal is firstly to determine and to compare energy
efficiency for states of the European Union (EU) and then for the rest of the world in a second phase.
When colour data of the light is available (with spectral data or at least with several photometric bands),
information of the emitting sources can be obtained and therefore it is necessary to have more accurate
information about the real energy consumption and efficiency ([14], [18]).
Our method is based on empirical calibration of satellite data using statistics on the power consumption.
The total power consumption is readily available but the budget on the electric power for public lighting
is hard to find. We have only had access to the VITO report ([32]), to some sparse data for Italy ([24]),
and to the official data from Spanish Ministry of Industry. Using statistics from the year 2007 from the

Ministry of Industry, we established a relationship between the flux observed in the calibrated images of
the DMSP-OLS satellite for the year 2006. Following this, a calibration method was used to establish a
relationship between DMSP-OLS images and the power consumption to verify its evolution. Once the
method was validated using the statistics, we compared the results with the data of the Ministry between
the years of 1975 and 2007.
This procedure allowed us to estimate the power consumption for street lighting from 1992 to 2012 based
on satellite imagery. Our analysis is purely statistical, despite the obvious relationship of physics between
the electricity consumption with the emission produced by the light sources detected in the satellite
images. However, a complete physical model should take into account factors such as the type of
emission source, which can increase the estimation by 100%, in the consumption of specific regions.
Other atmospheric effects, such as scattering, have not been taken into consideration because it is a
second order effect which does not dominate on a large scale. As it is evident from the development of
this work, the radiance seems to be directly correlated with the consumption and therefore higher order
corrections are not needed.
2 Data
2.1 DMPS-OLS images:
Our main source of satellite data is the radiance calibrated DMSP-OLS images corresponding to 1996-
1997 ([13]) and 2006 ([36]). There are other images calibrated but not accessible to the public. There
were non-calibrated DMSP-OLS images of 1992-2010 ([1], [10], [13] & [15]). Our future work will
include data from Suomi NPP/VIIRS [41]. This data is provided by the Earth Observation Group (NOAA
National Geophysical Data Center). An additional source of information is the nocturnal pictures taken by
astronauts aboard the International Space Station (ISS) [42]. These images taken with digital cameras that
have three color channels and can be calibrated ([30], [34]). The data extraction was performed using GIS
techniques, unlike in [29], where it was performed a manual extraction.
2.2 Available statistics data:
The Spanish Ministry of Industry, Energy and Tourism webpage publishes annual reports (“Estadísticas
Eléctricas Anuales”) [40]1 which provide information for each activity sector. National data from 1958 to
2007 are available, whereas they provide information for each Spanish province from 1975.
As we have already shown in previous work, there are some discrepancies between the official data and
the true power consumption (see Figure 6 of [26]). Some provinces show abnormally decreasing values
between 1985 and 1992 and the national power consumption seems to be stabilized before an increase
from 1992 onwards. Using official data from the book “La Energía en España 2004” [43] and from
information from the years 1936 to 1957, collected at the Instituto Nacional de Estadística (INE), we have
rebuilt the real evolution of the electric power consumption in public lighting for Spain [27]. An
exhaustive analysis of the statistics was carried out to find the source of these errors. The official data,
provided by the Spanish Ministry, have already corrected this error, however only for the year 2007 as
well as some less populated provinces for all the years as it is easy to see in Figure 10.
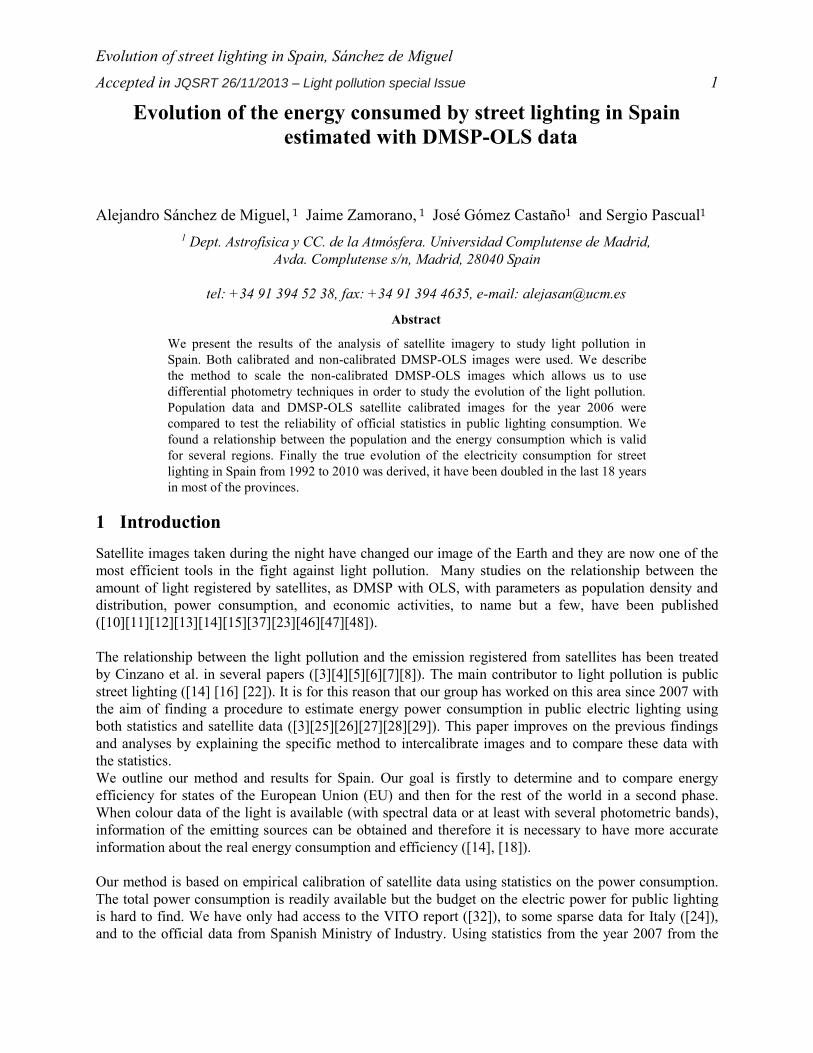
A test was conducted on the official correction of the data. We performed a comparison between energy
consumption and the cumulative radiance for 2007 following the prescriptions of [13]. Figure one shows
1http://www.minetur.gob.es/energia/balances/Publicaciones/ElectricasAnuales/Paginas/ElectricasAnuales.aspx
Evolution of street lighting in Spain, Sánchez de Miguel
Accepted in JQSRT 26/11/2013 – Light pollution special Issue 3
the line of best fit for the data. The fit is very good, based on the Pearson correlation coefficient of
R2=0.93. All the analyses have been done with Python scripts.
Figure 1. Power consumption in street lighting versus population.
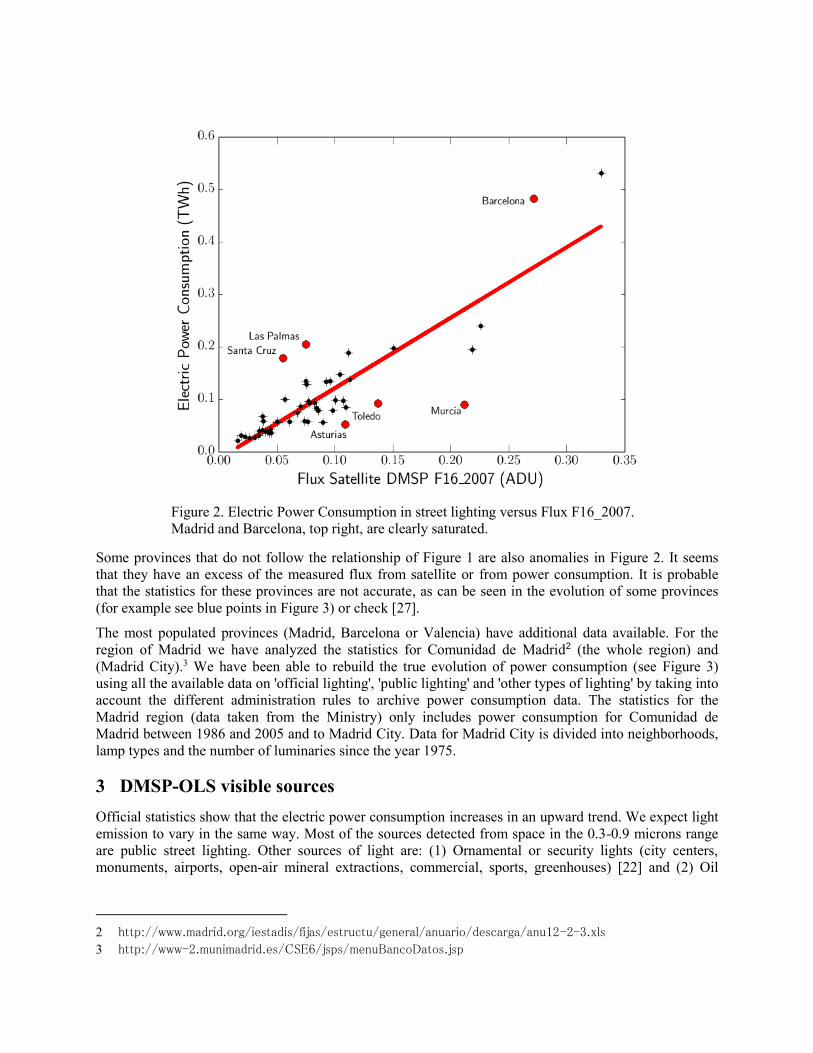
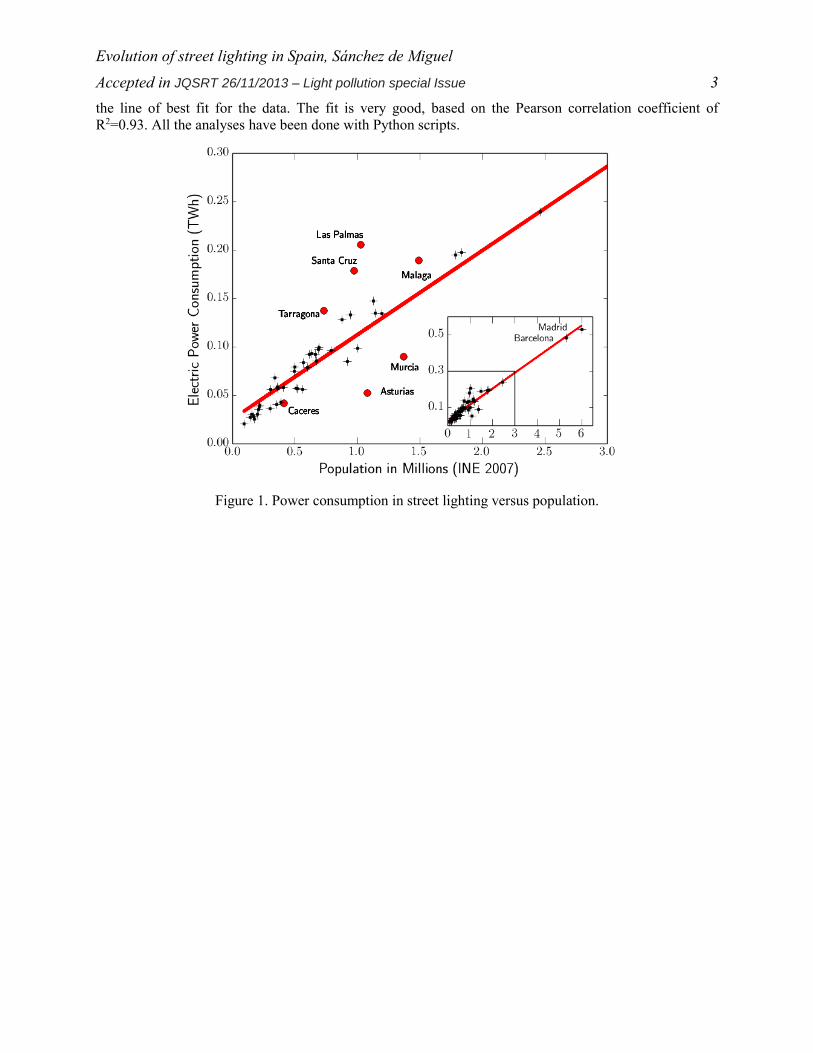
Figure 2. Electric Power Consumption in street lighting versus Flux F16_2007.
Madrid and Barcelona, top right, are clearly saturated.
Some provinces that do not follow the relationship of Figure 1 are also anomalies in Figure 2. It seems
that they have an excess of the measured flux from satellite or from power consumption. It is probable
that the statistics for these provinces are not accurate, as can be seen in the evolution of some provinces
(for example see blue points in Figure 3) or check [27].
The most populated provinces (Madrid, Barcelona or Valencia) have additional data available. For the
region of Madrid we have analyzed the statistics for Comunidad de Madrid2 (the whole region) and
(Madrid City).3 We have been able to rebuild the true evolution of power consumption (see Figure 3)
using all the available data on 'official lighting', 'public lighting' and 'other types of lighting' by taking into
account the different administration rules to archive power consumption data. The statistics for the
Madrid region (data taken from the Ministry) only includes power consumption for Comunidad de
Madrid between 1986 and 2005 and to Madrid City. Data for Madrid City is divided into neighborhoods,
lamp types and the number of luminaries since the year 1975.
3 DMSP-OLS visible sources
Official statistics show that the electric power consumption increases in an upward trend. We expect light
emission to vary in the same way. Most of the sources detected from space in the 0.3-0.9 microns range
are public street lighting. Other sources of light are: (1) Ornamental or security lights (city centers,
monuments, airports, open-air mineral extractions, commercial, sports, greenhouses) [22] and (2) Oil
2 http://www.madrid.org/iestadis/fijas/estructu/general/anuario/descarga/anu12-2-3.xls
3 http://www-2.munimadrid.es/CSE6/jsps/menuBancoDatos.jsp

Evolution of street lighting in Spain, Sánchez de Miguel
Accepted in JQSRT 26/11/2013 – Light pollution special Issue 5
extractions, fires and boats. These transients are mostly removed by [1] in the DMSP-OLS Stable lights
products.
Light sources for group (1) are metal-halide lamps in Spain and they can be easily found in ISS images
mainly in city centers. They are usually excluded from statistics because they are not public street
lighting, as they appear saturated and their contribution varies during the night (Sanchez de Miguel et al.
in prep.) & [22]. The Flaring sources are that uncommon in Spain that they do not appear in the Global
Gal Flaring Estimates of the Earth Observatory NOAA [44].
Figure 3: Madrid region electric power consumption for street lighting. The data from the
Ministry is in black, the data from Comunidad de Madrid is in red, as the original data of
Comunidad de Madrid had not Madrid city included between 1986 to 1999 they had been
added, then it’s shown the original data of the Comunidad de Madrid with year with arrows
because they don’t match with previous data. Madrid city data is in blue dots with blue line.
Blue squares, estimated consumption using radiance calibrated data, DMSP 1997, DMSP
2006 and testing 2012 VIIRS. The magenta dots came from the non-calibrated images. The
blue square’s error bars have been calculated using the 90% confidence interval of the Power
consumption vs. radiance fit. The magenta error bars have been calculated using the satellite
dispersion correction and the 90% confidence interval to represent power consumption vs.
radiance fit (see additional e-components for detail figure of each province).

Light sources of group (2) are also out of the official statistics but not being stable, they are not present in
the final calibrated satellite DMSP/OLS images or they are only present in the 50% ([12]). They present
spectra of black bodies of different temperatures.
4 Electric power consumption using satellite images
4.1 Empirical calibration using radiance calibrated satellite images
We have obtained the cumulative radiance for the Spanish provinces following the methodology
described by [13]. In comparison to the power consumption, we do not use the total consumption, but the
public street lighting, more related to the light emission detected by DMSP satellite. It should be kept in
mind that the amount of light also depends on many other parameters such as the ground reflectivity, the
lamp efficiency and the street design to name but a few. We have already shown in Figure 2 the
relationship, even using the non-calibrated image.
Evolution of street lighting in Spain, Sánchez de Miguel
Accepted in JQSRT 26/11/2013 – Light pollution special Issue 7
The relationship between the power consumption in street lighting and the calibrated cumulative radiance
is plotted in Figure 4. To reject outliers we use a robust linear fit as explained in [33]. Next fit is potential
log10(y) = m log10(x) + c.
Figure 4: Fit to the power consumption in street lighting to cumulative radiances.
Potential fit to the data is shown in red. The inset shows an extended plot to include
Madrid and Barcelona.

To compare with previous pioneering works in this field we represent our data in Figure 5 and compare it
with that of the states in the USA from [13]. The power consumption for the states of the USA has been
divided by 80 to estimate the consumption in public lighting (around 1.77% [38], although the typical
lighting efficiency in USA's lamps are 84 W/lm [38] against the 121 W/lm in Spain [32].) So, we have
corrected this offset and the continuous line (fit Figure 4) is compatible with these data. Area correction
(see [15], [19]) is not needed in this case as the differences for Iberian Peninsula are less than 10% and
the latitude is similar to USA.
4.2 Cross calibration of DMSP-OLS satellites
Radiance calibrated data is the key ingredient to study the evolution of electric power consumption in
public lighting from satellite data. Some efforts have been made in the past to cross-calibrate DMSP-OLS
data since there is an evident relationship between calibrated and non-calibrated images as shown for
instance in [13],[48] or in Falchi private communication 2009. Our strategy consists of using data for
Spanish provinces where there are almost no light sources of group #2 but many of group #1, mainly
found in city centers. It is interesting to note that the ornamental lights are variable (they are switched off
during the night) and they appear only if there are present in more than 50% of the DMSP-OLS images
[1]. Pictures taken by astronauts from ISS clearly show this effect when images at different hours during
the night are compared.
Figure 5:(Left) Comparison between the total power Consumption in Elvidge et al. 1999 dived by
factor 80, and the street light power consumption in Spain. The same lines in Figure 4.
Figure 6: (Right) Population versus Cumulative radiance. USA by Elvidge et al. 1999, Spain this
work.
Evolution of street lighting in Spain, Sánchez de Miguel
Accepted in JQSRT 26/11/2013 – Light pollution special Issue 9
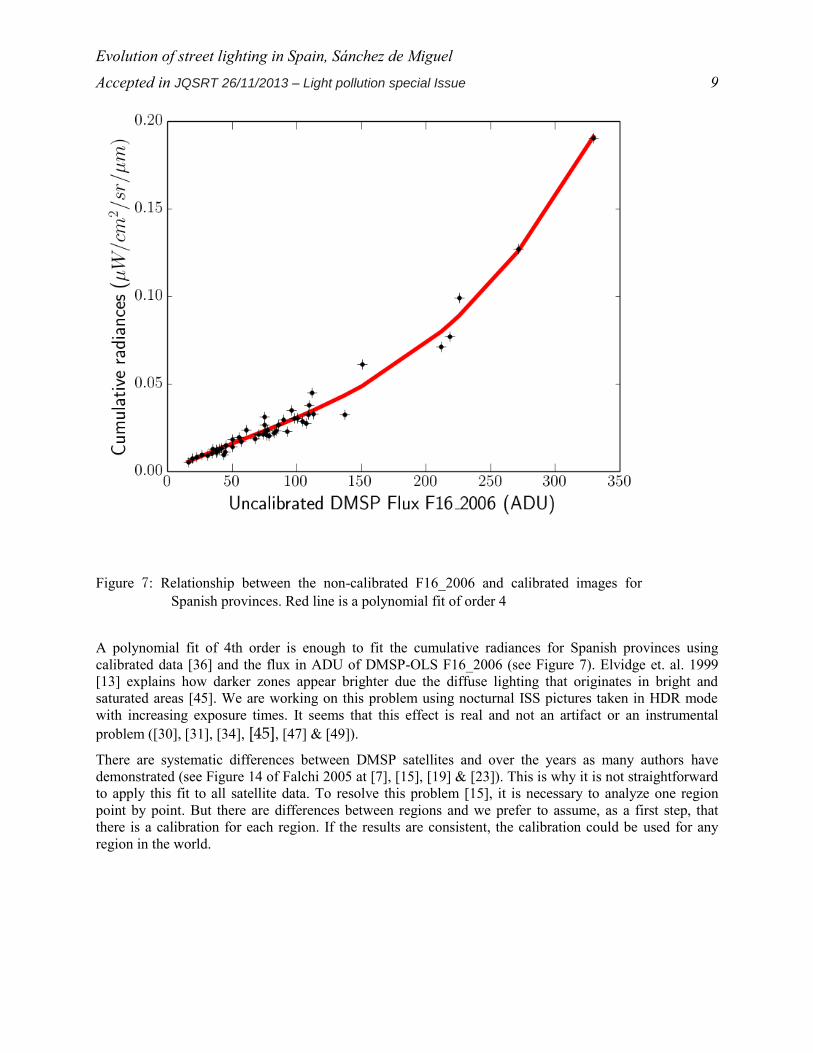
A polynomial fit of 4th order is enough to fit the cumulative radiances for Spanish provinces using
calibrated data [36] and the flux in ADU of DMSP-OLS F16_2006 (see Figure 7). Elvidge et. al. 1999
[13] explains how darker zones appear brighter due the diffuse lighting that originates in bright and
saturated areas [45]. We are working on this problem using nocturnal ISS pictures taken in HDR mode
with increasing exposure times. It seems that this effect is real and not an artifact or an instrumental
problem ([30], [31], [34], [45], [47] & [49]).
There are systematic differences between DMSP satellites and over the years as many authors have
demonstrated (see Figure 14 of Falchi 2005 at [7], [15], [19] & [23]). This is why it is not straightforward
to apply this fit to all satellite data. To resolve this problem [15], it is necessary to analyze one region
point by point. But there are differences between regions and we prefer to assume, as a first step, that
there is a calibration for each region. If the results are consistent, the calibration could be used for any
region in the world.
Figure 7: Relationship between the non-calibrated F16_2006 and calibrated images for
Spanish provinces. Red line is a polynomial fit of order 4
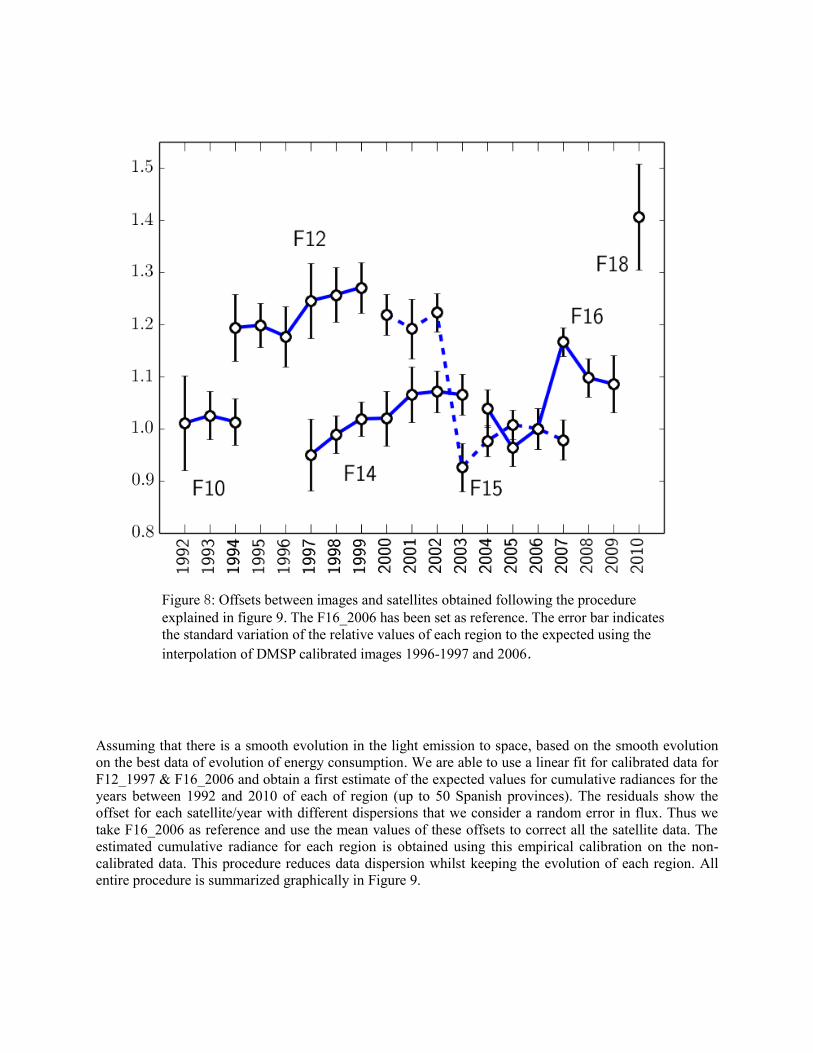
Assuming that there is a smooth evolution in the light emission to space, based on the smooth evolution
on the best data of evolution of energy consumption. We are able to use a linear fit for calibrated data for
F12_1997 & F16_2006 and obtain a first estimate of the expected values for cumulative radiances for the
years between 1992 and 2010 of each of region (up to 50 Spanish provinces). The residuals show the
offset for each satellite/year with different dispersions that we consider a random error in flux. Thus we
take F16_2006 as reference and use the mean values of these offsets to correct all the satellite data. The
estimated cumulative radiance for each region is obtained using this empirical calibration on the non-
calibrated data. This procedure reduces data dispersion whilst keeping the evolution of each region. All
entire procedure is summarized graphically in Figure 9.
Figure 8: Offsets between images and satellites obtained following the procedure
explained in figure 9. The F16_2006 has been set as reference. The error bar indicates
the standard variation of the relative values of each region to the expected using the
interpolation of DMSP calibrated images 1996-1997 and 2006.

Evolution of street lighting in Spain, Sánchez de Miguel
Accepted in JQSRT 26/11/2013 – Light pollution special Issue 11
Figure 9: Calibration procedure. Right branch top: Relationship between the flux from the integrated
regions in the calibrated image F16_2006 and Energy consumption of 2007 per region. Centre branch top,
Relationship between integrated flux in calibrated image F16_2006 and non-calibrated F16_2006. Then
apply this relationship to all non-calibrated data. Left branch top: Estimated grow between 1992-2010
using Calibrated data 1996-7 and 2006. Fit Centre Branch with left branch and correct the systematic
offset per satellite. Correct original non-calibrated with the offset from the satellites. Use the relationship
between non-calibrated and calibrated 2006. Then use right branch data (relationship between energy
consumption and calibrated data) to obtain an estimation of the energy that had been consumed. Then
Check with the stats of energy consumption on street lighting.
4.3 Calibration of Electric power consumption in public lighting versus cumulative radiances
The quality of our empirical calibration we tested by comparing the evolution of the cumulative radiances
for the respective region studied with the statistics in electric power consumption in public lighting as
explained above. The panels of Figure 10 show the plot for each one of the Spanish provinces.
The correlations are extremely good for the less populated provinces (i.e., Ávila, Cantabria, Burgos,
Huesca, Soria …) whose official statistics seems to be accurate. The inconsistencies found for the most
populated provinces, where power consumption has only been similar to that expected from satellite data
in recent years, are due to the change in electric lighting statistics which was mentioned above for the
case of Madrid.
For some provinces it seems the shape of evolution is correct, with an absolute difference. The differences
could be due to poor empirical calibration, however other explanations are possible as they fail to include

some cities in the total power consumption statistics or use luminaries with different efficiencies. We are
working on a detailed study for the region of Madrid, where detailed official statistics data are available,
using RGB color data from ISS nocturnal pictures, SUOMI-NPP/VIIRS and DMPS-OLS.
These good agreements between the DMSP-OLS radiances and public power consumption in street
lighting do not necessary imply that all emissions came from this type of sources. In fact, a recent study
found that only 44-55% of consumption maybe considered as public street lighting (streets, parks,
motorways …) [22]. This issue will be studied for the case of Spain and will be discussed in future
studies, but this statistical relationship implies that the same scale factor is applied to public lighting and
private lighting.
5 Conclusions and results
We have shown whown power consumption data relates to calibrated and non-calibrated radiance images.
There is still a considerable uncertainty for high radiance regions where there are many sources of error
which cannot be considered as stable sources, in fact it is in these regions where light pollution may come
from other sources not related to public lighting. In spite of this, and the fact that these regions are
saturated by non-calibrated images, they can be measured thanks to their ability to produce more diffuse
light on not lit regions (overglow [45]). This diffuse light comes from point spared function of the
instrument and the atmospherically diffusion. The effect of projection has not been taken into account in
order to make a correction on the area represented by each pixel in order to compare with the work of
[13]. Having said this, an analysis for Europe is underway considering this effect without moving the
information as in [2] but using reprojection [15]. The most populated provinces appear to have begun to
stabilize the growth of expenditure on public lighting (Figure 10). However this does not occur in the less
populated provinces which continue to grow at a similar rate in spite of the economic crisis. The general
trend of the country had been grow nearly constantly by 18 years as we can see in Figure 11. Only in the
last year maybe the country had stop growing in power consumption.

Evolution of street lighting in Spain, Sánchez de Miguel
Accepted in JQSRT 26/11/2013 – Light pollution special Issue 13
Figure 10: Evolution of power consumption in street lighting. The official data is in black dots. The non-calibrated
data in magenta and the calibrated data in the form of blue squares. 1996-1997 DMSP-OLS, 2006 DMSP-OLS and
testing 2012 SUOMI-NPP/VIIRS. Scale are different for each plot. Limits in power consumption have been set as
plotted in the lower right panel to show variation in each province.
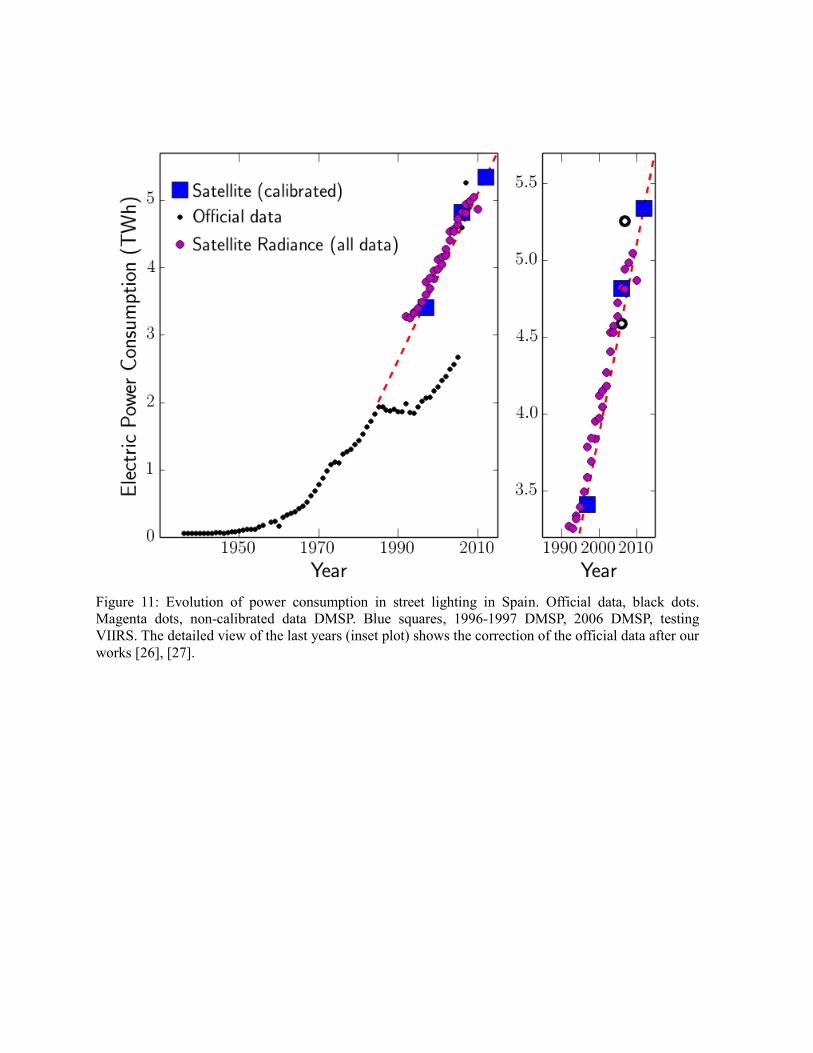
Figure 11: Evolution of power consumption in street lighting in Spain. Official data, black dots.
Magenta dots, non-calibrated data DMSP. Blue squares, 1996-1997 DMSP, 2006 DMSP, testing
VIIRS. The detailed view of the last years (inset plot) shows the correction of the official data after our
works [26], [27].
Evolution of street lighting in Spain, Sánchez de Miguel
Accepted in JQSRT 26/11/2013 – Light pollution special Issue 15
Acknowledgments
This work has been partially funded by the Spanish MICINN (AYA2009-10368, AYA2012-30717), by
the Spanish programme of International Campus of Excellence Moncloa (CEI) and by the Madrid
Regional Government through the AstroMadrid Project (CAM S2009/ESP-1496). Thanks goes also to
Francisco Ocaña and Jessica Starkey for the critical review of this text.
References
[1] Baugh K, Elvidge C, Ghosh T, Ziskin D (2011) Development of a 2009 Stable Lights Product
using DMSPOLS data. Proceedings of the Asia Pacific Advanced Network
[2] Cardiel, N.; Gorgas, J.; Gallego, J.; Serrano, A.; Zamorano, J.; García-Vargas, M.; Gómez-
Cambronero, P.; Filgueira, J.M., Proper handling of random errors and distortions in astronomical data
analysis, Astronomical Data Analysis II. Edited by Starck, Jean-Luc; Murtagh, Fionn D. Proceedings of
the SPIE, Volume 4847, pp. 297-304 (2002)
[3] Cinzano, P. (2000). The growth of light pollution in north-eastern Italy from 1960 to
1995. Memorie della Società astronomica italiana, 71, 159.
[4] Cinzano, P., Falchi, F., & Elvidge, C. D. (2002). Naked‐eye star visibility and limiting magnitude
mapped from DMSP-OLS satellite data. Monthly Notices of the Royal Astronomical Society, 323(1), 34-
46.
[5] Cinzano, P., Falchi, F., & Elvidge, C. D. (2002). The first world atlas of the artificial night sky
brightness. Monthly Notices of the Royal Astronomical Society, 328(3), 689-707.
[6] Cinzano, P., Falchi, F., Elvidge, C. D., & Baugh, K. E. (2003). The artificial night sky brightness
mapped from DMSP satellite Operational Linescan System measurements. Monthly Notices of the Royal
Astronomical Society,318(3), 641-657.
[7] Cinzano, P., Falchi, F., Elvidge, C.D., Recent progress on a second world atlas of the night-sky
brightness, World Conference in Defense of the Night Sky and the Right to Observe the Stars, 20-23 april
2007, La Palma.
[8] Cinzano, P., & Falchi, F. (2012). The propagation of light pollution in the atmosphere. arXiv
preprint arXiv:1209.2031.
[9] Elvidge, C., Pettit, D., Imhoff, M., Nemani, R., Pack, D., & Cinzano, P. (2008, August).
Observational considerations for moderate resolution nighttime lights. In Optical Engineering+
Applications (pp. 70810V-70810V). International Society for Optics and Photonics.
[10] Elvidge, C. D., Baugh, K. E., Kihn, E. A., Kroehl, H. W., & Davis, E. R. (1997). Mapping city
lights with nighttime data from the DMSP Operational Linescan System. Photogrammetric Engineering
and Remote Sensing, 63(6), 727-734.
[11] Elvidge, C., Baugh, K., Hobson, V., Kihn, E., Kroehl, H., Davis, E., & Cocero, D. (1997).
Satellite inventory of human settlements using nocturnal radiation emissions: a contribution for the global
toolchest. Global Change Biology, 3(5), 387-395.
[12] Elvidge, C. D., Baugh, K. E., Kihn, E. A., Kroehl, H. W., Davis, E. R., & Davis, C. W. (1997).
Relation between satellite observed visible-near infrared emissions, population, economic activity and
electric power consumption. International Journal of Remote Sensing, 18(6), 1373-1379.
[13] Elvidge, C. D., Baugh, K. E., Dietz, J. B., Bland, T., Sutton, P. C., & Kroehl, H. W. (1999).
Radiance calibration of DMSP-OLS low-light imaging data of human settlements. Remote Sensing of
Environment, 68(1), 77-88.

[14] Elvidge, C. D., Cinzano, P., Pettit, D. R., Arvesen, J., Sutton, P., Small, C., ... & Ebener, S.
(2007). The Nightsat mission concept. International Journal of Remote Sensing, 28(12), 2645-2670.
[15] Elvidge, C. D., Daniel Ziskin, Kimberly E. Baugh, Benjamin T. Tuttle, Tilottama Ghosh, Dee
W. Pack, Edward H. Erwin and Mikhail Zhizhin,A Fifteen Year Record of Global Natural Gas Flaring
Derived from Satellite Data,Energies 2009, 2, 595-622; doi:10.3390/en20300595
[16] Gallaway, T., Olsen, R. N., & Mitchell, D. M. (2010). The economics of global light
pollution. Ecological Economics, 69(3), 658-665.
[17] Marín, C., Jafari, J., Orlando, G., Belmonte, J. A., Hernández, L. C., Castro, F. J. D., ... &
Tenydea, S. L. www. starlight2007. Net.
[18] Metcalf, J.P., Detecting and Characterizing nighttime lighting using multispectral and
hyperspectral imaging, Thesis, Naval Postgraduate school, Monterrey California, December 2012.
http://calhoun.nps.edu/public/handle/10945/27869
[19] Husi Letu, Masanao Hara, Hiroshi Yagi, Kazuhiro Naoki, Genen Tana, Fumihiko Nishio and
Okada Shuhiei,Estimating energy consumption from night-time DMPS/OLS imagery after correcting for
saturation effects,International Journal of Remote Sensing Vol. 31, No. 16, 20 August 2010, 4443–4458
[20] Imhoff, M. L., Lawrence, W. T., Elvidge, C. D., Paul, T., Levine, E., Privalsky, M. V., & Brown,
V. (1997). Using nighttime DMSP/OLS images of city lights to estimate the impact of urban land use on
soil resources in the United States.Remote Sensing of Environment, 59(1), 105-117.
[21] Jehl, A., Farges, T., & Blanc, E. (2013). Color pictures of sprites from non‐dedicated observation
on board the International Space Station. Journal of Geophysical Research: Space Physics.
[22] Kuechly, H. U., Kyba, C., Ruhtz, T., Lindemann, C., Wolter, C., Fischer, J., & Hölker, F. (2012).
Aerial survey and spatial analysis of sources of light pollution in Berlin, Germany. Remote Sensing of
Environment, 126, 39-50.
[23] Bhartendu Pandey, P.K. Joshi, Karen C. Seto,Monitoring urbanization dynamics in India using
DMSP/OLS night time lights and SPOT-VGT data,International Journal of Applied Earth Observation
and Geoinformation 23 (2013) 49–61
[24] Pindar, A., PapettiI, M., Public Procurement of Energy Saving Technologies in Europe
(PROST)Report on the Country Study for Italy:Task 2a - Current Public Sector Purchasing, Building, and
Replacement Practices Task 4b - PICO Feasibility Study. February 2002,Politecnico di Milano
[25] Sánchez de Miguel, A. (2007). Differential Photometry Study of the European Light Emission to
the Space. . In World Conference in Defence of the Night Sky and the Right to Observe the Stars, 20-23
april 2007, La Palma.
[26] Sánchez de Miguel, A., & Zamorano Calvo, J. (2008). Light pollution in Spain. An european
perspective. Highlights of Spanish Astrophysics V. http://eprints.ucm.es/12281/
[27] Sánchez de Miguel, A., Zamorano, J., Pila-Díez, B., Rubio, J., Ruiz, R., Rodríguez-Herranz, I., &
González-Pérez, A. (2011, November). Light pollution in Spain 2010. In Highlights of Spanish
Astrophysics VI (Vol. 1, pp. 784-784).
[28] Sánchez de Miguel, A., & Zamorano, J. (2011). Midiendo la contaminación del cielo desde el
espacio. Física y sociedad, (21), 24-25.
[29] Sánchez de Miguel, A., Zamorano, J., Gómez Castaño, J., Pascual Ramírez, S., López Cayuela,
M. A., Gallego Maestro, J., ... & Challupner, P. (2012). Contaminación Lumínica en España 2012: Light
Pollution in Spain 2012. Highlights of Spanish Astrophysics VII. http://eprints.ucm.es/15970/
Evolution of street lighting in Spain, Sánchez de Miguel
Accepted in JQSRT 26/11/2013 – Light pollution special Issue 17
[30] Sánchez de Miguel, A., Zamorano, J., Pascual, S., Ocaña, F., López Cayuela, M., Challupner, P.,
Gómez Castaño, J., Fernandez-Renau, A, Gómez, J.A., De Miguel, E., SpS17, Light Pollution: Protecting
Astronomical Sites and Increasing Global Awareness through Education. Proceedings IAU Symposium,
2012 (in press)
[31] Zamorano, J., Sánchez de Miguel, A.,, Ocaña, F, Castaño, J., El uso de imágenes de satélite para
combatir la Contaminación Lumínica. (may 2013). AstronomíA.
[32] P. Van Tichelen, T. Geerken, B. Jansen , M. Vanden Bosch, V. Van Hoof, L. Vanhooydonck, A.
Vercalsteren, Final Report Lot 9: Public street lighting,2007/ETE/R/021
[33] Xi Li , Xiaoling Chen , Yousong Zhao , Jia Xu , Fengrui Chen & Hui Li (2013):Automatic
intercalibration of night-time light imagery using robust regression, Remote Sensing Letters, 4:1, 45-54
[34] Zamorano, J., Sánchez de Miguel, A., Pascual Ramírez, S., Gómez Castaño, J., Ramírez Moreta,
P., & Challupner, P. (2011). ISS nocturnal images as a scientific tool against Light Pollution. LICA
report, April 2011. Version 1.8, http://eprints.ucm.es/12729/
[35] Naizhuo Zhao, Tilottama Ghosh & Eric L. Samson (2012): Mapping spatio-temporal changes of
Chinese electric power consumption using night-time imagery, International Journal of Remote Sensing,
33:20, 6304-6320
[36] Ziskin D, Baugh K, Hsu FC, Ghosh T, Elvidge C (2010) Methods Used For the 2006 Radiance
Lights Proceedings of the 30th Asia-Pacific Advanced Network Meeting, August 9-13, Hanoi, Vietnam
[37] L. Zhuo, T. Ichinose, J. Zheng, J. Chen, P. J. Shi and X. Li, Modelling the population density of
China at the pixel level based on DMSP/OLS non-radiance-calibrated night-time light images
International Journal of Remote Sensing Vol. 30, No. 4, 20 February 2009, 1003–1018
[38] Lighting Market Characterization Vol.1 National Lighting Inventory and Energy Consumption
Estimate 9/02. http://www.netl.doe.gov/ssl/PDFs/lmc_vol1_final.pdf
[39] Luginbuhl, C. B., Lockwood, G. W., Davis, D. R., Pick, K., & Selders, J. (2009). From the ground
up I: light pollution sources in Flagstaff, Arizona. Publications of the Astronomical Society of the Pacific,
121(876), 185-203.
[40] Estadística de la Industria de la Energía Eláctrica 2007., Madrid 2009, ISBN 978-84-96275-84-5, and
others.
http://www.minetur.gob.es/energia/balances/Publicaciones/ElectricasAnuales/Paginas/ElectricasAnuales.
aspx
[41] Mills, S. (2010, January). Calibration of the VIIRS Day/Night Band (DNB). InAmerican
Meteorological Society 6th Annual Symposium on Future National Operational Environmental Satellite
Systems-NPOESS and GOES-R (Vol. 9).
[42] Pettit, D. (2008). Cities at Night, an Orbital Tour Around the World. NASA JSC Houston,
TX, 77058(281), 244-8917. http://www.youtube.com/watch?v=eEiy4zepuVE
[43] La energía en España 2004, Ministerio de Industria, Turismo y Comercio.
http://www.minetur.gob.es/energia/balances/Balances/LibrosEnergia/Energia_2004.pdf
[44] http://ngdc.noaa.gov/eog/interest/gas_flares.html
[45] Townsend, A. C., & Bruce, D. A. (2010). The use of night-time lights satellite imagery as a measure
of Australia's regional electricity consumption and population distribution. International Journal of
Remote Sensing, 31(16), 4459-4480.
[46] Small C, Elvidge C (2012) Night on Earth: Mapping decadal changes of anthropogenic night light in
Asia. International Journal of Applied Earth Observation and Geoinformation.

[47] Letu H, Hara M, Tana G, Nishio F (2012) A Saturated Light Correction Method for DMSP/OLS
Nighttime Satellite Imagery. Geoscience and Remote Sensing, IEEE Transactions on, vol.50, no.2,
pp.389,396.
[48] Elvidge, C. D., Chapter in “Global Urban Monitoring and Assessment Through Earth
Observation” Editor Qihao Weng. CRC Press. 2013 (In Press).
[49] Kyba, C. C., Wagner, J. M., Kuechly, H. U., Walker, C. E., Elvidge, C. D., Falchi, F., ... & Hölker,
F. (2013). Citizen Science Provides Valuable Data for Monitoring Global Night Sky
Luminance. Scientific reports, 3.