j.p. morgan 34th annual healthcare conference presentation
TRANSCRIPT

© Copyright 2016, Cardinal Health, Inc. or one of its subsidiaries. All rights reserved
Healthcare is changing…
We’re changing healthcare.George S. Barrett
Chairman and Chief Executive Officer
J.P. Morgan Healthcare Conference
January 12, 2016

© Copyright 2016, Cardinal Health, Inc. or one of its subsidiaries. All rights reserved.1
Forward-looking statements and GAAP reconciliation
Cautions Concerning Forward-Looking Statements
This presentation contains forward-looking statements addressing expectations, prospects, estimates and other matters that are dependent
upon future events or developments. These statements may be identified by words such as "expect," "anticipate," "intend," "plan," "believe,"
"will," "should," "could," "would," "project," "continue," "likely," and similar expressions, and include statements reflecting future results or
guidance, statements of outlook and expense accruals. These matters are subject to risks and uncertainties that could cause actual results
to differ materially from those projected, anticipated or implied. These risks and uncertainties include competitive pressures in Cardinal
Health's various lines of business; the ability to continue to achieve and maintain the benefits from the generic sourcing joint venture with
CVS Health; the ability to achieve and maintain the benefits from our acquisitions of Cordis and The Harvard Drug Group; the frequency or
rate of pharmaceutical price appreciation or deflation and the timing of generic and branded pharmaceutical introductions; the risk of non-
renewal or a default under one or more key customer or supplier arrangements or changes to the terms of or level of purchases under
those arrangements; uncertainties due to government health care reform including federal health care reform legislation; changes in the
distribution patterns or reimbursement rates for health care products and services; the effects of any investigation or action by any
regulatory authority; and changes in the cost of commodities such as oil-based resins, cotton, latex and diesel fuel. Cardinal Health is
subject to additional risks and uncertainties described in Cardinal Health's Form 10-K, Form 10-Q and Form 8-K reports and exhibits to
those reports. This presentation reflects management's views as of January 12, 2016. Except to the extent required by applicable law,
Cardinal Health undertakes no obligation to update or revise any forward-looking statement. In addition, this presentation contains Non-
GAAP financial measures. Cardinal Health provides definitions and reconciliations of the differences between the Non-GAAP financial
measures and their most directly comparable GAAP financial measures in the Financial Appendix at the end of these presentations and at
ir.cardinalhealth.com. An audio replay of the conference call will be available at ir.cardinalhealth.com.
© Copyright 2016, Cardinal Health, Inc. or one of its subsidiaries. All rights reserved.
For those tasked with navigating the complexities of healthcare…
Cardinal Health brings
scaled solutions that
help our customers thrive
in a changing world.

© Copyright 2016, Cardinal Health, Inc. or one of its subsidiaries. All rights reserved.3
Essential facts about Cardinal Health

© Copyright 2016, Cardinal Health, Inc. or one of its subsidiaries. All rights reserved.4
Non-GAAP EPSRolling 3-year CAGRs
11%FY11 – FY14
11%FY12 – FY15
12%1
FY13 – FY16(E)
Generated
>$9BIn cash from operations
FY11 – FY15
Financial highlights and goals
Total Shareholder Return2 of
176%From FY11 – FY15
Long-term goals
1CAGR for FY13 – FY16(E) uses midpoint of FY16 guidance range of $5.15 - $5.35 provided on November 2, 2015.2TSR assumes the reinvestment of dividends.3Based on full year dividends paid in FY15 versus non-GAAP EPS for FY15.
Please see appendix for comparable GAAP numbers and GAAP to Non-GAAP reconciliations.
Non-GAAP EPS CAGR
10-15%
Annual Dividend Payout
30-35%(FY15 Dividend Payout Ratio3 31%)
Highlights

© Copyright 2016, Cardinal Health, Inc. or one of its subsidiaries. All rights reserved.5
Key trends in healthcare

© Copyright 2016, Cardinal Health, Inc. or one of its subsidiaries. All rights reserved.6
GenericsSpecialty &
BiopharmaInternational
Health
System & Hospital
Solutions
Alternate Sites
of Care
Expand generics
customer base
Red Oak
Largest U.S. generic
sourcing entity
Harvard Drug GroupIncreased telesales
presence
Upstream solutions for
BiopharmaRegulatory sciences, 3PL
services, Patient HUB (Sonexus)
Metro MedicalIncrease scale and
expanded therapeutic reach
Grow post-acute
leveraging IDN experience
and scale
Cardinal Health at Home Leader in medical products to the
home
Henry Schein alliance
Discharge managementnaviHealth
Scaled and standardized
solutions
360 Program Comprehensive suite of solutions
Cardinal Health brand
consumables
Physician preference itemsCardiovascular (Cordis), Negative
Pressure Wound Therapy and
Ortho Trauma
ChinaTop 10 distributor
Global product
expansion(Cordis)
Our priorities are focused on the right initiatives to help the system
deliver the right care, at the right time, in the right setting

© Copyright 2016, Cardinal Health, Inc. or one of its subsidiaries. All rights reserved.7
Two financial reporting segments
Pharmaceutical segment Medical segment
One enterprise market strategy

© Copyright 2016, Cardinal Health, Inc. or one of its subsidiaries. All rights reserved.
Serving the full continuum of care
Hospitals
Retail
pharmacies
Surgery
centers
Home
health
Physician
offices
Laboratories
Imaging
centers
Clinics
8

© Copyright 2016, Cardinal Health, Inc. or one of its subsidiaries. All rights reserved.9
Pharmaceutical Segment long-term sustainable growth driversFY15 revenues of $91B, segment profit of $2.1B
Enable our customers’ growth
World-class generics offering
Drive growth in Specialty Solutions
1Excludes non-Source sales
Deliver on organic initiatives and recent
acquisitions
China
FY11 FY16(E)
$8B
$1B Revenue

© Copyright 2016, Cardinal Health, Inc. or one of its subsidiaries. All rights reserved.10
Expand on integrated services
Medical Segment long-term sustainable growth driversFY15 revenues of $11B, segment profit of $433M
Deep customer knowledge
Grow Cardinal Health Brand
Maximize the post-acute setting
72%Growth in segment profit
contribution FY12 to FY15
1.8 million patients served in the home
We provide resources to
>75%of U.S. Hospitals
88%Growth in segment profit
contribution FY12 to FY15

© Copyright 2016, Cardinal Health, Inc. or one of its subsidiaries. All rights reserved.11
FY10 FY11 FY12 FY13 FY14 FY15 FY16Guidance
Strong and consistent earnings growth
Non-GAAP EPS
See appendix for GAAP/non-GAAP definitions and reconciling information.16-year CAGR is based off of non-GAAP EPS from FY10 to the midpoint of the FY16 guidance range provided on Nov. 2, 2015.
$5.15 – $5.35
Generics
Specialty
CAH Brand Products
Cost Efficiency
$2.80
$2.24
$3.21
$3.73$3.84
$4.38
Customer Focus
Post-Acute
China
At Home
PPI
© Copyright 2016, Cardinal Health, Inc. or one of its subsidiaries. All rights reserved.12
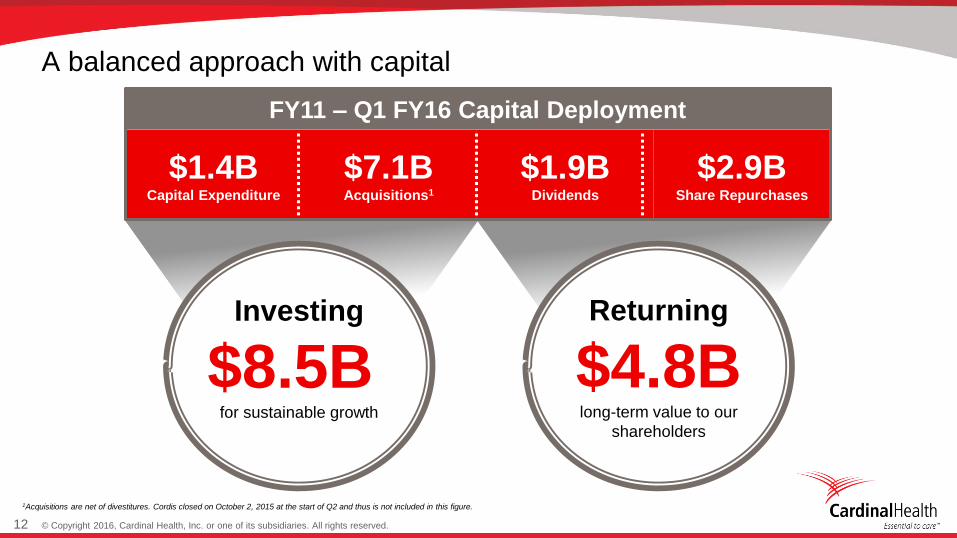
A balanced approach with capital
1Acquisitions are net of divestitures. Cordis closed on October 2, 2015 at the start of Q2 and thus is not included in this figure.
FY11 – Q1 FY16 Capital Deployment
$1.4BCapital Expenditure
$7.1BAcquisitions1
$1.9BDividends
$2.9BShare Repurchases
Returning
$4.8B long-term value to our
shareholders
Investing
$8.5B for sustainable growth
© Copyright 2016, Cardinal Health, Inc. or one of its subsidiaries. All rights reserved.13
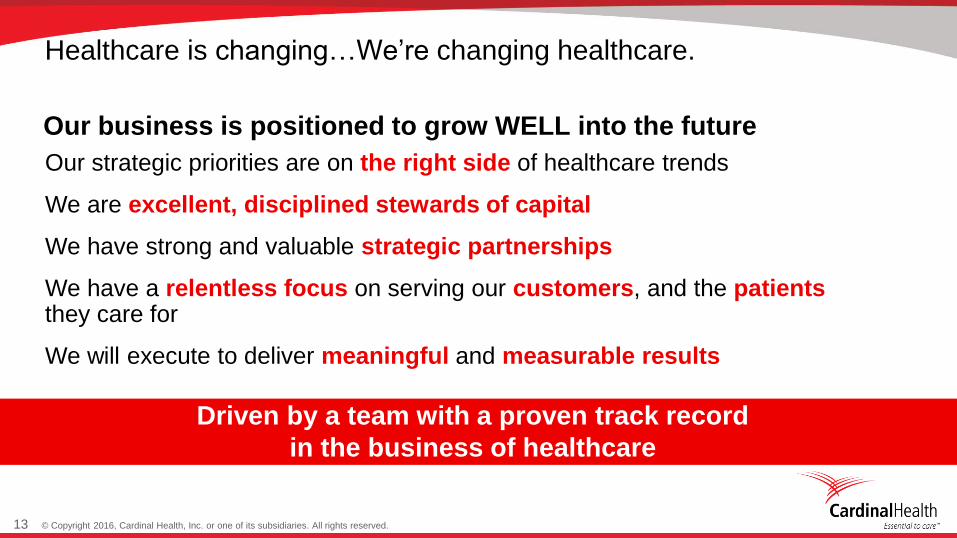
Our business is positioned to grow WELL into the future
Our strategic priorities are on the right side of healthcare trends
We are excellent, disciplined stewards of capital
We have strong and valuable strategic partnerships
We have a relentless focus on serving our customers, and the patientsthey care for
We will execute to deliver meaningful and measurable results
Driven by a team with a proven track record
in the business of healthcare
Healthcare is changing…We’re changing healthcare.
Operating Earnings Before Provision Earnings Earnings from Diluted EPS Diluted EPS
Earnings Income Taxes for from Continuing from from Continuing
Operating Growth and Discontinued Income Continuing Operations Continuing Operations
(in millions, except per common share amounts) Earnings Rate Operations Taxes Operations Growth Rate Operations Growth Rate1
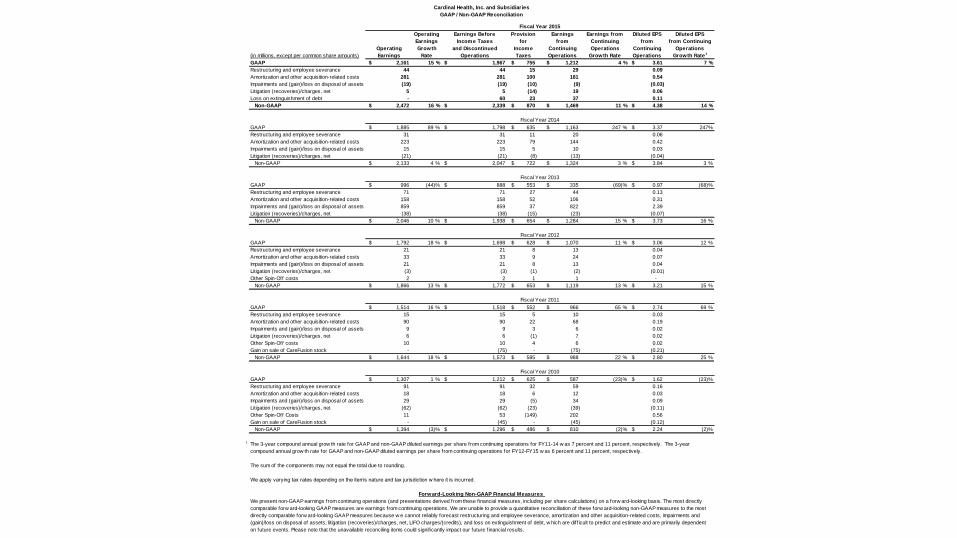
GAAP 2,161$ 15 % 1,967$ 755$ 1,212$ 4 % 3.61$ 7 %
Restructuring and employee severance 44 44 15 29 0.09
Amortization and other acquisition-related costs 281 281 100 181 0.54
Impairments and (gain)/loss on disposal of assets (19) (19) (10) (9) (0.03)
Litigation (recoveries)/charges, net 5 5 (14) 19 0.06
Loss on extinguishment of debt - 60 23 37 0.11
Non-GAAP 2,472$ 16 % 2,339$ 870$ 1,469$ 11 % 4.38$ 14 %
GAAP 1,885$ 89 % 1,798$ 635$ 1,163$ 247 % 3.37$ 247%
Restructuring and employee severance 31 31 11 20 0.06
Amortization and other acquisition-related costs 223 223 79 144 0.42
Impairments and (gain)/loss on disposal of assets 15 15 5 10 0.03
Litigation (recoveries)/charges, net (21) (21) (8) (13) (0.04)
Non-GAAP 2,133$ 4 % 2,047$ 722$ 1,324$ 3 % 3.84$ 3 %
GAAP 996$ (44)% 888$ 553$ 335$ (69)% 0.97$ (68)%
Restructuring and employee severance 71 71 27 44 0.13
Amortization and other acquisition-related costs 158 158 52 106 0.31
Impairments and (gain)/loss on disposal of assets 859 859 37 822 2.39
Litigation (recoveries)/charges, net (38) (38) (15) (23) (0.07)
Non-GAAP 2,046$ 10 % 1,938$ 654$ 1,284$ 15 % 3.73$ 16 %
GAAP 1,792$ 18 % 1,698$ 628$ 1,070$ 11 % 3.06$ 12 %
Restructuring and employee severance 21 21 8 13 0.04
Amortization and other acquisition-related costs 33 33 9 24 0.07
Impairments and (gain)/loss on disposal of assets 21 21 8 13 0.04
Litigation (recoveries)/charges, net (3) (3) (1) (2) (0.01)
Other Spin-Off costs 2 2 1 1 -
Non-GAAP 1,866$ 13 % 1,772$ 653$ 1,119$ 13 % 3.21$ 15 %
GAAP 1,514$ 16 % 1,518$ 552$ 966$ 65 % 2.74$ 69 %
Restructuring and employee severance 15 15 5 10 0.03
Amortization and other acquisition-related costs 90 90 22 68 0.19
Impairments and (gain)/loss on disposal of assets 9 9 3 6 0.02
Litigation (recoveries)/charges, net 6 6 (1) 7 0.02
Other Spin-Off costs 10 10 4 6 0.02
Gain on sale of CareFusion stock - (75) - (75) (0.21)
Non-GAAP 1,644$ 18 % 1,573$ 585$ 988$ 22 % 2.80$ 25 %
GAAP 1,307$ 1 % 1,212$ 625$ 587$ (23)% 1.62$ (23)%
Restructuring and employee severance 91 91 32 59 0.16
Amortization and other acquisition-related costs 18 18 6 12 0.03
Impairments and (gain)/loss on disposal of assets 29 29 (5) 34 0.09
Litigation (recoveries)/charges, net (62) (62) (23) (39) (0.11)
Other Spin-Off Costs 11 53 (149) 202 0.56
Gain on sale of CareFusion stock - (45) - (45) (0.12)
Non-GAAP 1,394$ (3)% 1,296$ 486$ 810$ (2)% 2.24$ (2)%
1
We present non-GAAP earnings from continuing operations (and presentations derived from these f inancial measures, including per share calculations) on a forw ard-looking basis. The most directly
comparable forw ard-looking GAAP measures are earnings from continuing operations. We are unable to provide a quantitative reconciliation of these forw ard-looking non-GAAP measures to the most
directly comparable forw ard-looking GAAP measures because w e cannot reliably forecast restructuring and employee severance, amortization and other acquisition-related costs, impairments and
(gain)/loss on disposal of assets, litigation (recoveries)/charges, net, LIFO charges/(credits), and loss on extinguishment of debt, w hich are diff icult to predict and estimate and are primarily dependent
on future events. Please note that the unavailable reconciling items could signif icantly impact our future f inancial results.
Forward-Looking Non-GAAP Financial Measures
The sum of the components may not equal the total due to rounding.
We apply varying tax rates depending on the item’s nature and tax jurisdiction w here it is incurred.
Fiscal Year 2011
Fiscal Year 2010
The 3-year compound annual grow th rate for GAAP and non-GAAP diluted earnings per share from continuing operations for FY11-14 w as 7 percent and 11 percent, respectively. The 3-year
compound annual grow th rate for GAAP and non-GAAP diluted earnings per share from continuing operations for FY12-FY15 w as 6 percent and 11 percent, respectively.
Fiscal Year 2012
Cardinal Health, Inc. and Subsidiaries
GAAP / Non-GAAP Reconciliation
Fiscal Year 2015
Fiscal Year 2014
Fiscal Year 2013

1
2
3
4
5
6
7
8
Cardinal Health, Inc. and Subsidiaries
Use of Non-GAAP Measures
Definitions
Charges related to the make-w hole premium on the redemption of notes.
Cost incurred in connection w ith our spin-off of CareFusion w hich are included in distribution, selling, general, and administrative expenses.
Programs by w hich the Company fundamentally changes its operations such as closing and consolidating facilities, moving manufacturing of a product to another location, production or business process sourcing, employee severance
(including rationalizing headcount or other signif icant changes in personnel) and realigning operations (including realignment of the management structure of a business unit in response to changing market conditions).
Costs that consist primarily of amortization of acquisition-related intangible assets, transaction costs, integration costs and changes in the fair value of contingent consideration obligations.
Asset impairments and (gains)/losses from the disposal of assets not eligible to be classif ied as discontinued operations are classif ied w ithin impairments and (gain)/loss on disposal of assets w ithin the consolidated statements of earnings.
Loss contingencies related to litigation and regulatory matters and income from favorable resolution of legal matters.
The inventories of the Company's core pharmaceutical distribution facilities in the Pharmaceutical segment are valued at the low er of cost, using the LIFO method, or market. These charges or credits are included in cost of products sold, and
represent changes in the Company's LIFO inventory reserve.
Except for compound annual grow th rates (CAGR), grow th rates in this presentation are determined by dividing the difference betw een current period results and prior period results by prior period results. CAGR is determined by subtracting
one from ((the ending value divided by the beginning value) raised to the pow er of (one divided by the number of years)).
Non-GAAP Diluted EPS from Continuing Operations and growth rate calculation 1: non-GAAP earnings from continuing operations divided by diluted w eighted-average shares outstanding.
Non-GAAP Earnings from Continuing Operations : earnings from continuing operations excluding (1) restructuring and employee severance2, (2) amortization and other acquisition-related costs3, (3) impairments and (gain)/loss on
disposal of assets4, (4) litigation (recoveries)/charges, net5, (5) LIFO charges/(credits)6, (6) loss on extinguishment of debt7, (7) other spin-off costs8, and (8) gain on sale of CareFusion stock, each net of tax.
Segment Profit: segment revenue minus (segment costs of products sold and segment distribution, selling, general, and administrative expenses).
This presentation contains f inancial measures that are not calculated in accordance w ith U.S. generally accepted accounting principles (“GAAP”). In general, the measures exclude items and charges that (i) management does not believe
reflect Cardinal Health, Inc.'s (the "Company") core business and relate more to strategic, multi-year corporate activities; or (ii) relate to activities or actions that may have occurred over multiple or in prior periods w ithout predictable trends.
Management uses these non-GAAP financial measures internally to evaluate the Company’s performance, evaluate the balance sheet, engage in f inancial and operational planning and determine incentive compensation.
Management provides these non-GAAP financial measures to investors as supplemental metrics to assist readers in assessing the effects of items and events on its f inancial and operating results and in comparing the Company’s
performance to that of its competitors. How ever, the non-GAAP financial measures used by the Company may be calculated differently from, and therefore may not be comparable to, similarly titled measures used by other companies.
The non-GAAP financial measures disclosed by the Company should not be considered a substitute for, or superior to, f inancial measures calculated in accordance w ith GAAP, and the f inancial results calculated in accordance w ith GAAP
and reconciliations to those f inancial statements set forth above should be carefully evaluated.