journal of water resources planning and...
TRANSCRIPT

Journal of Water Resources Planning and Management, ASCE. Accepted Nov. 2012. Ref.: WRENG-927R3
1
Integrated Water Management for Environmental Flows in the Rio Grande
S. Sandoval-Solis1 A.M.ASCE and D. C. McKinney2, M.ASCE
Abstract:
In the Rio Grande transboundary basin, environmental flows have not been considered as an
integral part of the water management. This research focuses in the Big Bend, a reach located
along the Rio Grande mainstem. Important natural regions of the Chihuahuan Desert are
threatened due to the lack of environmental flows. In this paper is estimated the maximum
volume of water available for environmental flows without affecting human and international
water requirements, and without increasing the flood risk in Presidio-Ojinaga. Environmental
flows are proposed based on an analysis of the prior reservoir alteration hydrology of the river. A
planning model was built to simulate the water allocation system and evaluate alternative
policies. A reservoir re-operation policy for Luis L. Leon reservoir is proposed to supply
environmental flows without violating the system constraints. The policy that supplies the
maximum water to the environment is two thirds (66%) of the prior reservoir alteration
conditions; it also improves human water supply, treaty obligations and decreases flood risk.
Keywords: Environmental Flows, Reservoir Re-Operation, Integrated Water Management,
Adaptive Management, Rio Grande
1 Department of Land, Air and Water Resources, University of California, Davis, Davis, CA 95616; PH (512) 461-8895; email: [email protected] 2 Center for Research in Water Resources, University of Texas at Austin, Austin, TX 78712; PH (512) 471-5644; FAX (512) 471-0072; email: [email protected]

Journal of Water Resources Planning and Management, ASCE. Accepted Nov. 2012. Ref.: WRENG-927R3
2
Introduction
Water management that attempts to balance competing uses is a common factor in many
modern water resource systems. Sustainable water systems are those designed to meet present
and future water demands, while maintaining a range of hydrologic variation necessary to
preserve the ecological and environmental integrity of the basin (Loucks 1997). The previous
definition contains several uncertainties. What is the current and future water availability? This
estimation is undetermined given the alteration of nature by humans, land use change,
greenhouse gas emissions and climate change. What are society’s water needs now and in the
future? It is challenging to define current water needs and anticipate the values that future
generations will impose on water and natural resources. What is the environmental integrity of
the basin? It is difficult to determine the future water requirements and land use practices to
preserve the environment. This paper presents an integrated water management approach to meet
current and future water needs, while rehabilitating some elements of the native ecosystem,
considering the historic hydrology of a specific basin: the Rio Grande.
Achieving sustainability in transboundary basins is challenging due to the existence of
international agreements. This is the case of the Rio Grande/Bravo Basin (RGB Basin), a
transboundary basin shared by the United States (U.S.) and Mexico (Figure 1.a). Environmental
flows have not been considered as part of the water management in the RGB basin. This paper
focuses on the Big Bend reach (BB reach), a region situated along the Rio Conchos mainstem
from Luis L. Leon reservoir to its confluence with the RGB and along the RGB mainstem from
the cities of Presidio-Ojinaga to Amistad reservoir (Figure 1.b). Important pristine areas such as
the Big Bend National and State Park in the U.S., the Maderas del Carmen, Cañon de Santa
Elena and Ocampo Natural Reserve Areas in Mexico are threatened due to the lack of water

Journal of Water Resources Planning and Management, ASCE. Accepted Nov. 2012. Ref.: WRENG-927R3
3
management for environmental purposes. In 2010, a joint statement by the presidents Barak
Obama (U.S.) and Felipe Calderon Hinojosa (Mexico) recognized the fragility and uniqueness of
this region, they instruct their staff to initiate a process to recognize and designate Big Bend as a
natural area of binational interest (Obama and Calderon 2010).
Since 2008, an independent group of scientists and individuals, from both countries, has
explored several strategies to improve the environmental conditions in the BB reach, including
the feasibility of providing environmental flows (e-flows) because of its unique characteristics:
(a) there is water flowing in the reach but the flow regime is not optimal for environmental
purposes, (b) infrastructure already exists to deliver e-flows from Luis L. Leon (LLL) reservoir on
the Rio Conchos in Mexico, and (c) water for e-flows is not a consumptive use (except for the
conveyance losses), water releases from LLL reservoir are captured below BB reach in Amistad
reservoir. The main problems associated with an environmental policy are: (a) about 80% of the
water in this region comes from Mexico namely the Rio Conchos, equity issues arise because in
order to provide environmental benefits to both countries most of the water comes from Mexico,
(b) there is a high flood risk at Presidio-Ojinaga valley (P-O Valley), any environmental policy
must consider the flood risk in this area and (c) any e-flows policy must follow the water
division between the U.S. and Mexico stated in the Treaty of 1944 (IBWC 1944).
How much water does the environment need? How much water is available for
environmental purposes? Where could this water come from? This research proposes a set of e-
flows based on a streamflow analysis of the basin. Then, a water management policy is proposed
to supply e-flows that considers all the water sources, system constraints, and local and
international water allocation rules. The objective of this research is to estimate the maximum
volume of water available for e-flows in the BB reach, the maximum physically feasible

Journal of Water Resources Planning and Management, ASCE. Accepted Nov. 2012. Ref.: WRENG-927R3
4
solution. These values will be useful during negotiations for determining strategies to include the
environment as an integral part of the water management of the basin. The authors prove that it is
possible to manage the system to provide e-flows without increasing flood risk in the P-O valley,
and without affecting human water supply and the international treaty obligations.
Literature Review
Before the 1990’s, water management for environmental purposes was limited to water
quality standards and minimum flow requirements. In the last two decades, this has changed
towards managing rivers to achieve a more natural flow regime, capturing the seasonal and inter-
annual flow variability, as well as the magnitude, timing and frequency of different flow
conditions (Postel and Richter 2003). Methodologies to determine e-flows can be divided into
four types: (1) statistical methods, such as the Tenant or Indicators of Hydrologic Alteration
(IHA) methods, these methods analyze the historical hydrology to identify natural flow
conditions and prescribe flow recommendations (Tennant 1975, Richter et al. 1996), (2) hydro-
geomorphic methods, such as the Near-Census River Assessment and Rehabilitation method,
which relates the hydrodynamics of the river with its morphology to design adequate habitat for
the environment (Pasternack 2011), (3) instream habitat methods, such as the Instream Flow
Incremental method, which relates different flows with habitat changes using predetermined
preferences for specific fish species (Bovee 1978) and (4) holistic methods, such as the Building
Block method (Tharme and King 1998) or the Benchmark Method (Brizga et al. 2002), these
methods use multidisciplinary experts to define a flow regime intended to achieve a particular
objective or to determine acceptable degrees of departure from the natural flow regime.
The IHA method is used in this research to propose e-flows because data is available for a
period with more desired hydrologic characteristics (IBWC 2011) and it is recommended for

Journal of Water Resources Planning and Management, ASCE. Accepted Nov. 2012. Ref.: WRENG-927R3
5
planning level analyses (Tharme 2003). In the BB reach, several studies have analyzed the
environmental conditions. Moring (2002) analyzed the stream habitat, fish community and
macroinvertebrates. Schmidt et al. (2003), Dean and Schmidt (2011) and Dean et al. (2011)
analyzed the 20th century hydrology, the relation between flows, floods, sediment transport,
vegetation, and how these factors affected the evolution of the channel and flood plain.
Sandoval-Solis et al. (2010) estimated the hydrology prior to and after reservoir alteration.
Everitt (1998) described the spread of the invasive species of salt cedar (Tamarix spp.). The
WWF (2008) summarized the previous studies in a vision and fact sheet, these studies coincide
with the e-flows proposed here.
Models are built to evaluate water management policies, they are a representation of
water resource systems. Models for the RGB Basin include: planning models to address drought
strategies (Vigerstol 2002), conflict resolution (Tate 2002), water availability (RJBC 2004), and
water management scenarios (Sandoval-Solis 2011). Dean and Schmidt (2010) built a one
dimension streamflow discharge model to evaluate the effects of increased vegetation roughness
on declining channel capacity in the BB reach. While in some of these models environmental
water management is contemplated for other regions of the RGB Basin (Sandoval-Solis 2011),
none of them considered the BB reach. The model built in this research is based on the RGB
Basin model (Sandoval-Solis 2011) with two main differences: it is a tailor made model for the
necessities of the BB reach and is the most updated model. It is the only model that includes the
last extended fourteen-year drought period (1994-2007).
This research proposes a reoperation policy for LLL reservoir to provide more desired
flows in the RGB Basin mainstem, while meeting human and treaty water requirements, and
without increasing the flood risk at P-O Valley. Reservoir reoperation policies have been

Journal of Water Resources Planning and Management, ASCE. Accepted Nov. 2012. Ref.: WRENG-927R3
6
proposed to improve the environment in large (Yang et al. 2007) and small basins (Thompson et
al. 2011), transboundary basins (WB 2004), in multi-purpose systems (Bednarek and Hart 2005),
considering renewable water sources (Yang et al. 2008), climate change (Thompson et al. 2011),
temperature of released water (Olden and Naiman 2010) and to improve the dissolved oxygen in
the system (Bednarek and Hart 2005). The main difference with these approaches is the
development of an iterative process, e-flows and reservoir reoperation policies are modified
interactively to determine the maximum volume of water available for the environment. The
method proposed here estimates the physically and legally available volume of water available
for the environment given the system constraints.
Rio Grande Basin (RGB Basin)
The RGB is a transboundary basin shared by the U.S. and Mexico (Figure 1.a); it has a
drainage basin of 557,722 km2 with an estimated population in 2010 of 10.5 million people
(Patiño-Gomez et al. 2007). Important pristine areas in both countries depend on the water in the
river for their environmental requirements. The Treaty of 1944 established the water allocation in
this region; unfortunately, the environment was not considered in this agreement. As a result, the
environment has deteriorated, signs of this deterioration are: the progressive channel narrowing
(Dean and Schmidt 2010), flow alteration due to reservoir operation (Sandoval-Solis et al. 2010,
Dean and Schmidt 2011 and Dean et al. 2011), the invasion of non-native species, e.g. salt cedar
(Tamarisk spp.) and giant cane (Arundo donax) (Everitt 1998), change from freshwater to
estuarine ecosystem (Schmandt 2002) and the almost complete extinction of endemic riverine
species, e.g. Rio Grande silvery minnow (Hybognathus amarus) (Bestgen and Platania 1991).
In November 2008, a group of scientists, NGOs and governmental institutions gathered in
a workshop to discuss the environmental problems in the BB reach, their possible solutions, gaps

Journal of Water Resources Planning and Management, ASCE. Accepted Nov. 2012. Ref.: WRENG-927R3
7
in knowledge and the required research to address them. There were two main outcomes of this
workshop: (1) a declaration of a vision for the BB reach (WWF 2008), which states the required
characteristics of the river to preserve, enhance and restore the riverine ecosystem for the benefit
of humans and nature and (2) an independent scientific committee was created to address gaps in
knowledge and design integral solutions based on science and understanding. This paper is part
of the discussions and efforts to address integral and scientific solutions for improving the
environment in the BB region.
Analysis of River Flow Conditions
The vision for the BB reach (WWF 2008) outlines its importance, dependence and
connection with water sources in Mexico, and the qualitative characteristics to support a healthy
riverine ecosystem. Some of the desired characteristics are: “A wandering, laterally unstable
river channel; a river cross-section form that is relatively wide and shallow; a river with flows
that maintain channel capacity” (WWF 2008). Dean and Schmidt (2011) identified these
characteristics during their research regarding narrowing of the channel over the last century and
the processes responsible for it. They found that prior to 1946 the channel at the BB reach was in
dynamic disequilibrium, wherein the channel was widened during large flood events and
subsequently narrowed during the intervening periods at a slower rate than today. Large flood
events moved sediments and prevented any substantial accumulation. Since early 1900’s small
reservoirs were constructed in the RGB Basin. In 1916 the completion of two large reservoirs
altered the hydrology of the basin: La Boquilla in the Rio Conchos (in Chihuahua, Mexico) and
Elephant Butte in the upper RGB (in New Mexico). Large mean annual flows happened prior
1920 with a steady decline since 1936 to 1946 (Dean and Schmidt 2011). In the 1940’s, the
construction of Caballo reservoir in the RGB (1938) (in New Mexico) and Francisco I. Madero

Journal of Water Resources Planning and Management, ASCE. Accepted Nov. 2012. Ref.: WRENG-927R3
8
reservoir in the San Pedro river (1949) (in Chihuahua, Mexico) modified the flow conditions in
the BB reach, storing the remaining flood water left in the upper RGB and Rio Conchos sub-
basin (Sandoval-Solis 2011). As a result, flow conditions changed after 1946, this was evident in
the higher rate of channel narrowing; nowadays, the RGB is a narrower river in the BB reach
(Dean and Schmidt 2011). This research considers pre-1946 conditions (large floods and lower
channel narrowing rate) as a benchmark of a healthier environment compared to recent
hydrologic conditions (less frequent large floods and higher channel narrowing rates).
Benchmarks
Flow conditions were estimated through a probabilistic streamflow analysis at Johnson
Ranch gage station using the IHA method (Sandoval-Solis et al. 2010). Mean daily discharge
data was obtained from the International Boundary and Water Commission (IBWC 2011).
Johnson Ranch streamflow records were extended until 1901 using a linear regression from data
of RGB below Rio Conchos gage station. Natural cycles of dry (1945-1985, 1993-2007) and wet
(1936-1944, 1986-1992) periods have been documented for the BB reach (Dean and Schmidt
2011). Two periods were analyzed: the prior to reservoir alteration period, Pre-1946, a 30 year
period (Jan. 1901 to Dec. 1913 and Jan. 1930 to Dec. 1946) and the post reservoir alteration
period, Post-1946, with data for 30 years (Jan. 1980 to Dec. 2009). For the post-1946 period, the
last thirty-year period (1980-2009) is selected to analyze the characteristics of the most recent
hydrology; it contains a whole hydrologic cycle: the wet period of the 1980’s (1984-1993), and
the severe and extended drought of the 1990’s (1994-2007).
Three flow categories are used as benchmarks to determine the flow characteristics in this
reach (Postel and Ritcher 2003): (i) Base Flows: median value of the mean daily flows for each
month, aimed to provide adequate habitat, maintain suitable water temperatures and dissolve

Journal of Water Resources Planning and Management, ASCE. Accepted Nov. 2012. Ref.: WRENG-927R3
9
oxygen; (ii) High Flows: streamflows with a peak between the 75th (56 m3/s) and 95th (224 m3/s)
percentile of the mean daily flows for the pre-1946 period, aimed to prevent riparian vegetation
from encroaching into the channel and restore water quality conditions; and (iii) Floods:
streamflows with a peak above the 95th percentile (224 m3/s) of the pre-1946 period. This last
benchmark is subdivided into two types: (a) Small floods between the 95th percentile (224 m3/s)
and below 1,100 m3/s, which is a threshold to account for the flood capacity of levees at P-O
valley whose maximum flow capacity is 1,190 m3/s (IBWC 1971) and (b) Large floods, with a
peak above 1,100 m3/s, these large floods may threaten the safety of the levees and are aimed to
shape the physical character of river channel and provide longitudinal connectivity of the river.
Thresholds have been determined using the pre-1946 period to estimate the flow characteristics
of a period with more frequent large floods and slow channel narrowing rates, and compare them
with the post alteration period (post-1946). Other hydrologic analyses in the BB reach (Dean and
Schmidt 2011, Dean et al. 2011) used mean annual flow, average flood and duration as
benchmarks for flow conditions for pre-1944 (1936-1944) and post-1944 periods (1945-1985,
1986-1992, 1993-2008).
Prior reservoir alteration conditions
Figure 2 shows the median annual hydrograph for the pre-1946 period, its volume is
1,488 million m3 [Base flows: 1128, High flows: 48, Small floods: 312; units: million m3], base
flows, high flows and small floods were derived from median daily values. Base flows varied
from 11 m3/s in April to 98 m3/s in September. High flows occurred every year (T=1) in July,
August, October and December; and every two to three years (2<T<3) in May, June and
November. Two small floods occurred every year, one in September (peak flow = 407 m3/s) and
another that usually happened in either, July (peak flow = 405 m3/s), August (peak flow = 396

Journal of Water Resources Planning and Management, ASCE. Accepted Nov. 2012. Ref.: WRENG-927R3
10
m3/s) or October (peak flow = 422 m3/s). Figure 2 shows the case of the small flood in July. The
combination of two small floods may have contributed to maintaining the RGB as a wide sandy
multi-threaded river (Dean and Schmidt 2011, Dean et al. 2011). Sandoval-Solis et al. (2010)
explain the methods of calculation and flow conditions for these and other return periods. The
pre-1946 hydrograph (Figure 2) is used as a template for all the hydrographs evaluated here, the
peak and duration of small floods and high flows are preserved, the base flow is the benchmark
scaled to increase or decrease the environmental hydrograph.
Recent flow conditions
Figure 3 shows the median annual hydrograph for the post-1946 period, its volume is 571
million m3 [Base flows: 450, High flows: 52, Small floods: 69; units: million m3]. Base flows
vary from 8 m3/s in April to 24 m3/s in September, these values represent half of their respective
pre-1946 value for most of the months. High flows occurred every year (T=1) in May, June, July
and August; and every two to three years (2<T<3) in March, April and October. Post-1946’s
high flows occurred earlier in time (May-August), smaller in magnitude and more frequently
than pre-1946 conditions; this pattern can be attributed to releases from LLL reservoir to be
prepared for the monsoon season (June-October). Only one small flood occurred every two to
three years in September (peak flow = 342 m3/s), which is less frequent and smaller than the pre-
1946 flows. The reduction in frequency and magnitude of small floods may have contributed to
the progressive channel narrowing of the BB reach.
Water Management in the Big Bend
All the water that reaches the RGB from tributaries and the gains along the mainstem are
allocated to each country according to the 1944 Treaty (IBWC 1944). Each country distributes
their treaty allotment and the water in their tributaries according to the regulations of each

Journal of Water Resources Planning and Management, ASCE. Accepted Nov. 2012. Ref.: WRENG-927R3
11
country. In Texas, water is allocated according to the prior appropriation law (TCEQ 2006), and
in Mexico water is allocated according to its water use (CONAGUA 2008a).
Treaty of 1944
The 1944 Treaty specifies the water allocation for the RGB Basin. In the BB reach, the
U.S. receives an allocation of: (1) all the waters reaching the RGB from Pecos and Devil Rivers;
Alamito and Terlingua Creeks, and Goodenough spring, (2) one third of the flow reaching the
RGB from Rio Conchos, (3) one half of the gains along the RGB mainstem and (4) one half of
the water at Fort Quitman from the RGB. In the BB reach, Mexico has the allocation of: (1) two
thirds of the flow reaching the RGB from Rio Conchos, (2) one half of the gains along the RGB
mainstem and (3) one half of the water at Fort Quitman from the RGB (IBWC 1944). Amistad
international reservoir was built to store and manage the water for both countries in the upper
RBG Basin, each country has its own storage account. The IBWC is the institution in charge of
the execution and compliance of the 1944 Treaty.
United States Water Management
In Texas, the BB reach is denominated as the upper Rio Grande Basin (from Fort
Quitman to Amistad), water is allocated using the prior appropriation rule: “first in time, first in
right”; senior water rights are honored before junior water rights. During drought periods, the
Texas Rio Grande Watermaster program administered by the Texas Commission on
Environmental Quality (TCEQ) may impose reductions in water diversions, allocating water first
to municipal and domestic use (TCEQ 2006).
Mexican Water Management
In Mexico, the National Water Commission (Comisión Nacional del Agua, CONAGUA)
is the federal authority responsible for water management. CONAGUA executes the water

Journal of Water Resources Planning and Management, ASCE. Accepted Nov. 2012. Ref.: WRENG-927R3
12
management in the tributaries and along the RGB mainstem in Mexico. Water demands are
characterized by use; the National Water Law establishes the priority for all water uses
(CONAGUA 2008a). Domestic and municipal users have the highest priority and two times their
annual water demand must be stored in the reservoirs. Agricultural users are not guaranteed and
their allocation depends on the available storage in the respective dam that supplies them. Each
October, CONAGUA determines the available reservoir storage after deducting municipal
allocations, evaporation and operation losses. Then, a negotiation between CONAGUA and the
irrigation districts sets the agricultural water allocation for the coming water year. On the BB
reach, LLL is managed for two purposes: water supply using the rule described above and for
flood control operated at the discretion of CONAGUA. Water released for flood control is
important because it reaches the confluence of the RGB and is accounted for treaty obligations.
Water Planning Model for the Big Bend Reach
The allocation of water in the Big Bend Reach is simulated using the Water Evaluation
and Planning System (WEAP) platform (Yates et al. 2005). The water distribution algorithm
mimics the allocation of water in the U.S., Mexico and the division of water established in the
Treaty of 1944. The hydrologic record considered for this reach is 55 years (Oct. 1955-Sep.
2009). The Big Bend model is a water planning model that calculates the balance between
inflows, change of storage in reservoirs, water demands and outflows. CONAGUA, TCEQ and
IBWC provided data for inflows, streamflow data, capacities, storage-elevation curves and
evaporation losses in reservoirs (Patiño-Gomez et al. 2007, CONAGUA 2008b, IBWC 2011).
Table 1 shows the water demands considered in the model. The performance of the model was
evaluated using a 40-year period of analysis (Oct. 1969-Sep. 2009) because during this period,
Amistad and Luis L. Leon reservoirs were in operation and there are accurate records of water

Journal of Water Resources Planning and Management, ASCE. Accepted Nov. 2012. Ref.: WRENG-927R3
13
diversions and reservoirs storage (CONAGUA 2008b). The index of agreement (IA) and
coefficient of efficiency (CE) were estimated (Legates and McCabe 1999) for the two reservoirs:
LLL (IA=0.998, CE=0.992) and Amistad (IA=0.993, CE=0.970). These indices were estimated
in two gage stations: Rio Conchos at Ojinaga (IA=0.994, CE=0.976) and RGB at Johnson Ranch
(IA=0.9998, CE=0.991), which is the location where the e-flows were determined. These indices
show that the model performs very well (Moriasi et al. 2007) compared to the historic records, in
all cases the values are larger than 0.95. The simulation process considers the repetition of the
55-year hydrologic record using the recent infrastructure. Monthly use coefficients are used to
account for the seasonal variability for each demand (RJBC 2004).
Environmental Water Management
Water in the BB region is subject to competing water uses. Water is managed for human
consumption, irrigation, meeting international agreements, water demands of downstream users
(in Texas, Coahuila and Tamaulipas) and flood protection. However, the arrangement and size of
the infrastructure provides an opportunity to release water from LLL reservoir in an
environmental friendly pattern and capture it in Amistad reservoir without affecting the
objectives mentioned above; i.e. “changing the timing, preserving the long term volume”.
The objective of this research is to estimate the maximum volume of water available for
the environment. The authors hypothesized that it is possible to manage the system to provide
base and high flows, and small floods without affecting the uses named above. The desired water
management policy provides e-flows while meeting the following constraints: (1) human water
uses below LLL reservoir are unaffected, (2) releases for environmental purposes should not
exceed the levee capacity at P-O Valley [1,190 m3/s, (IBWC 1971)], (3) flood risk during the
monsoon season at P-O valley is not increased and (4) the allocation of water under the 1944

Journal of Water Resources Planning and Management, ASCE. Accepted Nov. 2012. Ref.: WRENG-927R3
14
Treaty is respected. The last constraint means the water that reaches the RGB from the Rio
Conchos is divided according to the treaty and it is on average the same volume that this river
has contributed historically to the treaty obligations[1954-2009, (IBWC 2011)] and that was
projected when the treaty was signed (Orive-Alba 1945), between 50% to 60% of the treaty
obligations.
If the authors’ hypothesis is true, this analysis can provide guidance during discussions
regarding water available for the environment, because it quantifies the maximum amount of
water that can be transferred from LLL to Amistad reservoir without affecting human water
supply, flood risk at P-O valley or the treaty obligations.
Reservoir Reoperation Policy
The operation policy proposed for LLL reservoir considers water supply for the
environment while meeting the constraints listed in the previous section. These are the
considerations for the proposed policy: (1) LLL provides part of the base flows and the entirety
of small floods to the BB reach, high flows are provided naturally from the rest of the water
sources, (2) releases for base flow from LLL takes into account the rest of the water sources
(RGB above Ojinaga, Alamito, Terlingua, and gains in Rio Conchos and RGB mainstem),
median monthly values for each water source have been estimated and subtracted from the
prescribed base flow, (3) releases at LLL are higher in magnitude and duration to meet the e-
flows at Johnson ranch, (4) human water demands are fixed for the simulation period and they
represent the current water rights (Table 1), this assumption recognizes that there is a small
municipal water demand (< 1% of the total water rights) and the agriculture water rights (~99%
of the total water rights) are not expected to increase in the future (personal communication, D.
Treviño, CONAGUA’s technical advisor, 2010) and (5) inflows to LLL are tracked during two
Journal of Water Resources Planning and Management, ASCE. Accepted Nov. 2012. Ref.: WRENG-927R3
15
seasons for operational decisions, wet (Jun. to Oct.) and dry (Nov. to May). Drought conditions
are considered to exist when inflows during the previous wet or dry season are smaller than 250
or 200 million m3, respectively; or when the storage in LLL is below the drought pool threshold.
A probabilistic analysis of LLL inflows (1949-2009) was carried out to define the
drought thresholds, they were determined by comparing the water demands below LLL and the
expected inflows considering a 70% exceedance probability. At the beginning of the dry season
(Nov. 1st), given that the inflows in the previous wet season are smaller than 250 million m3,
there is a 70% chance that the inflows in the following dry season will be at least 133 million m3.
Similarly, at the beginning of the wet season (Jun. 1st), given that the inflows in the previous dry
season are smaller than 200 million m3, there is a 70% chance that the inflows in the following
wet season will be at least 67 million m3. The sum of these inflows (200 million m3) is bigger
than the annual water demand for human use below LLL considering seepage and evaporation
losses, which is 196 million m3. The authors propose a risk of 30% (70% exceedance
probability) for the LLL reoperation policy; however, this value may change depending on
negotiations and authorities adversity to risk.
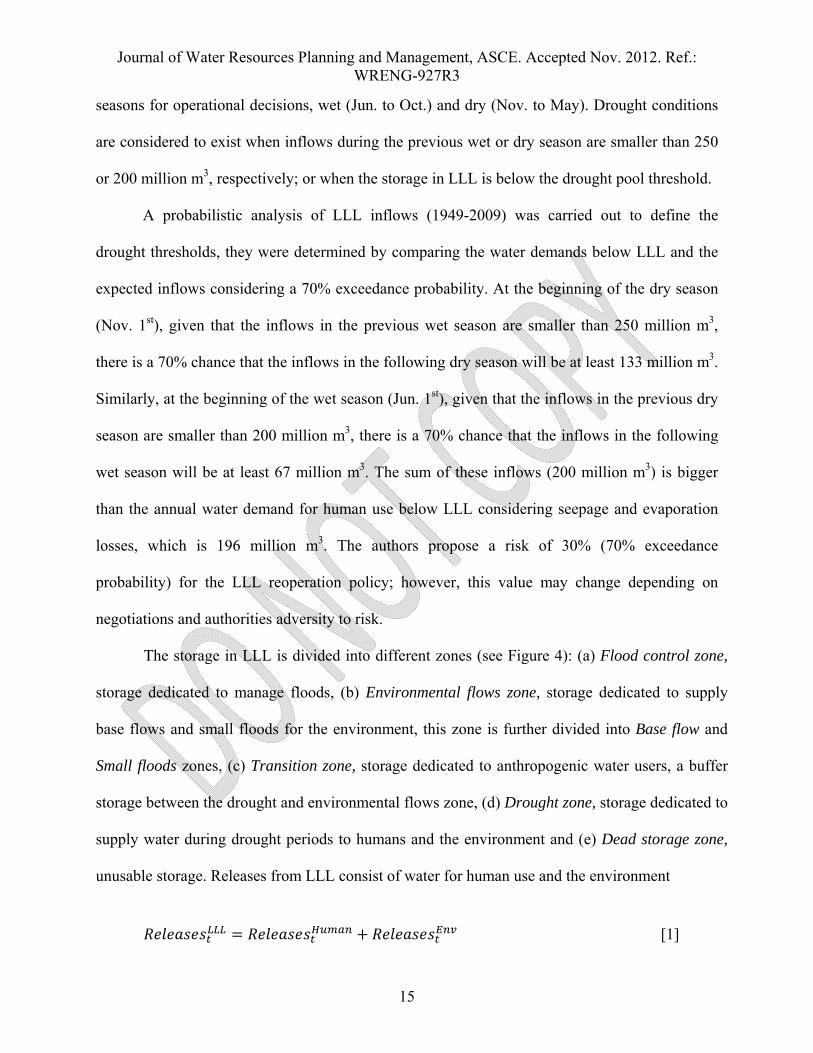
The storage in LLL is divided into different zones (see Figure 4): (a) Flood control zone,
storage dedicated to manage floods, (b) Environmental flows zone, storage dedicated to supply
base flows and small floods for the environment, this zone is further divided into Base flow and
Small floods zones, (c) Transition zone, storage dedicated to anthropogenic water users, a buffer
storage between the drought and environmental flows zone, (d) Drought zone, storage dedicated to
supply water during drought periods to humans and the environment and (e) Dead storage zone,
unusable storage. Releases from LLL consist of water for human use and the environment
[1]

Journal of Water Resources Planning and Management, ASCE. Accepted Nov. 2012. Ref.: WRENG-927R3
16
Releases for human use ( , 1, … , 12) are secured every month.
Releases for the environment consist of base flows ( , 1, … , 12) and small floods
( , 7, … ,10)
[2]
Two types of base flows are proposed: normal and drought. Normal base flows
( ) are released when LLL storage at the beginning of each month ( ) is above the
base flow storage threshold ( ). Drought flows ( ) are released when the
storage at the beginning of the month ( ) is below the drought storage threshold ( ) or
for the whole season when the inflows in the previous wet ( ) or dry ( ) seasons
are less than 250 or 200 million m3, respectively. No base flow is released when the storage at the
beginning of the month is in the transition zone ( ). Base flows
(Baset, t=1,…, 12) are released from LLL according to the rule:
0
250
200
1, … ,12 1, … ,12
11,12,1,2,… ,6 7, … ,10 1, … ,12
[3]
Small floods are released when the LLL storage at the beginning of the month ( ) is
above the small flood threshold ( ). No small floods are released if the storage at the
beginning of the month ( ) is below the small flood threshold ( ) or if the inflows in
the previous dry season ( ) are smaller than 200 million m3. Small floods ( ,
7, … ,10) are released from LLL during July to October according to the rule:

Journal of Water Resources Planning and Management, ASCE. Accepted Nov. 2012. Ref.: WRENG-927R3
17
0
0 200 [4]
Simulation Process
An iterative simulation process was used to determine the maximum volume of water
available for the environment. First, an environmental hydrograph is proposed, e.g. a hydrograph
of 900 million m3/year [Base flows: 524, High flows: 41, Small floods: 335; units: million m3].
Second, a set of storage thresholds ( , , , ) and a
drought base flow ( ) are proposed and entered in the model. Third, the model is run
and results are analyzed. If results meet the constraints specified for the system, as stated above,
the model is considered a feasible solution, otherwise the results are discarded. Several annual
environmental hydrographs (1300, 1250, …, 650, 600 million m3/year) were evaluated using the
template of the pre-1946 conditions. The peak and duration high flows are preserved in each
annual hydrograph as suggested by Postel and Richter (2003), the peak of small floods is reduced
to 375 m3/s according to the suggestion of Big Bend National Park hydrologist (personal
communication, J. Bennett, Hydrologist, Big Bend National Park, 2011). Base flow is the
benchmark used to increase or decrease the annual environmental hydrograph. The feasible
solution that supplied the largest flow through the Big Bend reach is the policy that provides the
maximum water for the environment.
Results
Maximum Hydrograph for the Environment
According to the analysis reported here, the maximum amount of water that can be
supplied to the BB Reach at Johnson Ranch without affecting other water users or treaty
obligations, or increasing the flood risk in Ojinaga/Presidio is 982 million m3/year [Base flow:

Journal of Water Resources Planning and Management, ASCE. Accepted Nov. 2012. Ref.: WRENG-927R3
18
624, High flows: 36, Small floods: 322; units: million m3] (see Figure 5 and Table 2). Base flows
vary from 9 m3/s in April to 56 m3/s in September following the same pattern as the pre-1946 base
flow conditions. High flows occurred every year (T<1.5) in July, August and October; and every
two years (T=2) in December. One small flood occurs every two years in either September or
October (peak flow=374 m3/s) and every three years in either, July or August (peak flow=355
m3/s). The drought base flows released are 44 million m3/year, these drought base flows have the
same distribution as the normal base flows. These results represent an improvement from post-
1946 conditions (Figure 3), base flows are larger and follow the same pattern as the pre-1946
conditions, high flows and small floods occur more frequently at the right time and water can be
released in drought periods. The volume of the hydrograph shown in Figure 5 is similar to the
historic average at Johnson Ranch, which is 1004 million m3/year (1955-2009), this means the
proposed policy preserves the long-term volume while adjusting the timing of the deliveries in an
environmental pattern. Table 2 shows the set of storage thresholds that combined with the
reservoir reoperation policy make possible the delivery of the hydrograph in Figure 5.
Water supply system performance for stakeholders is evaluated using the sustainability
index (SI) for water resources management. The SI is a summary index that integrates results of
several performance criteria using a geometric average, its scale varies from 0 to 1 with 1 being
the most desirable. The performance criteria selected to evaluate stakeholders are: reliability (time
and volume), vulnerability, resilience and maximum deficit. These criteria have been selected
because they represent the desired characteristics for the stakeholders’ water supply: a reliable
water supply in time and volume that recovers fast from deficits (high resilience), when deficit
happen the average and worst case deficit should be small (low vulnerability and maximum
deficit) (Sandoval-Solis et. al. 2011). The SI ( ) for the ith water user is:

Journal of Water Resources Planning and Management, ASCE. Accepted Nov. 2012. Ref.: WRENG-927R3
19
∗ ∗ ∗ 1 ∗ 1 . [5]
Table 1 shows the SI for all water users. Two scenarios are compared, the Historic scenario
(Historic) and the reservoir reoperation scenario (Reoperation). The results show that all the water
demands supplied from LLL reservoir (Ag. DR-090, Ag. Rio Conchos and Mun. Rio Conchos)
have a SI of 100%, meaning that their water demands are fully supplied during the whole period
[100% reliability (time and volume) and resilience; 0% vulnerability and maximum deficit]. Also,
US Municipal Rio Grande is fully supplied because it has the highest priority, the remaining water
users have a SI less than 100% but greater than 75%. These results contrast with the Historic
scenario SI values which are lower than 43%. In summary, the reservoir re-operation policy does
not affect the water supply of any stakeholder in the region, on the contrary, it improves the water
supply compared with the Historic scenario.
The Rio Conchos is one of the six tributaries whose waters contribute to the delivery of
treaty obligations from Mexico to the U.S.. When the Treaty of 1944 was signed, the average
annual outflow from this river was considered 770 million m3/year, 59% of the treaty obligations
(Orive-Alba 1945). The historic average and median outflow for the Rio Conchos from 1955 to
2009 are 782 and 661 million m3/year; these values represent 60% and 51% of the treaty
obligations, respectively. Similarly, the average and median outflow for the Rio Conchos in the
Reoperation scenario are 732 and 609 million m3/year; these values represent the 56% and 47% of
the treaty obligations, respectively. Because the average and median annual outflow have a similar
value and distribution (Figure 6) with the historic and treaty’s signature values, these results show
that the reservoir reoperation policy does not harm the delivery of treaty obligations from Mexico
to the US. Thus, the Rio Conchos will continue to contribute about the same amount of water to
the treaty obligations, but with improved environmental conditions and human water supply.

Journal of Water Resources Planning and Management, ASCE. Accepted Nov. 2012. Ref.: WRENG-927R3
20
The safety of the O-P valley from floods is considered in the Reoperation scenario. Until
2009, fifteen major flood events occurred in this valley, as shown in Table 3 (IBWC 1971 and
2011). In 1971, the levee capacity at Ojinaga/Presidio was upgraded for a 25-year return period
flood estimated to be 1,190 m3/s (IBWC 1971); however, four floods occurred after the levees
were upgraded. In all of the cases from 1971 to 2009, daily streamflow values were close to or
larger than the levee capacity, monthly values for these events are larger than 550 million m3 (Sep.
1978). This monthly value is used as a threshold to identify months that are likely to experience
flood events. In the Historic scenario 10 months higher than 550 million m3 occur representing a
flood risk of 18.2% (5.5-year return period), while in the Reoperation scenario only 7 events occur
representing a flood risk of 12.7% (8-year return period). These results show that the proposed
policy reduces the frequency of months when floods are likely to occur.
The volume of water conveyed in each of the seven floods after 1955 has been analyzed
and compared with the Historic scenario at Ojinaga. In five flood events (1958, 1966 1978, 1990
and 2008) the volume of water passed through O-P valley is smaller than in the historic values,
18% less volume on average. On the contrary, in 2 flood events, 1991 and 1968, results from the
Reoperation scenario are about 20% larger than the historic events. These mixed results show that
the Reoperation policy has the potential to reduce flood damages; however, a more refined time
scale reservoir operation-flooding model is required to properly address this issue. The authors
acknowledge that results regarding flood risk are a coarse estimation, the purpose this analysis is
to highlight the potential opportunity to improve flood risk management through a reservoir
reoperation policy, such as the one proposed.
Tradeoffs among Flow Conditions

Journal of Water Resources Planning and Management, ASCE. Accepted Nov. 2012. Ref.: WRENG-927R3
21
Figure 7 shows the tradeoffs between base flows (left Y-axis) and small floods (right Y-
axis, inverse) for a set of different feasible solutions. These two variables are inversely correlated,
as the base flow increases, the frequency of small floods decreases (the return period increases,
T=1/frequency). For instance, an annual base flow of 300 million m3 allows the delivery of small
floods every year (T=1.2) in September-October and every two years (T=2) in July-August. In
contrast, an annual base flow of 624 million m3, as the maximum hydrograph, allows delivery of
small floods every two years (T=2) in September-October and every three years (T=3.2) in July-
August.
Figure 7 shows the different combinations of environmental flows that can be managed
and their consequences. Providing more frequent small floods may help to preserve the width of
the river channel; however, it may compromise the subsistence of the aquatic ecosystem because
of low base flows all year long. On the contrary, reoperating LLL for high base flows may provide
benefits for the aquatic ecosystem, but channel narrowing may resume due to the low frequency in
small floods. This figure shows that while there is a hydrograph that can provide the maximum
amount of water for environmental purposes (darker column in Figure 7), there are several
combinations that can provide a wide range of base flows and small floods. These combinations
should be analyzed by scientists and decision makers to determine which combination(s) can
support the aquatic ecosystem with water all year around (through base flows), while at the same
time keeping the channel open (through frequent small floods). Detailed research on the aquatic
ecosystem and the geomorphology dynamics of the river are necessary to determine the
combination that would be most beneficial for the environment.
Conclusions

Journal of Water Resources Planning and Management, ASCE. Accepted Nov. 2012. Ref.: WRENG-927R3
22
The authors’ hypothesis was confirmed through this research, it is possible to manage
water in the BB Reach to provide e-flows without affecting municipal, agricultural or treaty
obligations and without increasing the flood risk in the P-O valley: “changing the timing,
preserving the long term volume”. The reservoir reoperation policy increases the overall water
supply for human water users in the U.S. and Mexico. Moreover, this policy reduces the frequency
of months where floods are likely to occur. Under the proposed policy the outflow distribution for
the Rio Conchos is similar to the historic and treaty’s signature conditions, meaning that about the
same amount of water in the same time will be delivered to meet the treaty obligations from
Mexico to the US. Furthermore, water released from LLL reservoir are recaptured in Amistad
reservoir, where it is stored and re-distributed without affecting water users downstream.
The maximum annual amount of water that can be managed and delivered for e-flows in
the Big Bend Reach at Johnson Ranch is 982 million m3, which is 66% of the pre-reservoir
alteration conditions (1,488 million m3) and 98% of the historic average (1,004 million m3). Base
flows delivered are 624 million m3/year, which represent 55% of the pre-1946 conditions (1,129
million m3), these base flows mimic the pre-alteration conditions. High flows and small floods are
likely to occur with the same magnitude and similar frequency as in the pre-1946 conditions. The
main difference is in the frequency for September-October small floods, in the reservoir
reoperation policy they will occur every two years while in the pre-1946 conditions they used to
happen every year. Besides the maximum annual hydrograph, other feasible solutions were found
with different combinations of base flows and frequencies of small floods. In fact, there is an
inverse relationship between these two benchmarks, an increase in base flow volume represents a
decrease in small floods frequency and vice versa. These feasible solutions will help to understand
the expected frequency of small floods given a particular base flow in the river.

Journal of Water Resources Planning and Management, ASCE. Accepted Nov. 2012. Ref.: WRENG-927R3
23
Limitations
First, results from the reservoir re-operation policy are obtained assuming a repetition of
the historic hydrology in this region, the authors acknowledge the potential non-stationaryity of
the hydrology due to climate change. Second, the annual hydrographs presented in this paper are a
simplification of daily processes, further refinement in time scale may be necessary. Third, pilot e-
flows and monitoring are necessary to evaluate the impact of e-flows in sediment transport and
riverine ecosystem. Fourth, it is necessary to evaluate sediment transportation; moving sediment
from the BB reach to Amistad may reduce the conservation storage in this reservoir. Fifth, flood
risk results are a coarse approximation of the overall performance, detailed flood analysis and
modeling is required to properly address the flood risk in P-O valley, including the operation of
reservoir upstream LLL. Sixth, water quality issues are necessary to address in the BB Reach,
primary concerns include high bacteria levels, salinity and nutrients (Sandoval-Solis 2011).
Suggestions for future research include water quality, hydrologic and flood modeling; climate
change analysis, sediment transport, and estimation of gains and conveyance losses.
Acknowledgements
The writers would like to thank the National Council of Science and Technology of
Mexico CONACYT for the financial support provided to the first author. Special thanks are
provided to all the people involved in the scientific committee for the Big Bend, especially to Dr.
John (Jack) C. Schmidt who reviewed and improved the content of this paper.

Journal of Water Resources Planning and Management, ASCE. Accepted Nov. 2012. Ref.: WRENG-927R3
24
References
Bednarek, A.T. and Hart, D.D. (2005). “Modifying dam operations to restore rivers: ecological
responses to Tennessee River dam mitigation” J. Ecological Applications, 15(3):997-
1008
Bestgen, K.R., and Platania, S.P. (1991). “Status and conservation of the Rio Grande silvery
minnow, Hybognathus amarus.” The Southwestern Naturalist 36(2): 225-232
Bovee, K.D. (1978). “The incremental methods of assessing habitat potential for coolwater
species, with management implications,” p. 340-346 in Selected coolwater fishes of
North America. Kendall R. L., ed., Am. Fish. Soc. Spec., Publication No. 11.
Brizga, S.O., Arthington, A.H., Pusey, B.J., Kennard, M.J., Msckay, S.J., Werren, G.L. Craigie,
N.M., and Choy, S.J., (2002). “Benchmarking, a ‘Top-Down’ methodology for assessing
environmental flows for rivers,” Proc., International Conference on Environmental
Flows for Rivers, Cape Town, South Africa
Comisión Nacional del Agua (CONAGUA) (2008a). “Ley de Aguas Nacionales y su
Reglamento.” México, D.F. ISBN 968-817-626-5 (in Spanish)
Comisión Nacional del Agua (CONAGUA) (2008b). “Acuerdo por el que se da a conocer el
resultado de los estudios de disponibilidad media anual de las aguas superficiales en la
cuenca del Rio Bravo” Diario Oficial de la Federación. 29/Sep/08. México D.F. (in
Spanish)
Dean, D.J., and Schmidt, J.C., (2010). “Monitoring geomorphic response to exotic plant removal
on the Rio Grande in the Big Bend Region: An initial assessment,” Final Report.
Cooperative agreement between the National Park Service, Big Bend National Park and
Utah State University. Task agreement # J7130080065

Journal of Water Resources Planning and Management, ASCE. Accepted Nov. 2012. Ref.: WRENG-927R3
25
Dean, D.J., and Schmidt, J.C., (2011). “The role of feedback mechanisms in historic channel
changes of the lower Rio Grande in the Big Bend region,” J. Geomorphology, (126)
333-349
Dean, D.J., Scott, M.L., Shafroth, P.B., and Schmidt, J.C., (2011). “Stratigraphic,
sedimentologic, and dendrogeomorphic analyses of rapid floodplain formation along the
Rio Grande in Big Bend National Park, Texas,” Geological Society of America Bulletin,
September 2011, Vol. 123, Oo. 9-10, pp. 1908-1925
Everitt, B.L. (1998). “Chronology of the spread of tamarisk in the central Rio Grande.”
Wetlands, Vol. 18, No 4, pp. 658-668
IBWC - International Boundary and Water Commission (1906). Convention between the United
States and Mexico. Equitable Distribution of Waters of the Rio Grande, El Paso, TX.
International Boundary and Water Commission (IBWC). (1944). Treaty between the United
States and Mexico. Utilization of waters of the Colorado and Tijuana Rivers and of the
Rio Grande, Washington, DC.
International Boundary and Water Commission (IBWC). (1971). “Proposed flood control project
Rio Grande, Presidio Valley, Texas. Report as part of an international coordinated flood
control plan with Mexico for the Presidio-Ojinaga Valley”, Report, El Paso, TX.
International Boundary and Water Commission (IBWC). (2011). “Rio Grande Historical Mean
Daily Discharge Data.” <http://www.ibwc.state.gov/Water_Data/histflo1.htm> (Dec. 31,
2009)
Legates, D.R., and McCabe, G.J. (1999). “Evaluating the use of “goodness-of-fit” measures in
hydrologic and hydroclimatic model validation.” Water Resources Research Journal., Vol.
35(1): 233-241

Journal of Water Resources Planning and Management, ASCE. Accepted Nov. 2012. Ref.: WRENG-927R3
26
Loucks, D.P. (1997). “Quantifying trends in system sustainability.” Hydrological Science Journal,
42(4):513-530.
Moriasi, D.N., Arnold, J.G., Van Liew, M.W., Bingner, R.L., Harmel, R.D. and Veith, T.L. (2007)
“Model Evaluation guidelines for systematic quantification of Accuracy in watershed
simulations.” American Society of Agricultural and Biological Engineers, Vol. 50(3):
885−900
Moring, J.B. (2002). “Baseline assessment of instream and riparian-zone biological resources on
the Rio Grande in and near Big Bend national park, Texas.” U.S. Geological Survey.
Water Resources Investigations Reports 02-4106, Austin, TX.
Obama, B. and Calderón, F. (2010). “Joint Statement from President Barack Obama and President
Felipe Calderón.” The White House, Washington D.C.
Olden, J.D. and Naiman, R.J. (2010). “Incorporating thermal regimes into environmental flows
assessments: modifying dam operations to restore freshwater ecosystem integrity” J.
Freshwater Biology, 55:86-107
Orive-Alba, A. (1945). “Informe técnico sobre el tratado internacional de aguas presentado ante
el H. Senado mexicano” Comisión Nacional de Irrigación. México D.F. (in Spanish)
Pasternack, G. B. (2011). “2D modeling and ecohydraulic analysis.” Createspace: Seattle, WA.
Patino-Gomez, C., McKinney, D.C., and Maidment, D.R. (2007). “Sharing Water Resources
Data in the Bi-National Rio Grande/Bravo Basin.” J. Water Resources Planning and
Management, 133(5), 416-426.
Postel, A. and Richter, B. (2003). “Rivers for Life. Managing water for people and nature.”
Island Press.

Journal of Water Resources Planning and Management, ASCE. Accepted Nov. 2012. Ref.: WRENG-927R3
27
Richter, B.D., Baumgartner, J.V., Powell, J., and Braun, D.P. (1996). “A method for assessing
hydrological alteration within ecosystems.” J. Conservation Biology, 10(4):1163-1174.
Richter, B.D. and Thomas, G.A. (2007) “Restoring Environmental flows by modifying dams
operations,” J. Ecology and Society, 12(1):12
R. J. Brandes Co. (RJBC). (2004). “Water availability modeling for the Río Grande basin: Water
availability assessment. Final report.” Texas Commission on Environmental Quality,
Austin, TX.
Sandoval-Solis, S., Reith, B., and McKinney, D. C., (2010). “Hydrologic analysis before and
after reservoir alteration at the Big Bend reach, Rio Grande/Rio Bravo.” CRWR Online
Report 10-06. <http://www.crwr.utexas.edu/reports/2010/rpt10-6.shtml> University of
Texas at Austin
Sandoval-Solis, S. (2011). “Water planning and management for large scale river basins. Case of
study: Rio Grande/Rio Bravo transboundary basin.” Ph.D. Dissertation, The University
of Texas at Austin, Austin, TX
Sandoval-Solis S., McKinney D. C., and Loucks D. P. (2011). "Sustainability index for water
resources planning and management." J. Water Resources Planning and Management,
137(5), 381-390.
Schmandt, J. (2002). “Bi-national water issues in the Rio Grande/Rio Bravo Basin” J. Water
Policy, 4:137-155
Schmidt, J.C., Everitt, B.L. and Richard, G. A. (2003). “Hydrology and geomorphology of the
Rio Grande and implications for river rehabilitation.” in Aquatic Fauna of the Northern
Chihuahuan Desert, Garrett, G.P., and Allan, N.L. (eds), Special Publications Number
46, Sul Ross State University, Alpine, Texas.

Journal of Water Resources Planning and Management, ASCE. Accepted Nov. 2012. Ref.: WRENG-927R3
28
Tate, D.E., (2002). “Bringing technology to the table: Computer modeling, dispute resolution
and the Rio Grande” MS report, The University of Texas at Austin. Austin, TX
Tenant, D. L. (1975). “Instream flow regimes for fish, wildlife, recreation and related
environmental resources.” J. Fisheries, 1(4):6-10.
Tharme, R.E (2003). “A global perspective on environmental flow assessment; emerging trends
in the development and application of environmental flow methodologies for rivers,” J.
River Research Applications, 19:397-441
Tharme, R.E and King, J.M. (1998). “Development of the Building Block Methodology for
instream flow assessments, and supporting research on the effects of different magnitude
flows on riverine ecosystems.” Water Research Commission Report No. 576/1/98, Cape
Town, South Africa
Thompson, L., Escobar, M., Mosser, C.M., Purkey, D.R., Yates, D., and Moyle, P.B. (2011).
“Water management adaptations to prevent loss of spring-run Chinook salmon in
California under climate change” J. Water Resources Planning and Management,
Accepted, September
Texas Commission on Environmental Quality (TCEQ). (2006). “Allocation and distribution of
waters: distribution of available waters – upper Rio Grande and all Rio Grande
tributaries” Texas Administrative Code Title 30: Environmental quality, Part 1, Chapter
303, Subchapter C, Austin, TX.
Vigerstol, K. (2002). “Drought management in Mexico’s Rio Bravo basin.” M.S. thesis, Univ. of
Washington, Seattle.

Journal of Water Resources Planning and Management, ASCE. Accepted Nov. 2012. Ref.: WRENG-927R3
29
Yang, Z., Cui, B., and Chen, H. (2007). “A holistic approach for evaluating ecological water
allocation in the Yellow River Basin of China.” J. Front. Environ. Sci. Engin. China,
1(1):99-106.
Yang, W., Sun, D., and Yang, Z. (2008). “A simulation framework for water allocation to meet
the environmental requirements of urban rivers: model development and a case study for
the Liming River in Daqing City, China.” J. Environ. Fluid Mech., 8:333-347.
Yates, D., Seiber, J., Purkey, D., and Huber-Lee, A. (2005). “WEAP21 – A demand-, priority-,
and preference driven water planning model Part 1: Model Characteristics.” J. Water
International, 30(4), 487-500.
World Bank (WB) (2004). “Modeled observations on development scenarios in the lower
Mekong basin,” Report to the Mekong River Commission.
World Wildlife Fund (WF) (2008). “A vision for the Big Bend reach of the Rio Grande/Rio
Bravo” Declaration at the Bi-national Workshop at Sul Ross University, Alpine. TX.

Journal of Water Resources Planning and Management, ASCE. Accepted Nov. 2012. Ref.: WRENG-927R3
30
Figure 1. Rio Grande Basin

Journal of Water Resources Planning and Management, ASCE. Accepted Nov. 2012. Ref.: WRENG-927R3
31
Figure 2. Flow Conditions in the Big Bend reach at Johnson Ranch, Pre-1946
0
50
100
150
200
250
300
350
400
450
500
Str
eam
flo
w (
m3/s
)
2 < T < 3T = 1
P(75)=56 m3/s
P(95)=224 m3/s
J F M A M J J A S O N D
T=1
2<T<3
2<T<3
T=1

Journal of Water Resources Planning and Management, ASCE. Accepted Nov. 2012. Ref.: WRENG-927R3
32
Figure 3. Flow Conditions in the Big Bend reach at Johnson Ranch, Post-1946
0
50
100
150
200
250
300
350
400
450
500
Str
eam
flo
w (
m3/s
)
2 < T < 3T = 1
P(75)=56 m3/s
P(95)=224 m3/s
J F M A M J J A S O N D
T=1 2<T<3
2<T<3

Journal of Water Resources Planning and Management, ASCE. Accepted Nov. 2012. Ref.: WRENG-927R3
33
Figure 4. Storage zones and thresholds for Luis L. Leon reservoir. Zone 0: Baset=0; Zone 1: Baset=Baset
Drought. Zone 2: Baset=BasetNormal, SFt=0. Zone 3: Baset=Baset
Normal, SFt=ReleasetFlood.
Baset=BasetDrought at all times if < 250 or < 250. SFt=0 at all times if
< 250 or < 250, units: million m3. Wet Season: Jun. to Oct.; Dry season: Nov. to May.
0
100
200
300
400
500
600
700
800
900
Sto
rag
e (m
illio
n m
3)
J F M A M J J A S O N D
SCapacity
SFlood Control
SSmall Flood
SBase Flow
SDrought
SDead
Flood Control Zone
Environmental Flow Zone
Transition Zone
Drought Zone
Dead Storage 0
1
0
2
3

Journal of Water Resources Planning and Management, ASCE. Accepted Nov. 2012. Ref.: WRENG-927R3
34
Figure 5. Hydrograph that supplies the maximum amount water through the Big Bend reach
0
50
100
150
200
250
300
350
400
450
500
Str
eam
flo
w (
m3/s
)
2 < T < 3
T = 1
P(75)=56 m3/s
P(95)=224 m3/s
J F M A M J J A S O N D
T=2
T=3
T=1 T=1

Journal of Water Resources Planning and Management, ASCE. Accepted Nov. 2012. Ref.: WRENG-927R3
35
Figure 6. Annual outflow distribution of Rio Conchos at Ojinaga
0
500
1000
1500
2000
2500
3000
3500
Historic Reoperation
Mill
ion
m3
2920
1047
661
381
75
3213
962
609
313
36

Journal of Water Resources Planning and Management, ASCE. Accepted Nov. 2012. Ref.: WRENG-927R3
36
Figure 7. Tradeoffs between base flows and return periods for small floods. Vertical bars are values of base flow, solid dots are July-August flood flows, and open dots are Sep-Oct flood
flows.
1.0
0
100
200
300
400
500
600
700
800
Retu
rn P
eriod
(years)B
ase
Flo
w (
mill
ion
m3/y
ear)
Different Feasible SolutionsBase Flow Jul-Aug Sep-Oct
2.0
3.0
4.0
5.0

Journal of Water Resources Planning and Management, ASCE. Accepted Nov. 2012. Ref.: WRENG-927R3
37
Table 1. Performance Criteria and Sustainability Index for water users, Historic and Reoperation Scenarios
Demand Historic Reoperation (million m3) Rel(V) Rel(T) Res Vul Max S.I. R(V) R(t) Res Vul Max S.I.
United States Mun. Rio Grande 43.2 N/A N/A N/A N/A N/A N/A 100 100 100 0 0 100 Ag.Rio Grande 0.8 N/A N/A N/A N/A N/A N/A 65 98 58 4 10 80 Other Rio Grande 0.1 N/A N/A N/A N/A N/A N/A 64 95 60 12 25 75 Mexico Ag. DR 090 63.6 52 86 45 30 89 43 100 100 100 0 0 100 Ag. Rio Conchos 30.0 24 75 11 49 86 27 100 100 100 0 0 100 Ag. Rio Grande 17.7 24 75 11 49 86 27 65 99 58 4 8 80 Mun. Rio Conchos 0.3 24 75 11 49 86 27 100 100 100 0 0 100

Journal of Water Resources Planning and Management, ASCE. Accepted Nov. 2012. Ref.: WRENG-927R3
38
Table 2. Maximum Environmental Hydrograph and Storage Levels for the Policy Proposed Flow
Condition Value Unit Jan Feb Mar Apr May Jun Jul Aug Sep Oct Nov Dec Maximum Hydrograph
Base Flow Median m3/s 10 12 13 9 12 15 23 28 57 33 12 11
High Flows Peak m3/s 75 102 97 58 45
Duration days 1 3 4 3 3 Ret. Period years 1.4 1.3 1.1 2.0
Small Floods Peak m3/s 355 374
Duration days 9 11 Ret. Period years 3 2
Reservoir Re-operation Flood
Control Scapacity MCM 832 832 832 832 832 832 832 832 832 832 832 832
SFlood Control MCM 650 650 650 650 650 650 580 580 580 650 650 650 Environ.
Flow SSmall Flood MCM --- --- --- --- --- --- 406 406 288 288 --- --- SBase Flow MCM 283 283 283 283 283 283 283 283 283 283 283 283
Drought Zone
SDrought MCM 217 217 217 217 217 217 217 217 217 217 217 217 SDead MCM 50 50 50 50 50 50 50 50 50 50 50 50
* MCM – million m3.

Journal of Water Resources Planning and Management, ASCE. Accepted Nov. 2012. Ref.: WRENG-927R3
39
Table 3. Historic Flows in the Big Bend Reach
Peak Flow Peak Flow
Year Month (m3/s) Year Month (m3/s)
1829(a) N/A N/A 1944(a) Sep 1,243
1868(a) N/A N/A 1958(a) Oct 1,538
1904(a) Sep 4,587 1966(a) Sep 527
1917(a) Sep 3,964 1968(a) Sep 467
1932(a) Oct 3,002 1978(b) Sep 1,850
1938(a) Sep 1,928 1991(b) Sep 1,030
1941(a) May 892 2008(b) Sep 1,490
1942(a) Sep 1,682 Data sources: (a) IBWC 1971 and (b) IBWC 2011; N/A – Not Available