journal of undergraduate chemistry research 2020 19(3), 8
TRANSCRIPT

Journal of Undergraduate Chemistry Research, 2020,19(3), 8
GLUCOSE DECREASES THE ACTIVITY COEFFICIENT OF HYDROXIDE ANION: EFFECTS ON pH, pKa AND ENZYME ACTIVITY pH PROFILETodd P. Silverstein† and Joshua D. Bumgarner*
Chemistry Department, Willamette University, Salem, OR 97301
AbstractCrowding caused by macromolecular solutes (e.g., proteins, polysaccharides, oligonucleotides) has two different effects on probe solutes: excluded volume favors more compact structures, and chemical interactions favor the entity that is most strongly attracted to the crowding agents. These interactions can be distinguished by comparing the effects of a large, polymeric crowding agent (e.g., dextran) with its mo-nomeric unit (e.g., glucose). We found that glucose did not alter the pKa of two different small acids (acetic acid and bromophenol blue), but it did cause pH to fall by dramatically decreasing the activity coefficient of the hydroxide anion. In studies on yeast alcohol dehydrogenase (YADH), we found that glucose, dextran, and bovine serum albumin (BSA) all inhibited the enzyme and broadened its pH profile, increasing pKa,hi, while leaving pKa,lo unchanged. The fact that glucose and dextran had similar effects rules out excluded volume as a causative factor. Instead, the effects of glucose, dextran, and BSA stem from chemical interactions and/or viscosity increase, with serum albumin’s effect on pKa,hi being especially significant. BSA also enhanced YADH activity below pH 7.† corresponding author: [email protected] *present address: Chemistry Dept., University of California, Davis, CA 95616Keywords: pH and pKa, molecular crowding, enzyme pH profileIntroduction
Biochemical reactions are usually studied in vitro, in dilute buffered solutions of purified molecules of interest. However, such experiments ignore the effects of macromolecular crowding in vivo. Cellular milieu include thousands of different types of macromolecules (proteins, oligonucleotides, polysaccharides, and membranes) that occupy 25 – 40% of the volume (1,2). These macromolecular crowding agents alter the stability of probe sol-utes in two ways: Their excluded volume has an entropic effect that favors more compact structures, and their enthalpic chemical interactions with the probe (e.g., charge-charge, hydrogen bond-ing, hydrophobic) can be attractive or repulsive. Recent reviews have summarized great strides made in this field (3-6).
In the cytoplasm, the most common crowding agents are pro-teins, followed by polysaccharides (1,2). Thus the most biologi-cally relevant crowding agent to test experimentally would be a protein, e.g., bovine serum albumin (BSA) or lysozyme. At high concentrations, however, protein crowders can denature and aggre-gate, and even if they don’t, they can overwhelm the signal from the probe protein. For this reason, polysaccharides like dextran (a glucose polymer) and Ficoll (a sucrose polymer) are often used to study the effects of crowding in vitro; these are commercially available in a wide range of sizes. In order to distinguish exclud-ed volume effects from chemical interactions, the influence of the polymer (e.g., dextran) can be compared to that of the monomer (e.g., glucose), which does not exclude volume due to its small size. Any change caused by both stems from a chemical interac-tion, whereas a change caused by the polymer alone must be due to excluded volume (3).
Most experiments in this field have examined how macromo-lecular crowding influences protein folding and stability, ligand binding, and enzyme activity (3,4). Because effects on simple acid equilibria have so far not been addressed in the literature, we set out to study how crowding agents might alter pH and pKa. As the H+ and OH- ions are quite small, we did not expect crowding to alter pH, unless chemical interactions are significant. The same is true of pKa, unless deprotonation causes a dramatic change in size or shape. Accordingly, we titrated two acids and an enzyme in the
presence of dextran, glucose, and BSA.
The enzyme that we chose to study was alcohol dehydroge-nase from yeast (YADH, EC 1.1.1.1, UniProt # P00330) (7-9). YADH is a metalloenzyme in which an active site Zn2+ binds (and helps to deprotonate) its alcohol substrate. The enzyme also has a nucleotide binding domain that binds the NAD+ oxidizing agent, after which a hydride anion is transferred from the alcohol C-H to NAD+, as depicted in Scheme 1:
Conveniently, the NADH product is a reasonably strong near-UV chromophore (e340 = 6220 M-1cm-1). From its activity pH profile (7) we know that YADH has at least two catalytically important acidic groups, one with a pKa of 7.5 that must be depro-tonated to activate the enzyme, and another with a pKa of 10.6 that is protonated in the active enzyme. As a result, the optimal pH for YADH activity is 9.1 (7).
Experimental ProceduresSpectrophotometric Titration of Bromophenol Blue
To a 50 mL beaker, 10.00 mL of 0.150 M bromophenol blue (CAS # 62625-28-9, from Sigma-Aldrich) was added. The solution was acidified to pH ≈ 1 with 0.5 M HCl, with mixing, and a 1.00 mL aliquot was transferred from the beaker to a semi-micro quartz cuvette. pH was measured with a Thermo Scientific Orion Star pH meter (model A211) and a standard pH electrode calibrated with three Sigma-Aldrich reference buffers: pH 4.01, 7.00, and 10.01. Absorbance was measured with a Cary 3 UV-vis spectrophotometer at 593 nm and 435 nm, the absorbance maxima of the bromophenol blue acid (yellow) and its blue conjugate base, respectively. With successive aliquots of 1 M NaOH, the pH in the beaker was increased up to 12, and after each pH adjustment, an aliquot was transferred to the quartz cuvette for absorbance measurement, as above. This process was repeated
C
OH
HR'
R+ NAD+ + NADH
+ H+C
O
R'R
ADH-Zn2+
Scheme 1

Journal of Undergraduate Chemistry Research, 2020,19(3), 9
using bromophenol blue solutions containing glucose at 200 and 400 g/L. Absorbance vs. pH data were fit to Equation 1 (A593) and Equation 2 (A435).
Standard Titration of Acetic Acid
In a 100 mL beaker, 15.00 mL of 13.3 mM acetic acid (i.e., 0.200 mmol) was placed. The buret was loaded with 20.00 mM NaOH, and aliquots of 2.5 – 5 mL were added to the gently stirred (to minimize CO2 dissolution) beaker until the pH ceased to in-crease appreciably. pH was measured after each aliquot addition. The process was repeated for solutions that included 50, 100, 150, and 200 g/L of glucose (in both the beaker and the buret, to main-tain constant concentration). pH vs. added OH- (mmol) data were fit to Equation 3 up to the equivalence point, and to Equation 4 for the points at the end of the titration.
Glucose Effect on pH
A 25.00 mL portion of the acid or base to be tested (10, 100, 1000 µM HCl; 10, 50, 100, 1000 µM NaOH; 1 mM acetic acid) was added to a 100 mL beaker. For the acetic acid titration only, the initial pH was adjusted to the middle of its buffer zone, pH 4.75. To the buret was added a solution that contained both con-centrated glucose (400 g/L) and the acid or base to be tested (so as not to alter its concentration during the titration). Initial pH was measured, after which glucose aliquots of about 5 mL were added to the gently stirred beaker, and pH was measured after each ali-quot addition. Each titration was repeated at least twice, and pH values were averaged.
YADH Activity pH Profile
Each YADH activity assay was conducted by measuring the increase in A340 (from NADH) in a semi-micro UV-transparent plastic cuvette (1.00 cm path length). Each 1.00 mL sample con-tained: 250 µL of 1.00 mM NAD+ (final concentration 0.250 mM; CAS# 53-84-9, from Sigma-Aldrich); 150 µL of 1.0 M ethanol (final concentration 150 mM); 100 µL of 0.2 M buffer (final con-centration 20 mM; see Table S1 for the pH 4 – 13 buffers used); and 495 µL of deionized water. The Parafilm-covered cuvette was inverted several times to mix, then 5 µL of 0.50 mg/mL YADH (Sigma A-7011, EC 1.1.1.1) in 0.05 % (w/v) BSA was added, and the covered cuvette was quickly inverted again and loaded into a Genesis-500 UV-vis spectrophotometer for absorbance measure-ment; A340 was collected at 1 s intervals for at least 30 s. The slope of the initial linear absorbance vs. time data (∆A340/∆t) was calcu-lated, and then converted to v0 in µM/s by dividing by 6220 M-1. If the initial ∆A340/∆t for the control YADH at pH 9 was < 0.12 min-1, then the enzyme concentration was increased for that day’s work. v0 vs. pH data were fit to Equation 6.
The YADH pH profile in the presence of crowding agents was performed by replacing portions of the water aliquot with concen-trated stock solution of crowder: 800 g/L glucose, 400 g/L dex-tran-40 (≈ 40 kDa, from Leuconostoc spp., CAS# 9004-54-0, Sig-ma-Aldrich), or 200 g/L BSA (CAS# 9048-46-8, 96% purity, from Sigma-Aldrich). The volume of the added crowder stock solution was adjusted to give final concentrations of 100, 200, 300, and 396 g/L glucose; 50, 100, 150, and 198 g/L dextran-40; and 25, 50, 75,
and 98 g/L BSA. For each crowder concentration, v0 vs. pH data were fit as above.
Results: Effects of Glucose on Acid Titrations
The pH indicator bromophenol blue changes color from yel-low to blue as the pH rises above 3. The two forms have lmax values of 593 nm (deprotonated/blue) and 435 nm (protonated/yellow), so adding NaOH to an acidified 0.15 mM solution of bro-mophenol blue allowed us to create spectrophotometric titration curves (Figure 1). Absorbance vs. pH data were fit to the follow-ing versions of the Henderson-Hasselbalch equation:
(1)
(2)
where c0 is the initial (i.e., total) concentration of acid, in this case, 0.15 mM.
It is clear from Figure 1 that at least up to 400 g/L (2.2 M), glucose has no effect on the pKa of bromophenol blue. All points for the three titrations (0, 200, and 400 g/L glucose) lie on the
𝐴𝐴!"# 𝐵𝐵:! = 𝜀𝜀!"# · 𝑐𝑐!
(1 + 10 !!!!!" )
𝐴𝐴!"# 𝐵𝐵𝐵𝐵 = 𝜀𝜀!"# · 𝑐𝑐!
(1 + 10 !"!!!! )
Figure 1: Spectrophotometric titration curves – NaOH was added to acidified 0.15 mM bromophenol blue in the presence of 400 g/L (blue points), 200 g/L (red points), and 0 g/L glucose (black points): (A) appearance of conjugate base, and (B) disappearance of protonated acid. Fit parameters (via nonlinear regression) are: pKa = 3.83 ± 0.06 (A) and 3.54 ± 0.15 (B); e
l(molar absorptivity) = 6060 ±
200 M-1 (A, 593 nm, conjugate base) and 2000 ± 170 M-1 (B, 435 nm, protonated acid); residual absorbance = 0.089 ± 0.022 (A) and 0.102 ± 0.018 (B); R2 = 0.98 (A) and 0.89 (B).
Journal of Undergraduate Chemistry Research, 2020,19(3), 10
same titration curves. On the other hand, we noticed that in order to reach each high pH, it took more NaOH at higher glucose con-centrations. This suggested to us that glucose was interacting with OH- in such a way as to lower its activity. In order to test this, we titrated glucose into solutions of NaOH, HCl, and acetic acid to see the effect on pH.
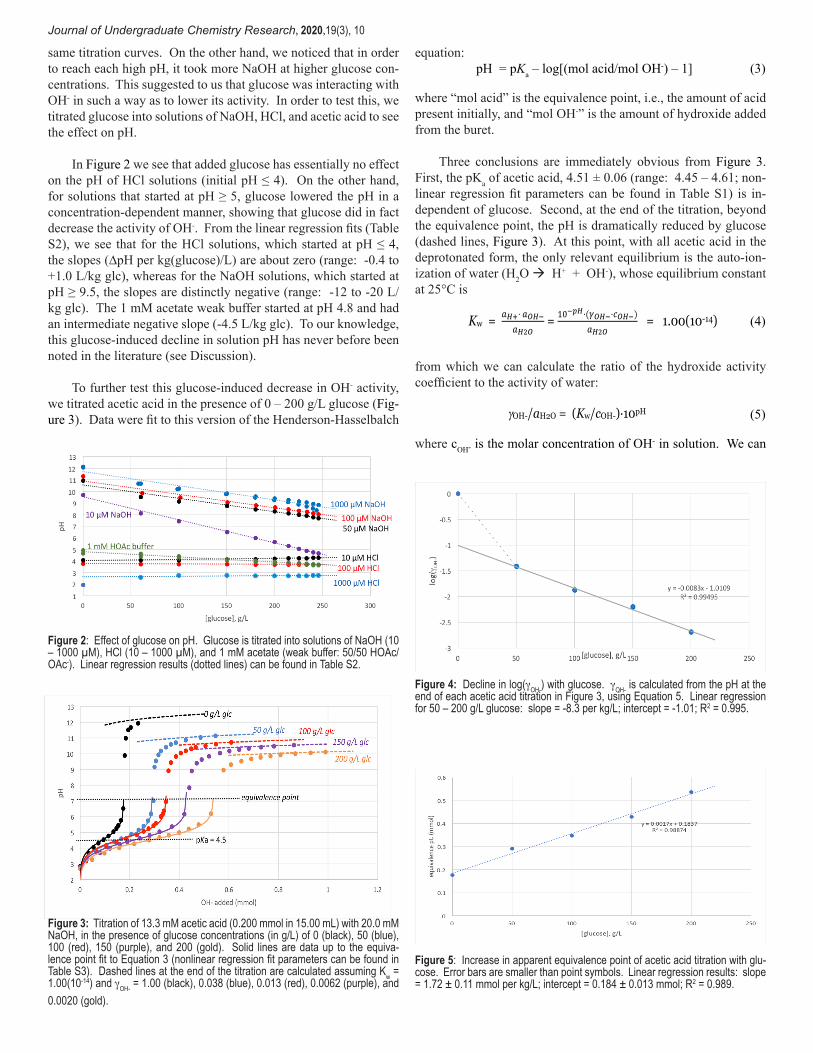
In Figure 2 we see that added glucose has essentially no effect on the pH of HCl solutions (initial pH ≤ 4). On the other hand, for solutions that started at pH ≥ 5, glucose lowered the pH in a concentration-dependent manner, showing that glucose did in fact decrease the activity of OH-. From the linear regression fits (Table S2), we see that for the HCl solutions, which started at pH ≤ 4, the slopes (∆pH per kg(glucose)/L) are about zero (range: -0.4 to +1.0 L/kg glc), whereas for the NaOH solutions, which started at pH ≥ 9.5, the slopes are distinctly negative (range: -12 to -20 L/kg glc). The 1 mM acetate weak buffer started at pH 4.8 and had an intermediate negative slope (-4.5 L/kg glc). To our knowledge, this glucose-induced decline in solution pH has never before been noted in the literature (see Discussion).
To further test this glucose-induced decrease in OH- activity, we titrated acetic acid in the presence of 0 – 200 g/L glucose (Fig-ure 3). Data were fit to this version of the Henderson-Hasselbalch
equation: pH = pKa – log[(mol acid/mol OH-) – 1] (3)
where “mol acid” is the equivalence point, i.e., the amount of acid present initially, and “mol OH-” is the amount of hydroxide added from the buret.
Three conclusions are immediately obvious from Figure 3. First, the pKa of acetic acid, 4.51 ± 0.06 (range: 4.45 – 4.61; non-linear regression fit parameters can be found in Table S1) is in-dependent of glucose. Second, at the end of the titration, beyond the equivalence point, the pH is dramatically reduced by glucose (dashed lines, Figure 3). At this point, with all acetic acid in the deprotonated form, the only relevant equilibrium is the auto-ion-ization of water (H2O à H+ + OH-), whose equilibrium constant at 25°C is
(4)
from which we can calculate the ratio of the hydroxide activity coefficient to the activity of water:
(5)
where cOH- is the molar concentration of OH- in solution. We can
Figure 2: Effect of glucose on pH. Glucose is titrated into solutions of NaOH (10 – 1000 µM), HCl (10 – 1000 µM), and 1 mM acetate (weak buffer: 50/50 HOAc/OAc-). Linear regression results (dotted lines) can be found in Table S2.
Figure 3: Titration of 13.3 mM acetic acid (0.200 mmol in 15.00 mL) with 20.0 mM NaOH, in the presence of glucose concentrations (in g/L) of 0 (black), 50 (blue), 100 (red), 150 (purple), and 200 (gold). Solid lines are data up to the equiva-lence point fit to Equation 3 (nonlinear regression fit parameters can be found in Table S3). Dashed lines at the end of the titration are calculated assuming Kw = 1.00(10-14) and gOH- = 1.00 (black), 0.038 (blue), 0.013 (red), 0.0062 (purple), and 0.0020 (gold).
Figure 4: Decline in log(gOH-) with glucose. gOH- is calculated from the pH at the end of each acetic acid titration in Figure 3, using Equation 5. Linear regression for 50 – 200 g/L glucose: slope = -8.3 per kg/L; intercept = -1.01; R2 = 0.995.
Figure 5: Increase in apparent equivalence point of acetic acid titration with glu-cose. Error bars are smaller than point symbols. Linear regression results: slope = 1.72 ± 0.11 mmol per kg/L; intercept = 0.184 ± 0.013 mmol; R2 = 0.989.
Kw = !!!· !!"!!!!!
= !!!!"·(!!"!·!!"!)
!!!! = 1.00(10-14)
γOH-/aH2O = (Kw/cOH-)·10pH
Journal of Undergraduate Chemistry Research, 2020,19(3), 11
see from Equation 5 that anything that causes a decrease in gOH-/ aH2O will cause the pH to fall.
At high solute concentration the activity of water falls below one, because both its mole fraction and its activity coefficient de-cline. At the same time, know from Figures 2 and 3 that adding glucose causes pH to fall as well. From Equation 5 we see that pH will fall only if the gOH-/aH2O ratio declines. Thus glucose must cause a lowering of gOH- that far outweighs the decline in aH2O. We conclude that the important effect of glucose is its lowering of gOH-, and it is safe to ignore any effects on aH2O. The declining final pH values in Figure 3 thus suggest that glucose does lower gOH- (Table S3). In fact, we see in Figure 4 that for 50 – 200 g/L glucose, log(gOH-) declines linearly with [glucose].
The final important point gleaned from Figure 3 is that the apparent equivalence point increases with glucose. (See Figure S1 for a blowup of the data in Figure 3 only up to the equivalence point). This increase occurs because glucose lowers the activity coefficient of OH-, and the resultant lowered activity of OH- re-quires a larger addition of OH- to react with the initial 0.20 mmol of acetic acid.
In fact, we see from Figure 5 that the equivalence point in-creases linearly with [glucose]. The intercept, 0.184 ± 0.013 mmol, is within 8% of the expected value of 0.20 mmol (the initial amount of acetic acid titrated). The slope, 1.72 ± 0.11 mmol per kg/L glucose, shows a glucose-induced decrease in gOH- that is sub-stantial, but is orders of magnitude less than that observed at the
end of the titration, when all acetic acid is deprotonated and the pH is much higher. The slope in Figure 4 suggests that gOH- de-creases by 8.3 orders of magnitude per kg/L glucose! Note that the hydroxide concentration is several orders of magnitude higher at the end of the titration (pH 10-12.5), compared to the equivalence point (pH 7). Clearly, the glucose-induced decrease in gOH- is much greater at higher concentrations of hydroxide.
Crowding Effects on Alcohol Dehydrogenase pH Profile
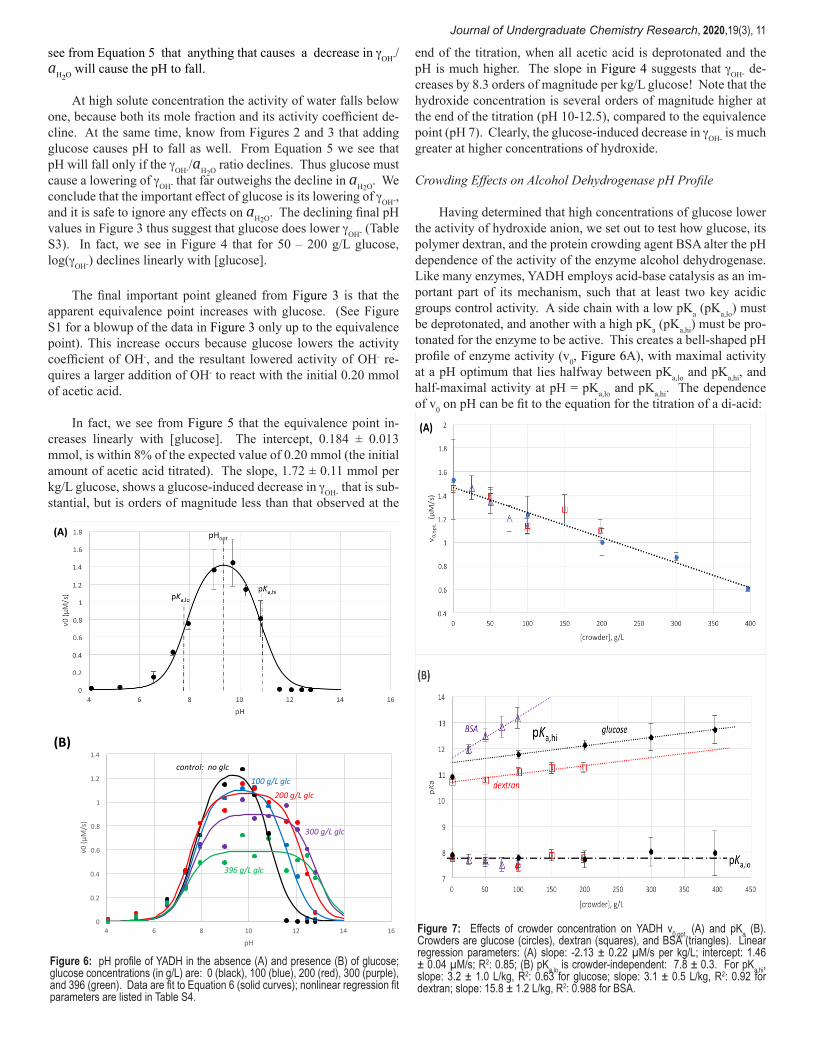
Having determined that high concentrations of glucose lower the activity of hydroxide anion, we set out to test how glucose, its polymer dextran, and the protein crowding agent BSA alter the pH dependence of the activity of the enzyme alcohol dehydrogenase. Like many enzymes, YADH employs acid-base catalysis as an im-portant part of its mechanism, such that at least two key acidic groups control activity. A side chain with a low pKa (pKa,lo) must be deprotonated, and another with a high pKa (pKa,hi) must be pro-tonated for the enzyme to be active. This creates a bell-shaped pH profile of enzyme activity (v0, Figure 6A), with maximal activity at a pH optimum that lies halfway between pKa,lo and pKa,hi, and half-maximal activity at pH = pKa,lo and pKa,hi. The dependence of v0 on pH can be fit to the equation for the titration of a di-acid:
Figure 6: pH profile of YADH in the absence (A) and presence (B) of glucose; glucose concentrations (in g/L) are: 0 (black), 100 (blue), 200 (red), 300 (purple), and 396 (green). Data are fit to Equation 6 (solid curves); nonlinear regression fit parameters are listed in Table S4.
Figure 7: Effects of crowder concentration on YADH v0,opt. (A) and pKa (B). Crowders are glucose (circles), dextran (squares), and BSA (triangles). Linear regression parameters: (A) slope: -2.13 ± 0.22 µM/s per kg/L; intercept: 1.46 ± 0.04 µM/s; R2: 0.85; (B) pKa,lo is crowder-independent: 7.8 ± 0.3. For pKa,hi, slope: 3.2 ± 1.0 L/kg, R2: 0.63 for glucose; slope: 3.1 ± 0.5 L/kg, R2: 0.92 for dextran; slope: 15.8 ± 1.2 L/kg, R2: 0.988 for BSA.
0
0.2
0.4
0.6
0.8
1
1.2
1.4
4 6 8 10 12 14 16
v0(µ
M/s)
pH
100g/Lglc
200g/Lglc
300g/Lglc
396g/Lglc
control:noglc
(B)

Journal of Undergraduate Chemistry Research, 2020,19(3), 12
(6)
where v0 is the initial reaction velocity (in µM/s), and v0,opt. is the velocity at optimal pH. Details of the derivation of this equation can be found in the Supporting Information for ref (7).
Regarding the effects of glucose on the pH profile of YADH, three conclusions are clear from the curves plotted in Figure 6 and the associated fit parameters listed in Table S4: v0,opt. declines with glucose, pKa,hi increases with glucose, and pKa,lo is unaffected by glucose. Figure 7 shows that these effects are also observed with the macromolecular crowders dextran and BSA, and the effects are linearly proportional to [crowder].
The slope of the increase of pKa,hi with crowder is the same for glucose and dextran, about 3 pKa units per kg/L increase of crowder concentration, whereas the slope of the BSA line is about 5-fold higher.
BSA has an interesting protective effect on YADH activity
under mildly acidic conditions, as depicted in Figure 8 and Figure 9. Below pH 7, enzyme activity declines due to the protonation of a key conjugate base side chain. In fact, the decline of v0 to zero with acidity is independent of the concentration of dextran or glu-cose: The black circle points in Figure 8 are average values at each pH for all concentrations, 0 – 396 g/L. On the other hand, v0 in the presence of BSA (open squares in Figure 8) is consistently higher than in its absence (black circles), and the difference is statistically significant (from 2.5 – 20 standard deviations). Furthermore, this enhancement of enzyme activity increases with BSA concentration up to 75 g/L. At pH 7.3 (and above), however, the difference is not statistically significant (Figure 8; from 1.2 – 1.9 standard de-viations). The dependence of v0 on BSA concentration is depicted in Figure 9. At pH < 7, in the presence of 25 g/L BSA, activity is 2 – 3 fold higher than it is in its absence, and activity rises further as BSA is added, up to 75 g/L. On the contrary, at (and above) pH 7.3 (purple points), 25 g/L BSA raises v0 by only 14%, and it does not increase with further BSA addition.
Discussion: Glucose lowers pH
We have shown that glucose lowers the pH of hydroxide solu-tions (10 – 1000 µM) and 1 mM acetic acid, but not HCl solu-tions (10 – 1000 µM), while leaving the pKa of acetic acid and bromophenol blue unchanged. Glucose could lower the pH of hydroxide solutions by interacting with the hydroxide anion and decreasing its activity coefficient (and leaving the molar concen-tration of OH- unchanged), by reacting with hydroxide to decrease its molar concentration, or possibly both. The two most likely hydroxide/glucose chemical reactions are: nucleophilic attack to yield a hemi-acetal alkoxide (Scheme 2), and oxidation to gluco-nate (i.e., the “blue bottle” experiment, Scheme 3).
Hemi-acetal alkoxide formation (Scheme 2) is not expected to be appreciable for two reasons: The straight chain (2) is much less
Figure 9: YADH activity below pH 7.5. The 0 g/L point at each pH is the average of all measurements in the absence of BSA, i.e., 0 – 396 g/L of glucose and dextran.
Figure 8: YADH activity under acidic conditions (pH < pKa,lo), in the presence (squares) and absence (black circles) of BSA. The black circles are the average of all v0 measurements in the absence of BSA, i.e., 0 – 396 g/L of glucose and dextran. Squares represent v0 in the presence of 25 g/L (blue), 50 g/L (green), 75 g/L (red), and 99 g/L (purple) BSA.
O O
OHHO
OH
HO
:OHH
OH
OHHO
OH
HOO OH
OHHO
OH
O:
OHHO
1 2 3
Scheme 2: Hydroxide attack on aldehyde (glucose) to give hemi-acetal.
Scheme 3: Glucose oxidation to gluconate under alkaline conditions; oxidation of a second glucose would reduce the peroxide (HOO-) to 2 OH-, giving the net reaction: 2 RCH=O + 2 OH- + O2 à 2 RCOO- + 2 H2O.
:OH
R
H
O
R
:O
H
OH
R
O
O:
H:
O2 HOO:
+cat.
+cat.
+
H+
𝑣𝑣! = 𝑣𝑣!,!"#.
1 + 10(!"!!!!,!!) + 10(!!!,!"!!")

Journal of Undergraduate Chemistry Research, 2020,19(3), 13
stable than the pyranose ring form (1, ∆G° = +5 kcal/mol (10)), and the hemi-acetal (3) is less stable than the aldehyde (2, ∆G° ≈ +1 kcal/mol (11)). Even though high glucose concentration will push this reaction forward, our highest concentration (400 g/L, 2.2 M) would supply a driving force of only 0.5 kcal/mol at 25 °C.
Dioxygen oxidation of glucose to gluconate (Scheme 3) is quite spontaneous, as readily observed in the well-known “blue bottle” classroom demonstration (12,13). However, this reaction generally requires hydroxide concentrations ≥ 0.1 M, and even then, only occurs at appreciable rates in the presence of two-elec-tron redox mediator dyes (13,14). For these reasons, we believe it most likely that glucose lowers the activity of hydroxide (and thus lowers pH) not by reacting chemically with it, but by interacting with it so as to lower its activity coefficient.
This ability of glucose to lower gOH- appeared at two points in the acetic acid titrations depicted in Figure 3, at the equivalence point and at the end of the titration. Comparing the slope in Figure 4 (-8.3 L/kg, log(gOH-) vs. [glucose]) to that in Figure 5 (1.7 mmol per kg/L, equivalence point vs [glucose]) shows that this effect is extremely concentration-dependent. At the end of the titration, where hydroxide concentration is several orders of magnitude higher than it is at the equivalence point, glucose causes a much greater lowering of gOH- .
Although to our knowledge, this is the first report in the litera-ture demonstrating the tendency of glucose to lower gOH-, there are a number of reports showing that adding glucose caused internal pH to decline in various cells and organelles (15-17). These au-thors interpreted the pH decrease of about 0.5 pH units to the addi-tion of glucose triggering the fermentative production of metabolic acids. Although this is certainly possible, we note here that this pH decline can be at least partially (and perhaps fully) accounted for by the glucose-induced pH (and gOH-) declines that we depict in Figure 2.
Glucose inhibits YADH activity and raises pKa,hi
Alcohol dehydrogenase, like almost all NAD-linked dehydro-genases, is somewhat unusual for a Michaelis-Menten enzyme in that its rate-limiting step is product (NADH) release (18).This is not totally unexpected, because substrate (NAD+) binding to the nucleotide binding domain is accompanied by a significant open to closed conformational change [19], where the open state of YADH is more compact than the closed conformation (20). Because prod-uct release must reverse the changes during substrate binding (i.e., Eclosed•NADH à Eopen + NADH), excluded volume, which favors the more compact open state, should speed up the rate-determining product release step and increase enzyme activity (8).
On the other hand, it is also important to consider the fact that high concentrations of crowding agents often increase solu-tion viscosity.[8] Higher viscosity will impede the diffusion of the product away from the binding site, and enhance rebinding (21). Increased viscosity could also hinder any enzyme conformation-al changes that involve significant volume fluctuations (22-24). Either of these two viscosity effects would slow down YADH’s rate-determining product release step (8).
We show in Figure 7A that v0,opt. decreases by ≈ 2 µM/s per kg/L of added crowder, which matches the dextran inhibition seen by Schneider et al (40% inhibition at 300 g/L [8]), but is some-what less than the inhibition that they observed with glucose (8,9). Schneider et al showed that glucose and dextran at equal concen-trations had the same effect on solute diffusion coefficients, con-cluding that crowder inhibition of YADH stems from the viscosi-ty-induced inhibition of product diffusion away from the binding site (8). Our results showing that glucose, dextran, and BSA all fall on the same line in Figure 7A agree with this conclusion.
Structural studies have associated specific amino acid side chains in ADH with pKa,lo and pKa,hi (25,26). Histidine51, which begins a proton transfer chain that includes NAD+-ribose-OH and ser/thr48-OH, and ends with the substrate ethanol-OH (middle of Figure 10), is believed to titrate with pKa,lo ≈ 7.5. The ribose-OH proton hydrogen-bonds to the histidine imidazole nitrogen, and therefore the latter must be deprotonated in order to activate the proton transfer chain and bind both the NAD+ and the ethanol sub-strates. Lysine228-NH3
+, which forms a hydrogen bond with a hy-droxyl oxygen of the NAD+-ribose-OH substrate (25,26) (top of Figure 10), could account for pKa,hi ≈ 10.6; it must be protonated to optimize NAD+ binding. Alternatively, the decrease in activity at high pH could be due to denaturation of the enzyme (note that activity declines to zero for pH > 11.5, Figure 7A).
In Figure 7B we show that whereas crowding has no effect on pKa,lo of YADH, it increases pKa,hi. The two amino acid side chains identified with these pKa values, his51 and lys228, respectively, both form part of the nucleotide binding domain, as they both hydro-gen-bond to the NAD+ substrate. At first glance it would thus seem surprising that crowding could have such disparate effects on the two side chains. However, NAD+ is a large molecule, and the two side chains interact with ribose-OH groups on different ends of the molecule: His51 hydrogen-bonds to the ribose-OH adjacent to the
Figure 10: YADH active site, showing side chains that bind NAD+ (in bold). His51 (pKa,lo) and lys228 (pKa,hi) are marked in red. Modified from ref (26). .

Journal of Undergraduate Chemistry Research, 2020,19(3), 14
nicotinamide group (middle of Figure 10), whereas lys228 interacts with the ribose-OH adjacent to the adenine group (top of Figure 10).
Our results suggest that crowding by dextran, glucose, and BSA leaves the environment around his51 unchanged, whereas the environment around lys228 is altered to stabilize the protonated lys228-NH3
+ and thus increase its pKa. This could occur by bringing closer to lys228 either a full negative charge (e.g., from the near-by aspartate223 side chain, top of Figure 10) or a partial negative charge (e.g., from the nearby pyrophosphate P=O oxygen, Figure 10). The fact that both glucose and dextran (and even BSA at con-centrations ≤ 50 g/L) have this effect suggests that the conforma-tional change is not due to excluded volume, but rather to either a chemical interaction or to the crowder-induced increase in viscosi-ty. Alternatively, the increase in pKa,hi could be due to a protective effect of crowding against alkaline-induced denaturation. Further studies on the effects of crowding on enzyme pH-stability will al-low us to distinguish between these two explanations.
Finally, while none of the crowding agents altered pKa,lo, Fig-ure 8 and Figure 9 show that BSA activated YADH at pH values below 7.5. At pH 6.6, BSA raised v0,opt. about two-fold, in a con-centration-dependent manner; at pH 5.2 and 4.1, the increase was about three-fold. Because pKa,lo remained the same, BSA could not have directly influenced the protonation state of his51. In-stead, it must have favored the more compact open conformation of YADH, thus speeding up the rate-determining NADH release step at these low pH values. Above pH 7 this effect was greatly attenuated, and was not concentration-dependent. These enhanced effects of BSA on low-pH YADH activity and on the increase of pKa,hi (Figure 7B) bear further study.
Conclusion and Future Studies
From titrations of Bromophenol blue and acetic acid we de-termined that glucose interacts with hydroxide anion so as to dra-matically lower its activity coefficient. This effect is dependent on the concentrations of both glucose and hydroxide. Unfortunate-ly, we did not have time to test the effects of the macromolecular crowders dextran and BSA on pH and pKa. The results of such studies would be of great interest. Regarding the enzymatic ac-tivity of YADH, glucose, dextran, and BSA all lowered v0,opt., left pKa,lo unchanged, and raised pKa,hi. These effects are not due to excluded volume, but rather to crowder-YADH chemical interac-tions and/or crowder-induced viscosity increase. BSA has some interesting effects on YADH activity that bear further study.
Acknowledgments
We wish to acknowledge Kristin Slade for her assistance with our experimental and theoretical questions, and for her suggestions regarding this manuscript.
References
1. Zimmerman SB, Trach SO, Journal of molecular biology, 1991, 222:599–620.
2. Fulton AB, Cell, 1982, 30:345–347.3. Silverstein TP, Slade K., Journal of Chemical Education,
2019, 96:2476–2487.4. Kuznetsova IM, Zaslavsky BY, Breydo L, et al. Molecules,
2015, 20:1377–14095. Kuznetsova IM, Turoverov KK, Uversky VN, International
journal of molecular sciences, 2014,15:23090–231406. Gnutt D, Ebbinghaus S., Biological chemistry 2016,
397:37–447. Silverstein TP. Journal of Chemical Education, 2016,
93:963–9708. Schneider SH, Lockwood SP, Hargreaves DI, et al., Bio-
chemistry 2015, 54:5898–59069. Wilcox AE, LoConte MA, Slade KM., Biochemistry. 2016,
55:3550–355810. Zubay, Geoffrey L. Biochemistry, 4th ed. Wm. C. Brown,
Dubuque, IA; , 1998, p. 28511. Bell RP, McDougall AO. Transactions of the Faraday Soci-
ety 1960, 56:1281–128512. Vandaveer IV WR, Mosher M, Journal of Chemical Educa-
tion 1997, 74:40213. Limpanuparb T, Ruchawapol C, Pakwilaikiat P, Kaewpichit
C. ACS omega 2019, 4:7891–789414. Sowden JC, Schaffer R. Journal of the American Chemical
Society 1952, 74:499–50415. Jähde E, Rajewsky MF. Cancer research 1982, 42:1505–
151216. Volk T, Jähde E, Fortmeyer HP, et al British journal of can-
cer , 1993, 68:492–50017. Dellian M, Helmlinger G, Yuan F, Jain RK. British journal
of cancer 1996, 74:1206–121518. Nagel ZD, Klinman JP., Chemical reviews, 2006, 106:3095–
311819. Raj SB, Ramaswamy S, Plapp BV. Biochemistry 2014,
53:5791–580320. Cho Y-K, Northrop DB. Biochemistry ,1999, 38:7470–747521. Olsen SN.Thermochimica Acta, 2006, 448:12–1822. Sierks MR, Sico C, Zaw M., Biotechnology progress 1997,
13:601–60823. Uribe S, Sampedro JG. Biological procedures online 2003,
5:108–11524. Demchenko AP, Rusyn OI, Saburova EA.Biochimica et
Biophysica Acta (BBA)-Protein Structure and Molecular Enzymology 1989, 998:196–203
25. Hammes-Schiffer S, Benkovic SJ. Annu Rev Biochem 2006, 75:519–541
26. Trivic S, Leskovac V. J Serb Chem Soc 2000, 65:207–227

Journal of Undergraduate Chemistry Research, 2020,19(3), 15
Figure S1: Titration of 13.3 mM acetic acid (0.200 mmol in 15.00 mL) with 20.0 mM NaOH, in the presence of glucose concentrations (in g/L) of 0 (black), 50 (blue), 100 (red), 150 (purple), and 200 (gold). This titration up to the equivalence point is a subset of data from Figure 3; data are fit to Equation 3 (solid lines); nonlinear regression fit parameters can be found in Table S1.
1
Table S1: Buffers used for the YADH pH profile.
pH buffer
4.073 ± 0.021 Acetic acid
5.227 ± 0.015 Acetic acid
6.567 ± 0.015 KH2PO4
7.327 ± 0.006 KH2PO4
7.94 ± 0.05 Tris-NH3Cl
8.97 ± 0.03 Tris-NH3Cl
9.723 ± 0.005 glycine
10.237 ± 0.006 glycine
10.83 ± 0.06 glycine
11.570 ± 0.010 Na2HPO4
12.047 ± 0.006 Na2HPO4
12.46 ± 0.04 Na2HPO4
12.807 ± 0.021 Na2HPO4
Table S2: Linear regression results for data in Figure 2.
Slope (∆pH per kg glc/L)
Intercept (pH w/o glc)
R2
1000 µM NaOH -12.4 ± 0.6 11.74 ± 0.11 0.953
100 µM NaOH -11.7 ± 0.8 10.92 ± 0.14 0.962
50 µM NaOH -11.6 ± 0.7 10.57 ± 0.14 0.965
10 µM NaOH -19.7 ± 0.4 9.95 ± 0.07 0.997
1 mM HOAc -4.52 ± 0.20 4.79 ± 0.04 0.964
10 µM HCl 1.03 ± 0.13 4.014 ± 0.023 0.88
100 µM HCl -0.396 ± 0.011 3.7784 ± 0.0021 0.993 1000 µM HCl 0.49 ± 0.24 2.63 ± 0.05 0.35
Table S3: Nonlinear regression fit parameters for acetic acid titration in Figure S1. γOH- is calculated from the final data point of each curve in Figure 3.
[glucose], (g/L) pKa Equivalence point (mmol)
R2 γOH-
0 4.50 ± 0.03 0.1755 ± 0.0004 0.994 1.0
50 4.45 ± 0.03 0.2909 ± 0.0012 0.995 0.038
100 4.61 ± 0.05 0.3473 ± 0.0006 0.98 0.013
150 4.50 ± 0.03 0.4287 ± 0.0018 0.996 0.0062
200 4.47 ± 0.03 0.5371 ± 0.0024 0.993 0.0020
Table S4: Nonlinear regression fit parameters for YADH pH profiles in Figure 6.
[glucose], g/L pKa,lo pKa,hi v0,opt. (µM/s) R2
0 (Fig. 6A) 7.86 ± 0.08 10.84 ± 0.08 1.50 ± 0.06 0.955
0 (Fig. 6B) 7.74 ± 0.08 10.91 ± 0.08 1.29 ± 0.05 0.985
100 7.70 ± 0.09 11.65 ± 0.08 1.12 ± 0.04 0.98
200 7.49 ± 0.13 12.25 ± 0.11 1.08 ± 0.05 0.96
300 7.61 ± 0.16 12.78 ± 0.15 0.90 ± 0.05 0.94
396 7.35 ± 0.21 13.10 ± 0.25 0.59 ± 0.04 0.89
Appendix