journal of structural geology...journal of structural geology 32 (2010) 595e604 aggregate of...
TRANSCRIPT

lable at ScienceDirect
Journal of Structural Geology 32 (2010) 595e604
Contents lists avai
Journal of Structural Geology
journal homepage: www.elsevier .com/locate/ jsg
Nucleation and growth of new grains in recrystallized quartz vein: An examplefrom banded iron formation in Iron Quadrangle, Brazil
Leonardo Lagoeiro*, Paola BarbosaUniversidade Federal de Ouro Preto, Departamento de Geologia, Ouro Preto, MG 35400-000, Brazil
a r t i c l e i n f o
Article history:Received 28 August 2008Received in revised form8 March 2010Accepted 12 March 2010Available online 18 March 2010
Kewords:Crystallographic orientationUniversal stageElectron backscatter diffraction (EBSD)RecrystallizationQuartz
* Corresponding author. Tel.: þ55 31 35591859; faxE-mail address: [email protected] (L. Lagoeir
0191-8141/$ e see front matter � 2010 Published bydoi:10.1016/j.jsg.2010.03.007
a b s t r a c t
Intracrystalline microcracks developed in quartz single crystals deformed in greenschist metamorphicconditions. A detailed study of samples collected in tabular to lens shape quartz vein was carried out toinvestigate how the microcracks initiated and how the microstructures evolved with the progressivedeformation. A combination of light and EBSD (electron backscatter diffraction) techniques was used toanalyze the microstructures and determine the crystallographic orientation of quartz grains. The crys-tallographic orientations of microcracks indicate that they might have initiated parallel to the direction ofone of the rhombohedral planes of the host crystals. It is suggested that new grains nucleated by rotationof broken fragments from the host grains. c-axes the of host are distributed in a small-circle close to thefoliation plane while the c-axes of the new grains in microcracks are more scattered when comparedwith the host orientations. New grains grew with their c-axes approximately perpendicular to theshortening direction.
� 2010 Published by Elsevier Ltd.
1. Introduction
Small new grains found in zones of localized deformation arethought to be produced by dynamic recrystallization. The strongcrystallographic preferred orientation (CPO) and the microstruc-tures of the dynamically recrystallized aggregates are taken asevidence for crystal-plastic origin of these zones. Dynamic recrys-tallization is considered a process that accompanies dislocationcreep and involves the formation and migration of high angle grainboundaries, in response to deformation, in the same mineral(Vernon, 1981; Urai et al., 1986). Recrystallization does not producenew minerals during deformation, a process better referred to asneocrystallization (Urai et al., 1986). Models to describe dynamicrecrystallization are based on two main processes: (1) subgrainrotation recrystallization (Urai et al., 1986; White, 1977) and (2)grain-boundary migration recrystallization (Urai et al., 1986;Gordon and Vandermeer, 1966).
Models based on dislocation glide have been used to explain thecrystallographic preferred orientations (CPO) determined in quartz(Jessell, 1988; Jessell and Lister, 1990). Experimental studiesreported CPOs in host grains not entirely recrystallized developedby mechanical reorientation as a result of intracrystalline slip
: þ55 31 35591606.o).
Elsevier Ltd.
(Gleason et al., 1993). Nonetheless most of the best CPOs in rockswere determined in recrystallized quartz grains.
However, investigation of dynamically recrystallized grains inboth experimentally (den Brok, 1992; Vernooij et al., 2006) andnaturally deformed aggregates (van Daalen et al., 1999; Bestmannand Prior, 2003) have shown that the misorientation betweenparent and recrystallized grains cannot be easily explained in termsof subgrain and grain boundary recrystallization. Therefore, otherprocesses may exert an important control on the misorientationbetween host and recrystallized grains. Three models have beenproposed to explain the large misorientation angle observedbetween host and recrystallized grains: (1) recrystallized grainsonce formed may be deformed by grain-boundary sliding assistedby diffusive mass transfer (Bestmann and Prior, 2003; Lagoeiro andFueten, 2008); (2) new grains precipitated out of solution in voidsand microcracks (den Brok and Spiers, 1991; Hippertt and Egydio-Silva, 1996) and (3) new grains are fragments that were rotatedand separated from the host grain during sliding (den Brok 1994;van Daalen et al., 1999; Vernooij, et al., 2006).
The samples studied in this paper have features similar to thosepredicted in those three models above. Intracrystalline micro-fractures developed in quartz single crystals found in tabular to lensshape quartz veins. However, microstructures and crystallographicorientations differ slightly from those described in the previousstudies. In our studied quartz veins, we aim to understand how theintracrystalline microcracks nucleate and further evolve to an

L. Lagoeiro, P. Barbosa / Journal of Structural Geology 32 (2010) 595e604596
aggregate of recrystallized quartz grains. We also investigate indetail the role of dynamic recrystallization as well as of otherprocesses during the progressive deformation in the microfracturezones, once these aggregates were deformed at relatively lowtemperature (w300 �C) with participation of aqueous fluid(Hippertt and Egydio-Silva, 1996; Lagoeiro, 1998).
2. Geological setting and sample description
The quartz vein studied in this paper came from banded ironformations from the Iron Quadrangle (IQ) in the Southeast of Brazil(Fig. 1). The IQ is an Archean/Proterozoic terrane located at thesouthern boundary of the São Francisco Craton (Almeida,1977). TheIQ comprises metavolcanic and metasedimentary sequences sur-rounded by gneissicegraniticemigmatitic domes (Alkmim andMarshak, 1998). The sequences are folded and a regional foliation(S1/Sb) developed parallel to the axial planes of the major synclinesand anticlines. In the iron formation rocks the regional foliation (S1)is expressed as an alternately compositional banding (Sb) of quartzand iron oxides (magnetite and hematite) parallel to the S1 folia-tion. Ductile shear zones developed mainly parallel to thiscompositional banding and are related to the flexural slip occurringduring the folding process. The samples of quartz veins came fromone of these shear zones located in the overturned limb of the Serrado Curral Syncline. It consists of a steeply SE-dipping isoclinalsyncline trending NEeSW. The axial foliation/banding is moder-ately to steeply SE-dipping and the stretching lineation, associatedwith a top-to-the-SE sense of tectonic transport, trends NWeSE.
The mineral assemblage (Pires, 1995) and microstructures(Hippertt, 1994) found in metapelitic and quartizitc (quartz andsericite) country rocks indicate that the deformation occurredunder
Fig. 1. Map of the São Francisco Craton (SFC) showing the location of the Quadrilátero Ferrífein the Quadrilátero Ferrífero geological map is painted in black (after Dorr, 1969 and Alkm
greenschist facies conditions (w300e350 �C) and involved a wide-spread participation of water-rich fluids (Herz, 1978). The long axesof the quartz and hematite grains define the down-dip lineation andwere used to orient the samples in the field.
The analyzed quartz veins are embedded in a matrix of ironoxide (magnetite and hematite) and quartz. They are orientedparallel to the foliation/compositional banding. The compositionalbanding consists of an alternation of varied proportions of ironoxide and quartz layers. Most quartz veins aremade of fragments ofsingle crystals (host grains) of a few millimeters wide and severalmillimeters long (Fig. 2) connected by polycrystalline aggregates ofgranular quartz crystals (Lagoeiro and Fueten, 2008). Quartz hostgrains are elongated approximately parallel to the lineation direc-tion. Some quartz veins are composed only by aggregates of gran-ular quartz of lens shape and in this case they are described as purequartz layers. In this study only quartz with both types of grains, i.e.single crystals and granular aggregates of quartz, was selected formicrostructural and crystallographic preferred orientation(textural) analyzes. Although several vein samples have beensectioned for microscopic observations only three more represen-tative examples (BIFQV01, BIFQV02 and BIFQV03) were taken fordetailed microstructural and crystallographic orientation analyses.
3. Methods
All investigated samples (BIFQV01, BIFQV02 and BIFQV03) werecut perpendicular to the boundary quartz-iron oxide and parallel tothe long axis of elongate quartz grains. These planes and directionswere used to orient the samples. The X-axis was taken parallel tothe maximum elongation of quartz grains, the Z-axis perpendicularto the interface quartz-iron oxide and the Y-axis perpendicular to
ro (QF). Sampling location is circled and labeled BIFQV. The banded iron formation (BIF)im and Marshak, 1998).

Fig. 2. A mosaic along a XZ section in one of the analyzed quartz veins (BIFQV01). (a) Optical micrographs shown with an accessory plate (l ¼ 550 nm) inserted. (b) The analyzedmicrostructures are presented as an outline of grain and fractured boundaries. Each microstructural domain is separated by white and shades of gray and is marked with romannumerals. c-axis pole figures of quartz grains measured in each domain are shown. I) corresponds to the host domains; II) the new crystals in narrow rows; III) the new grains in thewide voids and IV) the isolated new grains.
L. Lagoeiro, P. Barbosa / Journal of Structural Geology 32 (2010) 595e604 597
the XZ plane. Initially, a series of optical micrographs of the veinswere taken with crossed polarizers and the lambda plate inserted(l ¼ 550 nm) and assembled in a mosaic (Fig. 2a). Then grainboundaries were contoured manually and further digitalized(Fig. 2b). One representative mosaic of all analyzed veins (BIFQV01)is presented in Fig. 3. This figure also shows an outline of themicrostructures from which the grain size, shape and axial ratioswere measured using the Image SXM program (Barrett, 2005).
3.1. Universal stage
The c-axis of quartz grains were measured with the help ofa universal stage (u-stage) mounted on an optical microscope. Themicrocrack surface orientations were also measured using a u-stage.A microcrack segment was brought to a vertical positionwith the u-stage. In a vertical position the fracture trace was oriented parallel tothe NeS direction of the ocular cross wire. In that position theorientation of the pole to the fracture surface was measured. The
Fig. 3. Microstructures of host grains (HG) in the quartz veins. Boundaries
optical axes of the host (the c-axes) aswell as of thenewquartz grainsin both side of the fracture surface were determined in horizontalEeWor in vertical orientation with respect to the microscope stage.In quartz only the c-axis orientation can bemeasured by the u-stage.Therefore, only the angle between the c-axis and the pole to thefracture boundary can be determined and it is not possible to deter-mine unambiguously the crystallographic orientation of the fracturesegment. Notwithstanding, in the trigonal symmetry of quartz crys-tals sets of crystallographic planes differing only in sign exhibit thesame characteristic angle to the c-axis. Therefore it is reasonable toascribe specific angles to specific sets of crystallographic planes. Thesubgrain-boundary orientations were obtained using the sameprocedure. Thismethod has been applied to the determination of thecrystallographic orientation of quartz-quartz interfaces by Kruhl andPaternell (2002). Although the u-stage serves as the only instrumenttomeasure the spatial orientation of a small segmentof the boundaryand the c-axis at the same time with sufficient accuracy, the methodhas some limitations. The u-stage can be inclined up to 50� and
of elongate subgrains are parallels to the c-axis of the host crystals.

L. Lagoeiro, P. Barbosa / Journal of Structural Geology 32 (2010) 595e604598
therefore fracture surfaces dipping 0e50� with respect to the thinsection plane cannot be measured. This inability poses a bias inselecting the analyzed fracture surface segment population andmight change the probability of occurrence of specific crystallo-graphic planes. In general the effect of the limited inclination of the u-stage on the frequency distribution of some crystallographic orien-tations can be avoided by measuring the fracture surface orientationin YZ sections. The cut-off effect on the u-stagemeasurements and itsstatistical significance will be verified below.
3.2. Electron backscatter diffraction
One sample (BIFQV03) was used for SEM electron backscatterdiffraction (EBSD, e.g. Prior et al. 1999) analysis of the host and thenew grains. The sample was sectioned using a precision saw andthen diamond polished down to 0.25 mm. The final lapping proce-dure took about 8 hours in an immersion of colloidal silica (20 nm).The electron microscope was set to 20 KV. The sample surface wasinclined to 70� to the horizontal at a working distance of 33 mm. Aminimum deviation angle of 2� was used for acquisition and of <1�
for pole figure calculation. The EBSD patterns were collectedautomatically at 10 mm intervals and processed using Channel 5software package (HKL-Oxford). In the orientationmap (Fig. 5a) thecolor of each pixel corresponds to the crystal direction parallel tothe X-direction of the sample. In the pattern quality map grayshades are related to the band contrast of the EBSD pattern (Fig. 5b).The pattern quality or band contrast map reproduce surfacedamage, fracture and (sub)grain boundaries and provide an addi-tional image of the microstructures. For that reason it is useful toverify the reliability of the orientation maps. The misorientationangle between adjacent points was determined by selecting theminimal angle of rotation necessary to bring one lattice intoa coincidence to the other (Wheeler et al., 2001). The distributionsof misorientation axes are presented in the sample and crystalreference frames for the host and new grain domains. The nearestneighbor misorientations are represented by their axes for small(2e5�) and large (>10�) misorientation angles.
4. Results
The quartz veins consist of large fragments of single crystals(millimeters in diameter) separated by aggregates of smaller quartzgrains (Fig. 2 and 3). These grains occur along narrow rows (two orthree grains wide) of slightly elongated crystals as well as larger
Fig. 4. Microstructures and crystallographic orientations of quartz subgrains in host crysta15e25� to the foliation surface. (b) Circles represent the orientation of subgrain c-axes. Trian(equal area projection) in the lower hemisphere. The horizontal line (X-axis) is parallel to t
grains filling wide gaps between fragments of single crystals thatwere broken off from the host grains.
4.1. Microstructures and orientation data
4.1.1. Host grainHost grain fragments are highly deformed and contain several
subgrain boundaries (misorientation angles up to 10�). On average,subgrains have dimensions of 300 mm in length and 60 mm inwidth.They are elongated at an angle ofw15e25� to the X-direction of thesample reference frame (Fig. 4a) and oriented approximatelyperpendicular to the Z-axis, suggestive of a plate-like shape of thesubgrains (Fig. 4b).
The host grains show strong crystallographic preferred orien-tations (CPO). The CPOs of the host consist of a strong c-axismaximum at the periphery of the pole figure w15e25� to the X-direction of the sample reference frame (Fig. 2, domain I andFig. 5aec). The a-axis maxima occupy a great circle that is slightlytilted with respect to the foliation plane (XY plane of the sample).The poles to {10-10} and {2-1-10} show rather similar distributionpatterns. The poles to rhomb {10-11} and {01-11} define threedistinct maxima.
Subgrains and host crystals show gradual lattice bending. Figs.6a and b show the distribution of misorientation axes withrespect to the sample and the crystal reference frames. Themisorientation axes for low angle misorientations (2e10�) and forhigh angle misorientations (>10�) are plotted separately. Themisorientations within the host domains are mainly low angles.The misorientation axes cluster around the X-direction and roughlycoincide with the preferred orientation of the host c-axes. Only fewhigh angle boundary segments were observed within the hostdomains. They have similar axes as low angle boundary segments.
Blocks of single host crystals are separated by microcracks andvoids with varied widths. Healed microfractures within the hostgrains are traced by very tiny fluid and solid (iron oxide) inclusions(Fig. 7a). The poles of the straight segments of fractured hostcrystals in the flanking host domains were plotted on the SEsegment of the small-circle with an opening angle of w70� andthey make angles of 35e65� with the c-axes of the host grains(Fig. 7b and c). These angles suggest that microcracks may havedeveloped mainly parallel to the direction of one of the rhombo-hedral planes. The healed microcracks within the host grains havesimilar orientations. However, the preferred orientation of thepoles to microcrack surfaces along the edge of the stereonet mayreflect the restrictedmeasurability of the u-stage. To evaluate the u-
ls. (a) Elongated subgrains in host domains. The long axes of subgrains are oriented atgles are poles to subgrain boundaries. The orientations were plot in a Schmidt stereonethe foliation trace and the mineral lineation.

Fig. 5. Orientation maps and pole figures (equal area, upper hemisphere) of the domains determined by EBSD measurements. The number of the data points corresponds to thenumber of EBSD measurements at constant step size of 10 mm. a) Each pixel is color coded and corresponds to the inverse pole figures color key (inset) of the X-direction. b) Bandcontrast map. Gray shades are related to band sharpness of the EBSD pattern. cef) Pole figures showing the CPO data for the host and new grain domains. Equal area projection isperpendicular to the foliation (trace of foliation is horizontal) and parallel to the lineation (also horizontal). Density of contoured pole figure is given as multiple of uniformdistribution (mud) of nonpolar data on an upper hemisphere. For each sample the c (0001) axes and the poles to {10-10}, {2-1-10}, {10-11}, {0-1-11} are shown.
L. Lagoeiro, P. Barbosa / Journal of Structural Geology 32 (2010) 595e604 599
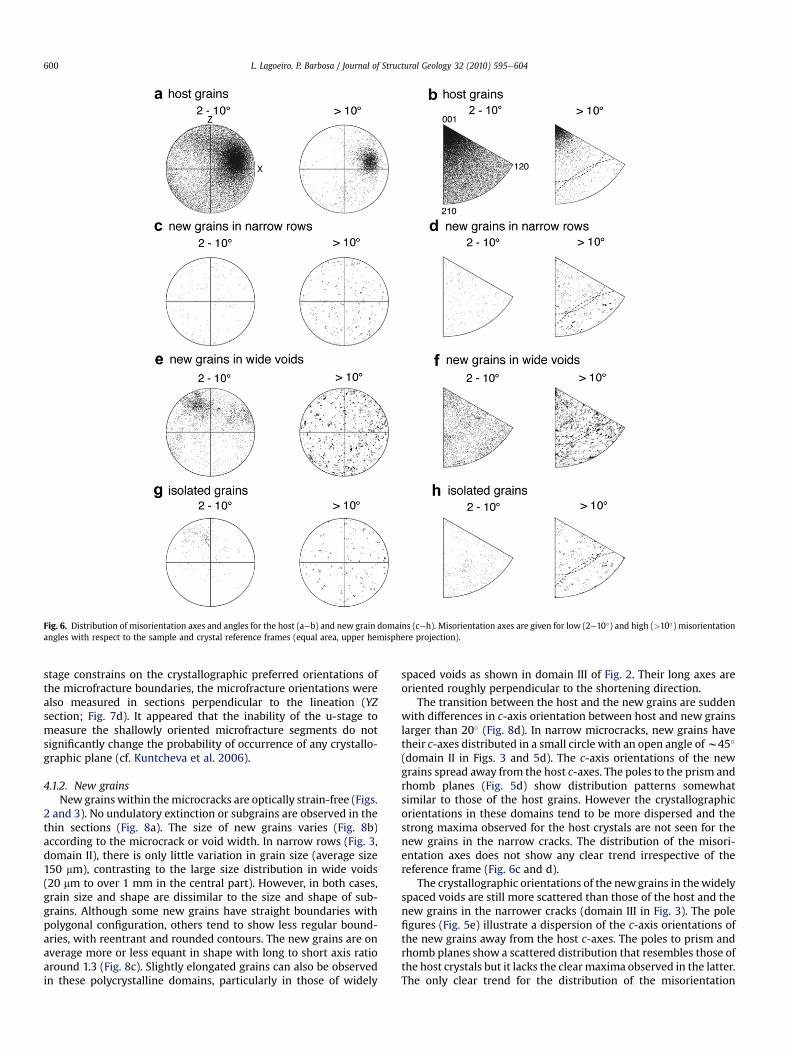
Fig. 6. Distribution of misorientation axes and angles for the host (aeb) and new grain domains (ceh). Misorientation axes are given for low (2e10�) and high (>10�) misorientationangles with respect to the sample and crystal reference frames (equal area, upper hemisphere projection).
L. Lagoeiro, P. Barbosa / Journal of Structural Geology 32 (2010) 595e604600
stage constrains on the crystallographic preferred orientations ofthe microfracture boundaries, the microfracture orientations werealso measured in sections perpendicular to the lineation (YZsection; Fig. 7d). It appeared that the inability of the u-stage tomeasure the shallowly oriented microfracture segments do notsignificantly change the probability of occurrence of any crystallo-graphic plane (cf. Kuntcheva et al. 2006).
4.1.2. New grainsNewgrains within themicrocracks are optically strain-free (Figs.
2 and 3). No undulatory extinction or subgrains are observed in thethin sections (Fig. 8a). The size of new grains varies (Fig. 8b)according to the microcrack or void width. In narrow rows (Fig. 3,domain II), there is only little variation in grain size (average size150 mm), contrasting to the large size distribution in wide voids(20 mm to over 1 mm in the central part). However, in both cases,grain size and shape are dissimilar to the size and shape of sub-grains. Although some new grains have straight boundaries withpolygonal configuration, others tend to show less regular bound-aries, with reentrant and rounded contours. The new grains are onaverage more or less equant in shape with long to short axis ratioaround 1.3 (Fig. 8c). Slightly elongated grains can also be observedin these polycrystalline domains, particularly in those of widely
spaced voids as shown in domain III of Fig. 2. Their long axes areoriented roughly perpendicular to the shortening direction.
The transition between the host and the new grains are suddenwith differences in c-axis orientation between host and new grainslarger than 20� (Fig. 8d). In narrow microcracks, new grains havetheir c-axes distributed in a small circle with an open angle ofw45�
(domain II in Figs. 3 and 5d). The c-axis orientations of the newgrains spread away from the host c-axes. The poles to the prism andrhomb planes (Fig. 5d) show distribution patterns somewhatsimilar to those of the host grains. However the crystallographicorientations in these domains tend to be more dispersed and thestrong maxima observed for the host crystals are not seen for thenew grains in the narrow cracks. The distribution of the misori-entation axes does not show any clear trend irrespective of thereference frame (Fig. 6c and d).
The crystallographic orientations of the newgrains in thewidelyspaced voids are still more scattered than those of the host and thenew grains in the narrower cracks (domain III in Fig. 3). The polefigures (Fig. 5e) illustrate a dispersion of the c-axis orientations ofthe new grains away from the host c-axes. The poles to prism andrhomb planes show a scattered distribution that resembles those ofthe host crystals but it lacks the clear maxima observed in the latter.The only clear trend for the distribution of the misorientation

Fig. 7. a) Healed microcracks in host grains are traced by tiny fluid and solid (iron oxides) inclusions. The trail of inclusions is indicated by the arrows on the micrograph. The singlearrow marked ‘c’ indicates the orientations of the host c-axes. (b) The c-axes of the host and new grains are represented, respectively, by squares and diamonds. Poles to microcrackwalls in host grains are contoured with gray shades. Equal area projection, lower hemisphere; contour intervals (C.I) ¼ 2% per 1% area. (c) The angle between host and new grain c-axes and poles to microcracks boundaries versus frequency (percentage of total number of measurements) are shown in the histogram. (d) Distribution of poles to microcrackboundaries measured in an YZ section (perpendicular to the lineation). The u-stage reference frame is oriented with Y parallel (EeW) and Z perpendicular to the foliation, and Xdown-dipping parallel to the lineation (in the center of the projection). Equal area projection, lower hemisphere; contour interval (C.I) ¼ 2% per 1% area.
L. Lagoeiro, P. Barbosa / Journal of Structural Geology 32 (2010) 595e604 601
axes in the new grains in the wide voids occurs for misorientationangles up to 10� (Fig. 6e and f). Two clusters of misorientation axesapart approximately at 90� to each other are observed for thisinterval with respect to the sample reference frame. In the crystalreference frame themisorientation axes have a slight preference forthe c-axes for misorientation angles up to 10�. For misorientationintervals larger than that there is no clear preference of themisorientation axes for any direction in the sample or in the crystalreference frame.
New grains also occur as isolated pockets within the hostdomains (Fig. 9a). Similar to the new grains in the microcracks,isolated grains also have uniform intracrystalline orientation andthus are strain-free. Their sizes vary in a wide range, from fewmicrometers to a millimeter in diameter (Fig. 9b). They are slightlyelongated with their long axes perpendicular to the incrementalshortening direction, i.e. at 40e45� to the quartz vein boundary(Fig. 9c). Again, the isolated grain size and shape are inconsistentwith those of subgrains in the host domains. The transition from thehost to isolated newgrains, although less abrupt than that shownbythe new grains in the microcracks, also have a wide range inmisorientation angles (Fig. 9d). The crystallographic orientations ofthe isolated crystals also show awide range of distribution (Fig. 5f).The c-axes show a maximum concentration close to the lineation.The poles to prism and rhomb planes show distributions somewhatsimilar to those of the new grains in narrow and wide domains.However the crystallographic orientations of the isolated crystalsspread more widely and that clear crystallographic orientationpatterns observed for the host grains are no longer discernible for
the isolated grains within the host. Themisorientation axes are alsodistributed in a scattered way regardless of the reference frame(Fig. 6g and h). Only for the misorientation intervals up to 10� thereis a slight preference for the misorientation axes as the Z-directionof the sample reference frame. In the crystal reference frame themisorientation axes do not show any preference for any crystallo-graphic direction.
5. Discussions
In the classical model for dynamically recrystallized grains bysubgrain rotation, subgrains are expected to gradually increase themisorientation to the parent grain. Eventually, subgrain wallsbecome high angle boundaries (>10�) and then become newgrains.The misorientation between parent and new grains is expected tobe low (<20�). The new grains should also have sizes compatiblewith those of subgrains. However, in our samples there isa discrepancy between size of subgrains and the new grains. Thenew grains are smaller or larger than the subgrains in the hostgrains, but rarely of the same size. The crystallographic orientationof new grains shows a progressive misorientation away from theflanking host crystal. The misorientation angles between host andnew grains can be larger than 50�. Therefore alternative modelsshould be considered to explain these large misorientationsbetween host and new grains.
Two models seem to be adequate to explain the observedmicrostructures and the crystallographic orientations, namely themicrofracture model and the precipitation model of new grain
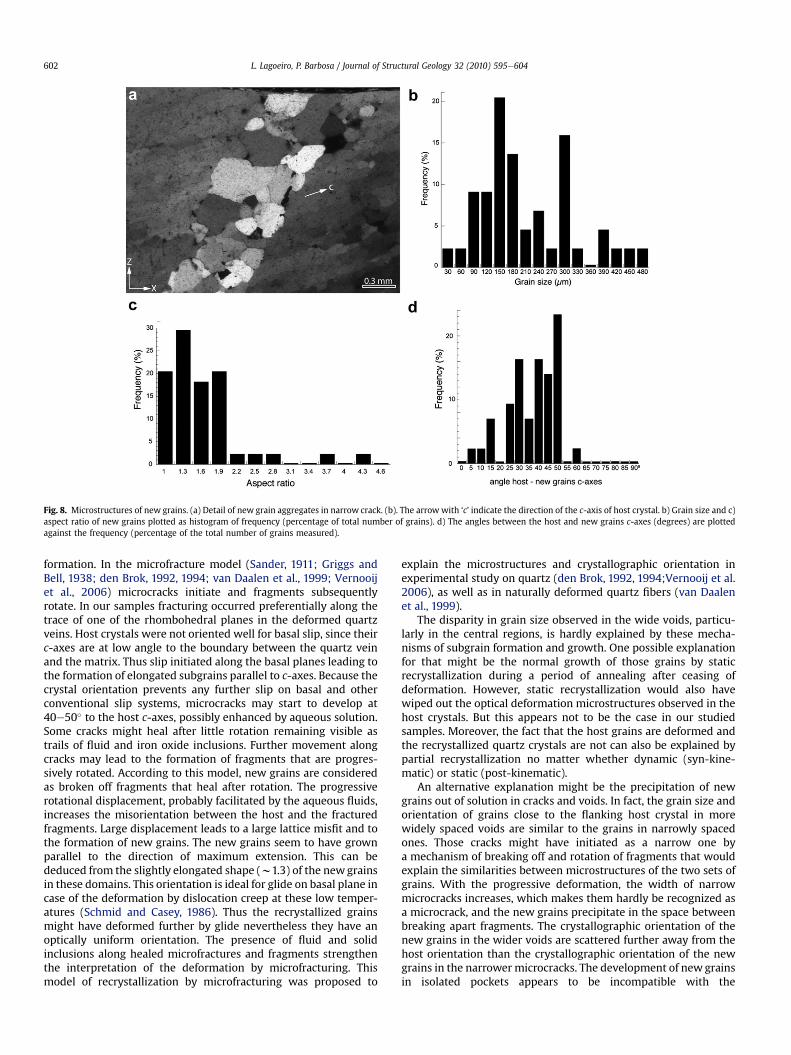
Fig. 8. Microstructures of new grains. (a) Detail of new grain aggregates in narrow crack. (b). The arrow with ‘c’ indicate the direction of the c-axis of host crystal. b) Grain size and c)aspect ratio of new grains plotted as histogram of frequency (percentage of total number of grains). d) The angles between the host and new grains c-axes (degrees) are plottedagainst the frequency (percentage of the total number of grains measured).
L. Lagoeiro, P. Barbosa / Journal of Structural Geology 32 (2010) 595e604602
formation. In the microfracture model (Sander, 1911; Griggs andBell, 1938; den Brok, 1992, 1994; van Daalen et al., 1999; Vernooijet al., 2006) microcracks initiate and fragments subsequentlyrotate. In our samples fracturing occurred preferentially along thetrace of one of the rhombohedral planes in the deformed quartzveins. Host crystals were not oriented well for basal slip, since theirc-axes are at low angle to the boundary between the quartz veinand the matrix. Thus slip initiated along the basal planes leading tothe formation of elongated subgrains parallel to c-axes. Because thecrystal orientation prevents any further slip on basal and otherconventional slip systems, microcracks may start to develop at40e50� to the host c-axes, possibly enhanced by aqueous solution.Some cracks might heal after little rotation remaining visible astrails of fluid and iron oxide inclusions. Further movement alongcracks may lead to the formation of fragments that are progres-sively rotated. According to this model, new grains are consideredas broken off fragments that heal after rotation. The progressiverotational displacement, probably facilitated by the aqueous fluids,increases the misorientation between the host and the fracturedfragments. Large displacement leads to a large lattice misfit and tothe formation of new grains. The new grains seem to have grownparallel to the direction of maximum extension. This can bededuced from the slightly elongated shape (w1.3) of the newgrainsin these domains. This orientation is ideal for glide on basal plane incase of the deformation by dislocation creep at these low temper-atures (Schmid and Casey, 1986). Thus the recrystallized grainsmight have deformed further by glide nevertheless they have anoptically uniform orientation. The presence of fluid and solidinclusions along healed microfractures and fragments strengthenthe interpretation of the deformation by microfracturing. Thismodel of recrystallization by microfracturing was proposed to
explain the microstructures and crystallographic orientation inexperimental study on quartz (den Brok, 1992, 1994;Vernooij et al.2006), as well as in naturally deformed quartz fibers (van Daalenet al., 1999).
The disparity in grain size observed in the wide voids, particu-larly in the central regions, is hardly explained by these mecha-nisms of subgrain formation and growth. One possible explanationfor that might be the normal growth of those grains by staticrecrystallization during a period of annealing after ceasing ofdeformation. However, static recrystallization would also havewiped out the optical deformation microstructures observed in thehost crystals. But this appears not to be the case in our studiedsamples. Moreover, the fact that the host grains are deformed andthe recrystallized quartz crystals are not can also be explained bypartial recrystallization no matter whether dynamic (syn-kine-matic) or static (post-kinematic).
An alternative explanation might be the precipitation of newgrains out of solution in cracks and voids. In fact, the grain size andorientation of grains close to the flanking host crystal in morewidely spaced voids are similar to the grains in narrowly spacedones. Those cracks might have initiated as a narrow one bya mechanism of breaking off and rotation of fragments that wouldexplain the similarities between microstructures of the two sets ofgrains. With the progressive deformation, the width of narrowmicrocracks increases, which makes them hardly be recognized asa microcrack, and the new grains precipitate in the space betweenbreaking apart fragments. The crystallographic orientation of thenew grains in the wider voids are scattered further away from thehost orientation than the crystallographic orientation of the newgrains in the narrower microcracks. The development of newgrainsin isolated pockets appears to be incompatible with the

Fig. 9. a) Isolated pockets with new grains within the host crystals. b) Grain size and c) aspect ratio of isolated new grains in host domains plotted as histograms of frequency(percentage of total number of measurements). d) Histogram showing the angles between c-axes of host and isolated new grains.
L. Lagoeiro, P. Barbosa / Journal of Structural Geology 32 (2010) 595e604 603
microfracturing model. The geometry of these grains and thedifference in crystallographic orientation to the host crystalssuggest that these new grains might have nucleated with crystal-lographic orientations which are not necessarily dependant on thecrystallographic orientation of host crystal. Therefore, we suggestthat these new grains might have grown by precipitation fromsolution in small voids or microcracks within the host crystals,similarly to the dissolution/precipitation experiments (den Brokand Spiers, 1991) and observations of naturally deformed quartz-ites (Hippertt and Egydio-Silva, 1996). The slightly elongated shape(w1.3) of the new grains suggests that subsequent growth musthave taken place by fluid assisted grain-boundary migration (Druryand Urai, 1990; Mancktelow and Pennacchioni 2004) relatively fastperpendicular to the direction of maximum shortening.
6. Conclusions
Our microstructural and crystallographic data allow us to drawthe following conclusions:
(1) Microfractures developed preferentially at 35e65� to the c-axisof the host crystals. After little rotation, these microcracksmight have healed and they can be now traced in the hostcrystals as trails of fluid and solid inclusions. Further micro-cracking led to the development of planar microfracturesparallel to the trace of one of the rhombohedral planes in theflanking host domains.
(2) New grains may have developed along initial microcracks byfracturing and progressive rotation of fragments. Larger grains,found in the center of wide microcracks, having contrastingcrystallographic orientation to the host and as well to the newgrain in the narrow planar fractures, might have been devel-oped by precipitation out of solution and subsequent fluidassist growth.
(3) Host grains have their c-axes oriented at low angle to the X-axisof the pole figure, an orientation of hard slip on basal planes. Incontrast, the new grains are developed with their c-axisparallel to the incremental stretching direction. That corre-sponds to an orientation of easy-slip on basal planes for newdeveloped grains. New grains with that orientation grew fasterand further deformed by glide which explains the slight elon-gation of new grains perpendicular to the incremental short-ening direction.
(4) New isolated grains might have been precipitated and grownout of solution in similar way of that proposed for the devel-opment of new grains in the central region of wide cracks andvoids.
Acknowledgements
We thank to Luiz Morales and Issamu Endo for stimulatingdiscussions and suggestions. L. Lagoeiro is grateful for financialsupport by CNPq project 200968/2005-0 and FAPEMIG CRA APQ-3166-5.02/07.

L. Lagoeiro, P. Barbosa / Journal of Structural Geology 32 (2010) 595e604604
References
Alkmim, F.F., Marshak, S., 1998. Transamazonian orogeny in the southern SãoFrancisco Craton region, Minas Gerais, Brazil: evidence for Paleoproterozoiccollision and collapse in the Quadrilátero Ferrıífero. Precambrian Research 90,29e58.
Almeida, F.F.M., 1977. O Cráton de São Francisco. Revista Brasileira de Geociências 7,349e364.
Barrett, S., 2005. Image SXM. Surface Science Research Centre.Bestmann, M., Prior, D.J., 2003. Intragranular dynamic recrystallization in naturally
deformed calcite marble: diffusion accommodated grain boundary sliding asa result of subgrain rotation recrystallization. Journal of Structural Geology 25,1597e1613.
den Brok, B., 1992. An experimental investigation into the effect of water on theductile behaviour of quartz rocks. Geologica Ultraiectina 95, 178.
den Brok, S.W.J., 1994. Development of crystal plastic like deformation micro-structures in quartz by micro-fracturing and solution/precipitation creep.Göttinger Arbeiten Zur Geologie und Paläontologie Sb1, 37e38.
den Brok, S.W.J., Spiers, C.J., 1991. Experimental evidence for water weakening ofquartzite by microcracking plus solutioneprecipitation creep. Journal of theGeological Society 148, 541e548.
Dorr II, J.V.N., 1969. Physiographic, Stratigraphic and Structural Development of theQuadrilátero Ferrıífero, Minas Gerais, Brazil. In: United States Geological SurveyProf. Paper 641-A. United States Geological Survey, pp. 1e110.
Drury, M.R., Urai, J.L., 1990. Deformation-related recrystallization processes. Tecto-nophysics 172 (3e4), 235e253.
Gleason, G.C., Tullis, J., Heidelbach, F., 1993. The role of dynamic recrystallization inthe development of lattice preferred orientations in experimentally deformedquartz aggregates. Journal of Structural Geology 15, 1145e1168.
Gordon, P., Vandermeer, R.A., 1966. Grain boundary migration. In: Margolin, H. (Ed.),Recrystallization, Grain Growth and Textures. American Society for Metals, pp.205e266.
Griggs, D.T., Bell, J.F., 1938. Experiments bearing on the orientation of quartz indeformed rocks. Geological Society of America Bulletin 49, 1723e1746.
Herz, N., 1978. Metamorphic Rocks of the Quadrilátero Ferrífero, Minas Gerais,Brazil. In: United States Geological Survey Professional Paper 641-C.
Hippertt, J.F., 1994. Microstructures and c-axis fabrics indicative of quartz dissolu-tion in sheared quartzites and phyllonites. Tectonophysics 229, 141e163.
Hippertt, J., Egydio-Silva, M., 1996. New polygonal grains formed by dissolution-redeposition in mylonitic quartzite. Journal of Structural Geology 18,1345e1352.
Jessell, M.W., 1988. Simulation of fabric development in recrystallized aggregates. 2.Example model runs. Journal of Structural Geology 10, 779e793.
Jessell, M.W., Lister, G.S., 1990. A simulation of the temperature dependence ofquartz fabrics. In: Knipe, R.J., Rutter, E.H. (Eds.), Deformation Mechanisms,
Rheology and Tectonics, 54. Geological Society Special Publication, pp.353e362.
Kruhl, J.H., Peternell, M., 2002. The equilibration of high-angle grain boundaries indynamically recrystallized quartz: the effect of crystallography and tempera-ture. Journal of Structural Geology 24, 1125e1137.
Kuntcheva, B., Kruhl, J.H., Kunze, K., 2006. Crystallographic orientations of high-angle grain boundaries in dynamically recrystallized quartz: first results. Tec-tonophysics 421, 331e346.
Lagoeiro, L., 1998. Transformation of magnetite to hematite and its influence on thedissolution of iron oxideminerals. Journal of Metamorphic Geology 16, 415e423.
Lagoeiro, L., Fueten, F., 2008. Fluid-assisted grain boundary sliding in bedding-parallel quartz veins deformed under greenschist metamophic grade. Tecto-nophysics 446, 42e50.
Mancktelow, N.S., Pennacchioni, G., 2004. The influence of grain boundary fluids onthe microstructure of quartzefeldspar mylonites. Journal of Structural Geology26 (1), 47e69.
Pires, F.R.M., 1995. Textural and mineralogical variations during metamorphism ofthe Proterozoic Itabira Iron Formation in the Quadrilátero Ferrífero, MinasGerais, Brazil. Anais da Academia Brasileira de Ciências 67 (1), 77e105.
Prior, D.J., Boyle, A.P., Brenker, F., Cheadle, M.C., Day, A., Lopez, G., Peruzzo, L.,Potts, G.J., Reddy, S., Spiess, R., Timms, N.E., Trimby, P., Wheeler, J.,Zetterstrom, L., 1999. The application of electron backscatter diffraction andorientation contrast imaging in the SEM to textural problems in rocks. Amer-ican Mineralogist 84 (11e12), 1741e1759.
Sander, B., 1911. Ueber zusammenhänge zwischen Teilbewegung und Gefüge inGesteinen. Tschermaks Mineralogische Petrografische Mitteilungen 30,281e314.
Schmid, S., Casey, M., 1986. Complete fabric analysis of some commonly observedquartz c-axis patterns. In: Hobbs, B.E., Heard, H.C. (Eds.), The Paterson VolumeGeophysical Monograph, 36, pp. 263e286.
Urai, J.L., Means, W.D., Lister, G.S., 1986. Dynamic recrystallization of minerals. AGUGeophysical Monograph 36, 161e199.
van Daalen, M., Heilbronner, R., Kunze, K., 1999. Orientation analysis of localizedshear deformation in quartz fibres at the BrittleeDuctile transition. Tectono-physics 303, 83e107.
Vernon, R.H., 1981. Optical microstructure of partially recrystallized calcite in somenaturally deformed marbles. Tectonophysics 78, 601e612.
Vernooij, M.G.C., den Brok, B., Kunze, K., 2006. Development of crystallographicpreferred orientations by nucleation and growth of new grains in experimen-tally deformed quartz single crystals. Tectonophysics 427, 35e53.
Wheeler, J., Prior, D.J., Jiang, Z., Spiess, R., Trimby, P.W., 2001. The petrologicalsignificance of misorientations between grains. Contributions to Mineralogyand Petrology 141 (1), 109e124.
White, S., 1977. Geological significance of recovery and recrystallization processes inquartz. Tectonophysics 39 (1e3), 143e170.