journal of structural biology - university of arizonamath.arizona.edu/~jwatkins/grubisic2010.pdf ·...
TRANSCRIPT

Journal of Structural Biology 169 (2010) 95–105
Contents lists available at ScienceDirect
Journal of Structural Biology
journal homepage: www.elsevier .com/locate /y jsbi
Biased coarse-grained molecular dynamics simulation approach for flexible fittingof X-ray structure into cryo electron microscopy maps
Ivan Grubisic, Maxim N. Shokhirev, Marek Orzechowski, Osamu Miyashita, Florence Tama *
Department of Biochemistry and Molecular Biophysics, The University of Arizona, 1041 E. Lowell Street, Tucson, AZ 85721, USA
a r t i c l e i n f o a b s t r a c t
Article history:Received 1 June 2009Received in revised form 1 September 2009Accepted 15 September 2009Available online 2 October 2009
Keywords:Cryo-EMFlexible fittingGo-modelTargeted MDRefinement
1047-8477/$ - see front matter � 2009 Elsevier Inc. Adoi:10.1016/j.jsb.2009.09.010
* Corresponding author.E-mail address: [email protected] (F. Tama).
Several approaches have been introduced to interpret, in terms of high-resolution structure, low-resolu-tion structural data as obtained from cryo-EM. As conformational changes are often observed in biologicalmolecules, these techniques need to take into account the flexibility of proteins. Flexibility has beendescribed in terms of movement between rigid domains and between rigid secondary structure elements,which present some limitations for studying dynamical properties. Normal mode analysis has also beenused, but is limited to medium resolution data. All-atom molecular dynamics fitting techniques are moreappropriate to fit structures into higher-resolution data as full protein flexibility is considered, but arecumbersome in terms of computational time. Here, we introduce a coarse-grained approach; a Go-modelwas used to represent biological molecules, combined with biased molecular dynamics to reproduceaccurately conformational transitions. Illustrative examples on simulated data are shown. Accurate fit-tings can be obtained for resolution ranging from 5 to 20 Å. The approach was also tested on experimentaldata of Elongation Factor G and Escherichia coli RNA polymerase, where its validity is compared to previ-ous models obtained from different techniques. This comparison demonstrates that quantitative flexibletechniques, as opposed to manual docking, need to be considered to interpret low-resolution data.
� 2009 Elsevier Inc. All rights reserved.
1. Introduction
Conformational dynamics of biological molecules are essentialfor their function. As it is often difficult to characterize differentconformational states for large biological molecules by X-ray crys-tallography, medium to low resolution techniques are often usedto study dynamical properties of biological molecules. In particu-lar, cryo electron microscopy (cryo-EM) has played a key role inidentifying conformational states of macromolecular assemblies(Saibil, 2000) such as the ribosome (Frank and Agrawal, 2000; Valleet al., 2003a,b), GroEL, RNA polymerase (Darst et al., 2002), myosin(Wendt et al., 2001) and viruses (Conway et al., 2001; Lee andJohnson, 2003) amongst others.
Because the cryo-EM technique only provides medium to low-resolution data, its interpretation often requires the fitting ofknown high-resolution structures (obtained from X-ray or NMRmeasurements) of the same biological molecule into the map. Forobjective and reproducible fitting, several algorithms have beendeveloped to replace manual fitting. In the first quantitative ap-proaches introduced, only rigid body motions of the moleculeswere considered (Wriggers et al., 1999; Volkmann and Hanein,1999; Rossmann, 2000; Rossmann et al., 2001; Jiang et al., 2001;
ll rights reserved.
Chacon and Wriggers, 2002). However, as the resolution of cryo-EM data improves, distinct conformational states can now be ob-served. Therefore, in order to interpret the experimental data at anear atomic level, approaches that include protein flexibility havebeen introduced.
The first approaches for flexible fitting considered biologicalsystems as a collection of domains that could be fitted indepen-dently as individual rigid bodies. These approaches have revealedconformational changes of several important biological systems(Volkmann et al., 2000; Wendt et al., 2001; Rawat et al., 2003;Gao et al., 2003; Gao and Frank, 2005). However, such methods relyon a subjective partitioning of the system and ignore concertedmotions between domains that occur in biological molecules dur-ing conformational changes, resulting in faulty models. Anothertype of approach to simulate the flexibility of biological moleculesis to consider coarse-grained models. Some earlier works used re-duced models where a few points would represent the biologicalmolecule to fit the cryo-EM data (Wriggers et al., 1999; Wriggersand Birmanns, 2001). However, this method might introduce ambi-guity by embedding the full atomic structure into a reduced model(a few points) to perform the flexible fitting.
A more objective representation of the dynamics of biologicalmolecule is partitioning the protein at a finer level. Such partitioncan be based on secondary structure elements (SSE) and onlymovements between those rigid SSE are considered. Such an ap-

96 I. Grubisic et al. / Journal of Structural Biology 169 (2010) 95–105
proach was implemented in optimization methods based on MonteCarlo, simulated annealing and coarse-grained models (Mearset al., 2006). In methods that use iterative comparative modelingfor fitting into cryo-EM data (Topf et al., 2005, 2006), multilevelsubdivisions of the structure from domain to secondary structureelements (Topf et al., 2008) have also been considered. Movementsof SSE have also been used in a flexible fitting technique that com-pares structural variability of domains within a given family(Velazquez-Muriel et al., 2006). Finally, partitioning can also bedetermined by identifying elements of the biological molecule thatare rigid using graph theory (Jacobs and Thorpe, 1995; Jacobs et al.,2001). Flexibility between these elements can then be used forflexible fitting (Jolley et al., 2008). In each of these methods, somelevel of protein rigidity is considered, which could impair the inter-pretation of the mechanical properties of biological molecules. Inparticular, rigid block approximations, even at the SSE level, wouldlimit the interpretations of smaller scale conformational changesthat can now be observed with higher-resolution data.
Coarse-grained representations at the non-hydrogen atom orCa level of the molecules based on elastic network model have alsobeen considered to incorporate full protein flexibility during thefitting process. Schröder et al. combined the elastic network modelwith random walk displacements and distance restraints, whichhave been successful in predicting conformational changes of theribose-binding protein (Schröder et al., 2007). Similarly, Tan et al.used an elastic network model combined with a soft sphere poten-tial, which represents interactions that are not included in the elas-tic network model, to model the high-resolution structure. A globaloptimization method using simulated annealing is used to opti-mally fit the structure into the cryo-EM map (Tan et al., 2008).Coarse-grained elastic network normal mode analysis (NMA) hasalso been adapted to flexibly fit high-resolution structures intolow-resolution data (Delarue and Dumas, 2004; Tama et al.,2004a,b, 2006; Hinsen et al., 2005; Suhre et al., 2006; Mitraet al., 2005; Falke et al., 2005; Tama et al., 2006).
Due to developments in cryo-EM techniques, resolution of cryo-EM data can now reach up to 4 Å (for symmetric structures). Suchhigher-resolution data provides a more detailed definition of thestructure and reveals smaller scale rearrangements compared toknown high-resolution structures (Stahlberg and Walz, 2008).While an elastic network model is used to study large conforma-tional changes of biological molecule it does not describe ade-quately smaller scale conformational changes well (Tama andSanejouand, 2001). Methods that maintain parts of the protein ri-gid would also limit the interpretation of such data. Therefore,methods allowing full protein flexibility during fitting are needed.
The most rigorous way to describe protein flexibility is bymolecular dynamics (MD) simulations, which is a well-establishedtechnique to investigate dynamics of biological molecule. In earlierwork, molecular dynamics simulations were used for real spacerefinement (RSRef), which considers all-atoms, and optimizes thefit to the data and the stereo-chemical properties of the molecule(Chapman, 1995; Chen et al., 2003; Fabiola and Chapman, 2005).However, this implementation assumes that certain units of themolecules, domains, are rigid.
Recently, several approaches based on MD simulation that con-sider full protein flexibility, have been introduced for flexible fit-ting. Overall, the approach of these methods is to bias the MDsimulation toward a conformation that would fit the cryo-EM data.The difference between these approaches is the form of the biasingpotential that is being used. In an approach introduced by Caufieldet al., the molecular dynamics is steered using a minimum biasingfunction (Maxwell’s demon molecular dynamics) (Caulfield andHarvey, 2007). In a different approach, atoms are steered by a po-tential map created from the cryo-EM data (Noda et al., 2006; Tra-buco et al., 2008). In order to maintain the stereochemical quality
of the structure, restraints are applied to coordinates relevant tosecondary structural elements (Trabuco et al., 2008), as such an ap-proach may lead to artifacts (Orzechowski and Tama, 2008). Biasedmolecular dynamics using correlation coefficient as the biasing po-tential have also been introduced with no restraint imposed on thesecondary structure (Orzechowski and Tama, 2008). These ap-proaches have been successful; however, due to an all-atom repre-sentation of the protein, they can be computationally expensiveespecially with large systems and because simulations are run invacuum there might be undesirable effect on protein structure.
In this paper, we describe an optimization method based onmolecular dynamics simulation with full protein flexibility butwith reduced protein representation to reduce computational costsassociated with fitting. In coarse-grained models used in moleculardynamics simulations, not all of the atoms in the system are con-sidered explicitly; rather each residue is reduced to a few points,which considerably reduces the computational complexity of thesystems and therefore speeds up the simulation time while repre-senting flexibility and stereochemistry of the protein structure(Onuchic and Wolynes, 2004; Tozzini, 2005; Tozzini and McCam-mon, 2005). Such coarse-grained models would be sufficient formodeling the conformational changes based on cryo-EM data, be-cause with such low-resolution data, it is not possible to definethe exact position of all the atoms beyond backbone atoms. Never-theless, all atoms models could be reconstructed using modelingprograms (Gront et al., 2007; Rotkiewicz and Skolnick, 2008). Gi-ven an appropriate potential for a coarse-grained model, confor-mational changes observed in experimental data could benaturally reproduced by MD simulation to construct structuralmodels consistent with experimental data. Illustrative results ofour studies on simulated EM data from several proteins with largeconformational changes are presented. We demonstrate that thisflexible fitting method yields structures that agree remarkably wellwith the error-free simulated EM maps. Finally, we discuss the re-sults of our method applied to experimental data of ElongationFactor G and RNA polymerase.
2. Methods
2.1. Biasing potential
‘‘Biased” molecular dynamics simulation, such as targeted MD(Schlitter et al., 1994; Ma et al., 2000) and Steered Molecular MD(Isralewitz et al., 2001), in which external forces are added to guidethe system into a certain region of the conformational space, havebeen successfully employed to study important conformationaltransitions of biological systems (Krammer et al., 1999; Sanbonma-tsu et al., 2005).
Here we employ classical molecular dynamics technique with amodified force field potential V which is calculated as a sum of theclassical potential from the standard molecular dynamics forcefield Vff and a new effective potential VFit to fit high-resolutionstructure into low-resolution data:
V ¼ Vff þ VFit
The additional effective potential is calculated according to the fol-lowing equation:
VFit ¼ kð1� c:c:Þ ð1Þ
The c.c. represents the correlation coefficient that measures thesimilarity (overlap) of a target cryo-EM map to a cryo-EM map syn-thetically generated from the X-ray structure being fitted, as de-fined in the following way:

I. Grubisic et al. / Journal of Structural Biology 169 (2010) 95–105 97
c:c: ¼P
ijkqexpði; j; kÞqsimði; j; kÞffiffiffiffiffiffiffiffiffiffiffiffiffiffiffiffiffiffiffiffiffiffiffiffiffiffiffiffiffiffiffiffiffiffiffiffiffiffiffiffiffiffiffiffiffiffiffiffiffiffiffiffiffiffiffiffiffiffiffiffiffiffiffiffiffiffiPijkqexpði; j; kÞ2
Pijkqsimði; j; kÞ2
q
where qexpði; j; kÞ and qsimði; j; kÞ represent experimental and syn-thetically simulated density of voxel (i,j,k). k in Eq. (1) is a constantparameter that regulates the magnitude of the effective potentialand needs to be calibrated. This constant is the only arbitraryparameter introduced. In the Discussion section, we discuss theappropriate value of k that should be used to obtain optimal resultsfrom the fitting. While the described biasing potential is not theonly choice, other biasing potentials that are simply proportionalto the density (Noda et al., 2006; Trabuco et al., 2008) (C.C. Jolleyand M.F. Thorpe, personal communication) could lead to artifacts,therefore VFit was preferred (Orzechowski and Tama, 2008).
2.2. Go-model
In order to reduce computational costs associated with an allatom description of the protein in the MD simulation and repro-duce full protein flexibility, a coarse-grained model was used forflexible fitting. While several coarse-grained models have beendeveloped, we will employ a well-established one: Go-model(Taketomi et al., 1975; Ueda et al., 1978), which has been exten-sively used to study protein folding (Tozzini, 2005; Clementiet al., 2000) and more recently to describe conformational transi-tions of biological molecules (Best et al., 2005; Koga and Takada,2006; Okazaki et al., 2006; Whitford et al., 2007). A Go-potentialtakes into account only native interactions, and each of these inter-actions enters into the energy balance with the same weight. Res-idues in the proteins are represented as single beads centered attheir Ca positions (Clementi et al., 2000). Adjacent beads are con-nected into a polymer chain by bond and angle interactions, whilethe geometry of the native state is encoded in the dihedral anglepotential and a non-local bead–bead potential. Because of thebond, angle and dihedral terms between consecutives Ca good ste-reochemistry can be conserved. The parameters for the potentialVff used in this study were taken from Clementi et al. (Clementiet al., 2000) (see supplementary information).
2.3. Creating the cryo-EM map
Synthetic maps are created by placing three-dimensionalGaussian function on each atom and integrating these functionsfor every atom in each of the voxels: for a given set of atomic coor-dinates (xn, yn, zn):
qsimði; j; kÞ ¼XN
n¼1
ZVijk
dxdydz gðx; y; z; xn; yn; znÞ
where n denotes nth atom from a set of N atoms and (i,j,k) denotes agiven voxel and gðx; y; z; xn; yn; znÞ is the three-dimensional Gaussianfunction of the following formula:
gðx; y; z; xn; yn; znÞ ¼ exp � 32r2 ðx� xnÞ2 þ ðy� ynÞ2 þ ðz� znÞ2
n o� �
where r is a resolution parameter. The resolution of a syntheticmap is equal to 2r (Wriggers and Birmanns, 2001). We note thatthe resolution parameter is set as a rough estimate and it maynot exactly coincide with the resolution reported by the experimen-tal data. This is because the resolution of the experimental data isoften defined as a Fourier filter. However, previous studies withcoarse-grained models have shown that the precise details of thesimulated map do not affect the fitting performance (Wriggersand Birmanns, 2001; Tama et al., 2004a,b).
2.4. MD simulation
We developed our own software to run biased moleculardynamics simulation using a Go-model. Temperature was main-tained using the Berendsen algorithm to couple the system to athermal bath. Biasing forces to fit the structure into the cryo-EMmap were implemented following Orzechowski and Tama (2008).
2.5. Determining the folding temperature
To determine the folding temperature of the protein structure,several simulations, without the biasing potential for fitting intothe cryo-EM map were run at different temperature. For assessingthe degree of nativeness of the structures, the fraction of nativecontacts (Q-value) can be estimated for each structure sampledduring the simulation.
Q ¼ current number of contactstotal native contacts
The total native contacts are calculated for the initial foldedprotein. If the Q value is equal to one, then the structure is fullyfolded since all the native contact are present. On the other hand,if the Q-value is close to 0, all the native contacts have disappearedindicating that the protein is mostly unfolded or non-native like.Several simulations with gradual increase (increment of 10) oftemperature were performed and we estimated the temperatureat which the protein is no longer stable. For the fitting process,we used temperature much below the folding temperature ensur-ing that the protein will remain folded during the simulation.
Native contacts in the starting structure were defined as follow:Two residues have contact when at least one non-hydrogen atomof the ith amino acid is within 6.5 Å of any non-hydrogen atomof the jth amino acid (Okazaki et al., 2006).
2.6. Rigid-body fitting
We employed the Situs package (Wriggers et al., 1999) to per-form initial rigid-body fitting of all-atom structures to experimen-tal cryo-EM maps of the Elongation Factor G and the RNApolymerase. In this work we used 10 codebook vectors to representa PDB structure and a cryo-EM map. The highest ranked model wasused to start the flexible fitting.
3. Results
We have first tested our procedure on simulated EM data. Sev-eral proteins have been used in the past for developing flexible fit-ting approaches (Tama et al., 2004a,b; Velazquez-Muriel et al.,2006; Jolley et al., 2008; Topf et al., 2008; Trabuco et al., 2008).Here we used a subset of proteins that have been used in someof these studies with a variety of sizes. The proteins that we chooseundergo a conformational change that has been observed experi-mentally and high-resolution structures of the two states are avail-able. The proteins that were used for the simulations are listed inTable 1 along with the PDB codes for the structure that is being fit-ted (initial) and for the structure that is being used to simulate thecryo-EM data (target). The initial RMSD between these two struc-tures is also shown.
A synthetic density map was constructed by convolution with aGaussian kernel of r = 2.5, 4, 5 7.5, 10 for each structure. Severalresolutions were considered, 5, 8, 10, 15 and 20 Å, as this methodis intended to target both the high-end resolution spectrum ofcryo-EM data and the lower end. The fitting was done from theX-ray structures into the calculated error-free low-resolutionmaps. During the fitting, simulated maps from the deformed struc-

Table 1A list of the studied proteins.
Protein Initial PDB Target PDB Number of residues RMSD (Å)1
Adenylate kinase LAKE 4AKE 214 7.2Lactoferrin 1LFG 1LFH 691 6.4Elongation Factor 2 1N0V 1N0U 819 14.5Ca2+-ATPase 1IWO 1SU4 994 14.0Acetyl CoA Synthase 10AO (Chain C) 10A0 (Chain D) 728 7.0Transglutaminase 1KV3 2Q3Z 651 28.8Elongation Factor G 1FNM N/A 655 /E. coli RNA Polymerase 1HQM N/A 2650 /
1 The initial RMSD value (Ca atoms) between the two conformations was calculated by aligning the two PDB files in VMD.
Table 3The correlation coefficient between maps generated from a Ca representation andgenerated from full atom representation.
Resolution for simulated maps generatedfrom Ca atom structure
Resolution for simulated mapsgenerated from full atomstructure
5 8 10 15 20
5 0.91 0.86 0.82 0.75 0.698 0.96 0.97 0.95 0.89 0.85
10 0.95 0.98 0.98 0.95 0.9115 0.90 0.97 0.99 0.99 0.9820 0.84 0.92 0.95 0.99 0.99
Resolution in Å.
98 I. Grubisic et al. / Journal of Structural Biology 169 (2010) 95–105
tures were created with the same resolution as the target map inorder to evaluate the c.c.
The purpose of the method presented here is to fit the X-raystructure into a raw experimental (in this case simulated) EMmap of a different conformation of the same molecule. To examinethe fitness between the atomic structure and the experimentalmap during the simulation we examine the c.c. between the struc-ture and the target EM map. In the following we also examine theRoot Mean Square Deviation (RMSD) between the deformed struc-ture and the structure from which the target EM map was created.Ideally, when the c.c. reaches a maximum, the RMSD should reacha minimum. However, two different structures with differentRMSD can have the same c.c., because detailed information of theatomic coordinates is lost in the EM map and the EM map andatomic coordinates are not simply related by a linear transforma-tion. Thus to characterize the performance of our method weexamine both values.
In order to perform accurate fitting, flexible fitting techniquesshould be able to tolerate noise in the map. Jolley et al. have ana-lyzed the effect of noise on the result of fitting with a correlationcoefficient optimization (Jolley et al., 2008). Though high level ofnoise S/N = 1 is detrimental for fitting, with higher S/N > 2, little im-pact is observed. Similarly, Schroder et al. have compared fittingwith and without noise and have observed that their method is ro-bust against noise (Schröder et al., 2007). We have also tested theapplicability of our approach to experimental data, which containsnoise. The Elongation Factor G (EF-G), a 844 residue protein, andthe RNA polymerase were taken as examples.
3.1. Folding temperature
The folding temperature varies from one protein to another. Inmost Go-model studies, the primary aim is to study protein fold-ing. Therefore simulations are run at the folding temperature in or-der to observe multiple folding/unfolding events (Clementi et al.,2000). In our simulation, the proteins should not need to unfold;instead the protein needs to undergo its conformational changewhile remaining folded. We have measured the folding tempera-ture for each protein. The folding temperature for proteins of var-ious sizes is different because of the nature of the Go-model butoverall in the same range (see Table 2). Running simulations at a
Table 2The folding temperatures of the proteins.
Protein Folding Temperature
1AKE 8001N0V 9601LFG 9601IW0 9401KV3 92010A0.C 1040
Fig. 1. Acetyl CoA synthase’s simulation results. RMSD (open symbols) andcorrelation coefficient (solid symbols) at T = 500 using as a function of MD steps(a) a single force iteration of k = 1000. (b) Using a single force iteration of k = 10,000.Several resolutions have been tested 5 Å (s), 8 Å (h), 10Å (e), 15Å (D) and 20 Å (r).

I. Grubisic et al. / Journal of Structural Biology 169 (2010) 95–105 99
temperature that is too close to the folding temperature runs therisk of unfolding the protein. Very low temperatures on the otherhand will freeze the protein. The temperature lacks specific unitsbecause the simulation has not been calibrated to the Kelvin scalebut we found that a T = 500 with the definition of the potential asobtained from Clementi et al. (2000) worked well for all our testsystems.
3.2. Validity of coarse graining
In our approach, a coarse-grained representation is used to rep-resent the biological molecule. To ensure the validity of our ap-proach, we computed the correlation coefficient between a givensimulated cryo-EM map using an all-atom structure against severalmaps generated using a Ca atom model and with different resolu-tions. Results for the case of adenylate kinase (PDB: 4AKE) areshown Table 3. For all of the target resolutions, the map obtainedfrom a Ca representation correlates well with the full atom mapat the same resolution. Therefore using a coarse-grained modelseems appropriate and it has been shown to be successful in sev-eral cases (Wriggers et al., 2000; Tama et al., 2004a,b).
3.3. Simulated data
In our implementation, the weight k is a parameter to adjusthow strongly the system is biased to fit into the density. k needsto be calibrated so that sampling of conformations is enhancedwhile maintaining the structural integrity of the protein. Therefore,it is necessary to determine what force constant or sequence offorce constants would be capable of fitting the initial structure tothe target map. Simulations with weights k ranging from 1000 to100,000 were run for each protein.
Initially a force constant k = 1000 was used. Fig. 1a shows this inthe case of acetyl CoA synthase (PDB: 1OAO Chain C). At a 5 Å res-olution, the RMSD decreased from 7 Å to close to 1 Å; however, forlower resolution, this force constant is only capable of causing the
Table 4The best correlation coefficient and corresponding RMSD value for Go-modelsimulations that used a single force iteration at k = 1000 and k = 10,000.
PDB Resolution (Å) Best c.c. RMSD (Å) Best c.c. RMSD (Å)
k = 1000 k = 10000
1AKE 5 0.87 1.4 0.91 1.68 0.95 1.8 0.97 5.0
10 0.96 2.0 0.98 4.315 0.98 2.5 0.99 5.120 0.99 3.0 0.99 1.8
1N0V 5 0.87 1.4 0.89 5.08 0.94 1.7 0.97 4.5
10 0.96 1.9 0.98 4.915 0.96 5.2 0.99 5.720 0.97 5.8 0.99 6.8
1LFG 5 0.87 1.4 0.90 1.68 0.89 4.5 0.96 1.1
10 0.94 3.6 0.97 9.115 0.97 4.3 0.98 1.920 0.98 4.7 0.99 2.0
1IWO 5 0.87 14.0 0.85 8.38 0.95 13.2 0.95 7.1
10 0.96 8.9 0.96 8.115 0.98 9.8 0.99 3.020 0.99 11.4 0.99 3.6
10AO.C 5 0.87 1.1 0.89 0.88 0.94 1.4 0.96 1.1
10 0.96 2.1 0.98 1.215 0.97 4.8 0.99 1.420 0.92 4.9 0.95 1.4
initial structure to oscillate around its initial position. Using astronger force constant, k = 10,000, as illustrated in Fig. 1b wascapable of reducing the RMSD for all resolutions. The RMSDapproximately decreases to 1 Å for the 5 Å resolution map. For low-er resolution map such as 20 Å, the RMSD decreases up to �1.8 Å.In such cases, the forces resulting from the gradient of the c.c. arestrong enough to overcome the energetic barriers separating thetwo structures. With a weight of 1000, generally the potential fromthe correlation coefficient is not strong enough which leads to apoor fit especially for lower (15 and 20 Å) resolution data (see Ta-ble 4).
However, as also shown in Table 4, while a higher 10,000weight leads to more successful simulations overall (Lactoferrin,Ca2+-ATPase, AcetylCoA Synthase), in several cases, we observedstill high RMSD values. In the case of the Elongation Factor 2, high-er RMSD values are observed for the highest resolution maps (5–10Å). For Ca2+-ATPase (1IWO) (see Fig. 2a) while the RMSD value ini-tially decreases to less than 10 Å, for the highest resolution map,the RMSD seems to remain trapped at higher final values (�8 Å),i.e. in a local minimum, than their lower resolution counterparts,which converges lower final RMSD values (see Table 4).
We originally anticipated that the force constant might bedependant on the size of the protein. However, it appears thatthe force constant cannot be calibrated simply based on the proteinsize and resolution of the map. For example, the fitting of 1OAO toa 5 Å resolution map is the only case that k = 1000 works, however
Fig. 2. Ca2+-ATPase’s simulation results. RMSD (open symbols) and correlationcoefficient (solid symbols) at T = 500 using as a function of MD steps (a) a singleforce iteration of k = 10,000. (b) A three-force iterations: k = 1000 for the first 5000steps, k = 10,000 for steps 5000–10,000 and k = 100,000 for steps 10,000–15,000.Several resolutions have been tested 5 Å (s), 8 Å (h), 10 Å (e), 15 Å (D) and 20 Å(r).

Fig. 3. Adenylate kinase’s simulation results. RMSD (open symbols) and correlationcoefficient (solid symbols) at T = 500 using as a function of MD steps when using athree-force iterations: k = 1000 for the first 5000 steps, k = 10,000 for steps 5000–10,000 and k = 100,000 for steps 10,000–15,000. Several resolutions have beentested 5Å (s), 8 Å (h), 10 Å (e), 15 Å (D) and 20 Å (r).
100 I. Grubisic et al. / Journal of Structural Biology 169 (2010) 95–105
1OAO is not the smallest protein we tested. We speculate that thebest force constant would depend on how potential energy fromGo-model changes from the initial conformation to the fitted mod-el as well as the change in the correlation coefficient during the fit-ting. However, those values cannot be estimated beforehand, andthus it may be difficult to know the best force constant from theinitial structure and the target map.
Our aim is to develop a program that is applicable to any systemand any resolution therefore to establish general conditions to ob-tain low RMSD values, an iterative procedure was implemented.The simulation starts with a k = 1000 force constant for 5000 steps.At a force constant of k = 1000 it can be seen in Fig. 2b that thereare only relatively small changes, the protein slightly alter its con-formation to fit the experimental data. The simulation was thencontinued from the final position and velocity vectors with ak = 10,000 force constant where it began to move towards the tar-get structure causing the RMSD to decrease. Using this iterativeprocedure, low RMSD values are consistently observed for bothhigh and low-resolution maps (see Table 5) and the final RMSDswere lower for the higher resolution maps, which is exactly whatwould be expected.
The k = 10,000 force constant still allows for some oscillationsand it was of interest to see if we could minimize them and in turnget an even better final structure. A larger force constant,k = 100,000, was then implemented for an additional 5000 stepsand that was able to get minimize the RMSD even further (see Ta-ble 5) in particular for the lowest resolution maps (15 and 20 Å)(see Fig. 2b for the Ca2+-ATPase). In each of the cases, the finalstructures agree well with the simulated cryo-EM map as indicatedby a high c.c and are very close to the conformation from whichthose simulated maps were derived.
Table 5Results for multi step fitting with different force constants.
PDB Resolution (Å) Best c.c. RMSD (Å) Best c.c. RMSD (Å)
Three-forcesa Two-forcesb
1AKE 5 0.93 0.9 0.91 0.98 0.99 3.9 0.97 1.5
10 0.99 3.4 0.98 1.815 1.00 1.9 1.00 1.720 1.00 1.7 1.00 1.9
1N0V 5 0.92 3.3 0.89 3.38 0.97 1.1 0.96 1.2
10 0.99 1.2 0.98 1.315 1.00 1.4 0.99 1.520 1.00 1.4 1.00 1.9
1LFG 5 0.92 0.7 0.90 0.98 0.98 1.2 0.96 1.1
10 0.99 1.4 0.98 1.315 1.00 1.2 0.99 1.420 1.00 1.3 1.00 1.7
1IW0 5 0.92 2.0 0.89 2.28 0.97 2.1 0.96 2.2
10 0.99 2.1 0.97 2.815 1.00 2.5 0.99 3.020 1.00 2.6 0.99 3.9
10A0.C 5 0.92 0.7 0.90 0.88 0.97 1.1 0.96 1.0
10 0.99 1.1 0.98 1.215 1.00 1.1 0.99 1.320 0.95 1.1 0.95 1.4
EFGc 10.8 0.94 11.2 0.88 8.6
RNAPc 15 0.96 10.8 0.89 5.1
a Three-force iteration (k = 1000, k = 10,000 and k = 100,000).b Two-force iteration (k = 1000 and k = 10,000).c Experimental data, therefore the RMSD is calculated relative to the initial X-ray
structure.
In some cases however, the minimization only improved for afew of the resolutions. In particular for adenylate kinase, additionalfitting with k = 100,000 worsens the final model for two cases (seeFig. 3). One noticeable difference between adenylate kinase and theother proteins is its small size. It has 214 residues versus 691 res-idues the next smallest tested protein. The large k = 100,000 forceconstant that is applied for the last 5000 steps of the simulation iscapable of distorting the smaller proteins out of a native structureto force fitting into the density. Since the correlation coefficientcontinued to increase, and the RMSD failed to decrease, this is a sit-uation where over-fitting occurred.
Of the proteins tested with our approach (see Table 1) transglu-taminase (PDB: 1KV3) is the only case for which the fitting proce-dure failed using simulated data. The initial RMSD was 28 Å andthe final RMSD was 30 Å, which indicates that the refinementdid not converge toward a structure in agreement with the targeteven though an increase in the c.c. was observed.
Transglutaminase has four domains. Fig. 4a and b show a traceof the initial and fitted structure with two domains of interest. Thearrangements of these two domains in the target structure are alsoshown. These structures were superimposed to minimize theRMSD of the entire system. While the structure appears to fit wellinside the simulated cryo-EM map (Fig 4c), the final RMSD value ishigh due to an incorrect domain placement. Fig. 4a and b illustratethat the domain III moved into its proximal area of domain IV. Thefinal structure is in fact a energy minimum, i.e. the c.c. is improvedbut with atoms in regions where they should not be.
For this particular case, our approach fails to predict the correctstructure. Methods using a potential map created from the cryo-EM data (Noda et al., 2006; Trabuco et al., 2008) would lead tothe same results due to the limitations associated with this poten-tial (Orzechowski and Tama, 2008). It is also reasonable to thinkthat the NMA based approach would also fail in such cases. Meth-ods based on domains structure variability within a given familymight provide a better avenue for such cases (Velazquez-Murielet al., 2006); however, enough structural information across thefamily would be needed for the approach to be successful. It is alsoimportant to note that the results in Fig. 4 were simulated atT = 700. At T = 500, domains III and IV oscillate around their initialpositions without any significant conformational change. Thisseems to indicate that the examination of temperature dependenceon the fitting results would be able to distinguish models with suchpotential problems.

Fig. 5. E. coli RNA Polymerase’s Ca backbone fit into the cryo-EM map (a) initial(PDB:1HQM). (b) Model produced by the two-force iteration at T = 500.
Fig. 4. Transglutaminase is composed of four domains. (a) Domains III and IV forthe target PDB structure from which the simulated EM map was created are shownin red and blue. The domains in the initial conformation are superimposed (pinkand cyan) by minimizing the RMSD of the whole system (4 domains). (b) DomainsIII and IV in the final structure (pink and cyan) after the Go-model simulation atT = 700 and an 8 Å resolution and using three-force iterations is superimposed tothe target structure. (c) The final Ca backbone of the whole transglutaminase(domains I and II are shown in ice-blue) as it fits into the cryo-EM map simulatedfrom the target structure after Go-model simulation.
I. Grubisic et al. / Journal of Structural Biology 169 (2010) 95–105 101
3.4. Fitting to experimental data
We have also applied our approach to experimental data, thecryo-EM map of the Elongation Factor G bound to the ribosomeat 11.8 Å resolution (Valle et al., 2003a,b) and the cryo-EM mapof the Escherichia coli RNA polymerase at a 15 Å resolution (Darstet al., 2002).
EF-G has been studied with NMFF (Tama et al., 2004a,b), i.e.normal mode based refinement, and by all-atom moleculardynamics simulations (Orzechowski and Tama, 2008) as well as amethod based on using structural variability of protein domainswithin a same family (Velazquez-Muriel et al., 2006). The RNApolymerase has been studied using coarse-grained fitting using Si-tus and by NMFF as well (Darst et al., 2002; Tama et al., 2004a,b).Since the high-resolution structure corresponding to the cryo-EMmap is not available, one can compare our modeled structure tothe ones that have been obtained by other approaches.
The structure of an ‘‘open’’ form of the E. coli core RNAP hasbeen determined at a 15 Å resolution using single-particle cryo-
EM techniques (Darst et al., 2002). Because of the high similarityin sequence between the E. coli and Thermus aquaticus (Taq) coreRNAP, it is possible to annotate the low-resolution map from theE. coli system with the high-resolution structure of Taq (Campbellet al., 2001; Zhang et al., 1999). Previous studies found that a large
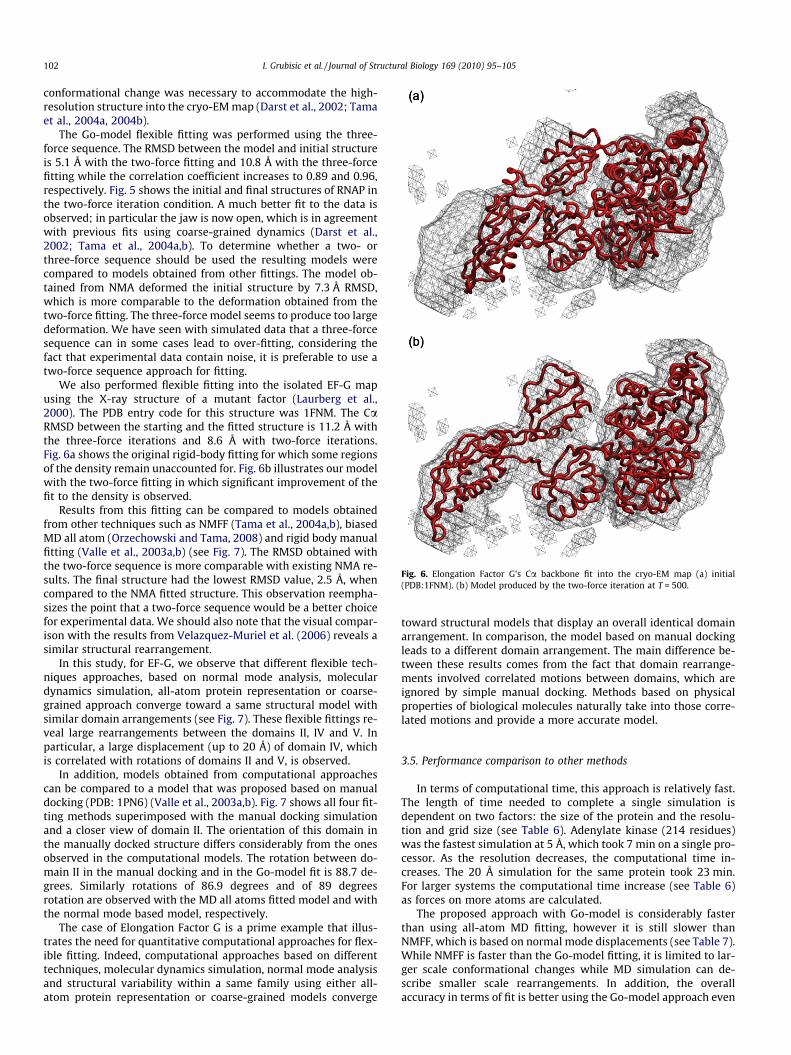
Fig. 6. Elongation Factor G’s Ca backbone fit into the cryo-EM map (a) initial(PDB:1FNM). (b) Model produced by the two-force iteration at T = 500.
102 I. Grubisic et al. / Journal of Structural Biology 169 (2010) 95–105
conformational change was necessary to accommodate the high-resolution structure into the cryo-EM map (Darst et al., 2002; Tamaet al., 2004a, 2004b).
The Go-model flexible fitting was performed using the three-force sequence. The RMSD between the model and initial structureis 5.1 Å with the two-force fitting and 10.8 Å with the three-forcefitting while the correlation coefficient increases to 0.89 and 0.96,respectively. Fig. 5 shows the initial and final structures of RNAP inthe two-force iteration condition. A much better fit to the data isobserved; in particular the jaw is now open, which is in agreementwith previous fits using coarse-grained dynamics (Darst et al.,2002; Tama et al., 2004a,b). To determine whether a two- orthree-force sequence should be used the resulting models werecompared to models obtained from other fittings. The model ob-tained from NMA deformed the initial structure by 7.3 Å RMSD,which is more comparable to the deformation obtained from thetwo-force fitting. The three-force model seems to produce too largedeformation. We have seen with simulated data that a three-forcesequence can in some cases lead to over-fitting, considering thefact that experimental data contain noise, it is preferable to use atwo-force sequence approach for fitting.
We also performed flexible fitting into the isolated EF-G mapusing the X-ray structure of a mutant factor (Laurberg et al.,2000). The PDB entry code for this structure was 1FNM. The CaRMSD between the starting and the fitted structure is 11.2 Å withthe three-force iterations and 8.6 Å with two-force iterations.Fig. 6a shows the original rigid-body fitting for which some regionsof the density remain unaccounted for. Fig. 6b illustrates our modelwith the two-force fitting in which significant improvement of thefit to the density is observed.
Results from this fitting can be compared to models obtainedfrom other techniques such as NMFF (Tama et al., 2004a,b), biasedMD all atom (Orzechowski and Tama, 2008) and rigid body manualfitting (Valle et al., 2003a,b) (see Fig. 7). The RMSD obtained withthe two-force sequence is more comparable with existing NMA re-sults. The final structure had the lowest RMSD value, 2.5 Å, whencompared to the NMA fitted structure. This observation reempha-sizes the point that a two-force sequence would be a better choicefor experimental data. We should also note that the visual compar-ison with the results from Velazquez-Muriel et al. (2006) reveals asimilar structural rearrangement.
In this study, for EF-G, we observe that different flexible tech-niques approaches, based on normal mode analysis, moleculardynamics simulation, all-atom protein representation or coarse-grained approach converge toward a same structural model withsimilar domain arrangements (see Fig. 7). These flexible fittings re-veal large rearrangements between the domains II, IV and V. Inparticular, a large displacement (up to 20 Å) of domain IV, whichis correlated with rotations of domains II and V, is observed.
In addition, models obtained from computational approachescan be compared to a model that was proposed based on manualdocking (PDB: 1PN6) (Valle et al., 2003a,b). Fig. 7 shows all four fit-ting methods superimposed with the manual docking simulationand a closer view of domain II. The orientation of this domain inthe manually docked structure differs considerably from the onesobserved in the computational models. The rotation between do-main II in the manual docking and in the Go-model fit is 88.7 de-grees. Similarly rotations of 86.9 degrees and of 89 degreesrotation are observed with the MD all atoms fitted model and withthe normal mode based model, respectively.
The case of Elongation Factor G is a prime example that illus-trates the need for quantitative computational approaches for flex-ible fitting. Indeed, computational approaches based on differenttechniques, molecular dynamics simulation, normal mode analysisand structural variability within a same family using either all-atom protein representation or coarse-grained models converge
toward structural models that display an overall identical domainarrangement. In comparison, the model based on manual dockingleads to a different domain arrangement. The main difference be-tween these results comes from the fact that domain rearrange-ments involved correlated motions between domains, which areignored by simple manual docking. Methods based on physicalproperties of biological molecules naturally take into those corre-lated motions and provide a more accurate model.
3.5. Performance comparison to other methods
In terms of computational time, this approach is relatively fast.The length of time needed to complete a single simulation isdependent on two factors: the size of the protein and the resolu-tion and grid size (see Table 6). Adenylate kinase (214 residues)was the fastest simulation at 5 Å, which took 7 min on a single pro-cessor. As the resolution decreases, the computational time in-creases. The 20 Å simulation for the same protein took 23 min.For larger systems the computational time increase (see Table 6)as forces on more atoms are calculated.
The proposed approach with Go-model is considerably fasterthan using all-atom MD fitting, however it is still slower thanNMFF, which is based on normal mode displacements (see Table 7).While NMFF is faster than the Go-model fitting, it is limited to lar-ger scale conformational changes while MD simulation can de-scribe smaller scale rearrangements. In addition, the overallaccuracy in terms of fit is better using the Go-model approach even

Table 6Computational time as a function of the resolution.
Resolution Computational time (min)
Adenylate kinase(214 residues)
Ca2+-ATPase(994 residues)
RNA polymerase*
(2650 residues)
5 7 45 N/A10 9 57 N/A15 9 85 20120 23 122 N/A
* Experimental data.
Fig. 7. A comparison multiple final structures for Elongation Factor G. The red is the Go-model MD simulation as it is fit to the experimental data using two-force iterationsGo-model approach, colored cyan. The all-atom MD simulation is colored ice blue, the NMA fitted EF-G is colored silver and the manual docked structure (PDB: 1PN6) isshown in red. The domain of interest is zoomed in on and rotated to show the rotation of the manually docked structure with respect to the others. It is clear that the positionof the two alpha helices is different between the manual and computational model. (For interpretation of the references to color in this figure legend, the reader is referred tothe web version of this paper.)
Table 8NMFF versus Go-model flexible fitting.
Final RMSD (Å)
NMFF Go-model
1AKE (closed) ? 4AKE (open) 2.9 1.54AKE (open) ? 1AKE (closed) 1.2 1.3
*Initial RMSD = 7.2 Å.
Table 7Flexible fitting for adenylate kinase at 8 Å resolution.
NMFF Go-model All-atom MD
Computational time (min) 3 7 156
I. Grubisic et al. / Journal of Structural Biology 169 (2010) 95–105 103
at larger scale. In Table 8, we are comparing the fitting for simu-lated data using the adenylate kinase. In such an example, bothtransitions (open to close and close to open) were modeled usingeither NMFF or Go-model fitting. It is clear that in the case of theclose to open conformation NMFF is less accurate than the Go-model approach. This is not surprising as it has been shown thatconformational changes are better described using NMA startingfrom the open conformation that the closed conformation. Tanet al. have also noted a similar behavior (Tan et al., 2008). Weshould also note that even though native contacts between do-
mains are present in the Go-model it does not preclude the proteinfrom undergoing a close to open transition due to its potentialform. Therefore in such particular case, starting from a closed con-formation, the Go-model is a better approach to fit the data thanNMFF.
4. Conclusions
We introduced a method for the flexible fitting of high-resolu-tion structures into low-resolution electron density maps fromcryo-EM based on molecular dynamic simulations and coarse-grained representation, Go-model, of the molecule. The onlyadjustable parameter is the force constant to control the strengthof the biasing potential. In the proposed algorithm, through testing,we found that a two step iterative procedure with k = 1000 and10,000 produce good results for most systems, including experi-mental data. This method can be applied to higher-resolutioncryo-EM maps for which more structural details are available (8Å and higher) but it is also applicable to lower resolution data.The results on simulated data have shown that it is a robust algo-rithm because of its ability to work on a multitude of systems withthe same parameters and a very short computational time. Resultsfrom this method are in agreement with previous works using dif-ferent approaches.
We show also its success in predicting conformationalchanges from experimental data. The models obtained for theRNA polymerase and EF-G are in agreement with other compu-tational studies. This paper also demonstrates the necessity toemploy computational tools to interpret experimental data.Comparisons of several computational models with a manualbuild model reveal significant difference. Indeed, in generalcomputational tools provide robust ways to flexibly fit proteinswhile maintaining the overall architectural integrity. Due to theuse of MD simulation or normal mode analysis for fitting withan all-atom or coarse-grained representation of the protein, onlyfeasible deformations are possible, i.e. correlated motions be-tween distant parts of the biological system are taken into ac-count. Such correlated motions need to be taken into accountfor accurate flexible fitting.

104 I. Grubisic et al. / Journal of Structural Biology 169 (2010) 95–105
Acknowledgments
We acknowledge Professors S. Darst and J. Frank for sharingtheir experimental data with us. Financial support from NationalScience Foundation Grant No. 0744732 (Molecular Cellular andBiosciences) is greatly appreciated.
Appendix A. Supplementary data
Supplementary data associated with this article can be found, inthe online version, at doi:10.1016/j.jsb.2009.09.010.
References
Best, R.B., Chen, Y.G., Hummer, G., 2005. Slow protein conformational dynamicsfrom multiple experimental structures: the helix/sheet transition of arcrepressor. Structure 13, 1755–1763.
Campbell, E.A., Korzheva, N., Mustaev, A., Murakami, K., Nair, S., Goldfarb, A., Darst,S.A., 2001. Structural mechanism for rifampicin inhibition of bacterial RNApolymerase. Cell 104, 901–912.
Caulfield, T.R., Harvey, S.C., 2007. Conformational fitting of atomic models tocryogenic-electron microscopy maps using Maxwell’s demon moleculardynamics. Biophys. J. 368A.
Chacon, P., Wriggers, W., 2002. Multi-resolution contour-based fitting ofmacromolecular structures. J. Mol. Biol. 317, 375–384.
Chapman, M.S., 1995. Restrained real-space macromolecular atomic refinementusing a new resolution-dependent electron-density function. Acta Cryst. A. 51,69–80.
Chen, J.Z., Fürst, J., Chapman, M.S., Grigorieff, N., 2003. Low-resolution structurerefinement in electron microscopy. J. Struct. Biol. 144, 144–151.
Clementi, C., Nymeyer, H., Onuchic, J.N., 2000. Topological and energetic factors:what determines the structural details of the transition state ensemble and ‘‘en-route” intermediates for protein folding? An investigation for small globularproteins. J. Mol. Biol. 298, 937–953.
Conway, J.F., Wikoff, W.R., Cheng, N., Duda, R.L., Hendrix, R.W., Johnson, J.E., Steven,A.C., 2001. Virus maturation involving large subunit rotations and localrefolding. Science 292, 744–748.
Darst, S.A., Opalka, N., Chacon, P., Polyakov, A., Richter, C., Zhang, G.Y., Wriggers, W.,2002. Conformational flexibility of bacterial RNA polymerase. Proc. Natl. Acad.Sci. USA 99, 4296–4301.
Delarue, M., Dumas, P., 2004. On the use of low-frequency normal modes to enforcecollective movements in refining macromolecular structural models. Proc. Natl.Acad. Sci. USA 101, 6957–6962.
Fabiola, F., Chapman, M.S., 2005. Fitting of high-resolution structures into electronmicroscopy reconstruction images. Structure 13, 389–400.
Falke, S., Tama, F., Brooks, C.L., Gogol, E.P., Fisher, M.T., 2005. The 13 angstromstructure of a chaperonin GroEL-protein substrate complex by cryo-electronmicroscopy. J. Mol. Biol. 348, 219–230.
Frank, J., Agrawal, R.K., 2000. A ratchet-like inter-subunit reorganization of theribosome during translocation. Nature 406, 318–322.
Gao, H., Frank, J., 2005. Molding atomic structures into intermediate-resolutioncryo-EM density maps of ribosomal complexes using real-space refinement.Structure 13, 401–406.
Gao, H., Sengupta, J., Valle, M., Korostelev, A., Eswar, N., Stagg, S.M., Van Roey, P.,Agrawal, R.K., Harvey, S.C., Sali, A., Chapman, M.S., Frank, J., 2003. Study of thestructural dynamics of the E. coli 70S ribosome using real-space refinement. Cell113, 789–801.
Gront, D., Kmiecik, S., Kolinski, A., 2007. Backbone building from quadrilaterals: afast and accurate algorithm for protein backbone reconstruction from alphacarbon coordinates. J. Comput. Chem. 28, 1593–1597.
Hinsen, K., Reuter, N., Navaza, J., Stokes, D.L., Lacapere, J.J., 2005. Normal mode-based fitting of atomic structure into electron density maps: Application tosarcoplasmic reticulum Ca-ATPase. Biophys. J. 88, 818–827.
Isralewitz, B., Gao, M., Schulten, K., 2001. Steered molecular dynamics andmechanical functions of proteins. Curr. Opin. Struct. Biol. 11, 224–230.
Jacobs, D.J., Rader, A.J., Kuhn, L.A., Thorpe, M.F., 2001. Protein flexibility predictionsusing graph theory. Proteins 44, 150–165.
Jacobs, D.J., Thorpe, M.F., 1995. Generic rigidity percolation—the pebble game. Phys.Rev. Lett. 75, 4051–4054.
Jiang, W., Baker, M.L., Ludtke, S.J., Chiu, W., 2001. Bridging the information gap:computational tools for intermediate resolution structure interpretation. J. Mol.Biol. 308, 1033–1044.
Jolley, C.C., Wells, S.A., Fromme, P., Thorpe, M.F., 2008. Fitting low-resolution cryo-EM maps of proteins using constrained geometric simulations. Biophys. J. 94,1613–1621.
Koga, N., Takada, S., 2006. Folding-based molecular simulations reveal mechanismsof the rotary motor F-1-ATPase. Proc. Natl. Acad. Sci. USA 103, 5367–5372.
Krammer, A., Lu, H., Isralewitz, B., Schulten, K., Vogel, V., 1999. Forced unfolding ofthe fibronectin type III module reveals a tensile molecular recognition switch.Proc. Natl. Acad. Sci. USA 96, 1351–1356.
Laurberg, M., Kristensen, O., Martemyanov, K., Gudkov, A.T., Nagaev, I., Hughes, D.,Liljas, A., 2000. Structure of a mutant EF-G reveals domain III and possibly thefusidic acid binding site. J. Mol. Biol. 303, 593–603.
Lee, K.K., Johnson, J.E., 2003. Complementary approaches to structure determinationof icosahedral viruses. Curr. Opin. Struct. Biol. 13, 558–569.
Ma, J., Sigler, P.B., Xu, Z., Karplus, M., 2000. A dynamic model for the allostericmechanism of GroEL. J. Mol. Biol. 302, 303–313.
Mears, J.A., Sharma, M.R., Gutell, R.R., McCook, A.S., Richardson, P.E., Caulfield, T.R.,Agrawal, R.K., Harvey, S.C., 2006. A structural model for the large subunit of themammalian mitochondrial ribosome. J. Mol. Biol. 358, 193–212.
Mitra, K., Schaffitzel, C., Shaikh, T., Tama, F., Jenni, S., Brooks III, C.L., Ban, N., Frank, J.,2005. Structure of the E. coli protein-conducting channel bound to a translatingribosome. Nature 438, 318–324.
Noda, K., Nakamura, M., Nishida, R., Yoneda, Y., Yamaguchi, Y., Tamura, Y.,Nakamura, H., Yasunaga, T., 2006. Atomic model construction of proteincomplexes from electron micrographs and visualization of their 3D structureusing a virtual reality system. J. Plasma. Phys. 72, 1037–1040.
Okazaki, K., Koga, N., Takada, S., Onuchic, J.N., Wolynes, P.G., 2006. Multiple-basinenergy landscapes for large-amplitude conformational motions of proteins:structure-based molecular dynamics simulations. Proc. Natl. Acad. Sci. USA 103,11844–11849.
Onuchic, J.N., Wolynes, P.G., 2004. Theory of protein folding. Curr. Opin. Struct. Biol.14, 70–75.
Orzechowski, M., Tama, F., 2008. Flexible fitting of high-resolution X-ray structuresinto cryoelectron microscopy maps using biased molecular dynamicssimulations. Biophys. J. 95, 5692–5705.
Rawat, U.B.S., Zavialov, A.V., Sengupta, J., Valle, M., Grassucci, R.A., Linde, J.,Vestergaard, B., Ehrenberg, M., Frank, J., 2003. A cryo-electron microscopicstudy of ribosome-bound termination factor RF2. Nature 421, 87–90.
Rossmann, M.G., 2000. Fitting atomic models into electron-microscopy maps. Acta.Cryst. D 56, 1341–1349.
Rossmann, M.G., Bernal, R., Pletnev, S.V., 2001. Combining electron microscopicwith X-ray crystallographic structures. J. Struct. Biol. 136, 190–200.
Rotkiewicz, P., Skolnick, J., 2008. Fast procedure for reconstruction of full-atomprotein models from reduced representations. J. Comput. Chem. 29, 1460–1465.
Saibil, H.R., 2000. Conformational changes studied by cryo-electron microscopy.Nat. Struct. Biol. 7, 711–714.
Sanbonmatsu, K.Y., Joseph, S., Tung, C.S., 2005. Simulating movement of tRNA intothe ribosome during decoding. Proc. Natl. Acad. Sci. USA 102, 15854–15859.
Schlitter, J., Engels, M., Krüger, P., 1994. Targeted molecular dynamics: a newapproach for searching pathways of conformational transitions. J. Mol. Graph.12, 84–89.
Schröder, G.F., Brunger, A.T., Levitt, M., 2007. Combining efficient conformationalsampling with a deformable elastic network model facilitates structurerefinement at low resolution. Structure 15, 1630–1641.
Stahlberg, H., Walz, T., 2008. Molecular electron microscopy: state of the art andcurrent challenges ACS. Chem. Biol. 3, 268–281.
Suhre, K., Navaza, J., Sanejouand, Y.H., 2006. NORMA: a tool for flexible fittingof high-resolution protein structures into low-resolution electron-microscopy-derived density maps. Acta Crystallogr. D. Biol. Crystallogr. 62,1098–1100.
Taketomi, H., Ueda, Y., Go, N., 1975. Studies on protein folding, unfolding andfluctuations by computer-simulation.1. Effect of specific amino-acid sequencerepresented by specific inter-unit interactions. Int. J. Peptide Protein Res. 7,445–459.
Tama, F., Miyashita, O., Brooks III, C.L., 2004a. Flexible multi-scale fitting of atomicstructures into low-resolution electron density maps with elastic networknormal mode analysis. J. Mol. Biol. 337, 985–999.
Tama, F., Miyashita, O., Brooks III, C.L., 2004b. NMFF: flexible high-resolutionannotation of low-resolution experimental data from cryo-EM maps usingnormal mode analysis. J. Struct. Biol. 147, 315–326.
Tama, F., Ren, G., Brooks 3, C.L., Mitra, A.K., 2006. Model of the toxic complex ofanthrax: responsive conformational changes in both the lethal factor and theprotective antigen heptamer. New J. 15, 2190–2200.
Tama, F., Sanejouand, Y.H., 2001. Conformational change of proteins arising fromnormal mode calculations. Protein Eng. 14, 1–6.
Tan, R.K., Devkota, B., Harvey, S.C., 2008. YUP.SCX: coaxing atomic models intomedium resolution electron density maps. J. Struct. Biol. 163, 163–174.
Topf, M., Baker, M.L., John, B., Chiu, W., Sali, A., 2005. Structural characterization ofcomponents of protein assemblies by comparative modeling and electron cryo-microscopy. J. Struct. Biol. 149, 191–203.
Topf, M., Baker, M.L., Marti-Renom, M.A., Chiu, W., Sali, A., 2006. Refinement ofprotein structures by iterative comparative modeling and cryoEM densityfitting. J. Mol. Biol. 357, 1655–1668.
Topf, M., Lasker, K., Webb, B., Wolfson, H., Chiu, W., Sali, A., 2008. Protein structurefitting and refinement guided by cryo-EM density. Structure 16, 295–307.
Tozzini, V., 2005. Coarse-grained models for proteins. Curr. Opin. Struct. Biol. 15,144–150.
Tozzini, V., McCammon, J.A., 2005. A coarse grained model for the dynamics of flapopening in HIV-1 protease. Chem. Phys. Lett. 413, 123–128.
Trabuco, Villa, Mitra, Frank., Schulten, 2008. Flexible fitting of atomic structuresinto electron microscopy maps using molecular dynamics. Structure 16, 673–683.
Ueda, Y., Taketomi, H., Go, N., 1978. Studies on protein folding, unfolding, andfluctuations by computer-simulation. 2. Three-dimensional lattice model oflysozyme. Biopolymers 17, 1531–1548.

I. Grubisic et al. / Journal of Structural Biology 169 (2010) 95–105 105
Valle, M., Gillet, R., Kaur, S., Henne, A., Ramakrishnan, V., Frank, J., 2003a. VisualizingtmRNA entry into a stalled ribosome. Science 300, 127–130.
Valle, M., Zavialov, A., Sengupta, J., Rawat, U., Ehrenberg, M., Frank, J., 2003b.Locking and unlocking of ribosomal motions. Cell 114, 123–134.
Velazquez-Muriel, J.A., Valle, M., Santamaría-Pang, A., Kakadiaris, I.A., Carazo, J.M.,2006. Flexible fitting in 3D-EM guided by the structural variability of proteinsuperfamilies. Structure 14, 1115–1126.
Volkmann, N., Hanein, D., 1999. Quantitative fitting of atomic models into observeddensities derived by electron microscopy. J. Struct. Biol. 125, 176–184.
Volkmann, N., Hanein, D., Ouyang, G., Trybus, K.M., DeRosier, D.J., Lowey, S., 2000.Evidence for cleft closure in actomyosin upon ADP release. Nat. Struct. Biol. 7,1147–1155.
Wendt, T., Taylor, D., Trybus, K.M., Taylor, K., 2001. Three-dimensional imagereconstruction of dephosphorylated smooth muscle heavy meromyosin revealsasymmetry in the interaction between myosin heads and placement ofsubfragment 2. Proc. Natl. Acad. Sci. USA 98, 4361–4366.
Whitford, P.C., Miyashita, O., Levy, Y., Onuchic, J.N., 2007. Conformationaltransitions of adenylate kinase: Switching by cracking. J. Mol. Biol. 366,1661–1671.
Wriggers, W., Agrawal, R.K., Drew, D.L., McCammon, A., Frank, J., 2000.Domain motions of EF-G bound to the 70S ribosome: insights from ahand-shaking between multi-resolution structures. Biophys. J. 79, 1670–1678.
Wriggers, W., Birmanns, S., 2001. Using Situs for flexible and rigid-body fitting ofmultiresolution single-molecule data. J. Struct. Biol. 133, 193–202.
Wriggers, W., Milligan, R.A., McCammon, J.A., 1999. Situs: a package for dockingcrystal structures into low- resolution maps from electron microscopy. J. Struct.Biol. 125, 185–195.
Zhang, G.Y., Campbell, E.A., Minakhin, L., Richter, C., Severinov, K., Darst, S.A., 1999.Crystal structure of Thermus aquaticus core RNA polymerase at 3.3 angstromresolution. Cell 98, 811–824.