journal of social policy research institutesprijaipur.org/file/mission/1372768255spri_vision.pdf ·...
TRANSCRIPT

Journal of Social Policy Research Institute
Vol. 2 • No. 2 Special Seminar Issue July-Dec, 2007
CONTENTS
Chairman’s Message iii
From Chief Editors desk v
A word of Thanks vi
Status Paper: Dr. B.P.Shreevastava and Dr. Ashwini Kumar 01
A. STRATEGIES AND POLICY OPTIONS Page No.
1. Inaugural Speech 17by Namo Narain Meena, Minister of State, MOEF, Govt. of India
2. Key Note Paper 23by Dr V L Chopra, Member, Planning Commission, Govt. of India
3. Presentation 26by C L Trisal, Director Wetlands International, Southasia, New Delhi
4. Presentation 29by Ashok Jain, Chairman, Rajasthan Pollution Control Board, Rajasthan
B. ENGINEERED WETLANDS
1. Shyam Asolekar 35Centre for Environmental Science and Engineering, IIT, Mumbai
2. S M Seth 45Director General, Poornima College of Engineering, Jaipur
C. ENVIRONMENTAL RELATED ISSUES OF WETLANDS
1. A S Brar 67Member Secretary, Rajasthan Pollution Control Board, Jaipur
2. Rashmi Sisodia 78Department of Zoology, University of Rajasthan, Jaipur
3. Dr V K Choubey 92National Institute of Hydrology, Roorkee
i

D. MANAGEMENT AND CONSERVATION ISSUES
1. Ramsar Site of Keoladeo National Park
a) Harshvardhan 113Hon. Gen. Secretary, Tourism & Wildlife Society of India, Jaipur
b) Sunayan Sharma 117Director, Keoladeo National Park, Bharatpur, Rajasthan
2. Ramsar Site of Sambhar Lake
a) R P Mathur and L N Mathur 122Central Ground Water Board, Western Region, Jaipur
b) A. Abdul Rahman 130Scientiest & Consultant, Villupuram, Tamil Nadu
c) P C Srivastava and S K Wadhawan 136Geological Survey of India, Western Region, Jaipur
E. OUTCOME OF THE SEMINAR – DR. SUDHIR VARMA 151
ii

Wetlands form important resources in the Stateof Rajasthan and as such with this view in mind theSocial Policy Research Institute with the support ofMinistry of Environment and Forests, Governmentof India organized a National Seminar on the subject“Wetlands and their Conservation: Strategies andPolicy Options with special reference to Rajasthan”on 3rd and 4th October, 2007.
Wetlands in Rajasthan being inland types,geographically enveloped by arid and semi-aridconditions, have developed features to adjust withthe shortage of water, brackish water, erratic rainfalland recurring drought conditions.
Two wetlands with the status of internationalRamsar sites in Rajasthan viz., Keoladeo NationalPark and Sambhar Lake, while supporting remarkablehabitat for grassland and birds/reptiles, havedeteriorated over a period of time leading to problemsfor their very survival. Several other wetlands eg.Jalmahal, Ramgarh Dam near Jaipur and lakes in theenviron of Jodhpur, Ajmer, Udaipur etc. are alsofacing similar threats. It is observed that these watershed areas are being converted into commercial landsand recharge or smooth flow of water has beenblocked.
The seminar was organized in a way that itremained interactive through out. Strategy and policy
Chairman’sMessage
iii

options for integrated development of the wetlandsand its conservation, role of wetlands in hydrologicalcycle, groundwater recharges, erosion control,maintenance of wetlands for sustenance of geneticdiversity, conservation of bio diversity, regulatorymechanisms and integrated watershed managementwere subjects which were discussed in details.
The views and outcome of the seminar have beenbrought out in this volume. It is very satisfying thatthe Seminar fulfilled the aims with which it wasplanned. I am sure that the knowledge gained duringthe seminar would provide food for thought toscientists and administrators engaged in solving theproblems related to conservation and management ofwetlands.
Shiv Charan Mathur
iv

This is the fourth issue of the SPRI VISION. Itdevotes itself on the problems of Wetlands withparticular reference to Rajasthan. The papersincluded in this issue were presented during aNational Seminar on “Wetlands and theirConservation: Strategies and Policy Options withspecial reference to Rajasthan” held at the Instituteon 3rd/4th October, 2007. The issue has been dividedinto five parts:
a) Strategies and Policy Options
b) Engineered Wetlands
c) Environment and Related Issues
d) Management and Conservation Issues
e) The Outcome of the Seminar
The participants in the Seminar includedpolicy makers, technocrats and activists. A numberof recommendations were made during the twodays of the Seminar which have been summed upin the last section of this issue. I hope the issue willnot only provide useful information to its readersbut may also lead to policy changes as well asbuilding up of public awareness on the crucialissues deliberated upon during the seminar.
Dr. Sudhir Varma
FROM THECHIEF EDITOR’S DESK
v

A Word of Thanks
The Institute is grateful to the Ministryof Environment and Forests, New Delhi forfinancially supporting the organization ofthe seminar. Our special thanks are to theHon’ble Shri Namo Narain Meena, Ministerof State of Environment and Forests forinaugurating the seminar and enriching theknowledge of participants by his address.We are thankful to Shri V L Chopra,Member of Planning Commission for hiskey note address and thought provokingideas and his subsequent visit to theSambhar Lake for a first hand knowledgeof the condition of this Ramsar site. Thepapers presented in the seminar were ofhigh quality and the deliberations have ledto concrete recommendations. We thank allour speakers for enriching knowledge of theparticipants and for being with us by takingtime out of their busy schedule.
vi

1
Wetlands: Status and ManagementStrategies with Special Reference toRajasthan
By Dr. B.P.Shreevastava1
& Dr. Ashwini Kumar2
INTRODUCTION:
Wetlands are ecotones or transitional zone between permanentlyaquatic and terrestrial ecosystem defined as “wetlands are interface betweentruly terrestrial ecosystems and aquatic systems making them inherently differentfrom each other yet highly dependent on both”. They represent areas of marsh,permanent or temporary water storage which may be brakish or saltincluding areas of marine water, the depth of which at low tide is sixmeters.
Generally, wetlands are lands where saturation with water is thedominant factor determining the nature of soil development and thetypes of plant and animal communities living in the soil and on its surface.Wetlands vary widely because of regional and local differences in soils,topography, climate, hydrology, water chemistry, vegetation, and otherfactors, including human disturbance. Indeed, wetlands are found fromthe tundra to the tropics and on every continent except Antarctica.
For regulatory purposes under the Clean Water Act, the termwetlands means “those areas that are inundated or saturated by surface orground water at a frequency and duration sufficient to support, and that undernormal circumstances do support, a prevalence of vegetation typically adapted
STATUS PAPER
1 Technical Coordinator, Social Policy Research Institute, Jaipur2 Former Professor of Botany, University of Rajasthan and presently consultant, Social Policy Research
Institute

2
for life in saturated soil conditions. Wetlands generally include swamps, marshes,bogs and similar areas.”
Wetlands do more than provide habitat for plants and animals inthe watershed. When rivers overflow, wetlands help to absorb and slowfloodwaters. This ability to control floods can alleviate property damageand loss and can even save lives. Wetlands also absorb excess nutrients,sediment, and other pollutants before they reach rivers, lakes, and otherwaterbodies. They are great spots for fishing, canoeing, hiking, and bird-watching, and they make wonderful outdoor classrooms for people ofall ages.
RESOURCES OF WETLANDS
Globally wetlands are estimated to occupy nearly 6.4% of the earthsurface. Of those wetlands, nearly 30% is made up of bogs, 26% fans,20% swamps and 15% flood plains. Wetland ecosystem constitute anintegral resource for cultural and biodiversity landscape measuring 34million hectares in India. A wide variety of wetlands exist in our countryin consequence to its geographic situations in the globe and climaticconditions.
CHARACTERISTICS OF WETLANDS:
Wetlands are areas where water covers the soil, or is present eitherat or near the surface of the soil all year or for varying periods of timeduring the year, including during the growing season. Water saturation(hydrology) largely determines how the soil develops and the types ofplant and animal communities living in and on the soil. Wetlands maysupport both aquatic and terrestrial species. The prolonged presence ofwater creates conditions that favor the growth of specially adapted plants(hydrophytes) and promote the development of characteristic wetland(hydric) soils.
GEOGRAPHICAL AND BIODIVERSITY CHARACTERISTICS
The geographical area determines the characteristics of wetlands,and biodiversity of a particular area is highly specific to the region.Wetlands vary widely because of regional and local differences in soils,topography, climate, hydrology, water chemistry, vegetation, and otherfactors, including human disturbance. Indeed, wetlands are found from

3
the tundra to the tropics and on every continent except Antarctica.
TYPES OF WETLANDS:
Two general categories of wetlands are recognized:
Coastal or tidal wetlands and inland or non-tidal wetlands.Rajasthan has mainly Wetlands of the later “inland” category.
WETLANDS IN RAJASTHAN:
The Inland Wetlands of state of Rajasthan have special significancewith one third of its geographical area enveloped by arid and semi-aridconditions. It suffers from poor to erratic rainfall, brackish water andrecurring drought conditions with its unique sustainable featuresadjusting with shortages of water. The annual normal rainfall of the stateis 575 mm, out of which 75 to 95% of rainfall mostly precipitates in themonsoon period i.e. from 1st June to 30th September. The normal rainfallof the state for monsoon period is 533 mm.
Although Rajasthan has two Ramsar wetland sites of internationalimportance viz Keoladeo National Park, Bharatpur and Sambhar butthere are small and big water bodies amounting to thousands in numberof the types described below:
a) Village wells/Personal ‘tanka’: Each household in villages enjoyeda personal tank (called ‘tanka’ in local parlance) which was at acorner of house and developed in a manner that rain water wouldautomatically flow into it to recharge its quantity. If it was short ofwater, people would fetch water from the village reservoir or awell to replenish it.
b) Village ‘nadi’ (reservoir): Each village had one or more such waterbody. It was rainwater deposited in depressions around the village.It was for common use by all, people and cattle. The village bodyensured that such an open water body was respected.
c) Tanks or Dams: They were created by princes who ruled the statein those days, and were for irrigation purposes as well. More suchtanks were created by the government after independence.
Further, the aforesaid types in Rajasthan could be classed as:
(a) River system, (b) Playas, and (c) Man-made Reservoirs

4
(a) River system: There are only two perennial rivers in Rajasthan:Chambal, and Mahi though there are numerous seasonal rivers.Both are of far reaching benefits to people. Each one has beenadequately dammed and network of canals developed for irrigationbenefits at distant places. Their ecological quantification is, however,yet to be attempted
(b) Playas: The important playas are confined to western Rajasthanincluding the Ramsar Site of Sambhar Lake. Other importantpalayas are: Kuchaman, Deedwana, Rewasa, Kanod, Baramsar,That etc.
(c) Man-made reservoirs
(i) These are generally confined to the eastern part of the Stateand were necessitated by the ephemeral nature of watersystem. They vary in size and depth of water in various ways.The prominent ones are:
1. Rana Pratap Sagar Dam, Chittorgarh
2. Raj Samand, Rajsamand
3. Sadarsamand, Jodhpur
4. Guda, Bundi
5. Jawai, Pali
6. Gambhiri, Chittorgarh
7. Meja, Bhilwara
8. Morel, Sawai Madhopur
9. Parvati, Dholpur etc.
(ii) The characteristic feature identified for enumerating suchwater bodies is based on dynamics of aquatic life, coupledwith the vegetation around them that supports the avifauna.The prominent reservoirs are tabulated in Table 1.
RAMSAR SITES OF RAJASTHAN:
1. Keoladeo National Park, Bharatpur: This 29 sq km park is a worldheritage site and is classified as a national park. It is an important

5
habitat (aquatic, grassland, woodland and scrub) for birds ofmigratory and resident types. In addition, belonging to mammals,amphibians and reptiles also form a big number. Lack ofadministrative control on several factors has made this site face agrave threat to its survival, the main reason being non-availabilityof water flowing in the wetland. This appears to be due to theconstruction of Panchana dam stopping flow of Gambhiri riverwhich provided such water to it since ages. Though alternativesources are being proposed by the State Government by Chicksanacanal and Goverdhan dam, however these are both at discussionlevel and as such the fate of the park is uncertain.
2. Sambhar Lake: This wetland measuring around 200 sq km of waterin the environ of Sambhar is by the dint of monsoon flow throughMedha and Roopangarh rivers. Both of these are blocked byinnumerable salt works which have mushroomed all around thelake resulting in the extraction of water and scrapping of lakesurface. These have caused the lake to remain dry for most of thetime in the year and whatever water is received post monsoonseason is drained out by the public sector salt manufacturingcompany located there.
There are contradictory statements by each of these works whichthe administration has not been able to resolve probably because of theissue of ownership of this important wetlands which once has supportedthe biodiversity of this region.
BIODIVERSITY RELATED TO WETLANDS SPECIFIC TORAJASTHAN:
Being a wetland ecosystem which supports the flora and fauna ofboth the types, the loss of wetlands results in considerable depletionand disappearance of biodiversity. As an example the wetlands ofRamgarh were quite rich in Pteridophytes like Equisetum, Marsilea butdue to disappearance of streams and the wetlands these two plants arenow not common in Ramgarh area. Utricularia which was common tothe streams, Azolla a fern, and Polygonum a water plant of shallow watersare all disappearing from the Ramgarh lake and its stream areas. Similarlythere is considerable loss of biodiversity as monitored from the satellite

6
pictures in Ajmer region especially in the Pushkar and Budha Pushkarareas. There can be several such examples and even loss of halophytesfrom the Sambher lake area is glaring. Keoladeo National Park is yetanother wetland depleting in fauna and flora exhorbitantly.
Besides the biodiversity loss there is also considerable loss of faunaparticularly avifauna:
a) Threatened Breeding Avifauna. Following are the resident birdspecies which are under severe threat (BirdLife Internationalcriterion) and have been observed breeding at some of the wetlandslisted in this report:
1. Blackbellied Tern
2. Blackheaded Ibis
3. Blacknecked Stork
4. Painted Stork
5. Indian Skimmer
6. Sarus Crane
b) Threatened Migrants Avifauna. Following are the migrant speciesunder severe threat (BirdLife International criterion) reported atsome of the wetlands listed in this report:
1. Siberian Crane
2. Marbled Teal
3. Dalmatian Pelican
4. Lesser Flamingo
5. Ferruginous Duck.
c) Waterfowl observed in the State (breeding* and non-breeding). Listof this type of Avifauna is given in Table 2.
MANAGEMENT OF WETLANDS:
Management is the manipulation of an ecosystem to ensuremaintenance of all functions and characteristics of the specific wetlandtype. The loss or impairment of a wetland ecosystem is usuallyaccompanied by irreversible loss in both the valuable environmental

7
functions and amenities important to the society. Appropriatemanagement and restoration mechanisms need to be implemented inorder to regain and protect the physical, chemical, and biological integrityof wetland ecosystems. In this context, a detailed study of wetlandmanagement and socio-economic implications is required from biologicaland hydrological perspectives. Largely speaking they are related toproblems such as:
i. Hydrologic alterations, which include changes in
• The hydrologic structure
• Functioning of a wetland by direct surface drainage, de-watering by consumptive use of surface water inflows
• Unregulated draw down of unconfined aquifer from eithergroundwater withdrawal or by stream channelization forvarious human activities.
ii. Increased sedimentation, nutrient, organic matter, metals,pathogen, and other water pollutant loading from
• storm water runoff (non-point source)
• wastewater discharges (point source).
iii. Atmospheric deposition of pollutants into these lakes mainly bythe vehicular and industrial pollution both from within the citiesand from the suburban industrial complexes.
iv. Introduction or change in characteristic wetland flora and fauna(exotic) as a result of change in the adjacent land uses deliberatelyor naturally changing the water quality, and so forth.
MANAGEMENT/ RESTORATION STRATEGIES OF WETLANDS
Management of wetland ecosystems involving activities to protect,restore, and manipulate require intense monitoring and increasedinteraction and co-operation among various agencies such as concernedState departments for environment, soil, agriculture, forestry, urbanplanning and development, natural resource management; NGO’s;citizen’s groups; research institutions; and policy makers.
Wetland management has to be an integrated approach in terms of

8
planning, execution, and monitoring, requiring effective knowledge ona range of subjects from issues related to ecology, hydrology, economics,watershed management, and local expertise, people, planners anddecision makers. All these would help in understanding wetlands betterand evolve a more comprehensive and long-term conservation andmanagement strategies. Some of the suggested strategies in this regardare:
1. Involving protection of wetlands by regulating inputs, using waterquality standards promulgated for wetlands and such inlandsurface waters to promote their normal functioning from theecosystem perspective.
2. Providing multiple values for suburban and city dwellers in urbanwetlands.
The important factors to be considered for developing amanagement strategy are:
I. Necessity of immediate need to create a database on the wetlandtypes, morphological, hydrological, and biodiversity datasurrounding land use, hydrogeology, surface water quality, andsocio-economic dependence.
II. Conducting regular water quality monitoring of surface water,groundwater, and biological samples. Such programs help informulating a comprehensive restoration, conservation, andmanagement program.
III. Pollution Prevention Program through environmental awarenessprograms.
IV. Creating buffer zones for wetland protection, limitinganthropogenic activities around the demarcated corridor of thewetland.
Thus the restoration programme should mandate all aspects ofecosystem and should be based on:
• Wetlands that could recover without any intervention.
• Wetlands that could be restored close to their former condition toserve their earlier functions, considering cost involved, technical

9
review of the restoration plan, and based on the goals and objectivesset.
• Wetlands that are not restorable to any degree viably.
BENEFITS OF WETLANDS
Wetland systems directly and indirectly support millions of people,providing goods and services to them. They contribute to importantprocesses, which include the movement of water through the wetlandinto streams; decay of organic matter; release of nitrogen, sulfur, andcarbon into the atmosphere; removal of nutrients, sediment, and organicmatter from water moving into the wetland; and the growth anddevelopment of all organisms that require wetlands for living.
The direct benefits of wetlands are the components/products suchas fish, timber, recreation, and water supply. The indirect benefits arisefrom the functions occurring within the ecosystem such as flood control,ground water recharge, and storm protection.
Wetlands have the capacity to retain excess floodwater duringheavy rainfall that would otherwise cause flooding. By retaining floodflows, they maintain a constant flow regime downstream, preservingwater quality and increasing biological productivity for both aquaticlife as well as human communities of the region.
Periodically inundated wetlands are very effective in storingrainwater and are the primary source for recharging ground watersupplies. The extent of groundwater recharge depends on the soil andits permeability, vegetation, sediment accumulation in the lakebed,surface area to volume ratio, and water table gradient.
Wetlands retain nutrients by storing eutrophic parameters likenitrogen and phosphorus, flooding waters in vegetation, or accumulatingthem in the sub-soil, thus decreasing the potential for eutrophicationand excess plant growth in receiving waters. They also help in absorbingsewage and in purifying water supplies.
Apart from this, the socio-economic values, through water supply,fisheries, fuel wood, medicinal plants, livestock grazing, agriculture,energy resource, wildlife resource, transport, recreation and tourism,and so forth, are significant. The functional properties of a wetland

10
ecosystem clearly demonstrate its role in maintaining the ecologicalbalance.
Stress is laid world over for safeguarding the remaining peatswamps forests of wetlands specially because the mechanism to preventrelease of large quantities of previous CO2 stock currently stocked inwetlands (especially peatlands) is directly related to tackling climatechange.
CONCLUSION
1) Wetland ecosystems are interconnected and interactive within awatershed.
2) Dewatering of wetlands by consumptive use of surface water inflowdestroys the existing ecosystem.
3) The exploratory survey and physico-chemical and biologicalcharacterization of lakes indicate that lakes are polluted mainlydue to sewage from domestic and industrial sectors andunorganized human activities.
4) The restoration program with an ecosystem perspective throughBest Management Practices helps in correcting point and non-pointsources of pollution wherever and whenever possible. This alongwith regulations and planning for wildlife habitat and fishes helpsin arresting the declining water quality and the rate in loss ofwetlands. These restoration goals require intensive planning,leadership, and funding, with active involvement from all levels oforganization etc.

11
TABLE 1: Man made Reservoirs
1. Ajmer Ramsar, Ana Sagar, Kamsar, Aheran, Dund, and Phulsagar(Kishangarh), Phulsagar (Beawar)
2. Alwar Jaisagar, Mangalsar, Mansarovar, Jaisamand
3. Baran Ratai (Shahbad). The Kalisindh and Parvati rivers
4. Barmer Kagoda (near Agawada village)
5. Banswara Mahi reservoir, Suwania, Haro, Talwara. Mahi riversupports breeding.
6. Bharatpur Keoladeo National Park, Ajan Bund, Bund Baretha
7. Bhilwara Meja
8. Bikaner Indira Gandhi Nahar and RDs
9. Bundi Guda, Bardha, Kanaksagar, Dhaneshwar, Abhaipura.
10. Chittorgarh Rana Pratap Sagar, Jawahar Sagar, Bhopalsagar, Orai,Gambhiri, Menal, Talaia and Mahi
11. Churu Tal Chhapar
12. Dausa Kalakho, Sainthal
13. Dholpur Urmila Sagar, Talab-I-Shahi, Ramsagar, Parvati Bund.
14. Dungarpur Lodeshwar and Lakshman Sagar
15. Hanumangarh Badopal and IG Nahar
16. Jaipur Phulera, Chhaparwada
17. Jaisalmer Kanod, Baramsar and That
18. Jodhpur Agolai
19. Karauli Panchana
20. Kota Alnia, Umaid Sagar, Kota Barrage, Udupi and Chambal river.
21. Nagaur Deedwana, Kuchaman
22. Pali Jawai, Sardar Samand, Hemawas, Kharda
23. Raj Samand Raj Samand, Kumbhalgarh, Nand Samand (?)
24. Sawai Madhopur Morel, Deel Sagar, Bhagwatgarh, Surwal, Devpura,Mansarovar.
25. Sikar Rewasa
26. Sirohi Oda, West Banas and Dantiwara
27. Tonk Tordi Sagar, Chandsen, Galwania, Galwa, Bisalpur
28. Udaipur Mataji ka Khera, Sei, Udaisagar, Fateh Sagar, Pichhola-SarupSagar, Badi, Badgaon, Vallasbhnagar, Sad Samand

12
TABLE 2
Avifauna of Rajasthan
1. Little Grebe* 63. Mallard
2. Great Crested Grebe 64. Spotbilled Duck*
3. Blacknecked Grebe 65. Pintail
4. White Pelican 66. Garganey
5. Spotbilled Pelican 67. Shoveler
6. Dalmatian Pelican 68. Marbled Teal (facing severe threat)
7. Great Cormorant* 69. Redcrested Pochard
8. Indian Shag* 70. Common Pochard
9. Oriental Darter* 71. Baer’s Pochard(facing threat)
10. Yellow Bittern* 72. Ferruginous Duck(facing severe threat)
11. Great Bittern 73. Tufted Duck
12. Little Bittern 74. Smew
13. Cinnamon Bittern* 75. Common Crane
14. Black Bittern* 76. Sarus Crane* (facing severe threat)
15. Blackcrowned Night Heron* 77. Siberian Crane(on verge of extinction)
16. Pond Heron* 78. Demoiselle Crane
17. Cattle Egret* 79. Water Rail
18. Little Green Heron* 80. Baillon’s Crake
19. Little Egret* 81. Whitebreasted Waterhen*
20. Intermediate Egret* 82. Water Cock (Kora)
21. Great Egret* 83. Moorhen*
22. Purple Heron* (facing threat) 84. Purple Moorhen*
23. Grey Heron* 85. Coot
24. Painted Stork* 86. Pheasant-tailed Jacana*(facing severe threat)
25. Openbilled Stork* 87. Bronzewinged Jacana*(facing threat)
26. Black Stork 88. Painted Snipe*

13
27. Woollynecked Stork* 89. Blackwinged Stilt*(facing threat)
28. White Stork 90. Great Stone Plover*
29. Blacknecked Stork* 91. Oriental Pratincole(facing severe threat)
30. Lesser Adjutant Stork* 92. Little Pratincole*(facing severe threat)
31. Blackheaded (White) Ibis * 93. Northern Lapwing(facing threat)
32. Black Ibis* 94. River Lapwing*
33. Glossy Ibis* 95. Yellow-wattled Lapwing*(declining)
34. Greater Flamingo 96. Sociable Lapwing (facing severethreat)
35. Lesser Flamingo (facing threat) 97. White-tailed Lapwing
36. Lesser Whistling Teal* 98. Greyheaded Lapwing (declining)(facing threat)
37. Greylag Goose 99. Redwattled Lapwing*
38. Barheaded Goose 100. Pacific Golden Plover
39. Lesser Whitefronted Goose 101. Grey Plover(facing threat)
40. Ruddy Shelduck 102. Little Ringed Plover*(Brahminy)
41. Common Shelduck 103. Kentish Plover
42. Comb Duck (Nukta)* 104. Mongolian Plover(facing threat)
43. Cotton Teal* 105. Greater Sand Plover
44. Eurasian Wigeon 106. Blacktailed Godwit
45. Falcated Teal 107. Bartailed Godwit
46. Gadwall 108. Curlew
47. Common 109. Spotted Redshank(Greenwinged) Teal
48. Black Bittern* 110. Common Snipe
49. Common Redshank 111. Jack Snipe
50. Marsh Sandpiper 112. Little Stint

14
51. Greenshank 113. Temminck’s Stint
52. Green Sandpiper 114. Dunlin
53. Wood Sandpiper 115. Curlew Sandpiper
54. Terek Sandpiper 116. Broadbill Sandpiper
55. Common Sandpiper 117. Ruff
56. Ruddy Turnstone 118. Brownheaded Gull
57. Rednecked Phalarope 119. Blackheaded Gull
58. Woodcock 120. Whiskered Tern
59. Whitewinged Black Tern 121. Blackbellied Tern*(facing severe threat)
61. Gull-billed Tern 122. Little Tern*
62. Indian River Tern* 123. Indian Skimmer*(facing severe threat)
���

WETLANDS MANAGEMENT ANDCONSERVATION: POLICY ISSUES &
STRATEGY OPTIONS
i. Inaugural speech by Shri Namo Narain Meena, Hon’bleMinister of State, Ministry of Environment & Forests,Government of India.
ii. Keynote Address by Shri V L Chopra, Member, PlanningCommission
iii. Presentation by Dr. C L Trisal, Director, WetlandInternational, South Asia
iv. Presentation by Shri Ashok Jain, Principal Secretary,Ministry of Environment & Forests, Government ofRajasthan


17
Wetlands and Their Conservation:Strategies and Policy Options with SpecialReference to Rajasthan - Inaugural Speechon October 3, 2007 at Jaipur Rajasthan
By Namo Narain Meena*
1. It is matter of great pleasure for me to be with you on the eve ofNational Seminar on “Wetlands and their conservation: Strategiesand Policy Options with special reference to Rajasthan”, beingorganized by Social Policy Research Institute, Jaipur. During the20th century while the world’s population tripled, freshwaterwithdrawal increased 6 times, reflecting massive urbanization,growing dependence on irrigated agriculture and rising standardsof living. 2.3 billion people live around the rivers where there arefrequent water shortages and 1.7 billion of these people live in theareas where water is scarce. In addition, 1.1 billion people do nothave access to safe drinking water and as such 3 million people dieevery year, many of them children, due to various water bornediseases.
2. Wetlands are lands, transitional between terrestrial and aquaticsystems where the water table is usually at or near the surface, orthe land is covered by the shallow water. They are classified intodifferent types based on their origin, vegetation, nutrient status,thermal characteristics, like Glaciatic wetlands (Tso Morari inJammu and Kashmir, Chandertal in Himachal Pradesh), Tactonic
* Hon’ble Minister of State, Ministry of Environment & Forests, Government of India.

18
Wetlands (Nilnag in Jammu and Kashmir, Khajjiar in HimachalPradesh, and Nainital and Bhimtal in Uttaranchal), OxbowWetlands (Dal, Wullar in Jammu and Kashmir and Loktak lake inManipur and Deepar Chilika in Orissa), Crater wetlands (Lonarlake in Maharashtra), Salt water wetlands (Pangong Tso in Jammuand Kashmir and Sambhar in Rajasthan), Urban wetlands ( Dallake in Jammu and Kashmir, Nainital in Uttaranchal and Bhoj inMadhya Pradesh), Ponds/Tanks, man-made wetlands (Harike inPunjab and Pong Dam, Himachal Pradesh), Reservoirs (Idukki,Hirakud dam, Bhakra-Nangal, Govind-Sagar), Mangrove(Bhitarkanika, Orissa), Coral reefs (Lakshadweep), Creeks (ThaneCreek, Maharashtra).
3. Most widely used definition is of Ramsar Convention as givenbelow:
“Wetlands are areas of marsh, fen, peatland or water, whethernatural or artificial, permanent or temporary, with water that isstatic or flowing, fresh, brackish or salt, including areas of marinewater, the depth of which at low tide does not exceed six metres.”
4. Wetlands are seriously threatened from encroachment, reclamationthrough drainage and landfill, pollution (discharge of domestic andindustrial effluents, disposal of solid waster), hydrologicalalterations (water withdrawal and inflow changes) and over-exploitation of their natural resources. These impacts are causingsignificant loss of biodiversity and serious disruption in goods andservices provided by wetlands.
5. In order to ensure the health of wetlands, we have to find ways touse them wisely. By using wetland resources wisely, we not onlyhelp them conserve but also get economic benefits. A shiningexample is of East Kolkata wetlands which produces 11000 tons offish and 5500 tons of vegetables per year as well as provide cleanwater for paddy fields after treating sewage.
6. To protect and conserve wetlands, there are a number of laws inexistence like Forest Act, 1927; Forest Conservation Act, 1980; theWildlife Protection Act, 1972; the (Prevention & Control of Pollution)Act, 1974; the Water (Prevention & Control of Pollution) Cess Act,

19
1977 and the Umbrella provision of Environment (Protection) Act,1986. There is no exclusive legal framework for wetlandconservation in the country. As such, we need to have someregulatory mechanism to prevent their unacceptable degradationlike reclamation & conversion to non-wetland uses, discharge of rawsewage & un-treated effluents, water inflow and withdrawals, nonoptimal excess resource extraction (e.g. fishing) etc.
7. Realizing the importance of wetlands National WetlandConservation programme has been launched in my Ministry, where100% assistance is given to the concerned State Governments foridentified wetlands under National Wetland ConservationProgramme for activities like data collection and survey,identification of problems, mapping of wetlands, landscapeplanning, hydrology, eutrophication abatement, aquatic weedcontrol, wildlife conservation, fisheries development,environmental awareness and research on various aspects ofwetland processes and functioning. Maintenance and developmentwill be the responsibility of the State Govt. as all conservation effortsneed to be sustained even after the completion of the activities forconservation of a wetland in question.
8. Wetlands are threatened due to global warming and climate change.High altitude wetlands, which are considered as fresh water towersof the world, assume more significance as they effect wetlands downstream. Water is becoming a scarce commodity day by day androle of wetlands as re-charging of aquifers assumes greatsignificance. As such, we have to concentrate our efforts in betterways for conserving them through proper institutional mechanism,adequate inventorization, capacity building, collecting appropriatebaseline data on research, sharing of information, establishingproper synergy and linkages, and blending traditional knowledgewith latest scientific techniques.
9. Some of the significant steps taken by the Ministry includeidentification of major wetlands for conservation on the basis oftheir importance, ecological characters, representativeness,biodiversity, cultural & religious importance, supportingindigenous fish, important source of food & fodder, recreation &

20
eco-tourism.
10. Taking into consideration importance of wetlands, NationalEnvironment Policy approved by Cabinet recognizes the numerousecological services rendered by wetlands. The Environmental Policyidentifies the following six-fold Action Plan.
1) Set up a legally enforceable regulatory mechanism foridentified valuable wetlands to prevent their degradation andenhance their conservation. Develop a national inventory ofsuch wetlands.
2) Formulate conservation and prudent use strategies for eachsignificant catalogued wetland, with participation of localcommunities, and other relevant stakeholders.
3) Formulate and implement eco-tourism strategies for identifiedwetlands through multi-stakeholder partnerships involvingpublic agencies, local communities and investors.
4) Take explicit amount of impacts on wetlands of significantdevelopment projects during the environmental appraisal ofsuch projects; in particular, the reduction in economic valueof wetland environmental services should be explicitlyfactored into cost-benefit analysis.
5) Consider particular unique wetlands as entities with‘Incomparable Values’, in developing strategies for theirprotection.
6) Integrate wetland conservation, including conservation ofvillage ponds and tanks, into sectoral development plans forpoverty alleviation and livelihood improvement, and the linkefforts for conservation and sustainable use of wetlands withthe ongoing rural infrastructure development andemployment generation programmes. Promote traditionaltechniques and practices for conserving village ponds.
11. On the basis of criteria recognized by international RamsarConvention, 1971, some of the major wetlands have been identifiedfor conservation in the country. These were 27 in 2004 which haverisen to 94 in 2006 covering 23 States and one UT. So far, totalamount of Rs. 58.28 crore has been released for conservation and

21
management of wetlands overall till date. Projections for EleventhFive Year Plan for conservation and management of wetlands hasbeen enhanced to Rs. 90 crore. For more integrated approach, thethree major schemes, viz., Conservation of wetlands, Mangroves& coral reefs and National Lake Conservation Plan are beingintegrated under “Conservation of Aquatic Ecosystems” to makeit more cohesive and inter-disciplinary in nature.
12. From Rajasthan two wetlands viz Sambhar and Keoladeo NationalPark have been identified as Ramsar sites of internationalimportance. Sambhar wetland has been identified for conservationand management under National Wetland ConservationProgramme and is the most important wintering area for Lesserand Greater Flamingoes. Financial assistance of an amount of Rs.300.45 lakhs has been released by Govt. of India to the State Govt.for its various catchments area treatment activities like survey &demarcation, contour bunding, drainage line treatment, checkdams, silt detention structures, gabion structures, vegetativemeasures, afforestation, etc.
Keoladeo Ghana National Park is a wetland of international reputeand also a World Heritage site. This wetland is wintering area formany resident and migratory birds and has been the only winteringsite for the central population of rare and endangered Siberiancrane. Ministry provides financial and technical assistance to theState Govt. for strengthening protection, habitat enrichment,improvement of infrastructure and staff, veterinary care, eco-development, etc. An amount of Rs. 158 lakhs has been releasedduring the last five years for establishment of boundary wall aroundthe sanctuary, removal of unwanted vegetation, eco restoration,improving the road network, strengthening protection chokies,augmenting water supply etc.
Rajasthan being a draught prone area there is an urgent need formore water harvesting structures, protection of all wetlandsirrespective of their size as their role for recharging aquifers isimportant for water storage capacity. I will urge Rajasthan stategovt. for identifying more wetlands under national wetlandconservation programme for managing their water resources. All

22
these issues need to be deliberated at length at various technicalsessions so that some meaningful solutions emerge out of thedeliberations for conservation of wetlands in the country in generaland wetlands of Rajasthan in particular.
13. At the international level, our role has been well appreciated. Indiais the only country which has the most heterogeneous mix of 25wetlands identified as Ramsar sites. These include high-altitudewetlands, mangroves, estuaries, oxbow type of wetlands, urban andrural wetlands and so on. Through designating a Ramsar site, wepromote conservation and wise use of wetlands throughmanagement action plans, which is implemented with theparticipation of all stakeholders. If the site is under threat, we canput it under Montreaux Record. Ramsar Conservation Award toIndia in 2002 for ecological interventions in Chilka wetland hasindeed made us proud of our conservation efforts. We not onlyachieved this feat but also made Chilka wetland to come out ofMontreaux Record. India organized Asian wetland symposium inFebruary 2005 at Bhuvneshwar, attended by 34 countries from Asianregion. Our country also organized a capacity building workshopon High altitude wetlands in Himalayas at New Delhi during June,2006 in collaboration with ICIMOD and WWF- India. We alsoorganized a meeting of Board of Directors of Wetland Internationalin India in October 2005 which is a partner organization of RamsarConvention, which was attended by 23 countries.
14. The Social Policy Research Institute has been engaged in workingin the field of health, education and watershed development,particularly to sharpen the effectiveness and impacts of public andsocial policies, by uncovering bottlenecks for better understanding,cooperation and promotion for ultimate realization of such policies.I am sure that deliberations, in general and Rajasthan in particularwill be taken care of. Thematic areas of cultural and ethical aspects,poverty alleviation for communities depending on wetlandresources for their livelihood, problems of water harnessing andlong term conservation planning are to be addressed in such amanner as to yield tangible results. I wish all success for theworkshop.

23
“Wetlands and their Conservation:Strategies and Policy Options” – Key NoteAddress
By Dr V L Chopra*
It gives me great pleasure to address this National Seminar on“Wetlands and its Conservation: Strategies and Policy options”, and sharewith you some thoughts about the Wetlands and their importance inIndia.
Wetlands are among the earth’s important freshwater resources.Wetlands provide many services and commodities to humanity. Eachwetland is ecologically unique and is recognised for its economic,cultural, scientific and recreational value. Wetlands perform numerousvaluable functions such as water storage and conservation; protectionfrom storms and floods; recharge of ground water; purification of water;support to fisheries; agriculture and wildlife resources; transport;recreation, etc. For various reasons, however, wetlands are under severethreat currently.
Wetlands in Asia have traditionally provided people with ecologicalsecurity and livelihood support through their varied processes andfunctions. Increasing population pressures and receding awareness abouttheir relevance and importance have led to degradation of wetlands.Their increased vulnerability has caused serious deprivation for localusers. There is thus, an urgent need to address the challenges posed byunbalanced sectoral development on the one hand and poverty and
* Member, Planning Commission, Govt. of India

24
inadequate capacity for effective restoration and management ofwetlands on the other.
The Ramsar Convention had highlighted the pivotal role of wetlandecosystems and identified them as the starting point for all integratedwater management strategies. Sustainability of development can beensured only by maintaining health of the wetlands which are the sourceof freshwater, besides being the main stay of livelihood of surroundingrural population.
India is richly endowed with wetlands. These range from the high-altitude lakes of the Himalayas to floodplain wetlands of major riversystems and their extensive network of tributaries draining from theIndian landmass in all directions. They are fragile ecosystems susceptibleto damage even with minor changes in their surroundings. They arethreatened due to inadequate water holding capacity, excessivewithdrawal, pollution due to raw sewage and sullage, industrialeffluents, eutrophication, leached fertilizers and insecticides. Theimposed excesses necessitate restoration and formulation of conservationstrategies for sustainable management of wetlands.
The degradation of wetlands caused by unsustainable developmentshould be urgently halted and reversed, and knowledge based strategiesand techniques adopted for conservation and restoration of wetlandecosystems and livelihood improvement of communities. The culturalvalues of wetlands which have great relevance to communities aroundwetlands have to be recognized and integrated into wetland managementpractices.
Innovative ecosystem based approaches have to be adopted topromote wetland conservation and management to support sustainablelivelihoods. There is need to promote biodiversity conservation andsustainable use of wetland resources. Traditional knowledge and wisdomof local people can greatly help this effort. Documentation and respectfor cultural heritage and values justifies creation of a platform forconservation and management. Supporting local livelihoods throughtraditional knowledge base and eco-enterprises, including eco-tourism,and promoting public-private partnerships, can add value to wetlandproducts and help in generating additional income and reducing pressure

25
on wetland resources
Adopting wetland conservation and management policies, plansand strategies into sectoral development planning at all levels is necessaryto ensure sustainable development. Identifying, promoting, andreplicating successful case studies and pilots of partnerships for wetlandmanagement and conservation and disseminating these examples atlocal, national and regional levels will help in creating awareness andpromote change of attitudes and perceptions towards sustainablewetland management. Developing, strengthening and promoting ofcapacity building programs for wetland managers, policy makers,planners, practitioners, media, decision makers and local communitieswill restore wetlands and maintain their ecological integrity andproductivity to sustain local livelihoods.
This seminar on Wetland Conservation presents a good platformfor Government Agencies and citizen groups to create synergies andspread the message of conservation through appropriate means. I wishyou all very fruitful deliberations and shall look forward to outputs ofthese deliberations.
���

26
Integrated Management of Wetland:Policy and Strategies
By C L Trisal*
WETLAND MANAGEMENT:
Wetlands are at present not integrated into sectoral developmentalplans, values and functions of wetlands not recognized and integratedinto policy and institutional frameworks. Experience all over points thathydrology is the key factor determining values and functions of wetlands.Hydrology needs to be concentrated on for management of wetlandsbeing a function of socio-economics and biodiversity considerations.
WETLANDS AND RIVER BASIN MANAGEMENT:
Researches have indicated that inland wetlands belong to riverbasin system which is a natural unit for sustainable wetland conservationand management. This is amply substantiated by an interconnectivityof wetlands within a basin ranging from high attitude to coastal regionand so also changes at one level which impact the other being parts of asingle unit.
Wetland and Human beings are intimately connected and as suchtheir participation is very important for drawing benefits of a wetlandsuch as products obtained from ecosystems, regulatory and non materialbenefits, and environmentally clean and safe shelter resulting in abilityto be adequately nourished and having energy to keep warm and coolsocio-economic systems.
* Director Wetlands International, Southasia, New Delhi.

27
REGULATORY REGIMES FOR WETLANDS:
Regulatory regimes need be framed taking into account a matrixof its functions, and biotic stresses with weightages being assignedspecially for anthropogenic threats, conversion, pollution, water inflow/withdrawls.
Dependent on the case studies on existing wetlands such as Loktak,Chilka Lake and Rudrasagar, a formulation of Management Action Planat River Basin level need be undertaken with hydrological interventionfor lake restoration, participatory watershed management andenvironmental flow assessment for maintaining ecological character oflake.
The management process may be through Stakeholder ExecutiveCommittee and Project Steering Committee composed of Technical CoreGroup and Community Consultation Group
INTERGRADED MANAGEMENT OF WETLANDS OF RAJASTHAN:
The key issues of water allocation biased towards human ignoringecological demands, patch level approaches focused at few sites, absenceof linkages of water regimes with biodiversity and socioeconomics,sectoral approaches focused on engineering measures ignoring ecologicalaspects, ineffective institutional mechanism could be resolved by anintegrated Wetland Management planning framework followingMultiscalar, hierarchical approach for wetland inventorisation andassessment (Fig. 1)
Fig. 1 : Multiscalar, hierarchical approach for wetland inventorisation and assessment

28
WAY AHEAD
A way ahead could provide through establishment of institutionalmechanisms for coordinated actions at river basin level, development ofwater allocation policy harmonizing human uses with ecologicalrequirements, systematic and hierarchical inventorisation and assessmentto support management planning, involvement of stakeholders,particularly local community at all levels of planning andimplementation, communication, education and public awareness, beingthe important parts of management strategies.
���

29
Wetlands and their Conservation:Strategies and Policy Options with SpecialReference to Rajasthan
By Ashok Jain*
INTRODUCTION:
Wetland may be defined as “Areas on which water covers the soilor if water is present either at or near the surface of that soil”. Wetlandsof India are largely associated with major rivers and coastal areas. RamsarConvention, an international body dealing with the management andconservation of the Wetlands world over came into force in 1975. Indiasigned the convention in 1981. Chilka Lake (Orissa), Keoladeo BirdSanctuary (Rajasthan), Sambhar Lake (Rajasthan), Loktak Lake(Manipur), Harike Lake (Punjab), Wullar Lake ( J & K) are the sites whichfulfilled several of the required qualities of being referred to as Ramsarsites of international importance.
RAMSAR SITE OF RAJASTHAN
As far as Rajasthan is concerned Keoladeo Bird Sanctuary,Bharatpur (Fig. 1) located between latitude 27°13’ and longitude 77°32’with a total area 2873 hectares is a part of the Indogangetic Great Plains.Natural vegetation of the sanctuary is dry deciduous type having 353species of birds so far identified. It is known for nesting of its residentbirds and visiting migrating birds specially rarest Siberian cranes whoarrive in winter.
* Chairman, Rajasthan Pollution Control Board, Jhalana Institutional Area, Jaipur.

30
Fig. 1 Keoladeo National Park
Fig. 2 Sambhar Lake Wetland
Sambhar Lake (Fig. 2) is India’s largest salt lake with a total area24000 hectares. The vegetation present in the catchments area is mostlyxerophytic type and it is famous for harbouring flamingos in large

31
numbers. Siltation, soil saliniation and discharge of sewage from thetown are the major problems.
IMPORTANCE OF WETLANDS
Wetlands provide services of great value to society, control floodsand host a great diversity of species. It harbours cultural and economicalimportance while maintaining ecological balance and provide nestingenvironment to the birds
THREATS TO WETLANDS
The major threats to wetlands are urbanization, anthropogenicactivities, hydrological activities such as canals, diversions etc., pollutionlikewise dumping of waste water, sewage, solid waste; salinization dueto overdrawal of water; climate change such as high temperature, shiftin precipitation etc.
POLICY FOR WETLANDS
As of now no policy exists at State level as a result of which in thelast 5 decades 70% of wetlands in the Gangetic flood plains have beenlost and wetlands are disappearing at the rate of 2-3% every year.
The intrinsic studies would tend to show that essential ingredientsof policy should cover all wetlands, should have both preventive anddevelopmental measures (restoration) and should encompass relevantsectors viz ecology, flora & fauna, pollution abatement. Since themanagement of wetland involve several disciplines all relevantdepartments, civil society and scientific community need jointly workingwhile following a proper regulatory framework to prevent depletion ofwetlands.
���


33
ENGINEERED WETLANDS
i. Sustainable Treatment of Domestic and IndustrialWastewaters significance of Constructed Wetlands by Dr.Shyam Asolekar and K M Chaturvedi
ii. Sustainability of wetlands requires systematic scientificstudies of their hydrological balance by Dr. S.M.Seth


35
Sustainable Treatment of Domestic andIndustrial Waste waters: Significance ofConstructed Wetlands
By Dr Shyam R. Asolekar and Manoj K. M. Chaturvedi*
INTRODUCTION
Urbanization, which is proceeding at an accelerated speed aroundthe world, has posed several new problems before urban residents.Inadequate water supply and poor water quality have been provokingserious contemporary concerns for many municipalities, industries,agriculture and the environment. Communities are thirsty for potableas well as process waters. It has not been possible for communities livingin the slums to get even 10L of water per person per day. On one hand,there is an escalating demand for water for domestic, agriculture, aswell as industrial purposes. On the other hand the available water isgetting deteriorated as a result of disposal of domestic and industrialeffluents [Asolekar and Gopichandran, 2005].
In the last two decades, several attempts have been made to developalternative and appropriate systems for wastewater treatment with amajor focus on reduction of the use of non-renewable resources (Geberand Björklund, 2002). Although up to certain extent environmentalengineering could also be advantageous to a local or regional levelthrough controlled abatement of the pollution besides it also poses somedisadvantages to the contiguous ecosystem, either by transference ofpollutants produced by it self, such as flushed water and dredged sludge,
* Centre for Environmental Science and Engineering, Indian Institute of Technology Bombay, Powai,Mumbai 400 076, INDIA

36
or by some new pollution produced from another industry supplyingthe energy or equipment to the environmental engineering. It may result,more or less, in disturbance to the whole.
APPROPRIATENESS OF TREATMENT TECHNOLOGIES
Several features can characterize an appropriate wastewatertreatment technology:
• The technology should be low-cost and have minimum possiblemechanization, which reduces the risk of malfunction,
• The technology should be simple to operate, locally manufactured(at least constructed) as well as labour intensive (rather than powerintensive),
• The technology should not rely upon expensive chemical inputs,such as chlorine for tertiary pathogen reductions to meet qualityguidelines, and should be able to recover and reuse the resourcesas far as possible; and
• The technology should be capable of being incrementally upgradedas user demand or quality standards and treatment guidelinesincrease (Chaturvedi, Langote, and Asolekar, 2002).
Further to this, the good engineering design and performancecontrol of such systems are urgently needed, to ensure the sustainabilityand productivity of the system. Therefore, “appropriate” wastewatertreatment technologies are required to enable communities to own,operate, and maintain the process equipments and the technology forwastewater management and, at the same time, offer ecological,environmental and societal benefits (Chaturvedi and Asolekar, 2001).
CONSTRUCTED WETLANDS (CWS):
Constructed Wetlands are typical natural engineered treatmentsystems, designed and constructed to utilize the natural processesinvolving wetland vegetation, soils, and their associated microbialassemblages to assist in treating the wastewater. They have been gainingincreasing international interest and now being assumed to be highlyapplicable in developing countries, due to their characteristic propertieslike utilization of natural processes, simple construction, simple operation
37
and maintenance (O/M), process stability, and above all its costeffectiveness.
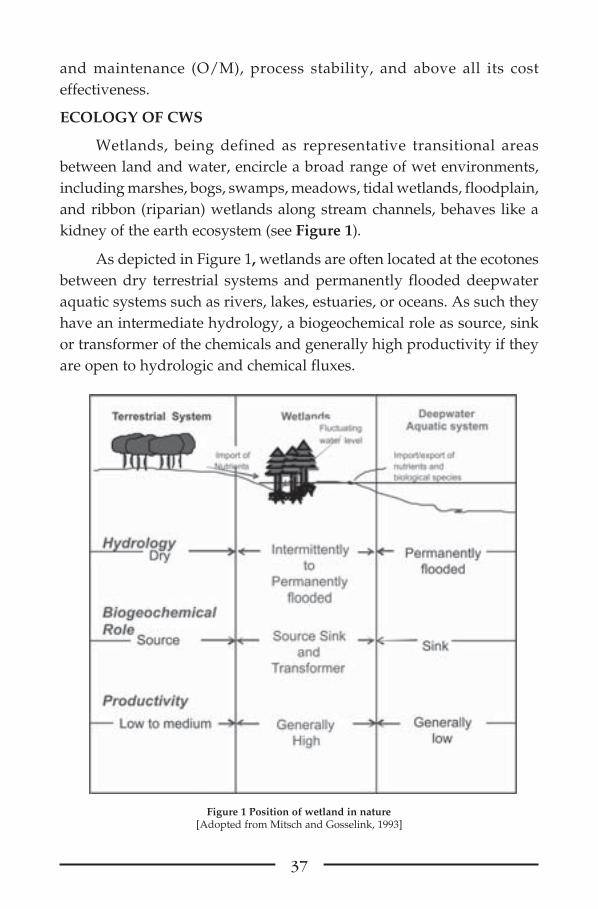
ECOLOGY OF CWS
Wetlands, being defined as representative transitional areasbetween land and water, encircle a broad range of wet environments,including marshes, bogs, swamps, meadows, tidal wetlands, floodplain,and ribbon (riparian) wetlands along stream channels, behaves like akidney of the earth ecosystem (see Figure 1).
As depicted in Figure 1, wetlands are often located at the ecotonesbetween dry terrestrial systems and permanently flooded deepwateraquatic systems such as rivers, lakes, estuaries, or oceans. As such theyhave an intermediate hydrology, a biogeochemical role as source, sinkor transformer of the chemicals and generally high productivity if theyare open to hydrologic and chemical fluxes.
Figure 1 Position of wetland in nature[Adopted from Mitsch and Gosselink, 1993]

38
WASTEWATER TREATMENT MECHANISMS
The CWs appears to perform all of the biochemical transformationsof wastewater constituents that take place in conventional energyintensive, environmental engineering based systems including activatedsludge process, septic tanks, drain fields and other form of landtreatments. These systems have also been found to be very effective inremoval of BOD, SS, and nitrogen, phosphorous, metals, trace organics,and pathogens more effectively than conventional means. Howeverphosphorous removal capacity varies from system to system anddepends largely on site-specific factors. This reduction is accomplishedby diverse treatment mechanisms viz. sedimentation, filtration, chemicalprecipitation and adsorption, microbial interactions, and uptake byvegetation. The principal removal and/or transformation mechanisminvolved in the CW systems has been summarized in Table 1. As shownin Table 1, it is difficult to separate constituent removal andtransformation processes, as both occur simultaneously in these systems.
Table 1 : Removal mechanisms in CW systems
Constituents Free water systems Subsurface flow
Biodegradable Bioconversion by aerobic, Bioconversion by facultativeorganics facultative, and anaerobic and anaerobic bacteria on plant
bacteria on plant and debris and debris surfacessurfaces of soluble BOD,adsorption, filtration, andsedimentation ofparticulate BOD
Suspended solids Sedimentation, filtration Filtration, sedimentation,Nitrogen Nitrification/denitrification, Nitrification/denitrification,
plant uptake, volatilization plant uptake, volatilizationPhosphorous Sedimentation, Plant uptake Filtration, sedimentation,
Plant uptakeHeavy Metals Adsorption of plant and debris Adsorption of plant and debris
surfaces, sedimentation surfaces, sedimentationTrace organics Volatilization, adsorption,
biodegradation Adsorption,biodegradation
Pathogens Natural decay, perdition, Natural decay, perdition,UV irradiation, sedimentation, sedimentation, exertion ofexertion of antibiotics from antibiotics from roots of plantsroots of plants
[Adopted from Crites and Techobanoglous, 1998]
39
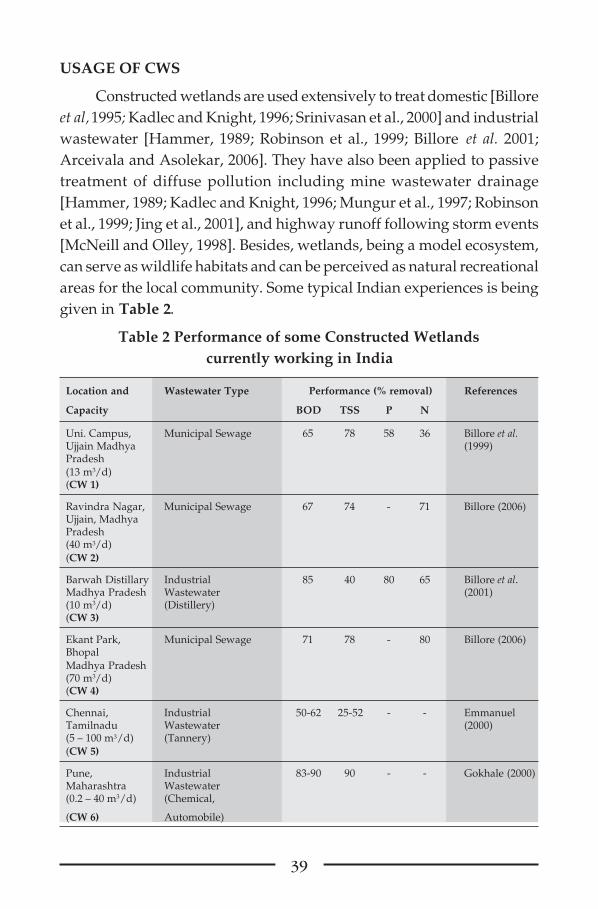
USAGE OF CWS
Constructed wetlands are used extensively to treat domestic [Billoreet al, 1995; Kadlec and Knight, 1996; Srinivasan et al., 2000] and industrialwastewater [Hammer, 1989; Robinson et al., 1999; Billore et al. 2001;Arceivala and Asolekar, 2006]. They have also been applied to passivetreatment of diffuse pollution including mine wastewater drainage[Hammer, 1989; Kadlec and Knight, 1996; Mungur et al., 1997; Robinsonet al., 1999; Jing et al., 2001], and highway runoff following storm events[McNeill and Olley, 1998]. Besides, wetlands, being a model ecosystem,can serve as wildlife habitats and can be perceived as natural recreationalareas for the local community. Some typical Indian experiences is beinggiven in Table 2.
Table 2 Performance of some Constructed Wetlandscurrently working in India
Location and Wastewater Type Performance (% removal) References
Capacity BOD TSS P N
Uni. Campus, Municipal Sewage 65 78 58 36 Billore et al.Ujjain Madhya (1999)Pradesh(13 m3/d)(CW 1)
Ravindra Nagar, Municipal Sewage 67 74 - 71 Billore (2006)Ujjain, MadhyaPradesh(40 m3/d)(CW 2)
Barwah Distillary Industrial 85 40 80 65 Billore et al.Madhya Pradesh Wastewater (2001)(10 m3/d) (Distillery)(CW 3)
Ekant Park, Municipal Sewage 71 78 - 80 Billore (2006)BhopalMadhya Pradesh(70 m3/d)(CW 4)
Chennai, Industrial 50-62 25-52 - - EmmanuelTamilnadu Wastewater (2000)(5 – 100 m3/d) (Tannery)(CW 5)
Pune, Industrial 83-90 90 - - Gokhale (2000)Maharashtra Wastewater(0.2 – 40 m3/d) (Chemical,
(CW 6) Automobile)

40
CASE STUDY: SEWAGE TREATMENT PLANT AT UJJAIN, M. P
With an embodied aim of improving and advocatingcomprehensive treatment of wastewater utilizing low-cost technologies,about three year ago a constructed wetland system in the Ravindranagarresidential neighborhood in urban Ujjain was installed which has noweliminated this source of pollution to the Kshipra River (see Figure 2)[Billore, 2006].
It works with the help of a perennial reed (Phragemitis karka), whichis found in abundance in Indian plains around water streams andswampy areas. The dense root planted in the gravel bed supportsthousands of micro-organisms, protozoa, metazoan and a complete foodchain system that kill harmful microbes and decontaminate the pollutantsin the waste water. The hollow grass acts as an oxygen pump and throughits root canal diffuses and oxygenates the wastewater. The gravity-basedsystem has an entrance at one end through which the wastewater flowsin and an outlet at the opposite end for collection of the treated water.
Average treatment performance after five months from theinstallation SF system recorded removal efficiencies of 78% for NH4-N,TSS; 58-65% for P, BOD and TKN. Effluent dissolved oxygen levelsincreased to 34% indicating existence of aerobic conditions in the rooted-gravel bed. The SF system overall results established: (a) very cost-effective treatment technology, (b) SF removal efficiency above 50% forBOD, NH4-N, TKN, and P. This SF system presents a unique designconsideration compared with the land-intensive Kickuth standard systemdesign.
ADVANTAGES, DISADVANTAGES, AND FUTURE PROSPECTS
This emerging technology has enormous potential for applicationof in our country, as our country’s climate is conducive for higherbiological activity and productivity, hence can harness betterperformance of wetland systems. Further to this our regions are knownto sustain a rich diversity of biota that may be used in wetlands. Althoughland may be a limiting factor in dense urban areas (class 1 cities),constructed wetlands are potentially well suited to smaller communities(class-2 & 3) and for our 5 lacks Villages, where municipal landsurrounding schools, hospitals, hotels and rural areas is not in short

41
supply. If, for the sake of simplicity, capital investment costs are takeninto account, conventional activated sludge process costs Rs. 600-700per capita; assuming each person contributes average 180 L volume and50 g of BODL every day whereas the cost for stabilisation ponds could beRs. 150-200 per capita.
As stated earlier, that constructed wetlands are very similar to wastestabilization lagoons from a maintenance and operational perspective,therefore the cost for waste stabilization can be taken as say 200 percapita/day
Thus, the difference in the cost is about Rs.500 per capita whichcould be applied towards purchase of land. At what price is land“reasonable” to buy? While it is a tricky question to answer, based onthe above example; the maximum price one can pay will be 250 Rs/m2
because the constructed wetlands will be Rs. 500 per capita cheaper. Infact, the break-even price of land could even be higher if the comparisonof O&M costs is applied towards land purchase.
Constructed wetlands have been implemented as wastewatertreatment facilities in many parts of the world, but to date, the technologyhas been largely ignored in developing countries in general and ourIndian sub-continent in particular, where effective, low cost wastewater
Figure 2 Constructed wetlands at Ravindranagar, Ujjain, Madhya Pradesh

42
treatment strategies are urgently needed. Given the appropriate climaticcondition of our country, CWs may be successfully established with plantspecies acclimated to the tropical environment and able to be harvestedfor use in secondary functions like fuel production.
ACKNOWLEDGEMENTS
The author acknowledges partial funding from the SwedishInternational Development Cooperation Agency (Sida) and EuropeanUnion (EU) for pursuing research in natural treatment systems.
REFERENCES
1. Arceivala, S. J. and Asolekar, S. R. [2006] Wastewater Treatment forPollution Control and Reuse, Tata McGraw-Hill Publishing CompanyLimited, New Delhi.
2. Asolekar, S. R. and Gopichandran, R. [2005] Preventiveenvironmental management– an Indian perspective, FoundationBooks Pvt. Ltd., New Delhi, 2005 (the Indian associate of CambridgeUniversity Press, UK).
3. Billore, S. K., Bharadia, R., and Kumar, A. [1998]. Potential Removalof Particulate Matter and Nitrogen through Roots of Water Hyacinthin a Tropical Natural Wetland. Current Science. 74 (2): 154-56.
4. Billore, S. K., Das, P., and Vyas, H. [1994]. Ammonia Volatilizationthrough Plant Species in Domestic Wastewater Applied Agriculturefield and Wetland. In: Preprint Volume 1 of the 4th InternationalConference on the Wetlands System for Water Poll. Control.Guangzhou:171-179.
5. Billore, S. K. [2006] Head of Institute of Environment Managementand Plant Sciences, Vikram University, Ujjain. Personalcommunications, October 2006.
6. Billore, S. K.; Singh, N.; Ram, H. K., Shrama, J. K.; Singh, V. P.;Nelson; R. M.; and Das, P. [2001]. Treatment of molasses baseddistillery effluent in a constructed wetland in central India. WaterScience and Technology. 44(11): 441-448.
7. Chaturvedi, M. K. M. and Asolekar, S. R. [2001]. “PotentialApplications of Phytoremediation in Treatment of Contaminated

43
Soils and Aquifers”. Technical Poster in the proceedings of the 4th
Annual Conference of Indian Environmental Association entitled,“Hazardous Waste Management” at Mumbai June 1-2, 2001.
8. Chaturvedi, M. K. M., Langote, S. D., and Asolekar, S. R. [2002].“The Third World Needs to Make Appropriate Choices forTreatment of Domestic Wastewaters”. In Newsletter Publishedunder Asian Regional Research Programme on EnvironmentalTechnology (ARRPET) Asian Institute of Technology, Vol. 3 March2002.
9. Crites R. W. and Tchobanoglous G. [1998] Small and DecentralizedWastewater Management Systems. McGraw-Hill Education -Europe, 1998
10. Emmanuel, K. V. [2000] Application of Constructed Wetland inTertiary Industrial Effluent Treatment – UNIDO’s Experience. In:Proceeding of International Conference on Constructed Wetlands:Wastewater Treatment in Tropical and Sub-tropical Region,organized by Indo German Projects at Centre for EnvironmentalStudies (CES-GTZ), Anna University, Chennai, India and CentralPollution Control Board (CPCB-GTZ) Delhi India on December 11-13, 2000.
11. Geber, U. and Björklund, J. [2002]. “The Relationship BetweenEcosystem Services and Purchased Input in Swedish WastewaterTreatment Systems -a Case Study”. Ecological Engineering, 18(1):39-59.
12. Gokhale, A. [2000], Experience with Sewage and Industrial EffluentTreatment using Indian Reed Bed Systewms. In: Proceeding ofInternational Conference on Constructed Wetlands: WastewaterTreatment in Tropical and Sub-tropical Region, organized by IndoGerman Projects at Centre for Environmental Studies (CES-GTZ),Anna University, Chennai, India and Central Pollution ControlBoard (CPCB-GTZ) Delhi India on Dec. 11-13.
13. Hammer, D. A. [1998], Constructed Wetlands for WastewaterTreatment. Lewis Publisher, Chelsea, pp319-351.
14. Jing, S.R., Lin, Y.F., Lee, D.Y., and Wang, T.W. [2001] Nutrient

44
Removal from Polluted River Water by Using ConstructedWetlands, Bioresource Technology, 76(2), 131-135.
15. Kadlec, R. H. and Knight, R.L. [1996] Treatment Wetlands, LewisPublishers, Boca Raton, New York, London, Tokyo.
16. McNeill and Olley, S. [1998] The effects of motorway runoff onwatercourses in south-west Scotland. J. CIWEM, 1998, 12, 433¯439.
17. Mungur, A.S., Shutes, R. B. E., Revitt, D. M., and House, M. A.,[1997] An Assessment of Metal Removal by Laboratory ScaleWetland. Water Science and Technology, 35(5), 125¯133.
18. Robinson, H., Harris G., Carville M., Barr, M., and Last, S. [1999]The use of engineered reed bed system to treat leachate atmonument hill landfill site, Southern England. In: Mulamoottil, G.McBean, E.A., and F. Rovers, eds. Constructed Wetlands for theTreatment of Landfill Leachates. Lewis Publishers, Boca Raton, FL7.pp 71-79.
19. Srinivasan, N., Weaver, R.W., Lesikar B.J., and Persyn, R. A. [2000]Improvement of domestic wastewater quality by subsurface flowconstructed wetlands, Bioresource Technology, 75(1),19¯25.
20. Mitch, W. J., and Gosselink, J. G. [1993]. Wetlands (Second Edition).Van Nostrand Reinhold, New York.
���

45
Sustainability of Wetlands RequiresSystematic Scientific Studies of TheirHydrological Balance
By Dr. S.M.Seth*
1.0 INTRODUCTION
Wetlands are one of the most threatened habitats of the world.Wetlands in India, as elsewhere are increasingly facing severalanthropogenic pressures. The rapidly expanding human population,large-scale changes in land use/land covers, burgeoning developmentprojects and improper use of watersheds, all these have caused asubstantial decline of wetland resources of the country. Significant losseshave resulted from its conversion threats from industrial, agriculturaland various urban developments. These have led to hydrologicalperturbations, pollution and there effects. Unsustainable levels of grazingand fishing activities have also resulted in degradation of wetlands.
There is still much about wetlands that is not known. There is a lotto be learned about the role of these resources in the landscape and howhumans and natural systems benefit from their presence. More study isneeded before it can be fully understood how these complex ecosystemsperform their varied functions.
There is a necessity for research in the formulation of a nationalstrategy to understand the dynamics of these ecosystems. This could beuseful for the planners to formulate strategies for the mitigation of
* Director General, Poornima College of Engineering, JaipurFormer Director, National Institute of Hydrology, Roorkee

46
pollution. The scientific knowledge will help the planners inunderstanding the economic values and benefits, which in turn will helpin setting priorities and, focusing the planning process. For achievingany sustainable success in the protection of these wetlands, awarenessamong the general public, educational and corporate institutions mustbe created. The policy makers at various levels, along with site managers,need to be educated. Because the country’s wetlands are shared, the bi-lateral cooperation in the resource management needs to be enhanced.Wetlands performs a variety of functions on several levels. Thesefunctions are a great benefit to human pursuits and to natural systems.Not all wetlands perform every function nor do they perform them atthe same level. The differences in the performance of functions is theresult of the variety of wetland types. These differences are furtheremphasized by variations between individual wetlands within a specifictype.
1.1WETLANDS IN INDIA
India, with its annual rainfal1 of over 130 cm, varied topographyand climatic regimes, supports and sustains diverse and unique wetlandhabitats. The current loss rates in India can lead to serious consequences,where 74% of the human population is rural (Anonymous, 1994) andmany of these people are resource dependent. Healthy wetlands areessential in India for sustainable food production and potable wateravailability for, humans and livestock. They are also necessary for thecontinued existence of India’s diverse populations of wildlife and plantspecies; a large number of endemic species are wetland dependent. Mostproblems pertaining to India’s wetlands are related to human population.India contains 16% of the world’s population, and yet constitutes only2.42% of the earth’s surface. The Indian landscape has contained fewerand fewer natural wetlands over time. Restoration of these convertedwetlands is quite difficult once these sites are occupied for non-wetlanduses. Hence, the demand for wetland products (e.g. water, fish, wood,fiber, medicinal plants, etc.) will increase with the increase in population.National wetland strategy should encompass (i) Conservation andcollaborative management, (ii) Prevention of loss and promotion ofrestoration and (iii) Sustainable management. These include : (1)Protection (2) Planning, Managing and Monitoring (3) Comprehensive

47
Inventory (4) Legislation (5) Coordinated Approach (6) Research (7)Building Awareness
2.0 ARID AND SEMI ARID AREAS - MANAGEMENT ISSUES:
It is expected that in coming years also much of the populationgrowth will take place in arid lands, particularly in cities that willaccelerate the demand for water for domestic, industrial and other uses.Further more, since the developed lands are already exploited, attentionis increasingly turned towards semiarid and arid regions to releasepopulation pressure. There is need for proper understanding, continuousmonitoring and scientific assessment of effect of human activities on landand water resources in these regions for effective and sustainablemanagement of supplies and demands.
The societies in arid zones have generally developed on traditionalfarming methods, involving rain-fed agriculture and limited withdrawalof groundwater. However, introduction of modern methods, irrigationcanals, electrical pumps, and growth of towns and cities have completelychanged the environmental balance. The variability of precipitation isthe most crucial factor along with high potential evapo-transpiration inthese regions.In planning, developing and managing water resources,the quantity of water available is not the only important variable, thequality is also equally important, particularly in arid zones where thenatural input to the system from rainfall is small. There is greater risk ofsalt accumulation in the soil and groundwater from fertilizers and otheragricultural inputs, and urban and industrial wastes. The sustainabilityand environmental degradation require an increased focus indevelopment and management of land and water resources in arid andsemi arid areas. Wetlands are one of the most threatened habitats of theworld.
3.0 RAJASTHAN STATE
The state of Rajasthan faces severe handicaps in terms of availabilityof water. It roughly possesses 1 percent of the water resources of thecountry though it accounts for nearly 8 percent of the country’spopulation. The availability of water is inadequate compared tominimum needs of the population. The spatial and seasonal fluctuationsin the availability of water are more pronounced due to generally arid

48
and semi-arid climate over most parts of the state. The traditional waysof conserving water have become extinct to a large extent due to changesin habits, urbanization and rise in standard of living. Furthermore,current practices of conveyance and use of water for all major purposes-domestic, irrigation and industry etc. are wasteful. There is need andample scope for conjunctive use of surface and groundwater as singleentity – water.
Rajasthan’s lakes, ponds, marsh lands and grass lands are a havenfor bird lovers. One can find around 550 species of birds and most ofthese are residents. The best colony of birds in the world is KealodeoNational Park situated in Bharatpur.It has more than 400 species of birdsand more than 130 of them breed inside the park. Being a unique birdplace, the UNESCO has recognized it as a world heritage site. It is trulya paradise of feathered life which provides unlimited opportunities tobird watchers. Various other lakes and ponds, spread over the state offerthe enthusiast an opportunity to watch the activities of the birds.
Semi Arid Wetlands of Rajasthan were important water-bodies andrequire active management and restoration. However, generallymanagement of these systems has tended to concentrate on the provisionof flows of appropriate magnitude to sustain wetlands. The role ofsediments is however, neglected. Catchment disturbance due toagricultural development increases the sediments in flood plain ofwetland areas. Sediment accumulation influences habitat quality, surfacetopography and the distribution of water across flood plains during timesof inundation. It also acts as retention storage for nutrients in particulateform as well as for toxic materials discharged with domestic andindustrial wastes. An integrated approach of management of wetlandsrequires due consideration of land and water issues as well as sedimentaspects. The environment management of wetlands has to be consideredside by side with water management.
4.0 SUSTAINABILITY
A primary consequence of sustainability is that the sectarianapproach, in which the different categories of water problems – watersupply, water quality, hydropower etc. – are seen and solved separatelysector-wise. It must give way to a more integrated or holistic view, in

49
which water resources problems are intertwined with societal problemsat many different levels, and in which scientific problems arise in manydifferent water applications. The sectarian view has an old tradition.The field of water resources even today is divided into many sub-areas,in which different aspects of water resources of a region are treatedseparately. This separation is reflected in the scientific and engineeringmethods and design rules, which are, at least in their terminology, fieldspecific.
4.1 SPACE AND TIME SCALES
The translation of sustainability into actions depends on space andtime scales. The smallest space scale is that of the village. It is the basicunit of a sustainable interaction of man and his environment. In it, inancient times, food production, human consumption, and waste disposalare linked in a closed cycle. In theory, such a cycle could be trulysustainable if a stable population would wisely maintain a social structurein which consumption is restricted to the production, in whichproductivity of the fields is stable, and in which the population did notexceed the carrying capacity of the village land.
4.2 CHANGING THE ENVIRONMENT
In earlier years, disturbances of this cycle through climatic changesor through overexploitation by increasing populations – as withovergrazed fields or over utilized forests – was felt directly by the localpeople. They were forced to take corrective action by adjustments oflocal habits, by moving to another location or by expanding the area ofhabitation. However, now in modern times, people began developingtechnologies for changing the environment to suit their needs. To meetwater demands in regions not blessed with sufficient rainfall, ingeniousmethods were developed to increase the water supply. Cities and villagesand, on a larger scale, whole regions and nations form new ecologicalsystems. Man in modern civilizations no longer recognized large scaleecological impacts of his local societal actions.
Disturbances of this cycle through climatic changes – like thatsuffered in the Pueblos of the American Southwest, or throughoverexploitation by increasing populations – as with overgrazed fieldsor overutilized forests – was felt directly by the local people. They were

50
forced to take corrective action by adjustments of local habits, by movingto another location or by expanding the area of habitation. If suchcorrections were not made by the people themselves, nature would forcethem to happen. In later days, people began developing technologiesfor changing the environment to suit their needs. To meet water demandsin regions not blessed with sufficient rainfall, ingenious methods weredeveloped to increase the water supply.
Cities and villages and, on a larger scale, whole regions and nationsform new ecological systems. Sustainability of a village depends on thesale of its products for acquiring machinery and the fertilizer needs toproduce excess food; and wastes are no longer completely disposed oflocally. Instead, they are discharged into rivers or transported to dumps.For such a system, local departures form sustainability are stronglyaffected by an interdependence with the outside: they can becompensated for, or they can be aggravated by, actions in the outsideworld – that is, in the world outside the field of vision or experience ofthe local people. The farther the interactions reach, and the larger theinterconnected system becomes, the less possible it is for a person tosense the feedback effects of local actions. The city dweller knows littleof what his demands do to the villages, and the citizen of one nationknows even less of how his actions influence citizens of other nations.Apart from economic and sociologic implications, this lack of knowledgegives rise to a critical lack of awareness of ecological consequences. Ademonstration of this interaction, which is quite obvious in hindsight, isthe use of the Syr Darya and Amu Darya rivers for irrigation, as describedin Box 1 (from the World Development Report, 1992). Man in moderncivilizations no longer recognized large scale ecological impacts of hislocal societal actions.
4.3 RESEARCH NEEDS FOR ASSESSING ENVIRONMENTALEFFECTS
The regional scale of ecological studies is the watershed or its sub-areas. The eco-systems of many watersheds are imperfectly understoodin the relationships that exist between different kinds of plants, types ofsoil, and groundwater levels and fluctuations. Detailed studies of suchplant communities are required for many different and typical areas, in
51
which the plants and their locations are mapped. Biological studies ofthe interaction of the plant communities as they develop with time givevaluable indications of their vulnerability and resilience. Acceptablediscontinuities in the eco-system should be defined to determine theimpact of hydraulic engineering works and the scale of interference.Monitoring networks and related information systems are necessary toassess impacts on aquatic eco-systems and water quality.
5.0 HYDROLOGY
Hydrology is considered the master variable of wetland ecosystems,driving the development of wetland soils and leading to the developmentof the biotic communities. It can determine plant species composition aswell as the distribution of species within a wetland (for example,vegetation zonation with depth in freshwater wetlands), theirproductivity and capacity for nutrient uptake. Despite this fact,quantitative hydrologic data is not often collected as part of mitigationmonitoring. Hydroperiod (the pattern of water levels over time) has beencalled the most important predictor of future wetland success.Hydrological modifications (at natural or mitigation sites) can drasticallyalter ecosystem processes such as primary productivity and speciescomposition. Some studies have argued that mitigation wetlands cannever achieve parity with natural wetlands if the hydrology is not correct.
Other studies have found that even if hydrologic parity is achieved,restored wetlands may not develop plant communities similar to naturalwetlands. In addition, inadequate hydrologic restoration or hydrologicdisturbance often leads to colonization by invasive species.
5.1 HYDROLOGY OF ARID AND SEMI ARID AREAS
The hydrology of arid and semi-arid areas is substantially differentfrom that in more humid regions. General environmental featurescharacterizing such areas include:
(i) High levels of incident solar radiation
(ii) High diurnal and seasonal temperature variations
(iii) Evaporation is prominent in the hydrological cycle
(iv) Strong winds with frequent dust and sand storms

52
(v) Sporadic rainfall of high temporal and spatial variability
(vi) Extreme variability of short duration runoff events in ephemeraldrainage systems
(vii) High rates of infiltration loss in channel alluvium
(viii) High sediment transport rates
(ix) Relatively large groundwater and soil moisture storage changes
(x) Distinctive geomorphology, with poorly developed soil profiles.
Although the natural geography of the arid and semi-arid zones iscomplex and differs from site to site, the characteristics in common areinfrequent rainfall, drought, poor vegetation cover, low cover ratio,serious soil loss and erosion and high river sediment concentrationsduring the flood season.
5.2 HUMAN INFLUENCE ON THE HYDROLOGIC CYCLE
Watersheds are subjected to many types of modifications, major orminor, for various reasons. In each case the effects must be predictedbefore any modification is undertaken. Watershed changes affectvirtually all elements of hydrologic cycle, especially in the context ofsmall watersheds. There has been a growing need to quantify the impactof major land use changes on hydrology for anticipating and minimizingpotential environmental detriment and to satisfy water requirements ofthe society. Most watershed changes can be distinguished as pointchanges and non-point changes, structural changes such as damconstruction, channel improvement, and detention storage, etc. areexamples of point changes and have usually been known to affectwatershed hydraulics. Forestry, agriculture, mining, and urbanizationare non-point land use changes that affect watershed hydrology.
For incorporation of ecological effects, the interaction of water andthe biosphere need to be studied at scales ranging from point to local.On the point scale one will have to incorporate aspects of vegetationinto the hydrological and hydro-geological processes to extend theunderstanding of the feedback loops between the atmosphere and thesoil. On the point scale one has to determine the plant-sol and waterinteractions needed for assessing environmental impacts of pollutants,

53
such as storm water or sewage, or of chemicals, such as fertilizers orpesticides, on the plant cover. They can also effect on the micro-faunaexisting in the soil, in both the unsaturated and saturated regions.
5.3 HYDROLOGICAL ALTERATION
Alteration in the hydrology can change the character, functions,values and ‘the appearance of wetlands. The changes in hydrologyinclude either the removal of water from wetlands or raising the landsurface elevation, such that it no longer floods.
To the hydrologist, the three water quantity functions that arequoted can be considered as merely a subset of functions associated withthe interactions between wetlands and groundwater/river systems. Thus,it is possible from the hydrological viewpoint to propose a differentstructure to the Table of functions. In doing so, the hydrologist may wellconsider ascribing wetland influence to more specific indices ofhydrological process, such as:
• Evapotranspiration and total river flow contributions
• Groundwater recharge
• Base flow contributions, including annual base flow, dry seasonflow duration, dry season flow magnitude, dry season flowrecession rates
• Flood characteristics, including flood volume generation, flood peakmagnitudes and flood timing
5.4 HYDROLOGICAL FUNCTIONS
Wetlands have many important hydrological functions. They effectboth ground and surface water supplies. They recharge aquifers; serveas surface water sources for wildlife, human consumption, recreation,agricultural irrigation, and industrial processes; and act as cleaning filtersfor the water that passes through them. Of all the hydrological functionswetlands perform, however, the effects they have on the hydrology ofthe surface waters in their specific watershed are perhaps the mostpronounced. Wetlands help reduce the effects of both flood and droughtconditions in a watershed. They function like sponges, storing andreleasing water relative to the amount of water around them. Some

54
wetlands which have a relatively stable hydrology may routinely retaina specific amount of water. During dry periods they may lose some ofthis water to surrounding parched areas and through evaporation andtranspiration. During wet periods they may also have the capacity tostore more water than they usually contain. Wetlands associated withRiverine systems serve as floodways, transporting flood pulses fromupstream to downstream locations and that under normal circumstancesdo support, a prevalence of vegetation typically adapted for life insaturated soil conditions.
There are many types of wetlands, including bogs, fresh water andsalt water marshes and swamps. Wetlands stay wet for any of severalreasons: they are in low areas that stay saturated by rain; they are fedfrom below by ground water that is at or near the surface; they are nearrivers and other bodies of water that flood them periodically; or they aresaturated along the coast by the tide. Wetlands are valuable andproductive in critical ways. They control floods by slowing down rushingwater, thereby, letting it spread out over a broader area and eddy aroundtrees and other vegetation.
Wetlands also help purify water by trapping silt. Wetland soils areclassified as hydric soil. This type of soil is saturated and has little or nooxygen. A variety of chemical reactions occur in hydric soil. Thesereactions affect the nature of the soil over time, changing some of thephysical and chemical properties. The initial composition of the soil,degree of wetness and frequency and duration of flooding determinewhat the soil will look or feel like.
An area with water above the soil surface for 7-21 consecutive daysis considered a wetland. Freshwater wetlands are highly productiveecosystems. Wetlands are sedimentary systems. They accumulate carbon,nitrogen, phosphorus and other materials and exchange them amongthe wetlands, atmosphere and landscape.
Wetlands provide many services and commodities to humanity.Regional wetlands are integral parts of larger landscapes; their functionsand values to the people in these landscapes depend on both their extentand their location. Each wetland thus is ecologically unique. Wetlandsperform numerous valuable functions such as to recycle nutrients, purify

55
water, attenuate floods, maintain stream flow, recharge ground water,and also serve to provide drinking water, fish, fodder, fuel, wildlifehabitat, control rate of runoff in urban areas, buffer shorelines againsterosion and offer recreation to the society. The interaction of man withwetlands during the last few decades has been of concern largely due tothe rapid population growth- accompanied by intensified industrial,commercial and residential development, that further leads to pollutionof wetlands by domestic, industrial sewage, and agricultural run-offs,such as fertilizers, insecticides and feedlot wastes. The fact that wetlandvalues are overlooked has resulted in threats to the source of thesebenefits.
Wetlands are often described as “kidneys of the landscape” (Mitchand Gosselink, 1986). Hydrological conditions can directly modify orchange chemical and physical properties such as nutrient availability,degree of substrate anoxia, soil salinity, sediment properties, and pH.These modifications of the physicochemical environment, in turn, havea direct impact on the biotic response in the wetlands (Gosselink andTurner, 1978). When hydrological conditions in wetlands change evenslightly, the biota may respond with massive changes in speciescomposition and richness and in ecosystem productivity.
Wetlands are important ecosystems internationally recognised, asexemplified by Ramsar Convention. They are diverse in terms of habitat,biota, distribution, functions and uses. Many of the wetlands have losttheir pristine quality and have been transformed to modified ecosystems,but their salient role in the ecosystem function cannot be replaced. Overexploitation due to developmental activities are threatening theirexistence. The protection and effective management of these wetlands isa herculean task. The key to their protection lies in appreciating theirvalue and functions, considering the difference within and betweendifferent wetlands. With fluctuating water levels, varying sources ofwater, changing biota, they have vital physical, chemical, biological andsocio-economic functions. Activities that damage the wetlands and inhibittheir functions, has local, regional, national and global impacts. Evolvinga correct conservation strategy and a sound management plan is essentialin addition to protecting the existing water bodies, and reclaiming and

56
restoring wetlands. Alternatives for human use systems need to be slatedbefore implementing the management agenda.
5.4.1 STREAM FLOW
Wetlands help reduce the effects of both flood and droughtconditions in a watershed. They function like sponges, storing andreleasing water relative to the amount of water around them. Somewetlands which have a relatively stable hydrology may routinely retaina specific amount of water. During dry periods they may lose some ofthis water to surrounding parched areas and through evaporation andtranspiration. During wet periods they may also have the capacity tostore more water than they usually contain.
Wetlands associated with Riverine systems serve as floodways,transporting flood pulses from upstream to downstream locations whilelessening flood peaks. As flow rates increase in a given stream and thewater level rises, wetlands adjacent to a stream “soak up” some of theoverflow. This occurs through the filling of backwater lakes or otherlow lying depressions in the floodplain and by the saturation of soil inotherwise dry regions in the floodplain. This absorption and storage ofexcess water lowers the overall amount of flow that would otherwise becarried by a stream.
When the flow of a stream begins to drop below its normal level,adjacent wetlands drain back into the main stream and augment its flow.These floodplain wetlands work cooperatively with wetlands outsideof the floodplain which store flood waters at higher elevations and slowlydeliver it downstream. Consequently the water that enters the streamthrough this process is much cleaner than when it entered the wetlanddue to the settling out of sediments and the biological uptake of certainconstituents by the hydrophytic plants and micro-organisms containedin the wetlands.
5.5 SPACE-TIME SCALES IN HYDROLOGY
The scope of hydrology is best defined by the hydrologic cycle.Depending on the hydrologic problem under consideration, thehydrologic cycle or its components can be treated at different scales oftime and space. As a consequence, different hydrologic problems may

57
have different space-time scales. The global scale is the largest spatialscale and the watershed, or drainage basin, the smallest spatial scale. Adrainage basin, or watershed, is the area that diverts all runoff to thesame drainage outlet. In between these two scales lie such scales ascontinental, regional and other space scales convenient for hydrologicanalysis. Clearly, the watershed, or drainage-basin, scale is the most basicof all; and all other scales can be constructed by building on the drainagebasin scale. Most hydrologic problems deal with a drainage basin. Itshould be clearly understood that the watershed scale does not usuallyor necessarily coincide with territorial or jurisdictional boundaries thatmight be determined by political or economic considerations. A drainagebasin can be of almost any size. It might be as small as a small parkinglot or as large as Ganga River basin. Large watersheds are usually brokendown into smaller drainage basins to suit the requirements of a particularproblem and to assist in orderly quantitative analysis.
Time scales used in hydrologic studies range from a fraction of anhour to a year or perhaps many years. The time scale used in a hydrologicstudy depends on the purpose of the study and the problem involved.Hourly, daily, weekly, ten daily, monthly, seasonal and annual timescales are common. Sometimes the time interval for the collection of datadetermines the time scale for hydrologic analysis. Hydrologic time scalesoften do not coincide with those used in fluid mechanics or in hydraulicsand likewise do not coincide with political, environmental or economictime scales.
5.6 HYDROLOGICAL WATER BALANCE
The equation is based on the concept of continuity as follows:
Input to the system - Outflow from the system = Change in storagein the system
The various components of the above continuity equation can berepresented in equation form as:
P + Input = Q + ET + Export + Sm + Sg + Sd + L
P + (Ic + Ig) = Q +ET +(Oc + Og) + Sm + Sg + Sd + L
where,

58
P = precipitation
Ic = surface supplies through rivers, canals and drainage fromoutside the basin
Ig = inflow to the groundwater from other basins
Q = runoff
ET = evaporation and evapotranspiration
Oc = surface supplies going out to other basins
Og = ground water outflow from the basin to other basins
Sm = change in soil moisture
Sg = change in ground water storage
Sd = change in depression storage
L = loss through deep percolation
5.7 GROUND WATER BALANCE
Considering the various sources of recharge and charge to theground water reservoir and change in storage in the ground water, thebasic equation of ground water balance based on the concept of continuitycan be written as:
Rr + Rc + RI + Ig + Is = Tp + Og + ET + Es + Sg + L
where,
Rr = natural recharge from precipitation
Rc = recharge due to seepage from rivers, canals, water courses,ponds, reservoirs, etc.
RI = recharge from irrigation and other activities
Is = influent seepage
Tp = withdrawal from groundwater storage
ET = evaporation and evapotranspiration from ground water
Es = effluent seepage
5.8 WATER USE BALANCE
Water use for the growth of crops and other vegetation comes from

59
their root zone. Considering the various sources of supply to and lossesfrom the root zone of crops and vegetation and the change in the soilmoisture of the root zone, the water use balance equation can be writtenfor irrigated areas, unirrigated areas and for water bodies as follows:
E’ = Cc + T’p + IT + PE + Mg - Lc - LI
where, E’ = evaporation from irrigated crops Cc = canal suppliesT’p = supply from groundwater storage for irrigation IT = irrigationsupplies from drains and tanks Mg = contribution from groundwaterirrigated fields Lc = losses from canals and water courses LT = lossesfrom irrigation fields
For un-irrigated crops:
E” = P’E + Mg + E’T
where E” = evapotranspiration from vegetation, unirrigated cropsand natural land P’E = effective precipitation for vegetation andunirrigated fields Mg = contribution from ground water for forests, treesand unirrigated fields
For water bodies:
E = Er + Ec + Ew
where, E = evaporation from water surface Er = evaporation fromsurfaces in rivers, drains, etc.
Ec = evaporation from canals, water courses, etc. Ew = evaporationfrom other water bodies
It may be noted that in above Eq.,
Er = E’ + E” + E
6.0 TYPICAL HYDROLOGICAL STUDIES
Walton, Chapman and Davis (1996) carried out a study fordevelopment and application of the wetlands dynamic water budgetmodel. A Wetlands Dynamic Water Budget Model was developed andapplied to support a large field investigation of processes in the BlackSwamp wetlands of the Cache River between Patterson and Cotton Plant,Arkansas. The model is called the Wetlands Dynamic Water BudgetModel because it provides magnitudes for the water budget components,

60
as well as water depths, discharges, and flow velocities throughout themodeled system. The development of the computer program is basedon concepts and approaches of a number of programs in common use. Itincludes three dynamically-linked modules that include all the majorcomponents of a typical water budget, including precipitation, canopyinterception, overland flow, channel flow, infiltration, evapo-transpiration, and horizontal ground-water flow. The surface-watermodule of the model was applied to the Cache River in Arkansas, andaugmented a comprehensive hydrologic field study by filling data gapsthat occurred due to gage problems and by providing long-termsimulation data for broad areas of the wetland, particularly those faraway from any measurement station. The results demonstrated that thesewetlands are inundated primarily from the backwater produced atdownstream constrictions, rather than from the forward-moving floodwave.
Cole, Brooks, and Wardrop(1997) characterized wetland hydrologyas a function of hydro-geomorphic (hgm) subclass as a key to assessingrelative function over a range of wetland types.
Koreny , Mitsch , Bair , and Wu(1999) characterized regional andlocal hydrology of a created riparian wetland system. Three methods,two laboratory and one in situ, were used to calculate the hydraulicconductivity of the wetland substrate. Hydraulic conductivity valuesand measured vertical gradients were used to estimate seepage loss toground water. Surface-water inflow and outflow dominated thehydrologic budget for the wetland. Precipitation, seepage loss, andevapo-transpiration were minor components of the hydrologic budget.Water seeping from the wetland into the ground-water-flow system hascharacteristics of a local ground-water-flow system. Ground-watermodeling and particle tracking show that water originating from thewetland seeps into the ground water and flows in the local ground-watersystem to the southeast portion of the site. Ground-water travel timeswere estimated to range from 700 to 1,200 days before being dischargedto the Olentangy River.
Hunt, Walker, and Krabbenhoft(1999) characterized hydrology -considered the most important component for the establishment and
61
persistence of wetlands, and the importance of ground-water dischargein natural and constructed wetlands. Hydrology has been hard tocharacterize and linkages between Hydrology and other environmentalconditions are often poorly understood. In this work, methods forcharacterizing a wetland’s Hydrology from hydrographs weredeveloped, and the importance of ground water to the physical andgeochemical conditions in the root zone was investigated. Detailedsampling of nearly continuous hydrographs showed that sites withgreater ground-water discharge had higher water tables and more stablehydrographs. Sub-sampling of the continuous hydrograph failed tocharacterize the sites correctly, even though the wetland complex islocated in a strong regional ground-water-discharge area. By comparingsoil-moisture-potential measurements to the water-table hydrograph atone site, we noted that the amount of root-zone saturation was notnecessarily driven by the water-table hydrograph but can be a result ofother soil parameters (i.e., soil texture and associated capillary fringe).Ground-water discharge was not a significant determinant of maximumor average temperatures in the root zone. High ground-water dischargewas associated with earliest date of thaw and shortest period of timethat the root zone was frozen, however. Finally, the direction andmagnitude of shallow ground-water flow was found to affect themigration and importance of a geochemical species. Areas of higherground water discharge had less downward penetration of CO2
generated in the root zone. In contrast, biotically derived CO2 was ableto penetrate the deeper ground-water system in areas of ground waterrecharge. Although ground-water flows are difficult to characterize,understanding these components is critical to the success of wetlandrestoration and creation efforts.
Ramberg, Wolski and Krah(2006) studied water balance andinfiltration in a seasonal floodplain in the Okavango delta, Botswana.The infiltration values were found to be high compared to other largerecharge wetlands (e.g., the Everglades, the Hadejia-Nguru) and resultfrom a combination of lack of a low permeability surface layer in thefloodplain and strong drainage of floodplain ground water driven byevaporation from the surrounding drylands. High infiltration and lateralground-water flows have major implications for the Okavango Delta

62
ecology, as they provide water to riparian vegetation, affect floodplainnutrient balance, and are part of the process responsible forimmobilization of dissolved minerals.
7.0 RESOURCE CONSERVATION AND MANAGEMENT OFENVIRONMENT
Effective management of the ecosystem is not possible and theprotection and conservation practices may fail. The managementprogrammes should adopt economically sound measures that act asincentives for conservation and sustainable use of resources andcomponents of biodiversity of these habitats. Promoting scientific,technical and socio-economic co-operation with the stakeholders, andimplementing measures that avoid and minimize adverse impacts onbiodiversity should be encouraged.
Integrated management with a collaborative approach, whichbrings together interested parties to incorporate social, cultural,environmental and economic values, needs to be looked into. Socio-economic assessment for conservation, social, cultural, and economicactivities is an essential component in the development of integratedmanagement plans. The second avenue for work focuses on thedevelopment of adaptive responses to water problems and policyapproaches that reflect and respond to uncertainty, change and theabsence of real understanding of systems and their interactions.
8.0 REMARKS
Wetlands are important ecosystems internationally recognized.They are diverse in terms of habitat, biota, distribution, functions anduses. Many of the wetlands have lost their pristine quality and havebeen transformed to modified ecosystems, but their salient role in theecosystem function cannot be replaced. Over exploitation due todevelopmental activities are threatening their existence.
The protection and effective management of these wetlands is aHerculean task. The key to their protection lies in appreciating their valueand functions, considering the difference within and between differentwetlands. With fluctuating water levels, varying sources of water,changing biota, they have vital physical, chemical, biological and socio-

63
economic functions. Activities that damage the wetlands and inhibit theirfunctions, has local, regional, national and global impacts. Evolving acorrect conservation strategy and a sound management plan is essentialin addition to protecting the existing water bodies, and alternatives forhuman use systems need to be slated before implementing themanagement agenda.
There are three key points: First, access to wetlands will continueto allow intensification of agricultural activity in response to changingpatterns of demand. Second, the scope for managing various demandsis limited, particularly where rural communities are trying to escapefrom poverty. Third, the overexploitation of wetlands by agriculture andother uses is forcing users into economic and social transitions. The netconsequences will be loss of some wetlands and adverse effects onenvironment, biota and wildlife.
The actual experience of wetland management, or the lack of it,needs to be charted if real responses are to be effective. Target studiescould include case studies. For incorporation of ecological effects, theinteraction of water and the biosphere need to be studied at scales rangingfrom point to local. On the point scale one will have to incorporate aspectsof vegetation into the hydrological and hydro-geological processes toextend the understanding of the feedback loops between the atmosphereand the soil and to determine the plant-soil and water interactions neededfor assessing environmental impacts of pollutants, such as storm wateror sewage, or of chemicals, such as fertilizers or pesticides, on the plantcover. They can also have effect on the micro-fauna existing in the soil,in both the unsaturated and saturated regions. The regional scale ofecological studies is the watershed or its sub-areas. The eco-systems ofmany watersheds are imperfectly understood in the relationships thatexist between different kinds of plants, types of soil, and groundwaterlevels and fluctuations. Monitoring networks and related informationsystems are necessary to study hydrologic balance for water quantity aswell as quality and systematically assess impacts on aquatic eco-systemsand water quality.

64
REFERENCES
1. Charles Andrew Cole, Robert P. Brooks, and Denice H.Wardrop(1997), Wetland Hydrology as a Function ofHydrogeomorphic (HGM) Sublass, Wetlands17(4) :
2. Integrated Wetland Assessment Program, Part 5: Biogeochemicaland Hydrological Investigations of Natural and MitigationWetlands, Report, State of Ohio Wetland Ecology GroupEnvironmental Protection Agency Division of Surface Water, OhioEPA Technical Report,WET/2004-05
3. John S. Koreny , William J. Mitsch , E. Scott Bair , and Xinyuan Wu(1999) ,Regional and local hydrology of a created riparian wetlandsystem, Wetlands 19(1) :182
4. Lars Ramberg, Piotr Wolski1 and Martin Krah(2006), Water balanceand infiltration in a seasonal floodplain in the Okavango delta,Botswana Wetlands,26(3) :
5. Randall J. Hunt, John F. Walker, and David P. Krabbenhoft(1999),Characterizing hydrology and the importance of ground-waterdischarge in natural and constructed wetlands Wetlands, 19(2) :
6. Raymond Walton, Raymond S. Chapman and Jack E. Davis(1996),Development and application of the wetlands dynamic waterbudget model, Wetlands16(3) :347
7. Wetlands of India , Report, by S. N. Prasad, T. Sengupta, AlokKumar, V. S. Vijayan, Lalita Vijayan, T. V. Ramachandra, N. Ahalyaand A. K. Tiwari ,Energy and Wetlands Research Group, Centerfor Ecological Science, Indian Institute of Science, Bangalore
���

65
WETLANDS: ENVIRONMENTRELATED ISSUES
i. Wetland Conservation: Abatement of Pollution by A S Brar
ii. Wetland management vis-à-vis anthropogenic processesfrom expanding human population by Rashmi Sisodia andChaturbhuj Mounditya
iii. Water Quality monitoring in Lakes/Reservoirs usingRemote Sensing: A Case Study by V K Choubey


67
Wetland Conservation - Abatement ofPollution
By A S Brar*
Wetlands provide the habitats for a gamut of fauna and flora. Formillennia, man has used wetland plants and animals for food. Readsand canes have been harvested for building houses, papyrus swampsprovided the first material for manufacture of paper, flood plains usedfor cattle grazing, aquatic and wetland plants have been harvested forconsumption besides fisheries. They carry out a crucial role as breedinggrounds for fish and other aquatic life. Wetlands also serve as life supportsystem by helping in water quality improvement, flood control,recharging of ground water, storm protections, shoreline stabilization,regulation of hydrological regime, conservation of biological diversityand reduction of sediment loads to the water bodies.
The convention on wetlands of International importance speciallyas Waterfowl Habitat, known simply as the Ramsar Convention, is anintergovernmental treaty which provides the frame work forInternational Co-operation for conservation of Wetland habitats. Indiaacceded to the convention in October, 1981 as contraction party. The1971 Ramsar convention defines the Wetlands as ‘Areas of marshes, fens,peat lands or water, whether natural or artificial, permanent or temporarywith water that is static or flowing, fresh, brackish or salt, including areasof marine water, the depth of which at low tide does not exceed sixmeters.’
* Member Secretary, Rajasthan Pollution Control Board, Govt. of Rajasthan, Jhalana Institutional Area,Jaipur

68
The U.S. Department of Interior Fish & Wildlife Service Authorityadopted the following definition of Cowdrin,1979 :
The wetlands are lands transitional between terrestrial and aquaticsystems where the water table is usually at or near the surface or theland is covered by shallow water.”
The Ministry of Environment & Forests, Government of India hasestimated that India has about 4.1 million hectares of Wetland (excludingpaddy fields and mangroves) of which 1.5 million hectare are naturaland 2.6 million hectares manmade. Mangroves are estimated to cover0.6 million hectare. Under the Ramsar convention, 93 major wetland siteswere identified in the country, out of which, two sites namely: SambharLake and Keoladeo National Park are pertaining to the Rajasthan State.In the State, 65 wetland sites are also existing in the down stream oflakes and reservoirs, besides the above, two sites as identified underRamsar convention.
ENVIRONMENTAL ISSUES:
With gradual increase in human population, pressure on land foragriculture, urbanization, industrialization and developmental activities,the wetlands are severely endangered and decaying day by day. Themajor problems confronting the wetlands are as follows:-
• Decrease in biological diversity particularly endemic andendangered species.
• Deterioration of water quality.
• Sedimentation & shrinkage in the area.
• Decrease in migratory bird population, fish, and other faunalproductivity.
• Prolific growth of obnoxious aquatic weeds.
Factors responsible for degradation/vanishing of wetlands:-
(i) Encroachment
Large number of people living in and around wetlands have beenencroaching upon these areas and vast areas have already beendrained for agriculture, urban expansion and other purposes.

69
(ii) Siltation
Siltation is one of the major problem in most of the wetlands inIndia. Deforestation and other anthropogenic activities haveaccelerated soil erosion resulting in increased sedimentation ratesand resultant shrinkage of wetlands. About 13 million tones of siltis deposited annually in Chilka lake choking its mouth leading toreduced communication with Bay of Bengal. Some other lakesexperiencing this problem are Wullar, Dal, Kolleru, Loktak etc.
(iii) Weed infestation
Almost all wetlands in the country, barring a few located in thehigh altitude Himalayas, are heavily infested with aquatic weeds.Eichornea crassipes, Ipomea sp., Salvinia natans, S. Molesta and Paspalemsp., etc. are posing great threat to the wetlands hampering theirecological functions.
(iv) Pollution
• Indiscriminate discharge of industrial/domestic effluent,leachates generated from improperly disposed industrialsolids waste, hazardous waste, municipal solid waste and bio-medical waste in the streams/land or the catchment area ofthe wetlands, not only deteriorate the water quality of thesystem but the Toxic Pollutants i.e. trace heavy metals andtrace organics are absorbed in the biomass in form of aquaticweeds i.e. water hyacinth and algae etc.
• The air pollutants emitted from the industrial activity carriedaway with precipitation and leachates of the pollutantsdeposited on land aggravates the problem of pollution ofWetlands.
• The residual pesticides and fertilizer generated due toexcessive use of the commodities are carried away with rainwater run off to the wetlands from the catchment areas.
• Drainage & flood control programmes have long been a threatto the wetlands in terms of water/soil quality deterioration.
• Tourism activity is also one of the major threat to the wetlands,

70
wherein improper disposal of packing material, plastics,garbage and other solid waste creates environmentalproblems.
(v) Aquaculture
Conservation of wetland areas indiscriminately for aquaculturewithout proper land use planning has also resulted in thedestruction of a number of wetlands.
NATIONAL WETLANDS PROGRAMME
The Ministry of Environment & Forests has appointed a Nationalcommittee on Wetlands, Management & Coral leefs to advise theGovernment on appropriate policies and programmes for theconservation of these eco systems. State Level Steering Committee headedby the Chief Secretary have been assigned the responsibility to formulate,implement and monitor the programmes. The Management Action Plansunder the National Wetland Programmes assist the following:-
(i) Protection
— Bringing the identified wetlands under the country’s protectedarea network of national parks, sanctuaries and biospherereserves.
— Strengthening the infrastructure facilities of protectedwetlands.
(ii) Siltation control
— Soil conservation and erosion control through afforestation,vegetation contour bunding, the construction of waterharvesting structures, gully control and stream bank erosioncontrol.
(iii) Pollution control
— Monitoring water quality of major, medium and minor riversystems, groundwater and lakes by the Central and StatePollution Control Boards and under the Global EnvironmentalMonitoring Systems(GEMS), Monitoring of Indian nationalAquatic Resources(MINARS) and Ganga Action Plan(GAP)programme.

71
— Carrying out environmental impact assessments ofdevelopmental projects affecting the wetlands.
— Issuing administrative Notifications such as the CoastalRegulation Zone (CRZ) Notification imposing gradedrestrictions on industrial operation and processes in coastalareas and banning construction within 500 m of the high tideline.
(iv) Weed Control
— Both biological control methods(on an experimental basis) andmanual removal of aquatic weeds.
— Evolving a comprehensive, integrated, long term approachto combat the weed menace.
(v) Afforestation
— Afforestation activities in the catchment areas of Bhoj(MadhyaPradesh), Wular(Jammu & Kashmir), Harike andKanjli(Punjab) and Chilka(Orissa).
(vi) Wildlife Conservation
— Captive breeding of some endangered, wetland-dependentwildlife species such as rhinoceros in Assam, Sangai inManipur and freshwater turtles.
— Improving wetland habitats for waterfowl.
(vii) Fisheries Development
— Emphasising sustainable utilization of fishery resources ratherthan short term gains through intensive aquaculture at naturalwetlands.
(viii) Legal Aspects
— Enacting of legislations such as the Environment (Protection)Act,1986; Water (Prevention & Control of Pollution) Act, 1974;Forest (Conservation) Act, 1980 and Wildlife (Protection) Act,1972.
(ix) Environmental Education
— Building awareness about the values and the need for

72
conservation of wetlands among all target groups throughaudio-visuals, posters, nature campus, films etc.
Conducting the National Environmental AwarenessCampaign every year.
RESEARCH
A wealth of data has been gathered from several projects fundedby the Ministry of Environment and Forests under the WetlandsProgramme. Several wetland ecosystems viz. Dal, Wular, Renuka,Rewalbai, Pichola-Fatehsagar, Sukhna, Bhoj, Sagar, Chilka, Kolleru,Loktak, Sasthamkotta, Kodaikanal etc. have been investigated in detail,especially the physico-chemical characteristics of water, sedimentcomposition, flora, fauna, weed infestation, pollution, hydrology andother limnological parameters.
Keeping in view, the problems confronting the wetlands in Indiaand the research studies carried out so far, the following priority areashave been identified under the Wetlands Programme:-
— Survey and mapping of wetland resources in the countryusing remote sensing technology.
— Application of Geographical Information System(GIS) andmathematical modeling in some selected wetlands.
— Evolving wetland evaluation techniques to facilitate a quickappraisal of the health of specific wetland ecosystems andalso environmental impacts of developmental projects andother human activities on the ecosystem.
— Control of prolific growth of some exotic species and weedmanagement.
— Siltation control.
— Fisheries development.
ABATEMENT OF POLLUTION
For abatement of pollution in the country, the followingenvironmental regulations have been enforced, wherein, theresponsibilities for enforcement has been assigned to the State Board:-

73
• Water(Prevention & Control of Pollution)Act,1974.
• Water(Prevention & Control of Pollution)Cess Act,1975.
• Air(Prevention & Control of Pollution)Act,1981.
• Environment(Protection)Act,1986.
• Hazardous Waste(Management & Handling)Rules,1989.
• Municipal Solid Waste(Management & Handling)Rules,2000.
• Bio-Medical Waste(Management & Handling)Rules,1998.
• The Batteries(Management & Handling)Rules,2001.
• Environment Impact Assessment Notification – 14.9.2006.
ROLE & RESPONSIBILITIES OF RSPCB
• The Water & Air polluting industries are being regulated underthe consent mechanism, wherein the industries are to take Consentto Establish and Consent to Operate before establishment andoperation from the State Board. There are 2211 Red Category, 9131Orange Category and 2447 Others Category industries and around25363 mining units(3557 Red Category), in the State which are beingregulated under consent mechanism.
• The industries are required to install proper and adequate pollutioncontrol measures to achieve the discharge/emission standards andto comply with the conditions imposed under consent and suchindustries are being inspected and monitored by the State Boardregularly at scheduled frequency.
• The duration of the consent issued to industries are 1,3,5 and 15years depending on the type and category of the industry.
• The water polluting industries are required to install EffluentTreatment Plants (ETP) comprising of physico-chemical,biological(activated sludge, floating aeration/diffused aeration,trickling filter, up flow biological filters, biological rotating/fix discfilters, chemical adsorption system, anaerobic digester, bio-mathration and polishing treatment(sand filteration, activated charcoalfilter) ozonisation and Reserves Osmosis/and the treated effluentmay be reused/ recycled.

74
• For treatment of the domestic effluent generated from urban centersis being treated through Sewage Treatment Plant(STP) havingphysico-chemical, activated sludge, floating aeration/diffusedaeration, oxidation pond, up flow biological filter, trickling filter,oxidation ditch, facultative ponds, filteration through sand/activated charcoal filter media, chlorination/ozenization etc.
• In the air polluting industries pollution control measures such ascyclones, multi cyclones, Electro Static Precipitators(ESP), VentuaryScrubbers, Pulse Jet Filters, Bag Filters etc. are being installed &operated.
• The State Board has identified 415 hazardous waste generating unitsin various sectors which are being regulated under the provisionsof the Hazardous Waste(Management & Handling)Rules,1989. Forproper treatment, storage and disposal of hazardous waste, oneCommon Treatment, Storage & Disposal Facility(CTSDF) has beendeveloped at Udaipur having 296 member units and 12 SecuredLand Fill Facilities(SLF) and 3 incinerators have been developedby individual industrial units.
• The State Board has identified 1828 Health Care Facilities(HCF)i.e. hospitals, dispensaries, clinics, blood banks and pathologicallaboratories which are being regulated under the Bio-MedicalWaste(Management & Handling)Rules,1998 for segregation,collection, storage, transport and disposal of bio-medical waste.The HCF’s are required to take authorization from the State Boardfor the activities for proper management of such waste.
In the State, 7 Common Bio-Medical Waste Treatment, Storage,Treatment & Disposal Facilities(CBMW, TSDF) have beendeveloped at Ajmer, Alwar, Bikaner, Jaipur, Jodhpur,Hanumangarh & Udaipur catering the requirement of the HCFs invarious neighbouring districts and 6 such facilities are underdevelopment at Kota, Udaipur(Additional), Jaipur(Additional),Jhalawad, Sikar and Swaimadhopur.
• The Department of Local Self Government has identified themunicipal solid waste disposal sites for 153 municipal bodies outof 183 in the State in compliance of the Municipal Solid

75
Waste(Management & Handling)Rules,2000. The Jaipur MunicipalCorporation has prepared an action plan for proper managementof MSW.
• It has been estimated that in six major cities of the State namely :Ajmer, Bikaner, Jaipur, Jodhpur, Kota & Udaipur around 262 MLDof sewage is generated. Presently, most of the areas of the citieshave not been provided with the sewerage system and treatmentfacilities except Jaipur. In Jaipur, two Sewage TreatmentsPlants(STPs) near Jal Mahal and Dehlawas are working. UnderRajasthan Urban Infrastructure Development Project SewerageSystem and STPs are under construction in the above major cities.Such facilities to be developed in other cities and towns also.
• The State Board is monitoring the water quality of import surfacewater resources i.e. river Chambal, Kaslisindh, Kansuah Nallah,Parvati, Mahi and Lake Pichhola, Fateshsagar, Udaisagar, Pushkar,Ramgarh, Kadoradam, Nakki and well water in various parts ofthe State at 66 monitoring stations under National Water QualityMonitoring Programme(NWMP) and State Water QualityMonitoring Programme.
POLICIES – PRIORITIES OF THE STATE BOARD :
• Classification of industries based on pollution load i.e. 17 category(Aluminium, Cement, Chlor-Alkali, Copper, Distillery, Dyes & DyeIntermediates, Fertilizers, Integrated Iron & Steel, Oil Refineries,Pesticides, Petrochemicals, Pharmaceuticals, Pulp & Paper, Sugar,Tannery, Thermal Power Plants & Zinc, Red, Orange & Otherscategory.
— 153 categories of non-polluting industries have been exemptedfrom consent mechanism.
• Strict compliance of environmental regulations is envisaged fromhighly polluting industries and close vigilance is ensured throughfrequent inspection and monitoring.
• Installation of adequate pollution control measures in all categoriesof polluting industries is ensured to avoid adverse impact onrecipient system.

76
• Regular environmental surveillance is being ensured throughmonitoring of ambient air quality and water quality of waterresources of the State and wherever required actions for abatementof pollution are being taken.
• Encouragement to combined treatment and disposal facilities incase of small sector cluster of industries keeping in view the techno-economic capabilities of small entrepreneurs.
— 8 CETPs for textile industries at Pali, Balotra, Bithuja, Jodhpurand Jasol.
— 1 CETP for small tanneries at Manpura Machedi.
— 1 CETP at Bhiwadi.
• Zoning Atlas for siting of industries to avoid adverse impact ofpollution on environment and financial burden of E.I.A. onentrepreneur while submitting the project proposals forestablishment of industries and it also facilitates industrial estateplanning.
• Promotion to waste minimization practices i.e. improvement inproduction efficiency, modification in processes, segregation ofwaste, use of better quality of raw material, internal auditing ofprocesses and waste generation etc.
• Encouragement to reuse and recycle of treated waste water byproviding polishing treatment the waste water may be used inprocess or for toilets, gardening, washing and dust suppressionpurposes.
• Promotion to pollution prevention technologies over controlmeasures for environmental sustainability.
• Encouragement to introduction of cleaner technologies – switchingover from silicating process to steam ageing in textile units for colourfixation, replacement of mercury cell to diaphram cell in chlor-alkaliindustries etc.
• Promotion to water harvesting/recharging systems in industrialpremises.
• Ensuring preparation and implementation of Environmental

77
Management Plan for sustainability of environment and ecology.
• Encouragement to conservation of natural resources includingwater and energy in production processes through environmentalauditing and environmental statements.
• Promotion to eco-friendly products to avoid unnecessary burdenon environment through mass awareness.
• Public Participation through public hearing for the new projectproposals and expansion in production during clearance.
• Fiscal incentives for environmental protection activities inform ofrebate in water cess, exception in Custom/Excise Duty, Octroi andSales Tax for procurement of pollution control equipments.
• The State Board takes action against the polluter and emphasis onrehabilitation of contaminated sites following the polluter paysprinciples.
• Social Positive & Negative Incentives – Award/Reward andPunitive Actions. The State Board has planned to introduce awardsfor the industrial units for their outstanding performance forenvironmental protection and punitive actions are being takenagainst chronical defaulters.
• The State Board is taking all measures for prevention, control andabatement of water and air pollution and for maintaining thewholesomeness of lakes, rivers, well and air. Thereby acting andprotecting the natural resources in consonance with the Doctrineof Public Trust.
• The State Board create mass awareness through Seminars,Workshops, Electronic and Print Media, Akashwani & Doordarshanfor environmental protection and preservation.
• For abatement of pollution in the polluted stretches of perennialriver due to indiscriminate discharge of domestic sewage, municipalwaste and disposal of dead bodies under National RiverConservation Plan. The State Government has taken up a projectfor Chambal River from Kota to Keshoraipatan for diversion of thesewage outfalls from the river and to treat the domestic sewagethrough STP.
���

78
WETLAND MANAGEMENT VIS-À-VISANTHROPOGENIC PROCESSES FROMEXPANDING HUMAN POPULATION
By Dr Rashmi Sisodia and Chaturbhuj Mounditya*
INTRODUCTION
Wetlands are vital water bodies, as crucial in a natural ecosystemas kidney in a human body. Their role is complex and varied. Apartfrom being highly productive as the habitat of birds, fishes and a varietyof other aquatic life forms, including microorganisms, wetlands provideother ecosystem services from maintaining the natural balance and forsustaining human livelihoods.
Unfortunately, there has been much neglect of wetlands in recenttimes due to an overall lack of appreciation of their role and on accountof the pressures of growing human needs, agriculture, urbanization (dueto expanding human population) and sheer mismanagement of landresources. There is also a very unfortunate misconception that wetlandsare like wastelands. As a result, many precious wetlands have beensacrificed and converted to other uses all over the country and elsewherein the world. This trend has to be checked and reversed for the largergood of all concerned. This assumes added significance especially in awater stressed region, such as Rajasthan, where it is vitally important toconserve every drop of rainwater and to preserve every bit of waterbody. Rajasthan state is endowed with rich wetland resources that are
* Department of Zoology, University of Rajasthan, Jaipur, India-302004

79
also facing degradation by the aforementioned threats. The degradationin the water quality affects the floral and faunal population along withthe people dependent on these ecosystems. Hence, the conservation ofwetlands deserves the utmost attention of all concerned.
In the present paper we have tried to look into the factorsresponsible for the loss and degradation of the wetlands viz Jal MahalLake (urban location) and Jamwa Ramgarh wetlands of Jaipur andKalakho Lake of Dausa district Rajasthan (Rural location) the aims being:
• To find out the pollution load and level of dependency on theselakes.
• To identify and analyze the qualitative and quantitative impact ofurbanization on wetlands.
• To analyze various physico-chemical and biological parameters
• To carry out socio-economic survey
• To compare the results with Indian Standard Specifications
SIGNIFICANCE OF WETLANDS
Wetlands are among the most productive ecosystems. They directlyor indirectly support millions of people and provide goods and servicesto them. They support important processes like the movement of waterinto streams and oceans, decay of organic matter, release of nitrogen,sulfur, and carbon into the atmosphere, removal of nutrients, sedimentand organic matter from water moving into the wetland; and the growthand development of all organisms dependent on them. The direct benefitsof wetlands are in the form of fish, agriculture, fuel wood, recreationand water supply etc. and their indirect benefits arise from functionsoccurring within the ecosystem such as flood control, ground waterrecharge and storm protection. Wetlands retain nutrients by storingeutrophicational parameters like nitrogen and phosphorus floodingwaters in vegetation or accumulating them in the sub-soil, decreasingthe potential for eutrophication and excess plant growth in water. Theyalso help in absorbing sewage and in purifying water supplies.
The mere existence of wetlands may have great significance to somepeople, as they are a part of their cultural heritage. Water is required for

80
various purposes like drinking and personal hygiene, fisheries,agriculture, navigation, industrial production, hydropower generationand recreation. Apart from these, some socio-economic values - fuelwood, medicinal plants, livestock grazing, agriculture, energy resource,wildlife resource, transport, recreation and tourism etc. are significantthrough water supply.
In recent years, there has been increasing concern over thecontinuing degradation of wetlands and in particular, rivers and lakes.Wetland sustains all life and perform some useful functions in themaintenance of overall balance of nature. The functional properties ofwetland ecosystem demonstrate clearly its role in maintaining theecological balance.
WETLANDS LOSS AND DEGRADATION
The impact of wetland may be grouped into 5 main categories: lossof wetland area, changes to water regime, changes in water quality,overexploitation of wetland products and introduction of exotic or alienspecies.
The primary factors causing degradation are sedimentation,eutrophication, pesticide pollution, salinity, heavy metal pollution, weedinfestation, low dissolved oxygen and pH (UNEP, 1994).
The major activities responsible for the wetland loss areurbanization (due to expanding human population), drainage foragriculture and water system regulation (IUCN, 1999). Developmentactivities like excavation; filling, draining etc. are the major destructivemethods resulting in a significant loss of the biological diversity of floraand fauna, migratory birds and also the productivity of the system.Wetlands throughout India are experiencing varying degrees ofenvironmental degradation, related mainly to encroachments,eutrophication (from domestic and industrial effluents) and siltation.
JAL MAHAL LAKE (JAIPUR)
The Jal Mahal (Man Sagar Lake) in Jaipur, was aimed at developinga reservoir- water harvesting –to dam the rainwater which flowed downthe hills of Nahargarh and Jaigarh hills. It was developed by 1727 whenthe city of Jaipur was founded by Maharaja Sawai Jai Singh II of Amber

81
as a sustainable water body.
As population spread, Jaipur busted over its walled boundaries.With haphazard housing mushrooming around the lake, Man Sagar hashad most negative impact on its aquatic character; the lake got pollutedwith continuous discharge of sewage from northern areas of the city.
The problem of water pollution due to discharge of domestic,agricultural and industrial wastes into aquatic system has become aserious problem in the country. Jaipur city drainage system has beendivided into North and South Zone. The North Zone, which includesmost of the walled city, covers population under the sewage scheme.Though South Zone covers a portion of the walled city area and most ofthe new Jaipur. The city has got only one sewage treatment plant thatwas commissioned in 1995 near Jal Mahal Lake (Man Sagar Lake), wherethe effluent from the North Zone is treated but the treatment plant arenot working since last five years. It has changed the very character ofthis lake. Not only the lake water is polluted beyond the tolerable limitbut also it is causing adverse effect on the health of people who reside inits close proximity. In the South Zone of the city, the sewage is discharged,without any treatment, into Amani Shah’s drainage.
Today it appears that people of Jaipur have stopped caring for theirown reservoir Jal Mahal. The race for development has kept the city’sMunicipal Corporation, Councilors, Legislators, Ministers, and theGovernment busy in exploring new alternatives. Consequently, Jal Mahalis receiving -
• Effluents of lakhs of people of Jaipur.
• Silt which is deposited into its bed, generated from the nearby
Catchment’s hill slopes which are totally denuded, and
• Encroachments, which have altered the original shape and totalarea of Jal Mahal.
KALAKHO LAKE (DAUSA)
Kalakho Lake is situated in eastern part of Rajasthan nearbyKalakho village in Dausa district. This greatest wetland of Dausa is about74 km away from Jaipur and 14 km away from main city of Dausa. Lake

82
is situated on the National highway No. 11. It was constructed in 1952having spread over an area of 52.25 Sq. miles receiving water from KhardiRiver and natural streams and canals. The anthropogenic activities in itscatchment area may be considered as source of pollutants.
The site comprises fresh water swamps, which are part of theIndogangetic Great Plains. Both the lakes (Jal Mahal Lake & KalakhoLake) have microbiogeographical location and oriental zoogeographicallocation. Climatic condition in this region is semi-arid and Indus-Gangesmonsoon forest region. Both Jaipur and Dausa area are in eastern plainswithin the catchments of Banas river which is major tributary of the riverChambal which ultimately joins the river Yamuna. Eastern plains haverich alluvial soils drained by seasonal rivers.
JAMWA RAMGARH LAKE
The wetland of Jamwa Ramgarh Lake, located at Jaipur, Rajasthan,India, covers an area of 297 square miles. The Jamwa Ramgarh reservoirreceives water from the Banganga River and attracts a large number ofmigratory and domestic birds. In Jaipur city 60 million gallons of waterused to be supplied from Jamwa Ramgarh Lake but presently the lake iscompletely dried up. The water from this wetland, besides being a sourceof potable water for inhabitants of Jaipur, had economic value such asfish breeding.
Presently (2007) the lake received no water even after heavy rainfallsdue to construction of eight anicuts (one of them is Bishenpura Bandha),which is an obstruction for water. It stops water from flowing into ituntil it overflows. If these were not constructed water would have directlyreached the Ramgarh Lake (12th July, 2007, Ref. Patrika). Many plots andfarmhouses have been sold in the area. Illegal construction in the area ofriver Banganga (Ref. 6th June 2007, Patrika) is also responsible.
There is no proper storage facility for rain water as a result 29%rainwater flows and is wasted which could fulfil the needs of 13 crore 59lakh people for 1 year
Water Quality Index (WQI):
The WQI was calculated from the point of view of the suitability oflake water for human consumption. The indices are among the most

83
effective ways to communicate the information on water quality trendsto the general public or to the policy makers and in water qualitymanagement.
(i) WQI Calculation:
For calculation of WQI, selection of parameters has greatimportance. Since selection of too many parameters might widen thewater quality index and importance of various parameter depends onthe intended use of water. Eight physico - chemical parameters namelypH, TDS, total alkalinity, total hardness, chloride, DO and BOD are usedto calculate WQI.
Calculation of WQI
WQI is calculated from the following equation
n n
WQI = Σqn Wn / Σ Wn
n =1 n=1
Where,
Wn = unit weight for nth parameters
qn = quality rating for the nth water quality parameter.
(ii) Assessment of water quality based on WQI
Table : Water quality index (WQI) Kalakho Lake
(Jan. 02 to Dec. 02) (Jan. 03 to Dec. 03)
Sampling Station Summer Mansoon Winter Summer Monsoon Winter
Station I 460.4742 599.3328 408.336 455.737 606.55303 418.736
Station II 472.6972 600.386 413.562 464.2 614.48472 424.182
Station III 465.9755 564.0349 414.484 456.471 569.63876 423.327
Station IV 479.7297 527.9066 414.69 480.424 520.09648 432.615

84
Kalakho Lake S2> S1 >S3 > S4
S-1: Near the agriculture field
S-2: Near the village area
S-3: Along the National Highway road
S-4: End point of lake (outlet)
Table : Water quality index (WQI) of Jal Mahal Lake
(Jan. 02 to Dec. 02) (Jan. 03 to Dec. 03)
Sampling Station Summer Mansoon Winter Summer Monsoon Winter
Station I 1142.28 1484.0248 1476.427 1127.4 1624.2233 1480.12
Station II 4183.25 3653.0542 3676.466 4156.25 3654.5526 3654.203
Station III 1787.08 1738.5853 1477.795 1768.26 1732.447 1473.298
Station IV 1789.31 1753.1076 1472.93 1777.31 1753.0146 1476.091
Jal Mahal Lake S2> S4 >S3 > S1
S-1: Along the road side (Amber road)
S-2: Mixing point of domestic and sewage waste
S-3: Near the hilly side (Kanak Vrindavan side, North East side)
S-4: Outlet of water (near the bird watching fair area)
• Index value was always above 100 at all the sampling station ofboth lakes.
• In the both wetlands, WQI values in 2003 were higher than the2002 at all the sampling stations indicating better picture in year2002.
• WQI values of Jal Mahal Lake indicate that it is under stress ofsevere pollution due to discharge of wastewater from varioussources into the lake.
In Jamwa Ramgarh the pH of Ramgarh lake water ranged from 6.8to 8.5, which may be due to high buffering capacity of the system. The

85
electrical conductivity values ranged from 500 to 700 micromhos/cm,with a maximum in summer and minimum in monsoon season. Thetotal alkalinity values fluctuated from 102.6 to 215 mg/l, indicating thatthe water is hard.
Avifaunal Studies
The study was undertaken for:
a. To monitor cost-effective way of the overall health of the ecosystem.
b. Correlating the presence of avifauna and flora with thephysiochemical characteristics of wetlands,
c. in relation to the water body in rural (Kalakho Lake) and urbanareas (Jal Mahal Lake).
STATUS OF AVIFAUNA
• Species such as egrets, paddy birds and waders were widespreadin cultivated areas of both wetlands.
• Both lakes offer habitats for a variety of migratory and residentbirds.
• More than 180 species of birds belonging to 49 families wererecorded during the study (January 2002 to February 2004) - Fig 1.
• These included some rare, endangered, uncommon, vulnerable,threatened and near threatened species as the most commonsightings.
In terms of numbers of bird species and the total number of bird,Kalakho Lake was much better than the Jal Mahal Lake. The rural locationof the Kalakho Lake seems to be responsible. It appears to be less pollutedthan Jal Mahal Lake. In Jamwa Ramgarh more than 100 species of birdsbelonging to 38 families were recorded at Lake during the winter seasonof year 2002. As the lake was affected by scanty rainfall and had onlyone-fourth water of its total capacity the number of waterfowls visitingwas reduced to only four to five thousand, now the number is furtherreduced due to constructional activities and lake of water. In droughtyear 2002 in Rajasthan scanty rainfall affected the diversity and numberof birds species. The year 2003 witnessed heavy monsoon but still thenumber of birds species decline upto 15.95 continuously through the

86
year which further declined to 33.34% by the end of 2003 to beginning ofyear 2004.
• In Kalakho Lake heavy rainfall in year 2003 resulted in increasedavailability of food items and vegetation, number of birds speciesincrease significantly by 26%. The end of 2003 to beginning of 2004saw further increase in number of bird’s species 42.2%.
Reason of decline of biodiversity (birds): Our study show thatthe decline of biodiversity may be due to:
1. Changes in the natural habitat such as uprooting of vegetation (fooditems for birds).
2. Desilting operations conducted by the Jaipur DevelopmentAuthority.
3. Motor exhaust pollution, noise pollution, litter etc.
4. Some birds during their migration stop at Joardh, man-made pondsand anicuts, which become filled with water after the rainy season.Teeming of small life in these water bodies attracts a few migratorybirds, which fail to reach the lake.

87
5. Gradual loss of vegetation in the adjacent reserved forest areathrough deforestation (by local residents). (Ministry of environmentand forest 2005,forest and tree cover in India- report submitted tothe Central government). The total forest cover area adjacent tothese lakes and all over Rajasthan has decreased by 0.5%.
6. Scanty rainfall in 2002 resulted in the reduction of overall watercapacity of the lakes to one fourth, which affected the numbers ofmigratory birds.
7. Changes in water quality of lake water.
8. Waste disposal and malpractices around the lake
9. Inflow of sewage and industrial effluents are responsible for declineof the biodiversity.
SOCIO-ECONOMY SURVEY
Earlier the human interference was restricted to bathing andwashing of clothes though not permitted officially. Both wetlands havenow become a recreation place for tourists. The constant disturbancesall around the lake by anthropogenic activities and agricultural practicesin the dried up area of wetland has resulted in the shrinkages of wetland.Socio-economic values of wetlands for prioritization of biologicalconservation sites are a very important aspect because of the number ofspecies that depend on them.
The government has leased the lake to contractors for catching fish,which resulted in considerable depletion of fish fauna of the lake. Sincefish forms a very important chain of food in a wetland ecology. Theadjacent reserved forest area is scantily vegetated and thus does not offermuch by way of food or habitat.
In our study of the lakes – reed gathering, grazing, clay gathering,solid waste disposal, agricultural waste, drinking/wallowing by cattle,domestic uses, fishing and peta-kashth in the dried up area wererecorded. Jal Mahal Lake has also used for sewage disposal and as arecreation place for tourists. At downstream of the Jal Mahal Lake, morethan a thousand acres are irrigated by outflow of mixed lake water andraw sewage.

88
ECONOMIC DEPENDENCY
(a) Dependency for irrigation and its products were high per day,during cropping season in the dried up areas of Jal Mahal Lake,whereas Kalakho Lake has low agriculture value on account of lowwater level during summer.
(b) Dependency for fuel and fish in Jal Mahal Lake was low per day, atKalakho high per day.
Dependency for livestock in the Kalakho Lake was higher whencompared with Jal Mahal Lake.
The eutrophic status of Jal Mahal Lake has made the wetlandresource unusable. Water spread area has also declined due toencroachment of peripheral areas for agricultural purposes, settlementsand construction of roads, etc.
ANTHROPOGENIC DISTURBANCES IN AND AROUND THEWETLANDS
In our study of both lakes many anti-conservation activities like
• Reed gathering
• Grazing and drinking/wallowing by cattle
• Clay gathering
• Agricultural waste
• Domestic uses (bathing and washing of clothes into the lake)
• Fishing and peta-kashth
• Encroachment on peripheral areas for human settlements
Eutrophication of these lakes through human activities has alsoproved to be one of the most widespread and serious problems. Eutrophicstatus of the lake has affected the avifauna of the wetland.
These activities are a constant source of disturbance for birds.
CONCLUSION
From the above findings the following conclusions can be drawn:
1. At Jal Mahal Lake high values of BOD, COD, pH, and EC, notedseen to be responsible for given rise to algal blooms indicating heavy

89
environmental pollution. Lake has attained eutrophic conditionevident from high levels of TDS, alkalinity, hardness, weedinfestation and low DO.
2. Socio-economic survey showed that, the economic dependency inthe case of Kalakho Lake is more than that of Jal Mahal Lake due tobetter water quality and ecosystem.
3. WQI values indicate that water quality of Jal Mahal Lake is notsuitable for any purpose.
4. Water spread areas of both the lakes have been considerablyreduced during last two decades, due to sedimentation andencroachments for developmental activities.
5. The degradation of the water quality affects the floral and faunalpopulation and also the people dependent on these ecosystems.
6. The present study highlights the magnitude of wetlandconservation, need for restoration and formulation of conservationstrategies for sustainable development.
• It provides sound data and policy advice on which thegovernment can base more effective conservation actions.
• In water-stressed region Rajasthan, some highly adaptablethinking must be found to permit development activities,including tourism, subsistence agriculture, and conservationof wildlife to be each given “a fair share” of the one biome –the wetland.
RECOMMENDATION FOR MANAGEMENT STRATEGIES
For the conservation of these wetlands and their biodiversity andto improve the water quality certain recommendations have beenproposed which are as follows:
1. Wetlands in Rajasthan are threatened owing to the pressures ofunplanned urbanization and land use pattern. Industrial andresidential layout near the wetland should not be permitted.
2. Many anti-conservation activities observed during our study mustbe strictly prohibited, since the activity is a disturbing factor forbirds.

90
3. Fishing should be strictly monitored according to the rules andregulation of Rajasthan Fisheries Act 1953.
4. Peta-kashth in the dried up area of wetlands leads to shrinkage ofthe wetland, which should not be permitted.
5. The open drains, which bring enormous quantity of effluents intothe lake, which is hazardous for people residing near by, shouldnot be permitted.
6. An action-programme should be drawn to lay down cementpipelines to carry the city’s effluents away from the present flow.
7. Effluent Treatment Plant (ETP) should be installed which will resultin improvement of water quality.
8. Steps should be taken to prevent further silt deposition leading toerosion of the lake by planting vegetation.
9. Planting trees in adjacent forest area to increase the density ofexisting forest cover.
10. Mound Plantation - The tree species like: Acacia nilotica (desibabool), Ficus bengalensis (bar), Ficus religiosa (peepal) etc needto be planted to facilitate breeding by migratory and resident birds.
11. Creation of Nesting Island is recommended in lakes, which atpresent have none.
12. Restricted boating activity within 60 m of the nesting sites.
13. De- weeding: Prolific growth of weed like water hyacinth etc, itshould be harvested so as to remove this biomass from the lakesystem.
14. Anthropogenic stress should be controlled by strict implementationof laws by government, with suitable support from NGO’s.
15. Increasing awareness among the people. This means engaging localpeople in a way, which makes them concerned to conserve theirresources.
16. The most important is coordination between different organizationsand authorities, otherwise whatever money will be senctioned forrestoration will be a waste as noted previously. One agency planted

91
trees but since no tree guards were put around them, the animalsgrazed them.
Lastly strong political will is needed.
• This study strongly recommends the need to save these wetlandsof Rajasthan, because of their great ecological importance. Thegovernment of Rajasthan should declare these areas as birdsanctuaries in view of their tremendous potential.
ACKNOWLEDGEMENT
Authors are graetfull to Mr. Manoj Kulshresth, State Coordinator,BNHS, Rajasthan for his valuable suggestions and guidance duringavifaunal studies.
REFERENCES
1. 10th May, 2007, Rajasthan Patrika (Newspaper).
2. 6th June, 2007, Rajasthan Patrika (Newspaper).
3. 7th June, 2007, Rajasthan Patrika (Newspaper).
4. 19th June, 2007, Rajasthan Patrika (Newspaper).
5. 16th July, 2007, Rajasthan Patrika (Newspaper).
6. 12th July, 2007, Rajasthan Patrika (Newspaper).
7. 15th July, 2007, Danik Bhaskar (Newspaper).
8. 30th July, 2007, Rajasthan Patrika (Newspaper).
9. 17th Aug, 2007, Rajasthan Patrika (Newspaper).
10. 31st Aug, 2007, Rajasthan Patrika (Newspaper).

92
Water Quality Monitoring in Lakes/Reservoirs using Remote Sensing: A CaseStudy
By Dr V. K. Choubey*
1. INTRODUCTION
Water quality is an important environment variable, because itaffects human health and economic activity (Alfoldi and Munday, 1978).Suspended sediment is an important environmental parameter used indetermining water quality.
Sediment deposition in reservoir reduces its storage capacity and,hence, its ability to control flooding. Suspended matter reduces thepenetration of light into water, this further reducing the production offood for fish. The poor visibility in turbid water also makes it difficultfor fish to find what food is available (McCauley, 1977).
Water quality in the form of the water transparency in the visualregion is very important for hydro-optical application (Lindell et al., 1985).Absorption and scattering processes determine the water transparency.Light penetration depth is primarily controlled by sediment loads (Yargeret al., 1973). During the past 10 there has been a renewed interest in themethodology and procedure used to monitor water quality in reservoirs.Several investigators successfully used Landsat MSS/TM imagery indetermining and monitoring water quality in reservoirs and estuarinesystems.
Recent studies include Bukata et al. (1983), Khorram and Cheshire
* National Institute of Hydrology Jal Vigyan Bhavan, Roorkee, U.K., 247667 India

93
(1985), Ritchie and Cooper (1988), Lindell (1985), and Ramsay and Jensen(1990). These investigators used multispectral digital data andconcurrently acquired field measurements to develop a predictiveequation for water quality parameters. Such methods are specific by theirvery nature, site, and even season (Nanu and Robertson, 1990). However,there still exists a need to study physical and optical properties ofsuspended sediments to enhance the utility of remote sensing for waterquality monitoring.
There is no government/private agency to monitor the waterquality of the Tawa reservoir (Central India) covering large areas. It isapparent that a timely low cost method of providing information onwater quality to various users of the reservoir water is important.Conventional methods involved tedious and expensive in-situ andlaboratory studies. Satellite-borne sensors have capabilities off providingrepetitive, low cost, multi-spectral, timely, reliable information over areas.There is a need to investigate the usefulness of IRS-IA-LISS-I (IndianRemote Sensing Satellite-lA-Linear _Imaging Self-Scanning System-I)data for monitoring water quality in this geographical area.
Considerable research in the various aspects of remote sensing formonitoring water quality in riverine and estuarine environments hasbeen undertaken abroad using various satellite/airborne data except IRS-IA. In India, no such type of work has been reported so far. In view ofthe potential application of IRS-IA data to Indian tropical waters, a studywas undertaken to calibrate the IRS-IA-LISS-I spectral data to waterclarity.
The purpose of this study was to quantify the relationship betweenremotely sensed data and water clarity. The effect of clay and non-clayminerals on water transparency with particular emphasis being givento the spectral complexities of the reservoir water were subject of thisstudy. The IRS-IA-LISS-I multi-spectral digital data have been used inthis study.
2. STUDY AREA
Tawa reservoir is a large impoundment located in Central India onthe Tawa River of the Narmada basin (Figure 1). The water spread areais about 225 km2 and filling of reservoir is mainly from two major rivers,

94
the Tawa and Denwa, during the monsoon period. These rivers join thereservoir from the South and east and flow through differentenvironments. The Tawa river flows through semi-forested andcultivated land, whereas the Denwa flows through dense forest. A verysmall portion of the area is a meandering plain formed due to themeandering of the Tawa River. Mostly rivers are structurally controlledand, hence, very deep bank sides occur. The principal tributaries of theTawa River are the Machua, Malni, Suktawa, Koti, and Sonbhadra ofDenwa river. The basin is characterised by a tropical climate with anaverage annual rainfall of 156 cm.
The soils are derived from sandstone and basalt under a subtropicalmonsoon climate. Folding and faulting have given rise to differentfeatures and physiography has modified the soil formation at differentphysiographic situations. About 83.8% of the area belongs to red andyellow soils of the catchment; out of this 57.3% is shared by coarse loamyand 26.5% by fine loamy soils. The dark grayish brown (black) clayeycracking soil occupies 14.1 % of the catchment area. The alluvial soilshave a minor extent of 1.5%. The soil taxonomy is classified as orthents,ochrepts, ustalfs, and usterts, etc.
The Tawa and Denwa rivers drain an area of 2310 km2 and thecatchment area is 5982.90 km2. The reservoir is designed to have a storagecapacity of 0.231 million ha m-l at full reservoir level of 355.397 m.
3. METHODOLOGY
The optical properties of water are related to light penetration andvisibility of submerged objects in the visual range of the spectrum(Davies-Colley and Vant, 1988). The secchi disc is a suitable instrumentfor measuring the water clarity.
An alluminum disc of 20 cm diameter was used with additionaliron pallets attached to make it heavy and steady in the water duringmeasurements. The disc was painted black and white on alternatequadrants. The reflectance, as measured in the laboratory, was about85% for white and 2.5% for black paint. The secchi disc was used tomeasure the extinction depth (the depth at which the disc just becomesinvisible in the water). The average of two readings for the depth atwhich the disc disappears during descending and reappears during

95
lifting is adopted. The concentration of suspended material is comparedwith the depth of penetration. Secchi depth observations were madefrom the shaded side of the boat to avoid sun glare (Davies, Colley andVant, 1988) in all 47 sampling locations (Figure 1). At extinction depth,water samples were collected with the help of a depth sampler for allthe sampling locations. At every sampling point the depth of the bedwas measured for identifying a point with negligible bottom effect andto ensure the extinction depth is less than the bottom depth to avoidbottom noise effect.
To reduce the time lag between IRS-1A overpass and sampling,the collection of water samples and measurements of pH, conductivityand secchi depth were carried out between 7 a.m. and 6 p.m. for all thesampling locations on the days of two successive overpasses. (28September and 20 October 1988).
Water samples were filtered through an ultra cellulose membranefilter paper (millipore 0.45 ìm) using a Buchner funnel and a vacuumpump to estimate the total suspended matter. Suspended sediments ofeight water samples representing various reaches of the reservoir wereselected for bulk mineralogy and particle size analysis. Initially, thesuspended matter was treated with hydrogen peroxide to remove organicmatter coatings on mineral grains. The sediments were mounted by thedrop on slide technique (Gibbs, 1967) and were uniformly spread on theglass slide to avoid differential settling of the particles and glycolation.The mineral composition was determined using a Philips x-raydifractometer with Cu-Ká radiation and Ni filter. Mineral identificationand estimation of abundance was done following the methods of Biscaye(1965) and Carrol(1970).Particle-size distribution in suspended solidswere determined by a Fritsch analysette-22 laser particle size analyser.
IRS-IA-LISS-I computer compatible tapes (CCT’s) were acquired forthe scene (path-row 27-52) of Tawa reservoir on 28 September and 20October 1988. The image data on the CCT’s were radiometrically andgeometrically corrected. In order to seperate land and water components,a binary mask was made by determining an interactive threshold for LISS-I band 4, which was then used to mask out land areas in other bands 1, 2and 3 (Lindell et ai., 1985; Khorram and Cheshire, 1985). Masked (water)

96
pixel values for each spectral band were extracted for 3 x 3 arraysencompassing each of the 21 and 47 sampling locations for 28 Septemberand 20 October 1988, respectively. The LISS-I pixel values measured inDNs were converted into radiance in mW/cm2/ìm for bands 1,2 and 3before the regression analysis. Water is a strong absorber of band 4 (0.77-{).86μm) near infrared radiation and, hence, is not included in the analysis.
4. RESULTS AND DISCUSSIONS
The absorption and scattering process determine watertransparency (Lindell et at., 1985). Clear water being blue in color absorbslight in all the other spectral regions to a large extent and reflects bluelight. Suspended particles scatter light and the amount of light scatteredis related to the degree of turbidity, particle surface area, and the physicaland ‘optical properties of the material (Jerlov, 1976).
It has been observed that uniform atmospheric conditions existedover the entire reservoir because air masses and the sky in the regionwere dry and clear. No wave action was observed on the calm watersurface. No urban/industrial units existed in the region which couldproduce aerosol nonhomogenity (Topliss et al., 1990). Hence, it is assumedthat an atmospheric contribution to the signal is relatively unimportantin the Tawa reservoir, which is enclosed by hilly terrain. Yarger et al.(1973)suggested that sun elevation=45 degrees exhibit a weak dependence onthe sun angle and that the angle of incidence of reflected light are notimportant factors for a reservoir (concrete target).
The Tawa reservoir is devided into three hydrodynamic zones,inflow, transition, and main body of the reservoir (Figure 1). The inflowzones are turbid and the transition zones are relatively less turbid. Themixing of water and sediment discharge from the Tawa and Denwa riversis observed in the main body of the reservoir, where turbidity is lessthan in the other two zones.
The reservoir water is alkaline in nature (pH 7.8). The conductivityreflects the chemical characteristics of the water discharged by the riverinto the reservoir. A significant difference in conductivity values wasobserved in both flanks (Tawa and Denwa) and a combined effect ofboth rivers water in the main body of the reservoir water. The averageconductivity values are 291.9 μs cm-l, 142.3 μs cm-l and 225.4 μs cm-l in

97
the waters of the Tawa and Denwa rivers and in the main body of thereservoir. This suggests that the Tawa River discharges more chemicalsthan the Denwa into the reservoir.
Water transparency is primarily controlled by suspended load(Choubey, 1990), Figure 2 shows that the secchi depth (SD) measurementsof light extinction decreases when the concentration of suspended solidincreases, which indicates that SD is inversely related with suspendedsolids concentration.
The seechi depth (SD) measurements varied considerably forvarious reaches of the Tawa reservoir (Table I). On the Tawa inflow zoneof the reservoir, the SD varies between 21 and 30 cm. The low watertransparency is due to the heavy suspended solids loading from the riveroutlet. In the transition zone, water transparency gradually increasesand the water becomes more homogeneous with a SD of 30-35 cm. Theabrupt change in a few locations (example s1. No. 16) indicate influx ofsupended load from small tributaries joining the transition zone. In theDenwa inflow area, the SD values are comparatively low, in range 13-25cm, which indicates the presence of a high concentration of suspendedsolids discharged by the river. On the other hand, in the main body, dueto intense mixing of river sediment laden with water, the SD is between22-27 cm. The maximum suspended solids loading appears to be fromthe Denwa region.
A plot of SD against radiance values for each LISS-I band (Figure3) indicates that as the SD values increase, there is a decrease in theradiance value. It was noticed that bands 1 and 2 exhibit hyperbolic curvesand a flat response beyond 25 cm. This indicated that bands 1 and 2(0.45 to 0.59ìm) approach saturation above a SD of 25 cm. However, band3 (0.62-O.68ìm) shows a consistently decreasing linear trend and a highcorrelation (r = 0.89). The relationship between SD and radiance suggeststhat the water clarity depends on the concentration of suspended solidsand on the physical and optical properties of suspended matter (primarilyinorganic particulates).
The mineralogy characterises the nature of the suspendedsediments in the reservoir water; as such they may not exactly representthe final suspended material in the reservoir after mixing (Subramanian,

98
1980). The reservoir’s main body exhibits mineralogical characteristicsbetween those of the Tawa and Denwa sediment discharges. The Denwasuspended sediments are coarse grained, whereas those of the Tawa arefiner. Grain size-controlled mineralogy due to differential settlingmechanism (Gibbs, 1967) can cause differences in the mineralogy ofreservoir-suspended sediments.
The mineral composition of the suspended sediments at eightlocations are shown in Figure 4. The mineral composition of thesuspended sediments is an important parameter affecting the relationshipbetween water clarity and reflected radiance (Choubey, 1990). The TawaRiver contributes an equal amount of kaolinite and montmorilloniteexpandable clays in the inflow-transition zone and a significant amountof feldspar observed in the inflow zone. A very high percentage (70%)of kaolinite and a substantial amount of montmorillonite, illite, quartz,and feldspar are present in the Denwa inflow zone.
The different mineralogy of the Tawa and Denwa dischargeindicates that the dominance of fine clay minerals in the Denwa inflowmay be the reason for the low water transparency at a more or less equalconcentration in the Tawa inflow where the presence of silicates (feldspar)with clay minerals permits deep light penetration. This also suggeststhat water clarity depth varies with the presence of clay and non clayminerals in water.
In the Denwa region, the suspended solids concentration iscomparatively higher than those of Tawa. However, the secchi depthvalues do not show appreciable change with change in the suspendedsolids concentration. Hence, it can be stated that water transparency isexpected to be affected mainly by the layer of expandable kaolinite andmontmorillonite clay. In this case, there is a drastic change in theconductivity of water in Tawa (291.9 μm cm-1) and Denwa (142.3 μmcm-1).
Therefore, its influence on the relationship between suspendedmatter and water transparency cannot be ignored and needs to bestudied. The conductivity is inversely related to dissolved organicmaterial and the optimum wavelengh band 3 for monitoring water clarityis not influenced by dissolved organic matters (Topliss, 1990).

99
TABLE I. Field measured value of secchi depth and LISS-I radiancevalues in bands 1,2, and 3 for 20 October 1988
Sample No. Secchi depth Band 1 Band 2 Band 3
1 22 4.68 3.89 2.23
2 21 4.58 3.85 2.07
3 27 4.47 3.87 2.20
4 26 4.53 3.91 2.20
5 27 4.53 3.87 2.20
6 27 4.53 3.87 2.20
7 26 4.61 4.05 2.24
8 27 4.58 3.91 2.31
9 28 4.52 3.85 2.14
10 28 4.44 3.67 2.13
11 27 4.47 3.66 2.13
12 27 4.45 3.66 2.13
13 27 4.45 3.66 2.13
13 26 4.47 3.68 2.04
14 30 4.44 3.56 1.99
15 32 4.43 3.66 2.04
16 27 4.56 3.72 2.05
17 31 4.45 2.68 1.95
Tawa transition zone
18 4 4.43 3.55 1.95
19 31 4.45 3.49 1.97
20 34 4.42 3.53 1.93
21 35 4.42 3.51 1.81
22 34 4.43 3.56 1.81
23 35 4.36 3.56 1.81
24 30 4.48 3.72 1.93
Main body
25 27 4.77 4.05 2.10
26 27 4.84 4.10 2.20
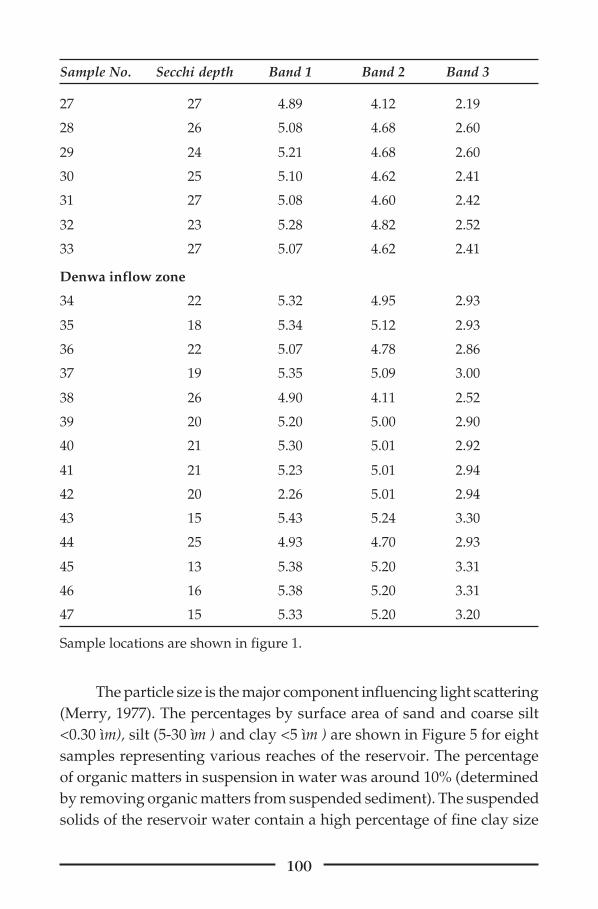
100
27 27 4.89 4.12 2.19
28 26 5.08 4.68 2.60
29 24 5.21 4.68 2.60
30 25 5.10 4.62 2.41
31 27 5.08 4.60 2.42
32 23 5.28 4.82 2.52
33 27 5.07 4.62 2.41
Denwa inflow zone
34 22 5.32 4.95 2.93
35 18 5.34 5.12 2.93
36 22 5.07 4.78 2.86
37 19 5.35 5.09 3.00
38 26 4.90 4.11 2.52
39 20 5.20 5.00 2.90
40 21 5.30 5.01 2.92
41 21 5.23 5.01 2.94
42 20 2.26 5.01 2.94
43 15 5.43 5.24 3.30
44 25 4.93 4.70 2.93
45 13 5.38 5.20 3.31
46 16 5.38 5.20 3.31
47 15 5.33 5.20 3.20
Sample locations are shown in figure 1.
The particle size is the major component influencing light scattering(Merry, 1977). The percentages by surface area of sand and coarse silt<0.30 ìm), silt (5-30 ìm ) and clay <5 ìm ) are shown in Figure 5 for eightsamples representing various reaches of the reservoir. The percentageof organic matters in suspension in water was around 10% (determinedby removing organic matters from suspended sediment). The suspendedsolids of the reservoir water contain a high percentage of fine clay size
Sample No. Secchi depth Band 1 Band 2 Band 3

101
particles (0.5-0.10 ìm ), in Tawa (77%), Denwa (82%), and 56% in mainbody. The inflow zones carry coarser grains than the transition zone.The particle size distribution in the reservoir water shows no greatvariation in the particle size of suspended matter, hence a uniform effectof particle size on reflected radiance can be assumed (Munday et al.,1979).
The optical properties of suspended sediments are an importantparameter affecting the relationship between remotely sensed data andwater clarity. The scattering of light is the result of diffraction, refraction,and reflection. Diffraction will occur independent of the particlecomposition, whereas refraction and reflection are determined by therefractive index of the particles (Jerlov, 1976). The suspended particlesin the reservoir water are non absorbing spherical/foliated particles,characterised by a refractive index (Nanu and Robertson, 1990). The indexof refraction for the violet of the spectrum is greater than for the red and,on refraction, red is deviated less than violet (Kerr, 1959).
TABLE II. Optical properties of major minerals present in thesuspended of reservoir water
Mineral Refractive index Crystal system Bifringence
Kaolonite Least 1.561 Triclinic 0.005
Greatest 1.566
Montmorillonite least 1.492 Monoclinic 0.021
Greatest 1.513
Illite least 1.535-1.570 Monoclinic 0.030
Gretest 1.565-1.605
Feldspar least 1.518 Monoclinic 0.008
(alkali) greatest 1.526
Quartz least 1.544 Haxagonal 0.009
Greatest 1.533
Pure water 1.333
Montmorillonite and illite; their average indices of refraction are 1.563, 1.503, and
1.569, respectively.

102
In general, it is reasonable to expect that the refraction from themixture of clays and non clay minerals of varying reflective indices inthe Tawa region may blur the light and bring out the same effect onreflected radiance. On the other hand, kaolinite (70%) with a higherrefractive index than montmorillonite (20%), may produce morerefraction in the visible region of the spectrum.
Further study on the effect of the optical properties of individualminerals and combinations of various minerals on the relationshipbetween suspended matter concentration (relating to water transparency)and reflected radiance in laboratory controlled conditions may providebetter results.
To develop the estimator equation, LISS-I multispectral digital dataand field measurements of 20 October 1988 were used. A least-squaresregression procedure was used to produce the estimator equation forsecchi transparency in terms of LISS-I radiance values. The dependablevariable was SD and LISS-I bands 1, 2, and 3 radiance values wereindependent variables. Forty-seven data points of 20 October 1988 fromthe Tawa reservoir surface water were used to obtain the estimatorequation for SD.
In order to increase the analytical range, a multiple band approachwas adopted. All the possible combinations of the independent variableswere tested so as to find the most efficient equation. An optimumestimator equation (Table III(a) is obtained on the basis of the highestcorrelation coefficient approaching unity; the minimum standard erroraproaching zero and the F value four times greater than a critical valuefor F (Fer) (Whitlock et al., 1982). The relationship between observedand estimated values for the 20 October 1988 data set are shown in Figure6(a), and the statistical parameter in Table III(b). The estimator equationhas given good agreement with field data of the SD, where suspendedsediments are dominant.

103
TABLE III. Multiple regression equation used to estimate value ofsecchi depth from 20 October 1988, LISS-I mean radiance values. Forverification 28 September 1988 Liss-I mean radiance values were used
YSD = a-bx1+cx2
Where YSD = Secchi depth expressed in centimeters
x1 = (band 1+ band 2+band 3).
x2 = (band 1+ band 3).
a = 72.97, b = 0.85, c = -1.99.
TABLE III b.Statistical summary for the multiple regressionequation based on 20 October 1988, LISS-I mean radiance values
Secchi depth
Coefficient of Determination 0.887
Coefficient of Correlation 0.942
F value 161.62
R.M.S.E. 1.83
F/Fcr
(0.01 level) 31.13
Residual range -7.99 to 4.54
The distribution of points around the 1: 1 line is suggesting little orno bias in the data. Some of the scatter reflects an error in the fieldmeasurements of SD, which is around 10% (Davies-Colley and Vant,1988). The time lag between IRSIA overpass and SD measurements (6 to7 hours) may introduce an error. The SD values are underestimated athigh SD, which may be due to the presence of 10% organic matter(pigment) in suspension. The probable reason for overestimation at lowSD may be the increasing inhomogenity in the suspended soliddistribution in the sampling locations.
The verification of the estimator equation was tested by applyingit to the 21 data sets of 28 September 1988 bands 1, 2 and 3 radiance

104
values for the Tawa reservoir. The relationship between field-measuredvalues and values estimated by the equation are shown in Figure 6(b),which shows the validity of the estimater equation as data points arescattered around the 1: 1 line. The effect of unequal illumination causedby changing sun elevation angles from one IRS-IA pass to the nextappears to be at its minimum (2: 45 deg). The coefficient of correlationand standard error was r=0.92 and 1.36 cm respectively. This indicatesthat the estimator equation appears to be satisfactory for prediction waterclarity in the Tawa reservoir.
5. CONCLUSIONS
The result from this study may help to determine the water qualityof the Tawa reservoir. On the basis of the results obtained, it can beconcluded that:
(1) a functional inverse relationship exists between SD and LISS- Iradiance values in the wavelength range 0.45-0.68ìm. The Tawareservoir water calibration of SD and band 3 of LISS-I shows a goodcorrelation (r = 0.89, n = 47) in the range of 13-35 cm;
(2) the coefficient of correlation between observed and estimated SDdata for the 28 September 1988 data set was r= 0.92, indicating thatthe equation could accurately predict the water quality for thisreservoir on new occasions from IRS-IA-LISS-I spectral data;
(3) IRS-IA-LISS-I multispectral data are well suited for water qualitymapping, since the LISS-I spectral bands 1, 2 and 3 (0.45-0.68ìm)are located in the visible region, having penetration capability inwater;
(4) the errors are caused probably by the field measurements of Sd10%) and the presence of organic matters in the suspension inwater;
(5) A generalised estimator equation can be developed consideringvarying conditions of sun illumination angle, algal pigment andhydrodynamic conditions during different seasons of the year;
(6) the water quality is primarily controlled by the concentration, andphysical and optical properties of the suspended sediments.
(7) further study on the effect of optical properties of water constituents(suspended matters) on the reflectance may be useful to enhancethe utility of remotely sensed data for water quality monitoring.

105
REFERENCES
1. Alfoldi, T. T., and Munday, J. C. jr., 1978, Water quality analysis bydigital chromaticity mapping of Landsat data, Can. J. RemoteSensing 4(2),108-126.
2. Biscaye, P. E., 1965, Mineralogy and sedimentation of recent deepsea clay in the Atlantic Ocean and adjacent seas and oceans, Geol.Soc. Am. Bull. 76, 803-832.
3. Bukata, R. P., Bruton, J. E., and Jerome, J. H., 1983, Use ofchromaticity in Remote measurements of water quality. RemoteSensing of Environment 13, 162-177.
4. Carrol, D., 1970, Clay minerals a quide to their identification, Geol.Soc. Am, special paper 126:80.
5. Choubey, V. K., 1990, Modelling sediment and dissolved load ofTawa reservoir and river (MP) by Remote Sensing techniques, PhDthesis, JNU, New Delhi.
6. Davies-Colley, R. J. and Vant, W. N., 1988, Estimation of opticalproperties of water from secchi disc depth. Water. Resour. Bull. (AWRA) 24(6), 1329-1135.
7. Gibbs, R. J., 1967, The geochemistry of the Amazon river systempart I: The factors that control the salinity and the composition andconcentration of the suspended solids, Geol. Soc. Am. Bull. 78, 1203-1232. .
8. Jerlov, N. G., 1976. Marine Optics, Elsevier, Amsterdam.
9. Kerr, P. E., 1959, Optical Mineralogy, McGraw Hill, New York, pp.163-168.
10. Khorram, S., and Cheshire, H. M., 1985, Remote sensing of waterquality in the Neuse river estuary, North Carolina,Photogrammetric Engineering and Remote Sensing 51,329-341.
11. Lindell, L. T., Stein vall., Johnson, O. M., and Classon, T. H., 1985,Mapping of coastal water turbidity using landsat imagery, Int. J.Remote Sensing 6(5), 629-642.
12. McCauley, J. R., 1977. Reservoir water quality monitoring withorbital remote sensors, Ph D thesis, Department of Geology,University of Kansas.

106
13. Marry, J.C., 1977. Airborne spectro-radiometer data comparedwith ground water turbidity measurements at Lake Powell Utah,Cold Region Research and Engineering Laboratory, NewHampshire.
14. Munday Jr. J.C., Alfoldi, T. T., and Amos, C. L., 1979, Bay of Fundyvarification of a system for multidate Landsat measurement ofsuspended sediment, Satellite Hydrology (A WRA), June 1979, 622-640.
15. Manu, L. and Robertson,C., 1990, Estimating suspended sedimentconcentrations from spectral reflectance data, Int. J. Remote Sensing11(5),913-920.
16. Ramsey, E. W. and Jensen, J. R., 1990, The derivation ofwater volume reflectance from airborne MSS data using insitu water volume reflectance and a combined optimizationtechnique and radiative transfer model, Int. J. Remote Sensing11(6),977-998.
17. Ritchie, J. C. and Cooper, C. M., 1988, Suspended sedimentconcentrations estimated from Landsat NSS data, Int. J. RemoteSensing 9, 379-387.
18. Subramanian, V., 1980. Mineralogical input of suspended matterby Indian rivers into the adjacent areas of the Indian ocean, MarineGeology 36, 29-34.
19. Topliss, B. J., Amos, C. L., and Hill, P. R., 1990, Algorithm for remotesensing of high concentration,inorganic suspended sediment, Int.J. Remote Sensing 11(6), 947-966.
20. Verdin, J. P., 1985, Monitoring water quality conditions in a largewestern reservoir with. Landsat imagery, Photogrammetric Eng.Remote Sensing 51(3), 343-353.
21. Whitlock, C. H., Kuo, C. Y, and LeCroy, S. R., 1982, Criterion forthe use of regression analysis for remote sensing of suspendedsediment and pollutants, Remote Sensing of Environment 12, 151.
22. Yarger, H. L., McCauley, J. R., James, G. W., Magnuson, L. M. andRichard, G., 1973, Water turbidity detection using ERTS-I imagery,Proc. ERTS-l Symposium, Washington, DC, pp. 651-660.

107
Fig 1. Location map of water sample sites on the Tawa reservoir

108
Fig 2. Relationship between suspended solids and secchi depth

109
Fig 3. Relationship between secchi depth and LISS-I radiancevalue in band 1,2 and 3
Fig 4. Histogram of the mineral composition of suspended solids.K=Kaolinite, M=montmorillonite, NC=feldspar + quartz

110
Fig 5. Histogram of the particle size distribution of suspended
Fig. 6(a) Fig. 6(b)
Fig 6. (a) Relationship between field-measured and estimated values of secchi depth frommultiple regression equation using 20 October 1988 LISS-I radiance data. (b) Relationship
between field-measured and estimated value of secchi depth from developed multiple regressionequation using 28 September 1988 LISS-I radiance data for equation verification.

111
MANAGEMENT ANDCONSERVATION ISSUES
A. Ramsar site of Keoladeo National Park
i. Wetlands: A Background Note by Harshvardhan
ii. Community participation in management of Keoladeonational park by Sunayan Sharma
B. Ramsar site of Sambhar Lake
i. Conservation of Sambhar wetland in Rajasthan by R PMathur and L N Mathur
ii. Sambhar Lake – wetland an assessment by A. AbdulRahman
iii. Present and Palaeo wetlands of northwest Thar desert,Rajasthan, India – implications for geo-environmentalconservation by P C Shrivastava and S K Wadhawan

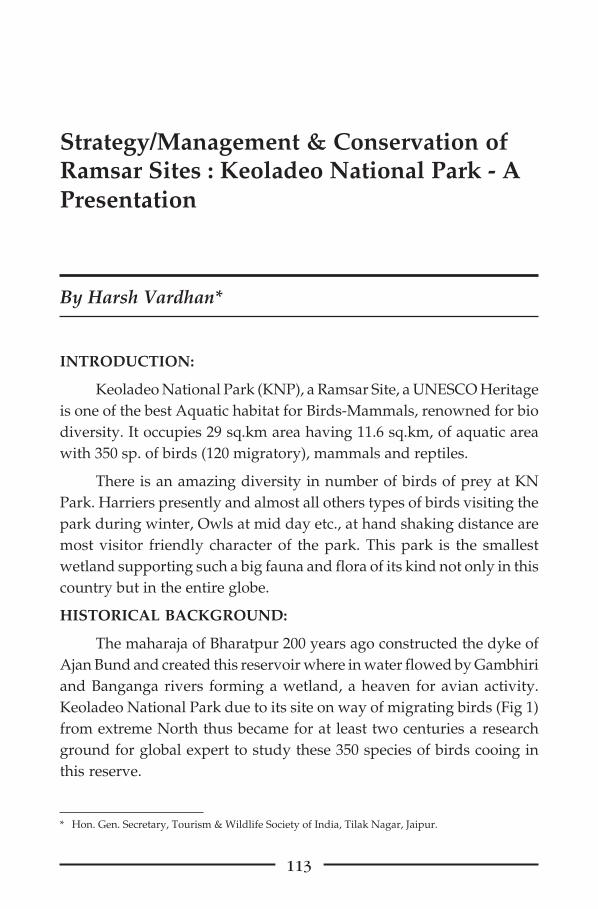
113
Strategy/Management & Conservation ofRamsar Sites : Keoladeo National Park - APresentation
By Harsh Vardhan*
INTRODUCTION:
Keoladeo National Park (KNP), a Ramsar Site, a UNESCO Heritageis one of the best Aquatic habitat for Birds-Mammals, renowned for biodiversity. It occupies 29 sq.km area having 11.6 sq.km, of aquatic areawith 350 sp. of birds (120 migratory), mammals and reptiles.
There is an amazing diversity in number of birds of prey at KNPark. Harriers presently and almost all others types of birds visiting thepark during winter, Owls at mid day etc., at hand shaking distance aremost visitor friendly character of the park. This park is the smallestwetland supporting such a big fauna and flora of its kind not only in thiscountry but in the entire globe.
HISTORICAL BACKGROUND:
The maharaja of Bharatpur 200 years ago constructed the dyke ofAjan Bund and created this reservoir where in water flowed by Gambhiriand Banganga rivers forming a wetland, a heaven for avian activity.Keoladeo National Park due to its site on way of migrating birds (Fig 1)from extreme North thus became for at least two centuries a researchground for global expert to study these 350 species of birds cooing inthis reserve.
* Hon. Gen. Secretary, Tourism & Wildlife Society of India, Tilak Nagar, Jaipur.

114
Fig 1: Migration of the Siberian Crane
KNP acquired status of a Ramsar site providing a pleasing site forvisit of large number of bird watcher from all over the world for observingand viewing during day and night the birds, mammals and reptiles fromclosest distance one could imagine from places around the park by shortpromenade or by even a hand pulled riksha ride.
DEVASTATION OF THE WETLANDS:
Once prolific site sheltering the fauna specially avifauna got invadeddue to continued drought (no flowing water) leading to extinction ofseveral fauna from the park rarest of them being otter (oot bilav). Prosopisjuliflora has taken over aquatic regime of Park leading to extinction ofseveral species specially python. Also several flora species facedextinction. Eradication of acquatic vegetation was responsible for thedecline of visit of water fowl due feed loss for their survival. Importantof them are:
• Siberian Crane extinct (Fig 2)
• Heronries decline
• Ducks reduce

115
• Habitat loss
• Water crisis in villages.
Fig 2. Crane Crash
In addition the causes of the decline were:
• Erratic rainfall, intermittent drought and no concern for ecologicaldecline…
• Pachana Dam under way since mid 80s, and forest officials keepinga Nelson’s Eye over future of Park
• By 2002-03, Pachana ready and Park is shorn of flowing water
KEOLADEO ON DEATH BED:
Repeated reminders by Indian and overseas experts to Govt. aboutlack of flowing water to Park failed and even issues of reports were notaccepted by Supreme Court. The result was writing an “Obituary ofPark”. It is sad situation that State or Central Bodies found the devastationas a natural calamity with very few or no options.

116
MANMADE EFFORTS:
Rain have failed to provide water to this park. However, continuousman made efforts from concerned stake holders have led to installationof Chiksana canal (funds from government) and also Goverdhan Drainwhich are expected to provide water to the park in coming future. Ifthese efforts are successful we could revive the ecosystem and Godwilling KNP may again recoup rarest of the rare bird like Siberian Cranesand other species of avifauna. The efforts of the forest department inremoving exotic species with collaboration from the community wouldbe one of the most important man made effort for recuperation of thepark to the past glory.
STRATEGY:
One may think of following considerations as strategic points forconservation and management of KNP:
• Involve stake holders
• This Seminar to resolve for drafting the strategy to goad Govts. &honour their Constitutional Conservation Commitment; a WorkingGroup be set up
• Seek Court’s intervention
• Involve Research Institutions
���

117
Community Participation in Managementof Keoladeo National Park
By Sunayan Sharma*
Keoladeo National Park, popularly known as “Bird Paradise” isone of the world’s most renowned wetland. Presence of three majorecosystems namely the Wetland, Grassland and Woodland offers adiverse habitat for many animals and bird species. The wildlife valuesfor which the park is being managed are:
• Around 370 species of birds and 375 species of flowering plantshave been recorded in this man-made wonder of 29 Sq.Km.
• The Park has one of the world’s most spectacular heronries, whichhosts a large number of migratory and resident birds (15 Species).
• The park serves as a major wintering ground for migratorywaterfowl from the Palaearctic region. A large congregation ofmigratory waterfowl cover the water surface during midwinter.Of the 25 known duck species, eight are common.
• Keoladeo National Park is the only wintering site in India for thecentral population of the rare and endangered species of SiberianCranes. The Siberian cranes come to the park between the middleof October and middle of November and leave for Siberia betweenthe end of February and the middle of March.
• The park has the last remnant patch of the Yamuna flood-plains.
• The herpeto-fauna of Keoladeo National Park is very rich. The whole
* Director, Keoladeo National Park, Bharatpur

118
of Rajasthan state has only ten species of turtles while this smallpark alone has seven species. Besides this, there are five lizards,thirteen snake species and seven species of amphibians.
• Mammal fauna of the park is equally rich with 27 identified species.
Invasion of P. juliflora has posed a serious threat to the fragile ecosystem of this world heritage site. Chief reasons responsible for thiscritical situations are:
1 Acute water shortage in the park
Keoladeo National Park (K.N.P.) receives water from Ajan damwhich is situated adjacent to the park. This dam receives waterfrom two rivers namely Gambhiri and Banganga. In last 10 yearsdue to lot of constructions of various water harvesting & otherstructures the later has virtually seized to contribute to the dam.
After construction of Panchana dam over Gambhiri in Karaulidistrict of Rajasthan, supply of water from Gambhiri also gotadversely effected. The main problem arose in 2003 when the damheight of Panchana was raised to increase its water holding capacityfrom 450 to 2100 Mcft. As a result 2004 was a drought year for thispark when the park received only 18 Mcft. water from Ajan.Fortunately heavy rains in the catchment of Ajan brought sufficientwater in 2005, but 2006 was again a total drought year.
Shortage of water spread in the park provides great opportunity toP.juliflora seedlings to germinate and vigorous growth in its biggerplants.
It is mentionable that the optimum water requirement of this parkis about 550 M.cft. Up to 70s with so much of water for someperiod of time the entire park including its wood land area, spreadover 11Sq.km, used to get inundated under water, during rainyseason for quite a period of time. This technique was extremely fruitful in keeping a check over undesirable growth of weeds likeP. juliflora, as the seed of this weed used to get perished undersuch conditions.
In 80s, water supply to the park started reducing due to reasonsmentioned above. Now taking advantage of the dry conditions in

119
the park, P.juliflora started spreading & establishing fast in variousareas of the park. Within a span of few years it succeeded in notonly taking over the entire wood land but also invaded wetlandsof this park.
2. Enormous coppicing power of P.juliflora
P.juliflora has vigorous coppicing power. The park managementhas been trying to kill the mother trees since long but could notsucceed because of its enormous coppicing power. Even the burntstumps of its trees sprout back with great vigor. Therefore, thisweed can not be eradicated by adopting any technique other thanuprooting every individual plant, big or small.
3. Easy seed dispersal.
A. Winds are common in K.N.P during summer when P.julifloramother trees are seen laden with ripe seeds.
B. High number of mammal population in K.N.P.
The wild animals like Blue Bull , Chital ,Wild Bore & the feral anddomestic cows eat the ripe seed and throw it in the entire park. Theseed so treated in the animal stomach when falls on the moist floor ofthe park’s soil along with the pellet dung, sprouts quickly.
Due to the above reasons P. juliflora has succeeded in posing areal threat to the survival of the unique eco system of this park.
HOW TO COUNTER THIS THREAT?
Uprooting of every individual plant of P.juliflora is the only solutionto this problem .Several crore plants are standing in the park. Thereforeuprooting especially of the mother trees require crores of rupees,whichis very difficult to be procured from the Government.
Of course the trees with fuel wood value could attract some woodmerchants/contractors, who could agree to uproot the trees free of costand even pay some price for the wood so obtained from the uprootedtrees.
This could be a good solution to the problem but could not bepracticed because of the strict prohibition imposed by the WildlifeProtection of India. As per the provisions of this act no profit can be

120
earned through removal of any kind of produce (including weeds) fromthe National Parks.
Under such a situation the only remedy left was to get the treesuprooted free of cost through the neighboring villages. But it was almostan impossible task because of the peculiar temperament of the Bharatpur(rural) people. This was the chief reason responsible for failure of theefforts done by the park management in the past.
Of course manual uprooting of big size trees was a herculean task.
In a situation when P. juliflora had brought the park to the heightof degradation of its bio diversity, it was imperative upon the parkmanagement to take up this issue on top priority alike the water issue.
THE PARK MANAGEMENT TOOK UP THE CHALLENGE OFMOTIVATING THE VILLAGERS.
• K.N.P. is surrounded by 16 villages. Strategically RamNagar villagewas selected as the first village to start this new experiment.
• The best Forest Guard was posted at Ram Nagar chowki, underwhich this village lies.
• One Range Officer was deputed for this purpose alone under thesupervision of another senior range officer.
• This team along with the personnel of the concerned Naka heldnumber of meetings with the villagers of RamNagar.
• They ultimately succeeded in motivating people to agree to uprootthe P.juliflora trees in lieu of the wood so obtained from these trees.
• An Eco Development Committee (EDC) was formed on 15.2.07 byregistering almost all the villagers belonging to various caste, creed,financial & social positions.
• The work was started in front the RamNagar chowki & under strictsupervision of the above forest personnel but with the instructionsto guide the villagers instead of rebuking them.
• The (EDC) members were grouped family wise and each familywas allotted a 10x100mt area. These plots were numbered serially. They were asked to remove all the P. juliflora trees including newseedlings & saplings, by root.

121
• They were allowed to take away the wood so procured from thesetrees &plants free of cost ,to their home for their bonafiade use.
• Complete record of the wood so transported out of the park byevery individual and their families was maintained by the parkmanagement.
• In spite the initial problems, the uprooting work kept on going at areasonable pace.
• Good message was passed on to other villages and we availed thisopportunity in persuading them to take up this work on the patternof Ram Nagar village.
• By the end of June 07 EDC were formed in all the 14 villagessurrounding the park.1378 people belonging to 338 families hadjoined hands with the park management in removing this menaceof P.juliflora from the park.
• On 25.7.07 one more village named Nagla Abhay Ram joined thisoperation
• 36 more families belonging to first 14 villages joined the work
• The villagers worked hard throughout the summer whentemperature rose even to 47 degree C.
• In return of the hard labour the villagers belonging to these 15villages received about 61195 quintal of wood up to 15thAug, 07
• Thus by people’s participation we could succeed in freeing about4.5 Sq.Km.of area, from the P.juliflora mother trees along withseveral thousand seedlings & saplings.
This is not the end . The work is continuing. More & more villagersare joining with great enthusiasm.
The park management is hopeful of accomplishing thisimpossible task of freeing the park completely from the P.juliflora’smother trees, in just another one year
Perhaps it is the lone example in the country where such asuccessful managerial intervention of this magnitude has been doneby the park management with people’s(villagers) participation.
122
Conservation of Sambhar Wetland inRajasthan
BY R.P.Mathur* & L. N. Mathur*
1. INTRODUCTION
Sambhar literally means salt. Sambhar Salt Lake in Rajasthan iswell known for salt manufacturing since long including periods ofScindhias, Rajputs, Marathas, Moghuls, rulers of Jaipur and Jodhpur(joint owners) leased it to British in 1870. Independent India has witnessedits possession by Government and presently managed by Sambhar SaltLimited and Hindustan Salt Limited. Sambhar wetland is of touristinterest also. The saline lake has been designated as Ramsar site (wetlandof international importance) because of wintering area for tens ofthousands of flamingos and other birds migrated from northern Asia.The lake is referred in epic Mahabharta. Raja Yayati (Emperor ofBharatvarsh) and a descendant of Lord Brahma married Devyani(daughter of Sukracharya) who lived near the lake. A temple of Devyanistill exists near lake city. According to other legend the GoddessShakambhari whose temple also exists under a rocky outcrop near thelake gifted the lake some 2500 years ago. Archaeological findings nearNalisar (4 Km from lake city) give evidence of planned settlement ofKushan and Gupta periods. The lake is good place to enjoy sunset.
The elliptical shaped India’s largest Sambhar salt lake is situatedin the vicinity of Aravalli hills (260 58’N 750 05’ E) at an altitude of about350 metres above mean sea level (mamsl) covering an area of about 233Sq.Km. It is about 60 Kilometres away from Jaipur and comes partly in
* Central Ground Water Board, Jhalana Institutional Area, Jaipur.

123
Jaipur and Nagaur district of Rajasthan State. 5 Km long stone dam hasdivided the lake. Brine from vast western side of dam is pumped viasluice gates after a particular density (considered optimal forcrystallization) to eastern side of dam, which serves as reservoir for saltextraction. Britishers laid down rail trolly system (presently replaced bymini diesel locomotives) across the dam to various far flung locations oflake. Maximum length of lake is 22.5 Km (ENE-WSW) whereas its widthwidely ranges from 3.2 to 11.2m. Depth of lake ranges from fewcentimetres to maximum depth of about 3m. Average depth of lakeduring monsoon period is about 0.6m. The area experiences semi-aridto arid climatic conditions with annual average rainfall of 550mm,average annual temperature of 230C and maximum temperature of 45oC.Geomorphologically, the lake playa is surrounded by aeolian depositsexcept in the west and northwest where hillocks comprising of gneissesand schist are found. The salt lake is fed by present drainage systems ofMendha, Roopnagar, Kharian and Khandel. Mendha river, the largestfeeder stream (catchment area 3600 Sq. Km) originated in the north eastof the lake (Sikar district), flows southwestward and enters the laketowards north. Rupangarh river originating in the south near Ajmer cityhas northeasterly flow and join the lake from south after draining about625 Sq. Km hilly areas. Total catchment area of the lake is about 7500 Sq.Km. The drainage system carries about 0.15 tones of salts annually tothe lake mainly by river Mendha followed by Rupangarh. Despite largecatchment area, the lake presently receives very little surface rainwaterrun off due to construction of numerous check dams and also because ofdiversion of lake water in to the reservoir (eastern side of dam) for largescale salt manufacturing.
The wetland of Ramsar status is under threat of shortage of water,desertification, disappearing biodiversity, decreasing salt production,deteriorating quality of salt and overall ecosystem. There is urgent needfor developing effective management strategy based on scientific studiesfor conservation of the wetland of international importance.
2. GEOLOGY AND MINERALOGY
The Sambhar salt lake area is occupied by Delhi Super Group ofrocks (early to middle Proterozoic age) comprising mainly of quartzite,

124
schist and gneisses at places. Outcrops of Aravalli Range (500mamsl)are found in northern parts (north of Nawa), northwestern parts (aroundPalri, Gudha etc.). Quaternary unconsolidated lacustrine sediments alongwith aeolian sand deposits overlie these hard rocks. The clastic sedimentsconsist of quartz, alkali feldspar, mica chlorite, amphibolite andweathered product including kaolinite and goethite whereas the non-clastic evaporates are mainly halite and calcite. Thenardite, Kieserite andPolyhalites are the dominated minerals above 5.5m depth while gypsumis the major mineral below this depth (R. Sinha et al, 2003).
3. HYDROGEOLOGY
Depth to water level in the lake area ranges from 18m to 20m. Mostof the wells and tube wells in the area are tapping alluvial aquifers andweathered/fractured portion of underlying Delhi Super Group of rocks.Sambhar Salt Limited has constructed 83 tube wells for groundwaterwithdrawal for salt manufacturing by simply evaporation process. Outof these 50 wells are abandoned because of mechanical failure or declininggroundwater levels. Salt production is also being done by the privateindustries. Groundwater level is declining at the rate of 0.70m per year.
4. GENESIS OF SAMBHAR SALT LAKE
Various hypotheses prevails for hyper-salinity in parts of Thardesert which include:
• Humes (1867-68) : Humes suggested submergence of an extensivearea of Rajasthan and Gujarat due to eustatic rise in sea level duringQuaternary period (Arabian sea).
• Holland and Christie (1909): They suggested transportation of saltfrom Rann of Kutch through strong windy storms.
• Godbole (1952): Godbole suggested inland extension of Tethys Seain parts of Rajasthan.
• Saksena and Seshadri (1966): Salinity in ground water is due tosubsurface flow of water from khewra etc. of salt range in Pakistan.
• Khandelwal (1975): Reported halite bed in the Didwana Lake andsuggested the salinity of all the salt lakes of Rajasthan due topresence of such salt beds.

125
• Paliwal,B.L: Explained origin of salt by existence of subsurface saltdomes.
• Singh et al (1974): Singh suggested that present aridity might havecaused choking up of the earlier drainage system forming closedbasins leading to accumulation of salts because of higher rate ofevaporation.
• Inland drainage system: The lower reaches of river Kantli,Banganga, Luni etc. die off inland where spread and stagnation ofwater in arid climates (more evaporation rates) as well as finetexture of soil and aquifers gives salinity.
Isotopic studies however suggest that lake brine is replenished bymeteoric surface run off (Ramesh et al.,1993; Yadav, 1997). Sambhardepression was developed due to neo-tectonic activities duringQuaternary period causing disorganization of earlier drainage(developing inland drainage) and forming local base level. The closedbasin lake is situated at the confluence of present and palaeo-channels.Palaeobotanical studies by Singh et al. (1974) assigns an age of 10,000B.P. to lacustrine deposits of Sambhar from freshwater pollen evidenceand with the onset of aridity during Quaternary times (high evaporationand less rainfall), the stagnant freshwater started to develop salinity andtransformed in to a salt lake with passage of time. However, carbon datingsuggests that the geochemical evolution of the lake is phenomenon ofmore than 30 ka and salinity is associated with clastic sediments alongwith thin non – clastic evaporites (R Sinha & B.C Raymahashay, 2003).Thus, salinity in the area is geo-genic. Gneisses and schists formationsin the area contribute to salinity during weathering through variouspresent & palaeo-channels under arid and semi-arid climatic conditions.
5. GROUND WATER QUALITY
It has been witnessed that surface of lake undergo desiccationduring summers forming efflorescent crust mainly consisting of halite& calcite with minor amount of dolomite, which gets dissolved inrainwater run off during monsoon increasing solute load of brine. Saltcrystallization takes place between 5o to 25o Be (density 1.036 to 1.208 g/cm3). There is change in deposition environ and brine chemistry at depthof 5.5m during Quaternary period from K- Na- Ca- Mg-SO4-Cl at shallow

126
depth to K-Na-CO3 -SO4-Cl type at deeper levels. At deeper levelsevaporation has taken place under the conditions of Ca> alkalinitywhereas reverse is true for shallow deposits (R. Sinha et al, 2003). Analysisof groundwater brine collected by Central Ground Water Board in thelake reveal specific conductance (EC) over 1,00,000 micro-mhos/cm at25o C and chloride ion is dominated with concentration from 1,17,860ppm to 1,32,770 ppm. Salient features of chemical quality are as follows:
• Specific conductance of all the brine samples is more than 1,00,000micro-mhos/cm at 25o C in all the samples.
• Chloride concentration is dominated with concentration from1,17,860 ppm to 1,32,770 ppm.
• Sulphate concentration varies from 11,100 ppm to 28,300 ppm.
• Brine samples have pH values up to 8.6.
• Nitrate concentration ranges from 74 ppm to 210 ppm.
• Total hardness expressed as calcium carbonate is found between1200ppm and 2800 ppm.
• Sodium values in brine lies between 84,500 ppm and 97,300 ppm.Potassium values ranges from 254 ppm to 432 ppm.
• Sodium Absorption Ratio (SAR) varies from 761 to 1232.
• Degree/density of brine varies from 17o to 20o. Brine with higherdegree is considered as more productive.
• Turbidity of water ranges from 243 to 266 turbidity unit.
• Dissolved oxygen in brine varies from 0.10mg/l to 0.70mg/l.
• Type and Class of water – Sodium is dominated cation (98.42% to99.29%) while chloride is dominating anion ( 83.86% to 92.07%).Thus water quality is of Na-Cl type and falls under C4-S4 class sofar as the irrigation is concern.
6. ISSUES AND PROBLEMS
Calcite and high Mg–Calcite gets precipitated during early stageof salinity increase followed by precipitation of mineral sequence ofsulphate, silicates and chlorides, which is controlled by relativeconcentration of Ca, Mg, HCO3, SO4 and Cl. Carbonate precipitation may

127
occur at higher salinity within the field of gypsum and halite(Schreiber,1998). This may be due to influx of Calcium rich groundwater(Rouchy et al. 2001).
Annual rainfall, average lake water level and salt production
S.N Year Annual Average lake Salt production
rainfall (mm) water level (cm) (Tones)
1 1995-96 907.80 76 157412
2 1996-97 1098.00 89 120148
3 1997-98 798.40 33 128125
4 1998-99 669.70 18 157597
5 1999-2000 331.91 00 125171
6 2000-01 288.30 23 106327
Surface water input in to the lake from various drainage systemshas been lessened due to construction of several surface embankmentsin the name of rainwater harvesting. Groundwater exploitation in andaround lake has significantly increased causing decline in groundwaterlevels and thereby diminishing natural recharge to groundwater. Despitethe fact that this has increased concentration of groundwater, the overallproduction and quality of salt has deteriorated. It is reported that a offwhite colour precipitate in powder form and dark brown chips are theimpurities on the wall of the wells impacting quantity and quality onsalt and damage to pump assembly.
The impurities in the form of powder or chips are in dissolvedform in groundwater in the aquifer (Calcium rich at deeper levels) dueto relatively higher pressure and temperature. During pumping ofgroundwater through wells the pressure gets released to some extentand temperature is marginally lowered causing deposition of least solublecalcium and magnesium in presence of NaCl. NaCl rich groundwaterhaving CaSO4 and MgSO4 as the impurities will tend to lower thetemperature of crystallization and will get precipitated first in comparisonto NaCl. The impurities of calcium-magnesium sulphate, carbonate orbicarbonate get crystallized around any particle or object in the path of

128
way i.e. wall of the well or soil particle in drain act as nuclei ofcrystallization. Early precipitation of impurities is also due to disturbancein equilibrium in lacustrine deposits. There is increase in concentrationof groundwater owing to decreasing input of surface water and loweringof natural recharge to groundwater due to declining water groundwaterlevels. The non-equilibrium state is thus causing reverse order ofprecipitation and in turn deteriorating quality of manufactured salt anddamage to wells and pumps.
7. MANAGEMENT STRATEGY
Maximizing input of surface water, base flow or groundwaterinflow in the lake is the solution of the issues of reducing quantity anddeteriorating quality of salt & overall ecosystem of the Sambhar wetland.Construction of rainwater harvesting structures like anicuts and othersurface embankments has caused significant evaporation losses of water,thereby without visible benefits in the catchment areas. The existingpolicies require reviewing and reorienting. There is urgent need forrainwater harvesting for recharge to groundwater especially in the majorfeeder catchment areas of Mendha and Rupangarh rivers along withother stream beds and palaeochannels so as to minimize evaporationlosses. The rainwater is to be harvested and recharged where it falls i.e.roof top & storm water in urban/sub-urban areas, village water run offusing dug wells/dug cum bore wells/percolation tanks, gabianstructures with shafts etc. This will not only enhance freshwater resourcesfor local use but will also increase groundwater inflow in to the Sambharwetland. This in turn will raise groundwater levels in and around thelake causing improvement in quality & quantity of salt production,protecting biodiversity and resulting in conservation of Wetland ofSambhar Salt.
REFERENCES :
1. Biswas et al. (1975): Some observations on the salinity problems ofthe inland lakes of Rajasthan, paper published in workshop on theproblems of the desers in India.
2. Central Ground Water Board unpublished report (2007):Investigation on contaminated low discharge from tube wells inSambhar salt, Rajasthan

129
3. Central Ground Water Board unpublished report (2007): Inlandground water salinity studies, sambhar lake, Rajasthan.
4. Mathur L. N & Joseph A. D (2005) :Saline Water Management inArid and Semi Arid Zones of Rajasthan”, paper published in 92nd
Indian Science Congress-2005.
5. Sinha, R and et al. (2003) : Evaporite Mineralogy and Geochemicalevolution of the Sambhar salt lake, Rajasthan, India.

130
Sambhar Lake - Wetland an Assessment
By A.Abdul Rahman*
INTRODUCTION :
Sambhar Lake, one of the largest inland saline depressions inwestern desert of India was declared a Ramsar site in 1990 due to itsbiological and biotic importance. It is situated west of Jaipur, in latitude26°58”N and longitude 75°5’’ E on the east of the Aravalli hills. The lakebed varies from 1181 feet to 1196.76 feet above the sea level. There aretwo types of brine in this wetland viz.,lake brine and subterranean brine.
The lake along with Phulera and Didwana salt lake forms a vastsaline wetland, which constitutes the most important area for theflamingos outside Rann of Kutch. In 1982 –83, over 5 Lakh flamingoswere counted in addition a large number of pelicans. Despite itsimportance as a water fowl habitiat, Sambhar lake is also known as sourceof salt producing area marketing where 2.5 lakh T of salt annually bygovernment enterprize and over 15 lakh to 20 lakh T by groups in privatesector. This production is procured using sub-soil brine from borewells.
OBSERVATION :
The lake in the desert of Rajasthan is something like a bowldepression in which rain water is stored. Due to depression in the middle,the water collected is used for salt production. In 1985, a flood situationoccurred in Sambhar, which resulted in increase of fishery resources.This invited winged avian visitors to this lake.
The following migratory avian fauna have been recorded.
*11/1, Rahim Sa Layout, Chennai Main Road, Villupuram-605602 Tamil Nadu

131
1. Greater flamingo
2. Common shelduck
3. Red shank
4. Common sand piper
5. Black wing stilt
6. Kentish plover
7. White cheeked Bulbul
8. Ruff
9. Ringed plover
10. Sociable lapwing from Siberia.
This situation continued for a year resulting increase of fisherypopulation and hence a blooming business.
In 1992, again the lake experienced a very heavy rain. The fisheryresources were again increased. However with increase of salinity to 1-1.2° Be, the fisheries got threatened and ultimately died.
With the lapse of time, the salt content increased and diversity ofthe organisms decreased. The green algae which were dominatinginitially in the fresh water have completely disappeared. As a result ofthis the flamingos which were visiting lake during the season migratedto the other feeding ground.
When the river water flows in the lake, because of the existing salinecondition in the lake, the rain water gained salinity. The density of thesaline water increased and the leading salt manufacturers started tappingthe brine for salt production. Some low and marginal salt producers werealso drawing the brine at the periphery of the salt lake from sub-soil forsalt production.
Though the salt herein is extracted from brime but the effluent inthe form of bittern instead of draining outside or its use for anotheractivity either biological or chemical, the bittern got recycled in theresource itself resulting in the quality of salt deteriorating gradually.The biological characteristic of bittern normally support developmentof chlorophyll bearing green algae, such as Dunaliella salina. Additionally

132
the bittern produce fertilizer such as potassium ammonium phosphate,which is chloride free. However in unfavourable drought condition thelake got contaminated with the other organic compounds such as deadalgae which when got entangled with the fine silt of the lake deterioratedthe quality of salt
The original status of Sambhar Lake once receiving good rainfallbecause of the perpetual drought condition has changed. Also most ofthe rivers got filled with sand due to wind action.
To sum up the following factors could be attributed for thethreatening of wetland eco-system of Sambhar Lake.
1. The path of the fresh water has been restricted
2. Because of the drought, the Government made a policy to stop thewater flow by making check dams and anicuts for agriculturalpurpose or to improve water table by water harvesting. Because ofthis, the water flow to the lake was completely stopped from thecatchment area.
3. Now for the water, the lake has to depend on the local rainfall.This resulted in the very low water availability in the lake. Becauseof less available water in the lake, it is presumed that the percolationgot reduced. The result was sub-soil contained concentrated brineof 18-240 Be.
4. This higher concentration of brine diffused in the lowerconcentration making the fresh water get converted into brine.
5. These three processes of percolation, evaporation and diffusion arethe processes which seem to be responsible in converting the rainwater into high density brine.
REVIVAL OF THE ECO SYSTEM:
It is possible if rain water reach to the lake from the catchmentarea, which is now restricted because the rainwater is being harvestedfor the other economical activity such as drinking water supply andagricultural. Thus the only hope for conservation of Sambhar Lake is todepend on the localized heavy rain. However, unfortunately Rajasthanstate experiences heavy rain once in 10 years.

133
The Sambhar wetland is thus faced with grave situation. Seriousconsideration are necessary for measures in saving Sambhar Lake fromits deterioration through a concerted balance of ecosystem vis-a-visnatural processes.
RECOMMENDATIONS :
There are possibilities to balance the ecosystem of Sambhar SaltLake with development of wetland ecosystem combined with saltproduction.
The paper thus recommends to make a study on the geochemistryof the soil and suggests to practice biological management of salt work
It is recommended to practice biological management of salt workby introducing the right kind of brine shrimp Artemia strain that willfeed on the micro algae and thus quality of salt could be enhanced. Thebrine shrimp introduction will in turn help to renew the wetlandecosystem, which forms the feeding ground for flamingoes. The bitternfrom salt lake could be isolated to produce magnesium ammoniumphosphate as chloride free fertilizer. However, the presence of brine algaein Sambhar salt lake is considered as goldmine for extracting beta-carotene for future course of action on techno-commercial basis.. Thekey areas suggested would in turn support to conserve the delicate wetland ecosystem of Sambhar salt lake in a balanced way.
REFERENCES :
1. Aggarwal, S.C.,(1956) Salt Industry in India. 195:272
2. Aharon,Oren et al. (1994), Interrelationships between Dunaliellaand Halophilic archae in hypersaline lakes. Abstracts of the 6 th
International Symposium on Saline Lakes, Scientific Committee of 6th
ISSL Beijing, China.
3. Bhargava S.C; G.R. Jakher, M.M. Saxena and R.K. Sinha (1985),Ecology of ArtemiaDidwana salt lake India 2nd InternationalSymposium on the brine shrimp Artemia, Antwerpen (Belgium).
4. Bhargava et al., 1985 Rearing Artemia in a saltpan near SambharLake India Ibid.
5. Chen, Kezao and Xu Zhiqing (1994), The general characteristics of
134
Salt Lakes in China. Abstracts of the 6th International Symposium onSaline Lakes, Scientific Committee of 6th ISSL Beijing, China.
6. Davis, J.S.(1978), Biological communities of a nutrient enrichedsalina Aquat. Bot.,4 : 23-42.
7. Davis, J.S. 1980 Artemia at solar salt works. Brine shrimp Artemia.Vol.3. Ecology, Culturing, Use in Aquaculture. G. Persoone, P.Sorgeloos, O. Roels, E., Jaspers(Eds.) Universa Press, Wetteren,Belgium, 456 pp.
8. Egorov, A.(1994), The ecological problems of some salt lakes: Russia,Middle and central ASI. Abstracts of the 6 th International Symposiumon Saline lakes, Scientific Committee of 6th ISSL Beijing, China.
9. Jianmin, Zhou and Qingtang, Yang (1994), The deposition featuresof salt lakes in Inner Mongolia and their implication forpaleoclimate. Ibid.,(17).
10. Li Wengpeng & Liu Zhenying (1994), Ground water flow systemin golmud river valley and Intercrystal brine Movement in the areaof qarhan salt lake. Ibid.,(55).
11. Lall, S.B.(1987), Note on Sambhar salt works and algae problem.In:Artemia Newletter, Number 5:5-6.
12. Rahaman,A.Abdul, M.Ambikadevi and Sosamma-Esso 1993.,Biological management of Indian Solar Saltworks, 7th Symposiumon salt,Vol.1:633-643. Elsevier Science publishers B.V.Amsterdam.
13. Rahaman,A.Abdul, Sosamma-Esso and M.Ambikadevi(1993a),.Hydrobiology of two saltworks in India-II, 7th Symposiumon salt, Vol.1:645-655. Elsevier Science publishers B.V.Amsterdam
14. Rahaman A.A.(2006) Plankton communities in hypersaline watersof Indian Solar Saltworks, 1st International Conference on theEcological Importance of Solar Saltworks, 20-22 October2006,Santorini Island, Greece, CEISSA-2006, ISBN 960-86638-2-2 :259-268.
15. Shukal,D and Rahaman,A.Abdul (2006), Sambhar salt lake a wetland_an assessment, Ibid., 38-43.
16. Sundaresan S., Ponnuchamy K. and Rahaman A.A.(2006) Biological

135
Management of Sambhar Lake Saltworks (Rajasthan – India),Ibid.,199-207.
17. Subbaramanian, K (1972), The biology of the blue-green algae ofthe Sambhar Lake Salt works.In: Desikachary, T.V (Editor)Taxonomy and biology of blue green Algae. First InternationalSymposium on Taxonomy and biology of blue green Algae held atMadras, January 8-13, 1970.University of Madras, Madras 339- 441.
18. Wetlands of India(1990)- A Directory, Government of India,Ministry of Environment & Forests, New Delhi, pp 150
19. Yang Qian et al., (1994), The recent study of the Qarhan Lake.Abstracts of the 6 th International Symposium on Saline Lakes, ScientificCommittee of 6 th ISSL Beijing, China.
20. Zheng Mianping et al., (1994), Concept and prospect of saline lakesassociated agriculture. Ibid.,
21. Zheng Mianping (1994), Paleoclimatic evolution of the qinghai-Tibetplateau since 38 Ka B.P. evidence from saline lake deposits. Ibid.,(2)
22. Zhu Lixiang et al., (1994), Artemia resources in inland salt lakes inPeoples Republic of China, Ibid.,

136
Present and Palaeo Wetlands of NorthwestThar Desert, Rajasthan, India - Implicationsfor Geoenvironmental Conservation
By P C Srivastava and S K Wadhawan*
INTRODUCTION
Arid zones cover about 33% of the earth’s land surface in the worldand are characterized by low annual rainfall (0-500 mm), usually hottemperatures up to 47 degree centigrade and high evaporation index upto 4000 mm per year. The naturally occurring ephemeral shallow inlandbasins and depressions of varying size and origin within these regionsare known as arid wetlands represented by the fluvio – lacustrineenvironment and geologically termed as “Playas”. The Playas / wetlandsare generally devoid of hydrophitic plants due to accumulation of saltswhich do not favour their establishment and generally occur above thegroundwater table, often fed by the seasonal surface water runoff.Important natural wetlands in the northwestern parts of the Thar Desertare: - Jamsar – Khichiyan, Lunkaransar, Dhirera, Dholera, Kaoni, Akasar,Karnisar Dhar in Bikaner district and near Rawatsar, Suratgarh, andHanumangarh, etc.
The wetlands in the arid regions can be classified into the followingtypes owing to their geologic origin and geomorphic development:-
1) Those which have been formed in the tectonic/ structuraldepressions
*Geological Survey of India, Western Region, Jaipur

137
2) Those which have been formed within the deflated interdunalbasins
3) Abandoned and deranged inland drainages
4) Depressions / basins fed by ephemeral rivers / drainages.
Further on the basis of age, they have been classified into palaeo -wetlands and present wetlands. The present wetlands are both naturallyoccurring as well as man - made. The palaeo wetland represents a palaeo-lake or an abandoned playa in which the process of its formation andgrowth have ceased. The present day wetlands which include ephemeralsaline lakes, the process of formation is still operative. The water - loggedareas along the canal (Indira Gandhi Nahar Pariyojna) are alsocategorised as the present day man - made wetland. The present daywetlands and palaeo – wetlands in Thar Desert are resource potential ofevaporite mineral deposits such as gypsum, selenite, salts, halites, etc.They have become sites for quarry of these mineral deposits in the aridland.
STUDY AREA
Jamsar – Khichiyan wetland, Lunkaransar wetland in the Bikanerdistrict and water - logged areas along the IGNP canal command betweenSuratgarh and Hanumangarh areas in Hanumangarh and Bikaner districtrepresent three different types of wetlands selected for detailedgeoscientific study (Figure 1, 2 &3). They fall in Survey of India degreesheets 44H, 44K and 44G.They are located near Bikaner – Suratgarh –Hanumangarh highway and can be approached by fair – weather roads.
QUATERNARY GEOLOGY, GEOMORPHOLOGY OF JAMSAR –KHICHIYAN PALAEO WETLAND: -
Jamsar – Khichiyan wetland is approximately 4km. long and 2 km.wide with orientation in N.E. – S.W. direction (Figure 1). It is classifiedas older interdunal playa on the basis of origin and geomorphologicalset up. As the genetic growth process has ceased, it is occurring aspresently as abandoned palaeo – lake with rich reserves of gypsite andselenite evaporites.
It occurs as a deflated depression within the interdunal sandy flat.The interdunal areas are surrounded by linear, transverse and coalesced

138
parabolic and comb - shaped dunes. The dunes are highly stabilizedand are composed of brown, highly oxidized, pedogenic, well sortedand consolidated sand. They are capped by loose, yellow well sortedsand cover and supported by xerophytic vegetation. The linear dunesare 20 to 30 m high having NE-SW orientation.
The composite Quaternary strata log (Figure 4) prepared on thebasis of study of ten geological sections indicate nine Quaternarygeological units. The maximum thickness of the sections is approx. 9 m.The youngest unit - A (30 cm to 2.75 m) in the log is composed of wellsorted, semi consolidated, non - cohesive brownish sand deposited bypast aeolian activity. Its sub unit B comprises of gravelly gypcretes,calcretes and at places desert rose deposited by aeolian action andgroundwater capillary rise. The unit - C (5cm to 1.5m thick) comprisesof fine pedogenised gypsum in the powdery form. Next younger depositswere laid due to aeolian activity, the sand rich in CaSO4 deposited overthe playa. The unit D (40 cm to 1m) which is impersistent in the othersections comprises of medium grained crystalline granular gypsum withsilt partings and massive coarse crystalline granular gypsum respectively.Both of these interlayered units represent lacustrine environment. Theunit - E (15 cm to 2m thick) comprises of pale - greenish non –cohesive,well sorted fine sand. This unit indicates dry climate and on going aeolianactivity at the time of evolution of the playa. The unit - F (1m to 2mthick) comprises of alternate layers of warped laminations of gypsumwith silt partings. The unit E represents deposition under lacustrineconditions. The unit - G which is impersistent layer and comprises ofalternate layers of pale greenish white laminations of clay and silt layersand represents localized ponding conditions. The unit H - (50 cm to 1..5m)comprises of warped layers of coarse crystalline aggregate of gypsumshowing deposition under lacustrine environment and probably the baseof the playa below which the aeolian unit E is repeated.
Gypsum deposits are generally associated with areas having lessthan 300 mm mean annual rainfall. Field stratigraphy of these gypsumbearing playas (palaeo wetlands) suggest multiple precipitation events(evaporite formation) separated by sand and silty clay horizons implyinglacustrine (wetter) conditions. Absolute dating of these playa sedimentsindicated: 1) over all more humid conditions (enhanced monsoon) during

139
13ka to 4 ka period. 2) aridity in the region with highly reduced rainfalland excessive evaporation in this part of Thar Desert has beenexperienced since 4ka. Most near surface gypsum occurrences in theregion belong to this period (Wadhawan, et al. 2005)
QUATERNARY GEOLOGY AND GEOMORPHOLOGY OFPRESENT DAY WETLAND AT LUNKARANSAR AND MAN -MADE WETLANDS OF HANUMANGARH AREA: -
Lunkaransar wetland is linear shaped wetland approximately 2km. long and 1 km wide oriented in NE-SW direction (Figure 2). It isclassified as younger interdunal saline lake. It is a recent playa in whichthe process of evaporite formation is still in progress. It occurs withinthe vast interdunal sandy flat between the older parabolic dunes thatare 20 to 30 m high and are stabilized. Their arms are aligned in NE-SWdirection and comprise of yellowish brown colored, well sorted, semiconsolidated sand. The interdunal sandy flats are the most extensivelydeveloped geomorphic landforms. They comprises of brownish siltyloam with formation of calcretes and gypcreates near surface.
The composite Quaternary strata log (Figure 5) prepared on thebasis of seven sections within the playa indicate six Quaternary geologicalunits. The maximum thickness of the section is 1.6m. The youngestgeological unit A (30 - 40 cm thick) is yellowish well sorted aeolian sandin the form of dunes and sandsheets. This is followed by unit B (2-3 cm)grayish silty clay with salt crusts occurring as salt capping over the playa.The unit - C (20 -25 cm thick) is buff brown colour, non cohesive, semiconsolidated aeolian sand. This is followed by unit D - (30 to 40 cm)dark brown, highly cohesive sandy silt representing lacustrineenvironment. The unit E - (30 -40 cm thick) comprises of dark greycoloured, highly cohesive laminations of silty clay with salt cappingdeposited under lacustrine conditions. The unit - F (20 -30 cm thick)comprises of black silty clay with coarse selenite crystals. This unit alsorepresents lacustrine and evaporative arid environment. Ground waterrich in brine and dissolved salts occurs below this unit at shallow depths.
Permanently water - logged areas have been formed along the IGNPowing to seepage and leakages form the main canal and its distributaries.Interdunal depressions have stored the excessive surface water due to

140
poor drainage and absence of out flow in this dunes and hard calcretepans infested terrain of northern Thar Desert. The area between Suratgarhand Hanumangarh comprises of stabilized dunes and interdunaldepressions. The occurrence of calcrete pans at a shallow depth withinthe interdunal areas and lack of surface drainage are the main causes ofwater logging and formation of man made wetlands. The calcrete pansoccur within the sandy silt within the interdunal areas.
EVOLUTION OF THE WETLANDS:-
Deflated basins were created within the interdunal areas due tohigh speed winds. Shallow pools were formed by the rainwater, surfacerunoff during humid conditions and rise of groundwater table enrichedin CaSO4. With increase in aridity and rate of evaporation, the CaSO4enriched water got converted into brine. The geochemistry of the watersamples of Lunkaransar wetland have indicated TDS varying from 61050to 80118 mg/l. The SO4 varies from 1000 mg/l to 14820 mg/l. Ca variesfrom 1040 mg/l to 1290 mg/l. The CaSO4 precipitated out as gypsumfrom the brine water. The intermittent sandy layers representcontemporaneous aeolian activity.
GEOENVIRONMENTAL ASPECTS, SUSTAINABILITY ANDCONSERVATION ISSUES, ECOTOURISM VALUES OFWETLANDS:-
Palaeowetlands and present day wetlands are resource potentialof evaporate minerals such as gypsum, salts, etc. Crystalline gypsumand gypsite have been quarried from Jamsar – Khichiyan andLunkaransar wetland. Salt and gypsum are being produced in theLunkaransar wetland. Interference through excavation and extractionof these resources have scarred the landscape and interrupted thegeochemical evolution of evaporate formation. Abandoned quarry pitsand overburden dumps besides these quarries have degraded the landand are a source of dust generation during the hot and dry summermonths. The man - induced recent wetlands near Suratgarh andHanumangarh areas have affected vast stretch of land by soil salinitydue to high evaporation index.
The arid zones are characterized by low and highly variable rainfall.Rainwater is spatially and temporally unpredictable, rarely falling in

141
large amounts thus causing the flash floods. Occurrence of gypseferousand calcrete pans, impervious sediments create impeded drainage andwater logging. In some palaeo wetlands, e.g. in Jamsar – Khichiyan,Kawas etc. there is an increased human settlements over the wetlands.Desertification and loss of productivity are an important problem in thewetland area. The groundwater and the soil in the wetland is highlysaline both in the naturally occurring and man - made wetlands withcontinued seepage and collection of surface irrigation surplus water inthe local depressions. The problem of salinity can further spread in theadjoining areas of the wetland.
Ecological sustainability and conservation of wetlands are keyissues which should be given due attention. The overburden around theabandoned pits/quarries should be stabilized by heavy afforrestationof the xerophytic vegetation over it. This will also prevent sandmobilization and dust generation. Reclaimation / conservation ofabandoned pits and wetlands in arid landscape of Thar Desert shouldbe done by leveling and sand filling of these pits. The Jamsar – Khichiyanand Lunkaransar wetlands are situated near the canals. The water in thewetlands can be augmented by diverting the fresh water of canal into it.This will also minimize the salinity of the wetland area. Aquatic plantsand animals which depends on wetlands and can adapt to live in theseinhospitable environments should be rehabilitated. Fish farming andwater birds should be encouraged as sanctuaries. Trees plantation aroundthe wetlands should be increased. The excess water in the water - loggedareas near Hanumangarh, Suratgarh can be pumped out and transmittedinto different wetlands such as Sambhar salt lake and other wetlands inthe adjoining areas. This will also prevent flash- floods and help sustainedconservation of wetlands.
Bikaner city is an important tourist place in Rajasthan attractingnumber of tourists from India and other countries. Jamsar andLunkaransar wetlands are in the close vicinity of Bikaner city. It can bedeveloped into Desert ecotourism sites such as “Desert eco-santurary”.The wetlands occurring near the Jamsar and Lunkaransar wetlands suchas in Dhirera, Karnisar, etc can also be developed into significant Deserttourism sites as well as helpful in combating desertification problemsand conservation of wetlands.

142
REFERENCES
1. Deotare BC (Jan. 2004): Late Quaternary geomorphology,Palynology and magnetic susceptibility of Playas in westernmargins of Indian Thar Desert.
2. Kingsfort RT: A contribution from the convention on wetlands tothe first session of the conference of the part of the UN conventionto combat desertification.
3. Mehra, S.L.: Investigation of gypsite in Bikaner district, Rajasthan.GSI unpublished report 1963-64 Pareek S, Srivastava PC:Geoscientific studies on the Quaternary playa deposits in TharDesert Rajasthan
4. GSI unpublished report, F.S. 2004-05, Jaipur
5. Pareek S, Srivastava PC: Correlation of Cenozoic fluvial systemsalong Thar Desert margins, Rajasthan.
6. GSI unpublished report F.S. 2002-04, Jaipur
7. Rakshit P: Quaternary geological mapping in parts of Bikaner,Churu district, Rajasthan. GSI unpublished
8. Report FS 1987-88.
9. Vikram Rai: Geology of saline lakes of Rajasthan. GSI unpublishedreport 1993.
10. Watson A (1992): Desert crust and varnish. Arid zonegeomorphology.
11. Wadhawan, S.K., Nagar, Y.C et. al. (2005): Luminescence dating ofgypsum occurrences from western playas, Rajasthan: Palaeoclimaticimplications.
12. Wadhawan, S.K (2005):Geological evolution of Thar Desert inRajasthan and Gujarat, india, GSI unpublished report for F.S. 2003-04
���

143
Fig. 1. Location Map of Jamsar - Khichiyan Older Wetland
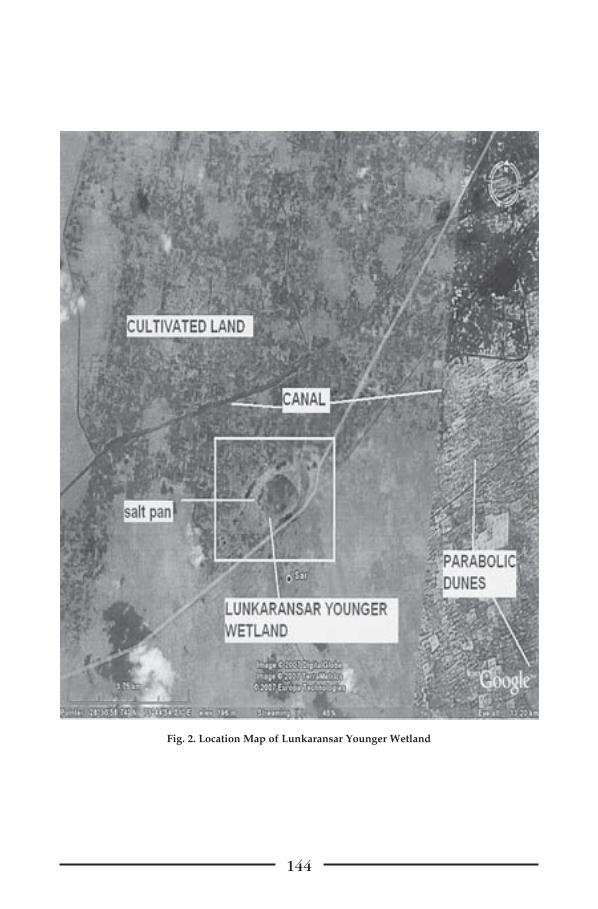
144
Fig. 2. Location Map of Lunkaransar Younger Wetland

145
Fig. 3. Waterlogged areas along IGNP, Hanumangarh district

146
Fig. 4. Composite Quaternary Stratalog of Jamsar - Khichiyan Playa
Type of Playa : Older Interdunal Flat

147
Fig. 5. Quaternary Stratalog of the Lunkaransar Playa
Type of Playa : Youngar Salt lake


149
OUTCOME OF THE SEMINARSUGGESTIONS AND
RECOMMENDATIONS
Wetlands and their Conservation: Strategies and Policy Optionswith special reference to Rajasthan by Dr. Sudhir Varma


151
WETLANDS AND THEIRCONSERVATION: STRATEGIES ANDPOLICY OPTIONS WITH SPECIALREFERENCE TO RAJASTHAN -RECOMMENDATIONS OF THESEMINAR
By Dr. Sudhir Varma *
INTRODUCTION :
The Social Policy Research Institute organized a national seminaron “Wetlands and their Conservation: Strategies and Policy options withspecial reference to Rajasthan” on 3rd and 4th October, 2007. Deliberationsduring the seminar pointed out that strategies and policies exist in partbut there is a need for an integrated policy on the specific subject ofWetlands. Measures were suggested for the conservation of wetlandsespecially in the area of bio-diversity and the need of decreasingpollution. Hydrology plays a key role in controlling the structure andfunctioning of wetlands which affect biotic community structure andnutrient cycle. Large-scale irrigation and river diversion, agriculturalexpansion, over-harvesting of available resources, forest denudation,urban and industrial pollution are major threats to wetland conservationwhich have to be a part of any policy for conservation.
STRATEGY AND POLICY OPTIONS :
The outcome of the deliberation on policy and strategy options
* Director, Social Policy Research Institute

152
revealed that strategies need to be based on the following considerations.
• Water allocation policy should harmonize human uses withbiodiversity requirements.
• Should have both preventive and developmental measures(restoration) through hydrological intervention and participatorywatershed management involving local community at all levels ofplanning and implementation.
• Should involve all relevant departments, civil society and scientificcommunity for developing effective institutional mechanisms forintegrated management and capacity building. A far more activestakeholder participation which should be totally a political couldbear fruits in conservation and restoration efforts of the site.
• Should lay down a proper regulatory framework to preventdepletion of wetlands in which a Technical Core Group should workin close coordination with a Community Consulting Group andthe frame work should be closely linked with livelihoods.
• There is a need of analyses of various alternatives for eco-restorationstrategies for different wetlands, with larger interest from both Stateand Central Governments.
ROUND TABLE DISCUSSIONS:
The seminar organized two Round Tables for the Ramsar sites ofKeoladeo National Park and Sambhar Lake.
a) Round Table Discussions on the Keoladeo National Park:
The speakers while giving the historical background of this NationalPark originally used for water fowl hunting during the princelystates times, said that this wetland was raised to a Ramsar site levelin 1981. It has supported amazing diversity and 350 species of birds.However, now, erratic rainfall, intermittent drought and no concernfor ecological decline and most of all the construction of PanchnaDam has played havoc in the devastation of this park.
The deliberations urged on the need for measures to replenish thewetland with sufficient water for supporting the biodiversity andits related benefits. Hopes are still there about chances of getting

153
the Siberian Cranes back to this bird watching paradise if steps aretaken for conservation.
A paper by Shri Sunayan Sharma on “Community Participation”revealed that working with the people of the region has helped inuprooting the Prosopis juliflora which has been spreading throughthe entire park and such public awareness could help inconservation becoming very effective.
Important suggestions by the contributors are:
1. Planning Commission may be requested to undertake missionmode projects for eco-restoration.
2. Possibility exists for attracting Siberian cranes to KeoladeoNational Park if the water bodies in the wetlands are broughtto the earlier level as this wetland is on the route from Siberiato other wetlands in India. This would ensure it to continueas a Ramsar site of international status.
b) Round Table on Sambhar Lake:
Revealing the origin of this inland saline depression of 233 sq kmaerial extent, this wetland was geologically defined as a neotectonicsubsidence of Quaternary times by the scientists participating inthe session. Stratigraphically speaking it is composed of sand-silt-clay lacustrine deposits interbedded with grit formation andoverlying a pre-Cambrian micaceous schist. Made up of evaporates(calcite, halite, thenardite) and gypsum, this wetland had supportedgrowth of salt resistant algae providing rich food for flamingoes,the migratory bird abounding this wetland. Recent rapid land usechanges in catchment area and check-dams has an adverseenvironmental impact turning it into a dryland pan which isresponsible for generating dust storms from this wetland convertingit into a great dust bowl.
Important conservation and management measures for this wetlandare:
1. There is a necessity of a water allocation policy amongstSambhar lake and anicuts etc being used as a rechargestructures or irrigation etc.

154
2. The rain water is to be harvested and recharged where it falls.This would increase ground water inflow into the SambharLake which would improve quality and quantity of salt thusprotecting biodiversity and resulting in conservation ofSambhar Lake Wetland.
3. Work should be done on the suggestion of a balance betweensalt extraction and biodiversity activation. Salt extractionwould stop any salt laden dust formation which may makefresh water more saline in areas far and wide even upto Delhiand beyond.
4. Biological management through salt extraction andmaintainence of biodiversity is needed.
5. An integrated study programme for the desertic andevaporitic wetland of Sambhar Lake for microbial diversityand productivity is required.
6. No more conversion in the salt area for salt extraction shouldbe taken up by the administrative authorities, so that theenhancement of drying wetland is further checked.
7. There is necessity of study of the biochemical products fromSambhar Lake and the bittern for commercialization of theby-products from this important resource.
8. Depositional cycle in Sambhar Lake indicates the possibilityof a dry spell approaching. Detailed geological studies needto be undertaken so that action plan is made for theconservation of this dessicating saline lake.
ENGINEERED WETLANDS :
An ingredient of the policy in the field of pollution control wouldbe a much bigger emphasis on Engineered Wetlands. Such wetlandscould resolve the problems of biodiversity as well act as a source ofremoving the pollution which has polluted vast rural areas throughanthropogenic pressures, unsustainable levels of grazing, sedimentaccumulation, toxic material discharge etc.
Such natural treatment systems are effective, low cost and utilize

155
plants and associated rhizospheric microorganisms and the naturalsynergetic relationship of plants, microbes, soil and water. Suchmethodologies, apart from having benefits of ground water rechargeand use in agriculture and agro-forestry, encourage resource recoveryand income generation through multifunctional mechanisms.
SUGGESTIONS AND RECOMMENDATIONS:
The seminar recommended the following strategies to be a part ofa policy.
a) Related to Management
1. There should be a strong law against land use changes incatchment area and check-dams which have an adverseenvironmental impact. Although many Acts exist for tacklingpollution problems but Wetlands involve several authoritiessuch as industries, irrigation, forest, pollution control etc.However, there is no Act exclusively for wetlands whichrequires composite management. Thus a separate authorityfor management of wetlands is needed involving all sectionsof the government.
2. Recognition of traditional system in deciding technology foroptimum results similar to their methodologies of obtainingquality and quantity of water is needed.
3. Villagers involvement in Eco-restoration through village levelcommittees is a must.
4. Development of awareness programmes and raising of therural conscience for the issues related to the importance ofwetlands and their benefits through participation inconservation efforts should be taken up.
b) Related to Conservation
1. Ecological shift has to be prevented
2. Hydrology is considered important for irrigation but not forconservation of wetlands which is wrong.
3. A balance between water for agriculture from anicut as wellprovision of water supply to the wetlands for maintaining

156
diversity is necessary.
4. Importance of past experience through event studies shouldbe taken into consideration for devising management andconservation policies.
c) Related to Data Collection
1. Impact assessment studies and data collection on socio-economic impact of wetland loss and how peoples initiativecould be used to restore them.
2. Geoscientific studies of the past data for interpreting thepresent and envisaged future behaviour for working of thestrategies and policy options for the conservation of wetlandsare needed.
3. Knowledge on data exists but a continued effort is neededfor collecting data for their analysis regularly for type of water,existing biodiversity and status of management efforts.
4. Use of satellite imageries combined with aero magnetic/gravity and electric sensitivities for studies of quality of waterand monitoring for eco-system as well as biodiversityconservation requirement of larger areas for proper and bettercontrol is required.
���