journal of neuroscience methods - northwestern...
TRANSCRIPT
Ps
GKa
b
c
h
•••••
a
ARRAA
KSBPM
1
iast2
h0
Journal of Neuroscience Methods 259 (2016) 101–114
Contents lists available at ScienceDirect
Journal of Neuroscience Methods
jo ur nal ho me p age: www.elsev ier .com/ locate / jneumeth
hase-locked loop for precisely timed acoustic stimulation duringleep
iovanni Santostasi a,∗, Roneil Malkania, Brady Riednerb, Michele Bellesib, Giulio Tononib,en A. Pallerc, Phyllis C. Zeea
Department of Neurology, Feinberg School of Medicine, Northwestern University, 710 N Lake Shore Drive, 5th floor, Chicago, IL 60611, USADepartment of Psychiatry, School of Medicine, University of Wisconsin, 6001 Research Park Blvd, Madison, WI 53719, USADepartment of Psychology, Northwestern University, 2029 Sheridan Rd, Evanston, IL 60208, USA
i g h l i g h t s
Brain–computer interface to enhance slow-wave sleep.Acoustic stimulation that is effective and non-invasive.EEG power and synchronization is increased in delta band.Accurate phase locked algorithm to track phase of EEG during slow-wave sleep.Intervention has potential to enhance benefits of slow-wave sleep (memory, metabolism, immune system, and cardio-vascular health).
r t i c l e i n f o
rticle history:eceived 14 August 2015eceived in revised form 7 November 2015ccepted 9 November 2015vailable online 28 November 2015
eywords:low-wave sleeprain–computer interfacehase-locked loopemory and learning
a b s t r a c t
Background: A brain–computer interface could potentially enhance the various benefits of sleep.New method: We describe a strategy for enhancing slow-wave sleep (SWS) by stimulating the sleepingbrain with periodic acoustic stimuli that produce resonance in the form of enhanced slow-wave activityin the electroencephalogram (EEG). The system delivers each acoustic stimulus at a particular phase ofan electrophysiological rhythm using a phase-locked loop (PLL).Results: The PLL is computationally economical and well suited to follow and predict the temporal behav-ior of the EEG during slow-wave sleep.Comparison with existing methods: Acoustic stimulation methods may be able to enhance SWS withoutthe risks inherent in electrical stimulation or pharmacological methods. The PLL method differs fromother acoustic stimulation methods that are based on detecting a single slow wave rather than modeling
slow-wave activity over an extended period of time.Conclusions: By providing real-time estimates of the phase of ongoing EEG oscillations, the PLL can rapidlyadjust to physiological changes, thus opening up new possibilities to study brain dynamics during sleep.Future application of these methods hold promise for enhancing sleep quality and associated daytimebehavior and improving physiologic function.. Introduction
Slow-wave sleep (SWS) is a very distinctive feature of sleepn mammals and birds (Horne, 1992). SWS has a restorative rolend it has many physiological and behavioral implications. Many
tudies have established that SWS is associated with the stabiliza-ion of memories for long-term storage (Diekelmann and Born,010). SWS diminishes with age, both in duration and intensity,∗ Corresponding author: Tel.: +1 904 310 5888.E-mail address: [email protected] (G. Santostasi).
ttp://dx.doi.org/10.1016/j.jneumeth.2015.11.007165-0270/© 2015 Elsevier B.V. All rights reserved.
© 2015 Elsevier B.V. All rights reserved.
and this decline correlates with memory changes from beforeand after sleep and with impairments in cognitive performance(Mander et al., 2013). In addition, analyses of sleep in individ-uals with amnestic mild cognitive impairment (aMCI) showedreduced slow-wave activity (SWA), the physiologic measurementof SWS, compared to age-matched controls (Westerberg et al.,2012). Experimental suppression of SWS also impairs metabolicfunction, and SWS is thought to play an important role in the reg-
ulation of cardio-metabolic function (Tasali et al., 2008). Anotherimportant function of SWS is the production and regulation of hor-mones, with an important example being the growth hormone(VanCauter and Plat, 1996). Recently it has been demonstrated that
1 roscie
S�b
(ilnS2gjtoai
lEbtdiaocl2
sEtTc(11wstim2
eSarrNut2ae
sNswssemid
02 G. Santostasi et al. / Journal of Neu
WS may play a role in flushing toxins from the brain, particularly-amyloid (Xie et al., 2013). Thus, enhancing SWS could have manyeneficial implications for cognitive and physical health.
Given the role of sleep in declarative memory consolidationGais and Born, 2004; Plihal and Born, 1997), there has been greatnterest to enhance SWS. One such method is to pass slow oscil-atory electrical activity into the brain transcranially to modulateeuronal excitability during sleep so as to increase endogenousWA and improve consolidation. In two studies (Marshall et al.,004, 2006), healthy young people learned lists of word pairs beforeoing to sleep. In tests given both before and after sleep, sub-ects attempted to recall the second word of each pair in responseo the first. Remarkably, the results showed that this methodf low-frequency stimulation (LFS) during sleep increased SWAnd improved memory. Recall was better if the retention intervalncluded LFS compared to sham stimulation during sleep.
Although LFS can increase SWA, it has practical and technicalimitations. From a technical standpoint, it is difficult to recordEG activity during the stimulation because of the artifacts createdy the applied electrical field. Given that these sorts of stimula-ion methods can generate complicated patterns of activated andeactivated brain areas (Lang et al., 2005), it can be difficult to spec-
fy how the electrical stimulus influences neuronal activity. LFS islso impractical for regular use because it requires the assistancef trained technicians. Finally, while the intensity of the electri-al stimulation is relatively low and likely safe in the short-term,ong-term studies of efficacy and safety are lacking (Poreisz et al.,007).
An innovative method to enhance slow waves is to use acoustictimulation. It is well established that auditory tones can influenceEG activity by producing K-complexes, which are similar in struc-ure and are precursors to slow waves (Amzica and Steriade, 1998).ononi et al. (2010) showed that auditory stimulation during sleepan enhance SWA in young adults. The tones were of short duration50 ms) and were applied using a fixed intra-tone interval (ITI) of
Hz. In this protocol, stimulation was delivered in a sequence of5 consecutive tones (block ON), followed by periods when tonesere not played (block OFF) (Tononi et al., 2010). The block on/off
equence was adopted to track the effect of the auditory stimula-ion on SWA at regular intervals during deep sleep and also to tapnto hypothesized infra-slow oscillations in non-rapid eye move-
ent (NREM) sleep that seem to occur about every 15 s (Ferri et al.,008).
The method of fixed ITI acoustic stimulation was also shown tonhance slow waves by another research group (Ngo et al., 2013a).timulation at 0.8 Hz beginning prior to sleep delayed sleep onsetnd enhanced SWA. Further stimulation studies showed that theesponse can change as a function of the timing of the stimuluselative to the phase of the slow EEG rhythms (Dang-Vu, 2012;g et al., 2013; Schabus et al., 2012). These results may reflect thep and down phases of slow-wave oscillations, which correspondo periods of neuronal activity and quiescence (Volgushev et al.,006). Therefore, the ability to synchronize auditory stimulation to
particular phase of the slow wave could lead to more consistentnhancement of slow waves.
To take into consideration these phase-dependent responses totimulation, we adopted a more complex stimulation approach.go et al. (2013b) introduced a method that allows the auditory
timulation to be approximately tuned to the phase of the slowave. Their results showed that this phase-dependent auditory
timulation can increase slow oscillations as well as phase-coupledpindle activity. In addition, they showed that stimulation to
nhance slow waves leads to improved declarative memory perfor-ance. Presumably, the enhancement of SWA is beneficial becauset is conducive to neuronal synchronization, and because spin-le activity reflects an essential aspect of memory consolidation
nce Methods 259 (2016) 101–114
(Oudiette et al., 2013). Furthermore, phase-dependent stimulationcould also be tuned to the down state, in which case it did notenhance SWA and did not have an effect on memory (Ngo et al.,2013b).
In this paper, we describe the reasoning behind using a method-ology with a phase-locked loop (PLL) to improve sleep. This workdemonstrates that the PLL is a superior algorithm to track a sig-nal, such as in modeling EEG slow waves, and identify a targetphase for real-time application, such as with delivery of stimuli aparticular slow-wave phase. Phase targeting is important becausedifferent slow-wave phases correspond to different physiologicalstates that directly influence neural activity, and stimulation atdifferent phases can produce different effects. We include somephysiological results but do not include a complete investigationof the effectiveness of the method in enhancing slow-wave sleepin a group of participants. Rather, we provide here a comprehen-sive methodological analysis that focuses on the phase-trackingability of the PLL. It remains to show how the method compareswith other methods and how effective and reliable it is for individ-uals with normal sleep patterns or with abnormal sleep patterns,as in older individuals. Ong et al. (Submitted) have described aninitial application of this method to study sleep in a group of youngparticipants.
2. Material and methods
2.1. Phase-locked loop
2.1.1. PLL theoryWe have independently developed a new method for phase-
tracking auditory stimulation that consists of an adaptive feedbackalgorithm based on a PLL that tracks the phase of the underlyingEEG and delivers tones at a particular preferential phase (Riedneret al., 2013). This stimulation method is more general (it can beapplied easily to any particular target phase), flexible (it adaptsautomatically to the slow wave individual characteristics), accu-rate and precise (it targets the right phase much better and moreconsistently) than the slow-wave detection procedure describedby Ngo et al. or the more recent one described by Cox et al. (2014).
A PLL is a control system that generates an output signal whosephase is related to the phase of an input reference signal. Whenit is implemented as an electronic circuit, it typically consists ofa variable frequency oscillator and a phase detector. This circuitcompares the phase of the input signal with the phase of the signalderived from its output oscillator and adjusts the frequency of itsoscillator to keep the phases matched. The signal from the phasedetector is used to control the oscillator in a feedback loop.
Because frequency is the time derivative of phase, keeping theinput and output phase in lock step implies keeping the input andoutput frequencies in lock step. Consequently, a phase-locked loopcan track an input frequency, or it can generate a frequency that isa multiple of the input frequency. The former property is used fordemodulation (Viterbi and Cahn, 1964), and the latter property isused for indirect frequency synthesis (Farazian et al., 2013).
Phase-locked loops are widely employed in radio, telecommu-nications, computers, and other electronic applications (Talbot,2012). They can be used to recover a signal from a noisy commu-nication channel, generate stable frequencies at a multiple of aninput frequency, or distribute clock timing pulses in digital logicdesigns such as microprocessors. The PLL can also be implementedin a purely software realization.
There are many proposals in the literature for using the PLLin biomedical applications, as for example to model interactionsof biochemical reactions (Hinze et al., 2011), to analyze circa-dian rhythms (Kimura and N, 2005; Schilling, 1982), to describe
roscie
mbmp2c(Pp1
irecdwHfbq
2
ahfia
daahsludw
s
s
FtbpAtp
G. Santostasi et al. / Journal of Neu
otor control (Schilling and Robinson, 2010), and to designrain–computer interfaces (Brunner et al., 2006). PLL processesay reflect the activity of brain structures in charge of the
rocessing of sensory-motor information (Ahissar and Kleinfeld,003). The PLL has been implemented in real time to analyze andlassify EEG oscillations in the alpha, beta, delta, and theta bandsViterbi and Cahn, 1964; Hileman and Dick, 1971; Lee and Lo, 2000;ei-Chen and Yu-Yun, 2000). The PLL has been also utilized to detectarticular features of the EEG such as spindles (Broughton et al.,978).
Our particular application of the PLL for the induction of SWAs designed to rhythmically deliver an acoustic tone in a givenange around the target frequency of 1 Hz and phase-locked withndogenous slow-wave oscillations. Our preliminary results indi-ate that synchronizing the stimulation with the phase of the EEGramatically increases the efficacy and characteristics of the slow-ave induction in comparison with a fixed interval stimulation.ere we describe the performance and the applicability of a PLL
or following and guiding a stimulation protocol that has a flexibleut limited range of frequencies and that is phase-locked with theuasi-periodic fluctuations of the EEG during SWS.
.1.2. PLL designThere is a vast body of literature describing the details of a PLL
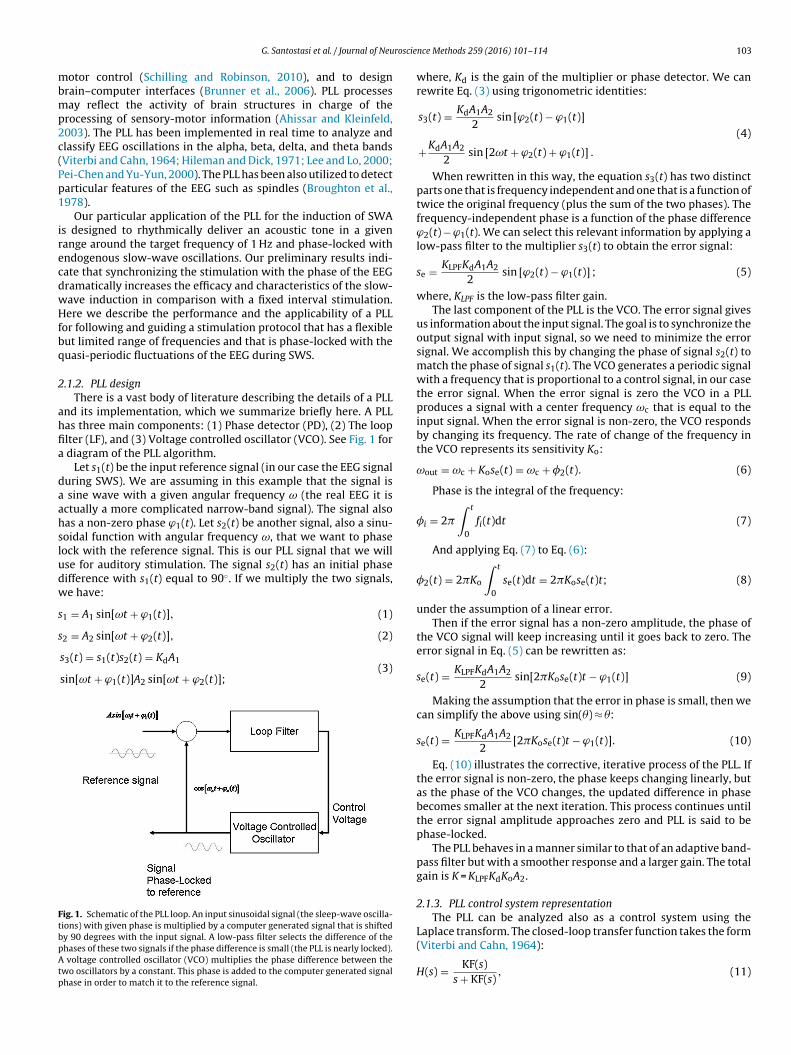
nd its implementation, which we summarize briefly here. A PLLas three main components: (1) Phase detector (PD), (2) The looplter (LF), and (3) Voltage controlled oscillator (VCO). See Fig. 1 for
diagram of the PLL algorithm.Let s1(t) be the input reference signal (in our case the EEG signal
uring SWS). We are assuming in this example that the signal is sine wave with a given angular frequency ω (the real EEG it isctually a more complicated narrow-band signal). The signal alsoas a non-zero phase ϕ1(t). Let s2(t) be another signal, also a sinu-oidal function with angular frequency ω, that we want to phaseock with the reference signal. This is our PLL signal that we willse for auditory stimulation. The signal s2(t) has an initial phaseifference with s1(t) equal to 90◦. If we multiply the two signals,e have:
1 = A1 sin[ωt + ϕ1(t)], (1)
2 = A2 sin[ωt + ϕ2(t)], (2)
s3(t) = s1(t)s2(t) = KdA1
sin[ωt + ϕ1(t)]A2 sin[ωt + ϕ2(t)];(3)
ig. 1. Schematic of the PLL loop. An input sinusoidal signal (the sleep-wave oscilla-ions) with given phase is multiplied by a computer generated signal that is shiftedy 90 degrees with the input signal. A low-pass filter selects the difference of thehases of these two signals if the phase difference is small (the PLL is nearly locked).
voltage controlled oscillator (VCO) multiplies the phase difference between thewo oscillators by a constant. This phase is added to the computer generated signalhase in order to match it to the reference signal.
nce Methods 259 (2016) 101–114 103
where, Kd is the gain of the multiplier or phase detector. We canrewrite Eq. (3) using trigonometric identities:
s3(t) = KdA1A2
2sin [ϕ2(t) − ϕ1(t)]
+KdA1A2
2sin [2ωt + ϕ2(t) + ϕ1(t)] .
(4)
When rewritten in this way, the equation s3(t) has two distinctparts one that is frequency independent and one that is a function oftwice the original frequency (plus the sum of the two phases). Thefrequency-independent phase is a function of the phase differenceϕ2(t) − ϕ1(t). We can select this relevant information by applying alow-pass filter to the multiplier s3(t) to obtain the error signal:
se = KLPFKdA1A2
2sin [ϕ2(t) − ϕ1(t)] ; (5)
where, KLPF is the low-pass filter gain.The last component of the PLL is the VCO. The error signal gives
us information about the input signal. The goal is to synchronize theoutput signal with input signal, so we need to minimize the errorsignal. We accomplish this by changing the phase of signal s2(t) tomatch the phase of signal s1(t). The VCO generates a periodic signalwith a frequency that is proportional to a control signal, in our casethe error signal. When the error signal is zero the VCO in a PLLproduces a signal with a center frequency ωc that is equal to theinput signal. When the error signal is non-zero, the VCO respondsby changing its frequency. The rate of change of the frequency inthe VCO represents its sensitivity Ko:
ωout = ωc + Kose(t) = ωc + �2(t). (6)
Phase is the integral of the frequency:
�i = 2�
∫ t
0
fi(t)dt (7)
And applying Eq. (7) to Eq. (6):
�2(t) = 2�Ko
∫ t
0
se(t)dt = 2�Kose(t)t; (8)
under the assumption of a linear error.Then if the error signal has a non-zero amplitude, the phase of
the VCO signal will keep increasing until it goes back to zero. Theerror signal in Eq. (5) can be rewritten as:
se(t) = KLPFKdA1A2
2sin[2�Kose(t)t − ϕ1(t)] (9)
Making the assumption that the error in phase is small, then wecan simplify the above using sin(�) ≈ �:
se(t) = KLPFKdA1A2
2[2�Kose(t)t − ϕ1(t)]. (10)
Eq. (10) illustrates the corrective, iterative process of the PLL. Ifthe error signal is non-zero, the phase keeps changing linearly, butas the phase of the VCO changes, the updated difference in phasebecomes smaller at the next iteration. This process continues untilthe error signal amplitude approaches zero and PLL is said to bephase-locked.
The PLL behaves in a manner similar to that of an adaptive band-pass filter but with a smoother response and a larger gain. The totalgain is K = KLPFKdKoA2.
2.1.3. PLL control system representationThe PLL can be analyzed also as a control system using the
Laplace transform. The closed-loop transfer function takes the form(Viterbi and Cahn, 1964):
H(s) = KF(s)s + KF(s)
, (11)
1 roscie
wt
H
stc
ω
s
T
t
2
unmpast
tawwacafctwaKo
2
ftoptmd
Imu1jwpSc
04 G. Santostasi et al. / Journal of Neu
here, s = iω and F(s) = (1 + s�2)/(1 + s�1) is the transfer function ofhe low-pass filter, in this case a lag-lead filter.
We can then rewrite the closed-loop transfer function as:
(s) = K(1 + s�2)�1s2 + (1 + K�2)s + K
. (12)
The denominator of Eq. (12) has the form of a harmonic oscillator2 + 2�ωns + ω2
n where the natural frequency is ωn =√
K/�1 andhe damping factor is � = 1/2ωn�2. The bandwidth ωh for the PLLan be calculated then by:
h = ωn
[(1 + 2�2 +
√2 + 2�2
]1/2. (13)
Another important parameter that determines a relevant timecale of the PLL is the lock-in time TL:
L = 2�
ωn, (14)
he time required for the lock-in process.
.1.4. Parameter optimizationTo optimize the PLL parameters, we performed simulations
sing a digital PLL on a segment of EEG containing SWS duringaps in 5 subjects. These simulations were conducted (1) to deter-ine the optimal parameters for sleep stage detection and PLL EEG
hase tracking and targeting and (2) to demonstrate that the digitalnalysis could track the rhythm of slow waves and the burst-likelow-wave activity during SWS. The details of the algorithms forhese functions are detailed in Section 2.4.
For phase tracking and targeting, we chose the parameter valueshrough an optimization process where we varied one parametert the time to maximize the likelihood that the acoustic pulsesould be given in a particular phase range. We chose a relativelyide bandwidth (3.7 Hz around the center frequency of 0.85 Hz) to
dapt to the changes of the dominant slow-wave frequency (thatan vary between 0.5 and 4 Hz). Some PLL implementations apply
band-pass filter to isolate the time evolution around a particularrequency. In our application we relied on the natural narrow-bandharacteristics of the EEG during SWS, so we used the raw EEG ashe PLL input. The specific values that we selected for our slow-ave PLL were the following: low-pass frequency cut-off = 0.03 Hz,
mplifier gain A2 = 5, phase detector gain Kd = 6, low-pass filter gainLPF = 20, and VCO gain Ko = 5. The lock-in time TL is 3.7 s. Theseptimal PLL parameters were similar between individuals.
.2. Experimental design
A Matlab program for the automatic brain computer inter-ace (BCI) was developed to control acoustic stimulation. We haveested our procedure in different age groups, both during naps andvernight. A detailed description of physiological outcomes will beresented in future papers. The goal of the present paper is to showhe ability of the PLL to follow the slow-wave process and to deter-
ine the phase of the EEG online. We thus focus on results obtaineduring naps in young subjects.
This study was approved by the Northwestern Universitynstitutional Review Board. We recruited 5 subjects from the com-
unity (3 males and 2 females, age range 21–25 years). Subjectsnderwent one stimulation nap and one sham nap separated by
week. The order of the conditions was randomly assigned. Sub-ects were not informed of the order of the conditions or if sounds
ould be played during a particular nap. Subjects wore head-hones specifically designed for sleep (Acoustic Sheep Sleep PhonesP4BM) during both conditions. During the sham stimulation pro-edure, no sounds were played but headphones were still worn.
nce Methods 259 (2016) 101–114
Sound intensity ranges were determined once before the exper-iment and adjusted to be between a barely audible level for thesubject and a level that the subject considered acceptable for dur-ing sleep. Intensity levels were adjusted during the nap session asdescribed below.
2.3. Data acquisition
EEG data were acquired during afternoon naps from 5 sub-jects. Data were recorded using a Brain Products V-Amp amplifierat 500 Hz sampling frequency. High-pass hardware filtering wasapplied with a cut-off frequency of 0.3 Hz. We used three recor-ding channels, one for detection of slow waves (anterior frontalchannel Fpz referenced to right mastoid) and two for differentialelectro-oculogram (EOG), with self-adhesive, disposable, Ag/AgClelectrodes. Data were acquired in two ways: raw data at 500 Hz viathe V-Amp data acquisition software and through a MatLab Appli-cation Programming Interface (API) that communicated with theV-Amp via a TCP/IP port. Every 20 ms the API sent a packet of 10 datapoints to the i/o MatLab function. EEG pre-processing consisted ofapplying a band-pass filter (Chebychev second order, 0.05 dB pass-band ripple) with cut-off frequencies at 0.5 and 38 Hz to the 10points. Data were consequently down sampled to 100 Hz to avoidaliasing. The hardware time resolution of our system is limited bythe data packet delivery of the API (about 20 ms). We determinedthat the largest additional delay (about 40 ms) was due to the acti-vation of the sound card (this delay can be decreased by using theMatLab Psychtoolbox and an Asio sound driver). The total measureddelay was 70 ± 5 ms. As explained in Section 2.4.3, we accounted fordelay by anticipating the delivery of the acoustic pulse, relative tothe target phase, by a phase corresponding to the measured totaldelay.
Using the methods described below, the MatLab stimulationand scoring code stored downsampled EEG data, along with slowwaves and spindles identified using automatic detection methodsdescribed above. In addition, data were stored to describe the onlineEEG scoring, the PLL output, and the timing of the auditory pulsesor sham events for a total of 22 parameters. The stored data wereanalyzed offline using MatLab to produce the results discussed inSection 3.
2.4. Algorithms
2.4.1. Sleep detectionA protocol to automatically detect sleep was implemented
using the relative average power in different EEG frequency bands.Because we wanted to emphasize robustness in detecting SWS(NREM stage 3 or stage N3), we adopted a simplified classifica-tion at this step to detect a general sleep state, which correspondsroughly with early stage N2 sleep. The automatic protocol startedwith a default Wake stage. We used a delta root mean square (rms)continuous calculation based on the last 5 min of EEG activity todetermine stage N2 sleep onset. This automatic method for detec-ting stage N2 sleep agreed with scoring by a human rater (detectingat least 10 min of N2) 85% of the time in average over all the subjectdata (standard deviation 8.5%). We used two criteria to automati-cally determine when the sleep state was reached (whichever wasreached first). The first criterion was for delta rms to be above anempirically determined threshold for at least 75 s. The delta rmsthreshold was found by collecting data from an average over 4 base-line naps without any stimulation from 4 young subjects (different
from the ones used in the stimulation experiment), then calculatinga histogram of delta rms for the entire data set (including wakingand sleep), and then determining the delta rms value correspond-ing to the 40th percentile. The second criterion was the presence of
roscie
sr
2
tdealdwc5abiN9o
(iaatllediTowdat
2
drisIt
tcasd
mTsdioTtcwc(w
G. Santostasi et al. / Journal of Neu
pindles (total spindle duration of 1.5 s in the last 30 s) and a deltams value equal to at least 80% of the delta rms threshold.
.4.2. Slow wave and spindle detectionEach slow wave was detected as follows. First, a delta sleep
hreshold was determined as described in Section 2.4.3. Whenelta power was above this threshold during a subsequent session,very time the EEG crossed the zero line in the negative direction
counter measured the time before the EEG trace crossed the zeroine in the positive direction. The maximum negative amplitudeuring that time interval was also recorded. If the time intervalas between 0.25 and 2 s (corresponding to slow-wave frequen-
ies between 0.5 and 4 Hz) and the negative amplitude was at least0 �V, than this event was recognized as a slow wave and its timingnd characteristics were recorded. An interval of SWS was definedy detecting a minimum of 6 slow waves in a period of 30 s, which
s consistent with manual scoring of SWS. This procedure identified3 sleep stage in a very precise manner. We had an agreement of5% (average over 30 data sets, standard deviation 3.1%) betweenur automatic detection and human expert scoring for this stage.
Spindle detection (a close variant of method discussed inFerrarelli et al., 2007)) consisted of the following steps applied dur-ng the baseline night. Data were filtered (Chebychev second order)t 12–16 Hz (sigma). A low-pass filter (0.5 Hz cut-off frequency) waspplied to the absolute value of the output of this spindle band fil-er to track the slow changes over time of the spindle power. Theow-pass filter was applied to the last 5 s of data. The use of theow-pass filter was necessary to recover an approximation of thenvelope (that contains the amplitude information for the spin-le as an event) given that the usual Hilbert transformation used
n (Broughton et al., 1978) is not suitable for real-time detection.wo thresholds were determined on the basis of the distributionf power in this band. The lower and higher amplitude thresholdsere 2 and 8 times the mean absolute amplitude of the filteredata. With these parameters, a spindle event was then defined asny interval when the filtered signal envelope stayed within thewo thresholds for a period between 0.5 and 3 s.
.4.3. Acoustic stimulationThe PLL estimates EEG phase in real time (with computational
elays of the order of milliseconds). As soon as a certain target phaseange is reached (with a typical bandwidth of 0.3 radians), a pulses delivered. In rare cases (less than 5%) the change in the phase iso rapid that there is a jump in phase across the target phase range.n that case, if more than a second is passed by the last pulse, a newone is played to avoid big time gaps between consecutive stimuli.
Once the subject was determined to be asleep, the MatLab rou-ine activated a K-complex/slow-wave detection algorithm. If a K-omplex was detected, then brief auditory tones were played withn intertrial interval (ITI) of 5 s. The stimulus consisted of a 50-msequence of sine-Gaussian pulses at about 500 Hz (with 10% ran-om variation in frequency between pulses to avoid habituation).
The auditory stimulation intensity was adjusted as follows. Theaximum volume was kept below 45 dB with a minimum of 30 dB.
his range was divided in 20 steps. Intensity was increased by amall step if after 4 stimuli less than 2 K-complex responses wereetected within a window of 2 s after each stimulus, and decreased
f an increase in alpha or beta power was observed (indicativef a possible micro-arousal) (Iber and A.A.o.S. Medicine, 2007).his procedure has the ability to determine individualized auditoryhresholds during sleep to be used in the SWS stimulation proto-ol. The last intensity setting achieved in the N2 stage for each nap
as the maximum used in the N3 stage. The logic behind this pro-edure is to find the minimal volume that can elicit K-complexesthat are considered precursors and physiological similar to slowaves) without waking up the subject.
nce Methods 259 (2016) 101–114 105
Once the onset of the N3 stage of sleep was detected (see Sec-tion 2.4.2), the SW stimulation consisted of pulses with an ITI ofabout 1 s. The value of the ITI was adjusted according to the phaseof the slow-wave EEG through the application of the PLL. The toneswere delivered when the phase of the EEG reached a certain pre-determined value. This phase value could be changed online viaa MatLab graphical user interface (GUI). The stimulation proce-dure followed an alternating pattern of blocks of n tones (blockON) and n sham tones (the times of automated tone presentationwere recorded but tones were not played, block OFF). The num-ber of tones was also a parameter the user could change at anymoment during the experiment via the GUI. In the following exam-ples, we used a phase that corresponds to the positive half-wave(just before the peak) and a sequence of 5 tones. The stimulationcontinued during the nap during N3 unless an arousal was detected(a sudden increase of beta or alpha power above given thresholds).The alpha and beta thresholds were calculated using the entire rmshistogram for these bands from a few naps from young subjects,including all the stages, and then determining the delta rms valuecorresponding to the 75th percentile. Following arousal detection,a refractory time of 30 s with no stimulation began.
Although slow waves tend to occur in a narrow band (from 0.5to 4 Hz), during sleep they appear as short bursts of activity. ThePLL oscillates in a regular manner between bursts and it is able tofollow the non-linear behavior of slow waves during bursts. Duringthe bursts, the PLL is locked to the EEG trace as determined by asmall phase error. How well the PLL can follow the EEG dependson the parameter values, which can be adjusted to improve theperformance of the PLL.
2.5. Analysis
The analyses in this work were conducted using MatLab code.We used the built in MatLab function “pwelch” to perform spectralanalysis and comparison between conditions. To calculate statis-tical values for the phase, we used the CircStat MatLab toolbox(Berens, 2009). The phase for the EEG was calculated using the builtin MatLab function “hilbert”. We indicated in the following sectionswhen we performed averages among subjects and individual naps.For illustration on how the PLL outputs look like, we have presenteda single individual results from naps in some of the following fig-ures. To optimize the PLL, we run simulations (again using codewritten in MatLab) on data collected during naps changing one PLLparameter at the time (as explained in Section 2.1.4). We also runa simulation (following as best we could the steps explained in therelevant literature) to determine the precision of the phase trackingfor the Ngo et al. closed-loop method (Ngo et al., 2013b).
3. Results
3.1. PLL phase tracking of slow-wave oscillations
Fig. 2 shows EEG from channel Fpz during SWS (black curve)for one subject (subject 4). The output of the VCO is shown on thesame time scale (blue curve). The PLL output closely follows theEEG trace, particularly during bursts of slow-wave activity. Duringthese times, the phase error is small and the PLL is locked. Duringtimes when the frequency characteristics of the EEG is not withinthe given bandwidth, the PLL oscillates in a more regular way witha sinusoidal pattern with the central frequency of the system. Thisfeature of the PLL is useful for our purpose because our algorithm
generates a tone when a certain phase range is reached for the firsttime. Even when a slow wave is not present, rhythmic tones aredelivered in the attempt to evoke a slow wave. The tones are indi-cated by pink stems in Fig. 2. A first visual inspection shows that
106 G. Santostasi et al. / Journal of Neuroscience Methods 259 (2016) 101–114
Fig. 2. The EGG trace (subject 4) for an interval of SWS (black line), the VCO output for the PLL that matches the EEG trace (blue line), and the acoustic stimuli (pink stems).T n in ri to the
atIjfooumsjibtp
Fi
he negative half of the slow waves, as identified by our automatic code, are shownterpretation of the references to color in this figure legend, the reader is referred
majority of the acoustic stimuli are delivered at the target phasehat in this case is between the zero crossing and the positive peak.n this example we used data from a specific nap from one sub-ect. The statistics described in the following sections are derivedrom sham and stimulation naps in 5 subjects. The PLL is capablef adapting to individual sleep patterns and characteristics with-ut the need to be further calibrated after the initial optimizationsing baseline information described in Section 2.1.3. Whereas theethod used by Cox et al. (2014) for slow-wave phase targeting
eems to perform in an inconsistent manner across different sub-ects, our PLL is very consistent (both within and between subjects)
n how precisely the tones are delivered at a given target phaseecause of the inherent adaptive properties of the PLL. This sec-ion contains a detailed discussion of the phase tracking statisticalerformance of our algorithm.ig. 3. A normalized EEG trace (divided by a factor of 10, subject 4) with a superimposed pndicating times when the PLL is locked to the EEG. (For interpretation of the references to
ed. Visual inspection shows that the PLL algorithm identified the right phase.(For web version of this article.)
To quantify the performance of the PLL in tracking the EEG sig-nal, we used the Hilbert transform to calculate the phase of the EEGoffline. It is important to note that the PLL is designed to track theEEG activity in a narrow frequency range, so discrepancies betweenthe PLL phase and the actual phase of the EEG can be due to thericher frequency content present in the EEG. Although the Hilberttransform is the gold standard to measure phase of a time series,it is not a useful tool to calculate the phase online because it needsto have information both about the past and the future of the timeseries to compute the phase at any particular point. This is the rea-son why we use the PLL as the online phase detector. We define the
PLL phase error as the difference between the phase-detector out-put of the PLL and the phase of the EEG calculated using the Hilberttransform. Fig. 3 shows the phase error (for subject 4) as a functionof time and it is plotted superimposed on an EEG time series (tohase error (in blue). The phase error is small when a burst of slow waves is present, color in this figure legend, the reader is referred to the web version of this article.)

G. Santostasi et al. / Journal of Neuroscie
Fig. 4. Error in phase detection (data from all the subjects’ naps). The red line rep-resents the mean phase vector. Top panel is the EEG data points during N3, bottompanel is the phase error for events that include slow waves. (For interpretation ofto
mostto
eCc
Fd
he references to color in this figure legend, the reader is referred to the web versionf this article.)
ake easier the comparison of scale the EEG is divided by a factorf 10). In general, the errors become quite small in the presence oflow-wave bursts and the PLL is therefore locked to the EEG duringhese events. In fact, even if our sleep staging is independent fromhe PLL, the PLL could be used by itself to determine the presencef SWS.
To analyze more precisely the statistical phase-tracking prop-rties of the PLL, we used the circular statistic functions from theircStat MatLab toolbox (Berens, 2009). Fig. 4 top panel shows aircular histogram of the PLL phase error in degrees for the case
ig. 5. EEG amplitude versus the error in phase detection (subject 4 nap data). While
istributed for large amplitudes the phase error decreases as the amplitude increases.
nce Methods 259 (2016) 101–114 107
of all the EEG data points in SWS that did not contain slow waves(data from all the subjects’ naps). The circular histograms in the fol-lowing figures have a bin size of 18 degrees each. The bottom panelof Fig. 4 is a histogram for the same quantity but for segments ofdata that contained slow waves (negative portion). The presenceof slow waves reduced the standard deviation of the phase error,but introduced a small systematic error (t-test gives p = 0.051); themean value and standard deviation of the error are 12.51 ± 28.85degrees for the no-slow-wave case and 13.63 ± 9.88 degrees for theslow-wave case (a comparison of standard deviation F-test gives ap < 0.001). Fig. 5 shows the relationship between the slow-waveamplitude and the phase error, demonstrating that the larger theamplitude of the oscillation the smaller the error (all SWS datapoints from subject 4). Given that the acoustic stimulation needsto be presented at a particular phase of pre-existing slow wavesoscillations, it is reassuring the PLL performance is best when weobserve large amplitudes (indicating the probable presence of aslow wave) and the PLL locks to the EEG.
3.2. Phase targeting
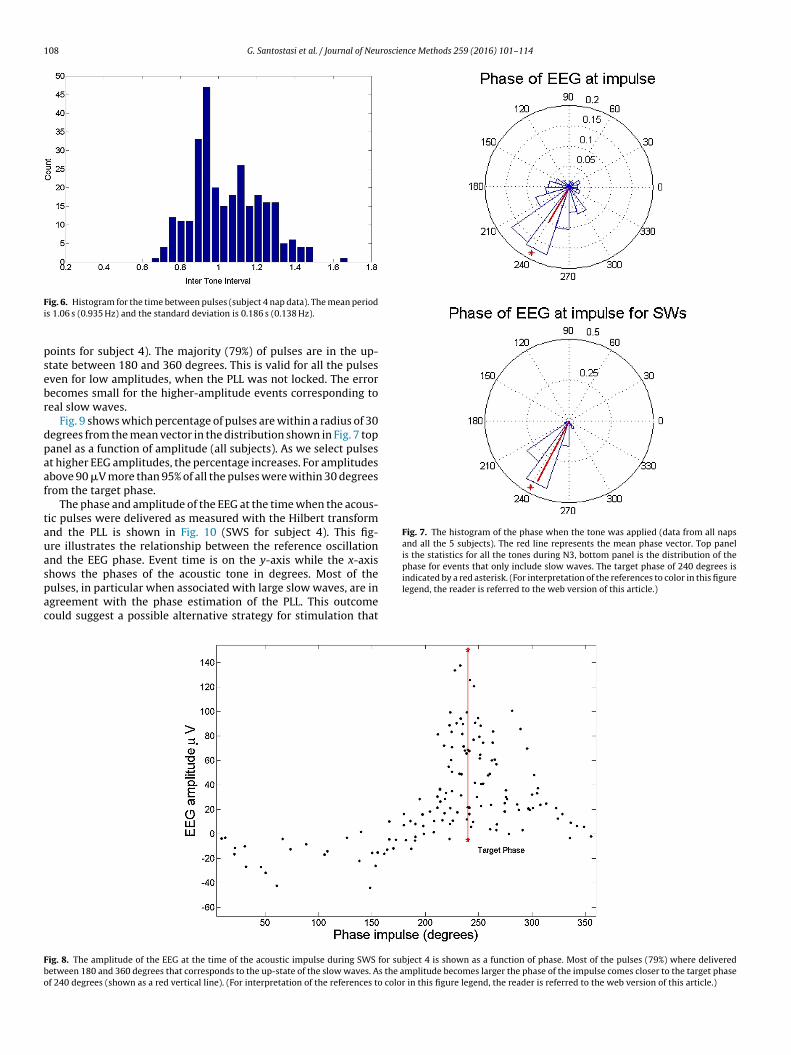
The interval of time in seconds between pulses is illustrated inthe histogram in Fig. 6. The histogram covers a relatively large rangeof periods (subject 4 nap data), but with most of the pulses at a dom-inant period. The mean period is 1.06 s (0.935 Hz) and the standarddeviation is 0.186 s (0.138 Hz).
The tones are delivered when the phase detector initiallyreaches the target range. Fig. 7 top panel shows the phase of theEEG in degrees (as measured with the Hilbert transform, data fromall naps and all the 5 subjects) at the time a tone was applied (evenwhen a threshold-level slow wave was not detected). In this figurethe down-state is at 90 degrees, the up-state is at 270 degrees. Thetarget phase is 240 degrees, (just before the up-state to take intoaccount possible hardware and software delays), as marked withan asterisk. The first time a data point is in this predeterminedrange an acoustic pulse is applied. The mean and standard devi-ation of the pulses’ phase is 240.37 ± 25.61 degrees. The bottompanel of Fig. 7 is similar to the top panel but only the pulses deliv-ered close to a detected slow wave (absolute EEG amplitudes bigger
than 70 �V) are considered. The mean value and standard deviationfor the phase of the slow-wave pulses is 243.15 ± 3.06 degrees.The amplitude of the EEG at the acoustic tone when a slow wavewas detected as a function of phase is plotted in Fig. 8 (SWS data
for small amplitudes (less than 50 �V) the phase error (in degrees) is uniformly
108 G. Santostasi et al. / Journal of Neuroscience Methods 259 (2016) 101–114
Fi
psebr
dpaaf
tauaspac
Fig. 7. The histogram of the phase when the tone was applied (data from all napsand all the 5 subjects). The red line represents the mean phase vector. Top panelis the statistics for all the tones during N3, bottom panel is the distribution of thephase for events that only include slow waves. The target phase of 240 degrees is
Fbo
ig. 6. Histogram for the time between pulses (subject 4 nap data). The mean periods 1.06 s (0.935 Hz) and the standard deviation is 0.186 s (0.138 Hz).
oints for subject 4). The majority (79%) of pulses are in the up-tate between 180 and 360 degrees. This is valid for all the pulsesven for low amplitudes, when the PLL was not locked. The errorecomes small for the higher-amplitude events corresponding toeal slow waves.
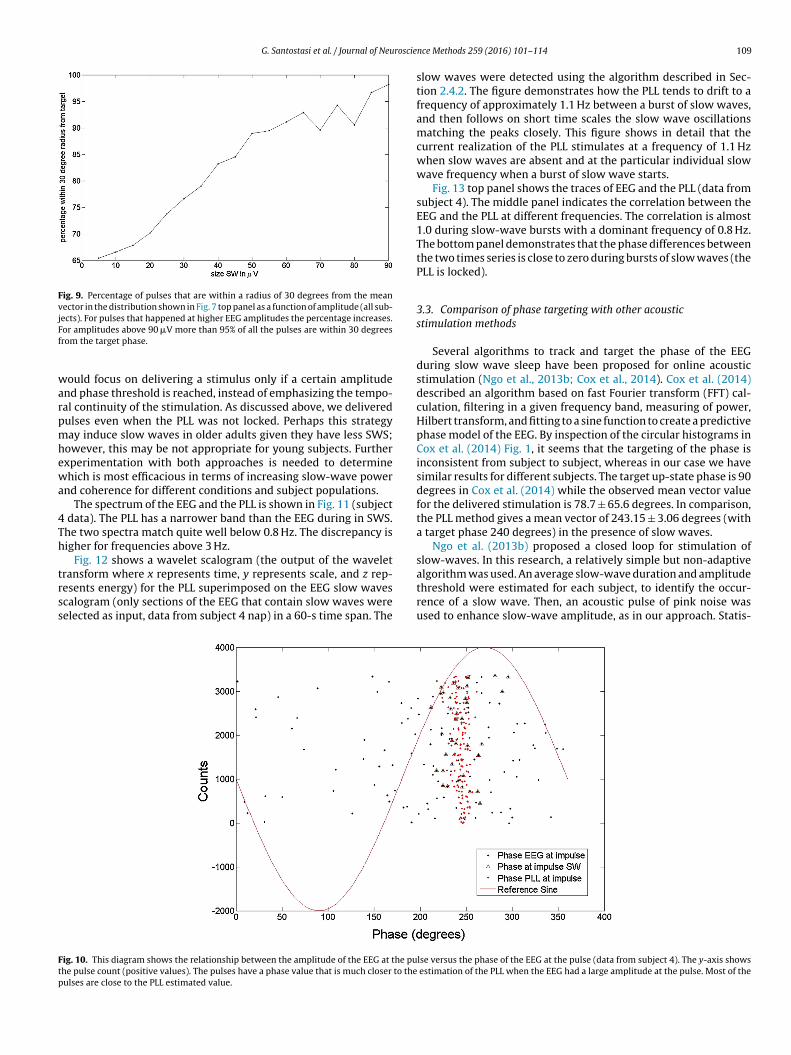
Fig. 9 shows which percentage of pulses are within a radius of 30egrees from the mean vector in the distribution shown in Fig. 7 topanel as a function of amplitude (all subjects). As we select pulsest higher EEG amplitudes, the percentage increases. For amplitudesbove 90 �V more than 95% of all the pulses were within 30 degreesrom the target phase.
The phase and amplitude of the EEG at the time when the acous-ic pulses were delivered as measured with the Hilbert transformnd the PLL is shown in Fig. 10 (SWS for subject 4). This fig-re illustrates the relationship between the reference oscillationnd the EEG phase. Event time is on the y-axis while the x-axishows the phases of the acoustic tone in degrees. Most of the
ulses, in particular when associated with large slow waves, are ingreement with the phase estimation of the PLL. This outcomeould suggest a possible alternative strategy for stimulation thatindicated by a red asterisk. (For interpretation of the references to color in this figurelegend, the reader is referred to the web version of this article.)
ig. 8. The amplitude of the EEG at the time of the acoustic impulse during SWS for subject 4 is shown as a function of phase. Most of the pulses (79%) where deliveredetween 180 and 360 degrees that corresponds to the up-state of the slow waves. As the amplitude becomes larger the phase of the impulse comes closer to the target phasef 240 degrees (shown as a red vertical line). (For interpretation of the references to color in this figure legend, the reader is referred to the web version of this article.)
G. Santostasi et al. / Journal of Neuroscie
Fig. 9. Percentage of pulses that are within a radius of 30 degrees from the meanvector in the distribution shown in Fig. 7 top panel as a function of amplitude (all sub-jects). For pulses that happened at higher EEG amplitudes the percentage increases.Ff
warpmhewa
4Th
trss
algorithm was used. An average slow-wave duration and amplitude
Ftp
or amplitudes above 90 �V more than 95% of all the pulses are within 30 degreesrom the target phase.
ould focus on delivering a stimulus only if a certain amplitudend phase threshold is reached, instead of emphasizing the tempo-al continuity of the stimulation. As discussed above, we deliveredulses even when the PLL was not locked. Perhaps this strategyay induce slow waves in older adults given they have less SWS;
owever, this may be not appropriate for young subjects. Furtherxperimentation with both approaches is needed to determinehich is most efficacious in terms of increasing slow-wave power
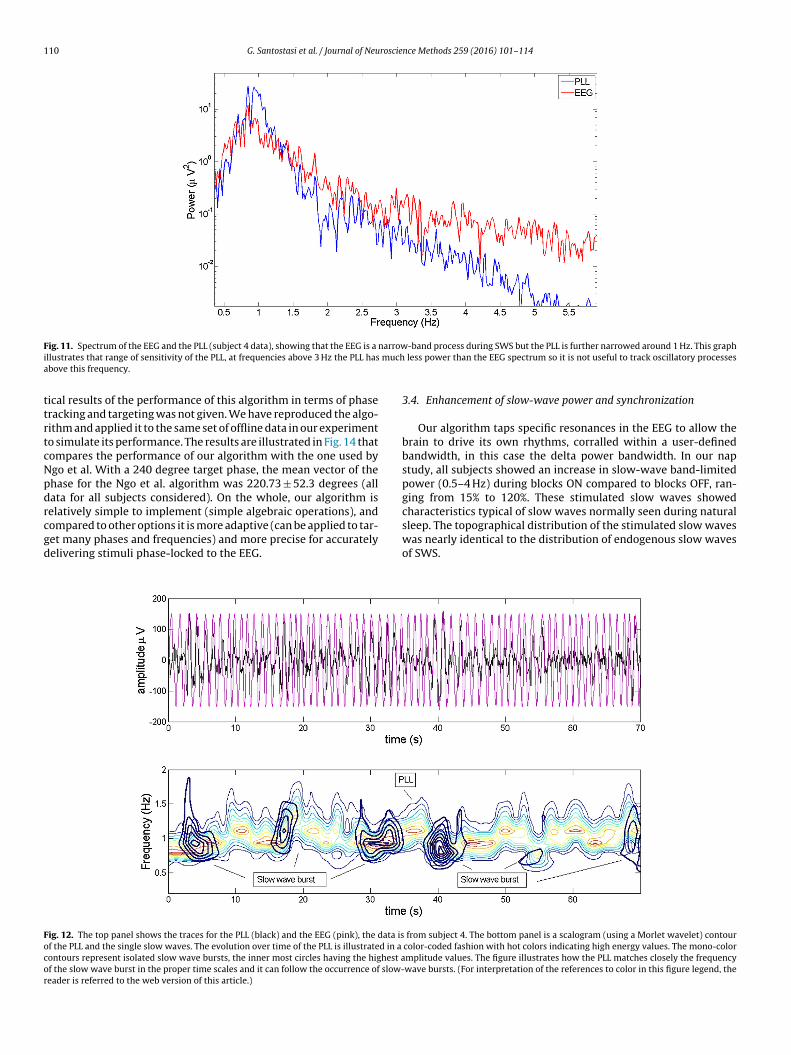
nd coherence for different conditions and subject populations.The spectrum of the EEG and the PLL is shown in Fig. 11 (subject
data). The PLL has a narrower band than the EEG during in SWS.he two spectra match quite well below 0.8 Hz. The discrepancy isigher for frequencies above 3 Hz.
Fig. 12 shows a wavelet scalogram (the output of the waveletransform where x represents time, y represents scale, and z rep-
esents energy) for the PLL superimposed on the EEG slow wavescalogram (only sections of the EEG that contain slow waves wereelected as input, data from subject 4 nap) in a 60-s time span. Theig. 10. This diagram shows the relationship between the amplitude of the EEG at the puhe pulse count (positive values). The pulses have a phase value that is much closer to theulses are close to the PLL estimated value.
nce Methods 259 (2016) 101–114 109
slow waves were detected using the algorithm described in Sec-tion 2.4.2. The figure demonstrates how the PLL tends to drift to afrequency of approximately 1.1 Hz between a burst of slow waves,and then follows on short time scales the slow wave oscillationsmatching the peaks closely. This figure shows in detail that thecurrent realization of the PLL stimulates at a frequency of 1.1 Hzwhen slow waves are absent and at the particular individual slowwave frequency when a burst of slow wave starts.
Fig. 13 top panel shows the traces of EEG and the PLL (data fromsubject 4). The middle panel indicates the correlation between theEEG and the PLL at different frequencies. The correlation is almost1.0 during slow-wave bursts with a dominant frequency of 0.8 Hz.The bottom panel demonstrates that the phase differences betweenthe two times series is close to zero during bursts of slow waves (thePLL is locked).
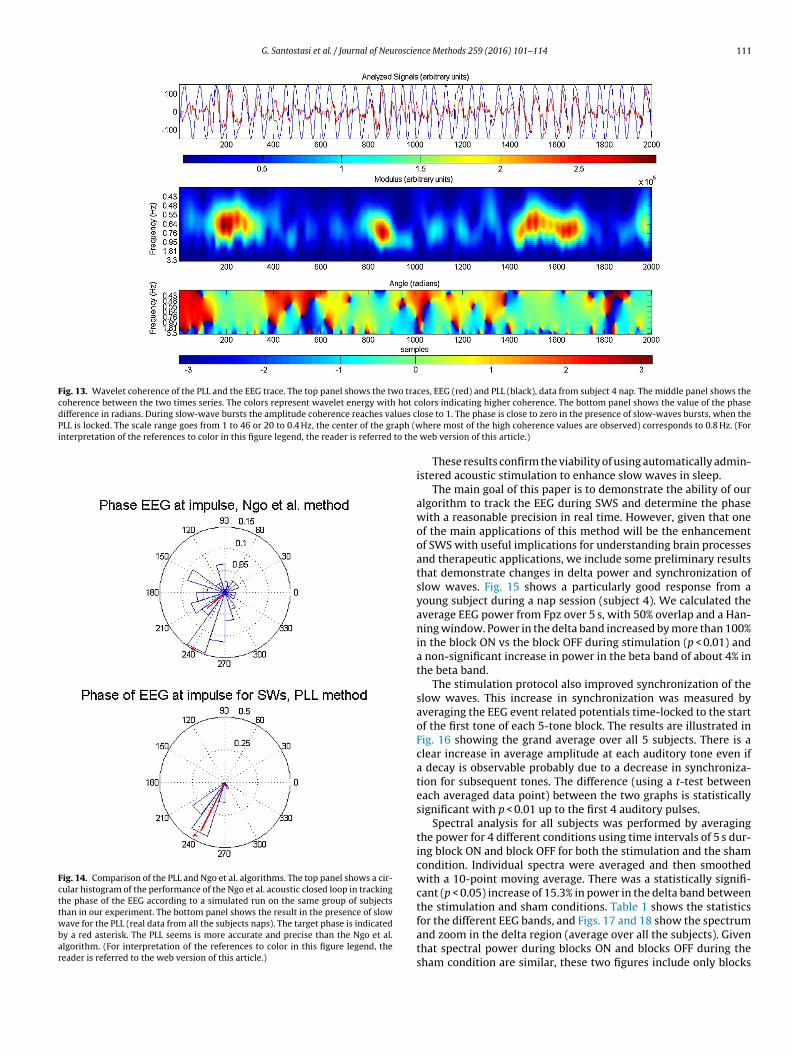
3.3. Comparison of phase targeting with other acousticstimulation methods
Several algorithms to track and target the phase of the EEGduring slow wave sleep have been proposed for online acousticstimulation (Ngo et al., 2013b; Cox et al., 2014). Cox et al. (2014)described an algorithm based on fast Fourier transform (FFT) cal-culation, filtering in a given frequency band, measuring of power,Hilbert transform, and fitting to a sine function to create a predictivephase model of the EEG. By inspection of the circular histograms inCox et al. (2014) Fig. 1, it seems that the targeting of the phase isinconsistent from subject to subject, whereas in our case we havesimilar results for different subjects. The target up-state phase is 90degrees in Cox et al. (2014) while the observed mean vector valuefor the delivered stimulation is 78.7 ± 65.6 degrees. In comparison,the PLL method gives a mean vector of 243.15 ± 3.06 degrees (witha target phase 240 degrees) in the presence of slow waves.
Ngo et al. (2013b) proposed a closed loop for stimulation ofslow-waves. In this research, a relatively simple but non-adaptive
threshold were estimated for each subject, to identify the occur-rence of a slow wave. Then, an acoustic pulse of pink noise wasused to enhance slow-wave amplitude, as in our approach. Statis-
lse versus the phase of the EEG at the pulse (data from subject 4). The y-axis shows estimation of the PLL when the EEG had a large amplitude at the pulse. Most of the
110 G. Santostasi et al. / Journal of Neuroscience Methods 259 (2016) 101–114
F narrowi mucha
ttrtcNpdrcgd
Focor
ig. 11. Spectrum of the EEG and the PLL (subject 4 data), showing that the EEG is a
llustrates that range of sensitivity of the PLL, at frequencies above 3 Hz the PLL hasbove this frequency.
ical results of the performance of this algorithm in terms of phaseracking and targeting was not given. We have reproduced the algo-ithm and applied it to the same set of offline data in our experimento simulate its performance. The results are illustrated in Fig. 14 thatompares the performance of our algorithm with the one used bygo et al. With a 240 degree target phase, the mean vector of thehase for the Ngo et al. algorithm was 220.73 ± 52.3 degrees (allata for all subjects considered). On the whole, our algorithm iselatively simple to implement (simple algebraic operations), and
ompared to other options it is more adaptive (can be applied to tar-et many phases and frequencies) and more precise for accuratelyelivering stimuli phase-locked to the EEG.ig. 12. The top panel shows the traces for the PLL (black) and the EEG (pink), the data isf the PLL and the single slow waves. The evolution over time of the PLL is illustrated in a
ontours represent isolated slow wave bursts, the inner most circles having the highest af the slow wave burst in the proper time scales and it can follow the occurrence of slow-eader is referred to the web version of this article.)
-band process during SWS but the PLL is further narrowed around 1 Hz. This graph less power than the EEG spectrum so it is not useful to track oscillatory processes
3.4. Enhancement of slow-wave power and synchronization
Our algorithm taps specific resonances in the EEG to allow thebrain to drive its own rhythms, corralled within a user-definedbandwidth, in this case the delta power bandwidth. In our napstudy, all subjects showed an increase in slow-wave band-limitedpower (0.5–4 Hz) during blocks ON compared to blocks OFF, ran-ging from 15% to 120%. These stimulated slow waves showedcharacteristics typical of slow waves normally seen during natural
sleep. The topographical distribution of the stimulated slow waveswas nearly identical to the distribution of endogenous slow wavesof SWS.from subject 4. The bottom panel is a scalogram (using a Morlet wavelet) contourcolor-coded fashion with hot colors indicating high energy values. The mono-colormplitude values. The figure illustrates how the PLL matches closely the frequencywave bursts. (For interpretation of the references to color in this figure legend, the
G. Santostasi et al. / Journal of Neuroscience Methods 259 (2016) 101–114 111
Fig. 13. Wavelet coherence of the PLL and the EEG trace. The top panel shows the two traces, EEG (red) and PLL (black), data from subject 4 nap. The middle panel shows thecoherence between the two times series. The colors represent wavelet energy with hot cdifference in radians. During slow-wave bursts the amplitude coherence reaches values cPLL is locked. The scale range goes from 1 to 46 or 20 to 0.4 Hz, the center of the graph (winterpretation of the references to color in this figure legend, the reader is referred to the
Fig. 14. Comparison of the PLL and Ngo et al. algorithms. The top panel shows a cir-cular histogram of the performance of the Ngo et al. acoustic closed loop in trackingthe phase of the EEG according to a simulated run on the same group of subjectsthan in our experiment. The bottom panel shows the result in the presence of slowwave for the PLL (real data from all the subjects naps). The target phase is indicatedby a red asterisk. The PLL seems is more accurate and precise than the Ngo et al.algorithm. (For interpretation of the references to color in this figure legend, thereader is referred to the web version of this article.)
olors indicating higher coherence. The bottom panel shows the value of the phaselose to 1. The phase is close to zero in the presence of slow-waves bursts, when the
here most of the high coherence values are observed) corresponds to 0.8 Hz. (For web version of this article.)
These results confirm the viability of using automatically admin-istered acoustic stimulation to enhance slow waves in sleep.
The main goal of this paper is to demonstrate the ability of ouralgorithm to track the EEG during SWS and determine the phasewith a reasonable precision in real time. However, given that oneof the main applications of this method will be the enhancementof SWS with useful implications for understanding brain processesand therapeutic applications, we include some preliminary resultsthat demonstrate changes in delta power and synchronization ofslow waves. Fig. 15 shows a particularly good response from ayoung subject during a nap session (subject 4). We calculated theaverage EEG power from Fpz over 5 s, with 50% overlap and a Han-ning window. Power in the delta band increased by more than 100%in the block ON vs the block OFF during stimulation (p < 0.01) anda non-significant increase in power in the beta band of about 4% inthe beta band.
The stimulation protocol also improved synchronization of theslow waves. This increase in synchronization was measured byaveraging the EEG event related potentials time-locked to the startof the first tone of each 5-tone block. The results are illustrated inFig. 16 showing the grand average over all 5 subjects. There is aclear increase in average amplitude at each auditory tone even ifa decay is observable probably due to a decrease in synchroniza-tion for subsequent tones. The difference (using a t-test betweeneach averaged data point) between the two graphs is statisticallysignificant with p < 0.01 up to the first 4 auditory pulses.
Spectral analysis for all subjects was performed by averagingthe power for 4 different conditions using time intervals of 5 s dur-ing block ON and block OFF for both the stimulation and the shamcondition. Individual spectra were averaged and then smoothedwith a 10-point moving average. There was a statistically signifi-cant (p < 0.05) increase of 15.3% in power in the delta band betweenthe stimulation and sham conditions. Table 1 shows the statisticsfor the different EEG bands, and Figs. 17 and 18 show the spectrum
and zoom in the delta region (average over all the subjects). Giventhat spectral power during blocks ON and blocks OFF during thesham condition are similar, these two figures include only blocks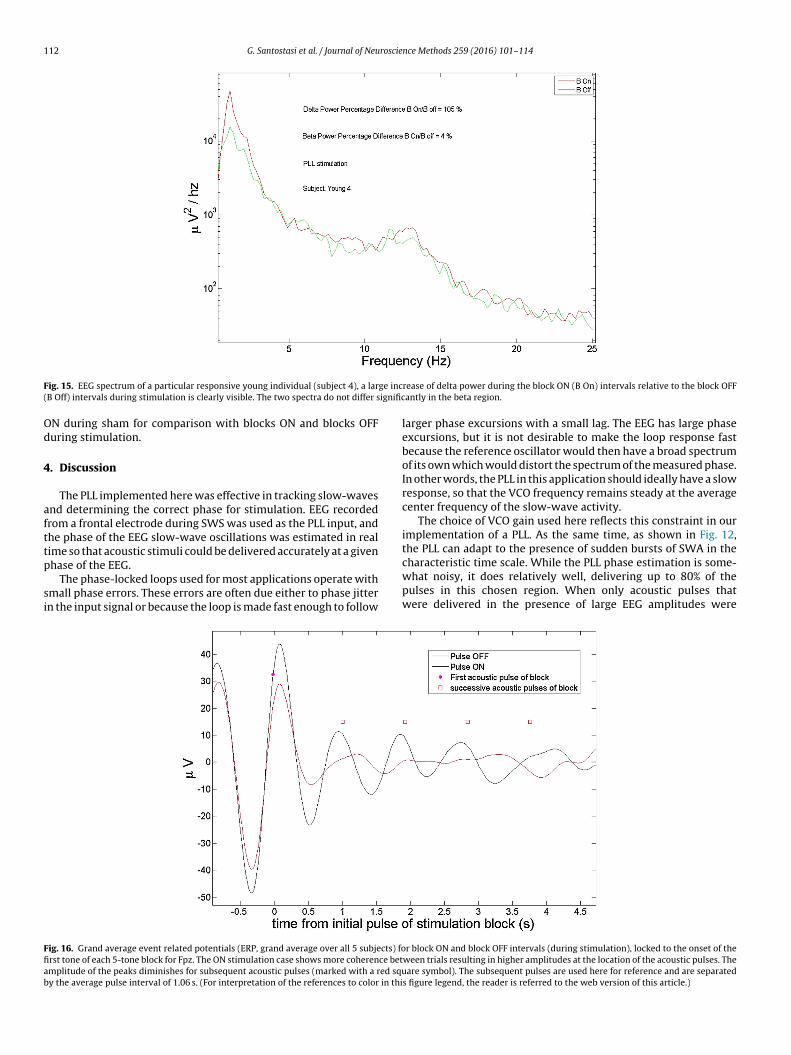
112 G. Santostasi et al. / Journal of Neuroscience Methods 259 (2016) 101–114
F ge inc( ignific
Od
4
afttp
si
Ffiab
ig. 15. EEG spectrum of a particular responsive young individual (subject 4), a larB Off) intervals during stimulation is clearly visible. The two spectra do not differ s
N during sham for comparison with blocks ON and blocks OFFuring stimulation.
. Discussion
The PLL implemented here was effective in tracking slow-wavesnd determining the correct phase for stimulation. EEG recordedrom a frontal electrode during SWS was used as the PLL input, andhe phase of the EEG slow-wave oscillations was estimated in realime so that acoustic stimuli could be delivered accurately at a given
hase of the EEG.The phase-locked loops used for most applications operate withmall phase errors. These errors are often due either to phase jittern the input signal or because the loop is made fast enough to follow
ig. 16. Grand average event related potentials (ERP, grand average over all 5 subjects) forst tone of each 5-tone block for Fpz. The ON stimulation case shows more coherence betmplitude of the peaks diminishes for subsequent acoustic pulses (marked with a red squy the average pulse interval of 1.06 s. (For interpretation of the references to color in thi
rease of delta power during the block ON (B On) intervals relative to the block OFFantly in the beta region.
larger phase excursions with a small lag. The EEG has large phaseexcursions, but it is not desirable to make the loop response fastbecause the reference oscillator would then have a broad spectrumof its own which would distort the spectrum of the measured phase.In other words, the PLL in this application should ideally have a slowresponse, so that the VCO frequency remains steady at the averagecenter frequency of the slow-wave activity.
The choice of VCO gain used here reflects this constraint in ourimplementation of a PLL. As the same time, as shown in Fig. 12,the PLL can adapt to the presence of sudden bursts of SWA in the
characteristic time scale. While the PLL phase estimation is some-what noisy, it does relatively well, delivering up to 80% of thepulses in this chosen region. When only acoustic pulses thatwere delivered in the presence of large EEG amplitudes werer block ON and block OFF intervals (during stimulation), locked to the onset of theween trials resulting in higher amplitudes at the location of the acoustic pulses. Theare symbol). The subsequent pulses are used here for reference and are separated
s figure legend, the reader is referred to the web version of this article.)

G. Santostasi et al. / Journal of Neuroscie
Table 1Statistics for EEG band power percentage difference between conditions (averagesover all the subjects). The percent change in block ON (stimulation vs sham) was cal-culated as spectral power of [block ON (stimulation) − block ON (sham)]/[block ON(sham)]. The percent change in block ON vs block OFF during stimulation was calcu-lated as spectral power of [block ON (stimulation) − block OFF (stimulation)]/[blockOFF (stimulation)]. Statistical significant results were observed in the delta, thet,and fast spindle bands.
EEG band Percent change inblock ON (stimulationvs sham)
Percent change block ON vsblock OFF during stimulation(stimulation condition)
Delta (0.5–4 Hz) 15.3% (p < 0.05) 52.8% (p < 0.01)Theta (4–8 Hz) 12.6% (p < 0.05) 19.3% (p < 0.01)Alpha (8–12 Hz) 7.4% (p = 0.11) 7.2% (p = 0.08)Fast spindle 19.0% (p < 0.05) 30.1% (p < 0.01)
crod
cated in regulation of processes such as blood pressure (Sayk et al.,
Fa
FO
(14–16 Hz)Beta (16–25 Hz) 1.55% (p = 0.61) 1.57% (p = 0.59)
onsidered, almost all the pulses happened within a 30-degree
adius of the target phase. This suggests that with the additionf a simple amplitude threshold, the PLL can be very accurate inelivering the stimulation at the right phase.ig. 17. EEG spectrum for 3 different cases blocks ON during stimulation (B On Stim) andveraged. The main change in power during blocks ON B for the stimulation vs sham con
ig. 18. A zoom-in of the EEG spectrum in the delta region. The auditory stimulation prodFF (B Off) segments, possibly due to a refractory effect.
nce Methods 259 (2016) 101–114 113
In this way, acoustic pulses can be delivered in a relatively broadrange of phases that correspond to different physiological states,particularly the silent down-state or the excitatory up-state of neu-ronal assembles during SWS. The large range of phase values atwhich the pulses are delivered versus the mechanically preciserhythm of a perfect sinusoid might be an advantage in stimulat-ing a biological system, given that realistic neural oscillators do nothave one precise natural resonant frequency and there would be arange of values for these frequencies.
The ability to reliably enhance SWS is critical to testing rela-tionships between SWS and other physiologic functions. Thisis particularly important because sleep dysfunction, particularlysleep loss, is endemic in modern society (Colten and Altevogt,2006), and is common in people with cardio-metabolic disorderssuch as obesity, hypertension, and diabetes mellitus (Tasali et al.,2008; Leproult and Van Cauter, 2010; Buxton et al., 2012; Funget al., 2011; Koren et al., 2011). In particular, SWS has been impli-
2010), glucose, growth hormone secretion (Van Cauter et al., 2000),and memory consolidation (Tononi and Cirelli, 2003, 2006). Useof methods for selective deprivation of SWS without reduction of
sham (B On Sham) and blocks OFF during stimulation (B Off Stim) with all subjectsditions was in the delta band.
uced an increase of 15.3% in delta band. There is a decrease in power during block

1 roscie
tttaemoutpi
5
hwetSiea
A
NGpfceH
R
A
A
B
B
B
B
C
C
D
D
F
F
F
F
G
14 G. Santostasi et al. / Journal of Neu
otal sleep time has provided a deeper understanding of these rela-ionships. For example, selective deprivation of SWS using soundso cause micro-arousals during SWS has been shown to lead tottenuation of normal dipping of blood pressure during sleep (Saykt al., 2010) and impaired glucose metabolism (Tasali et al., 2008). Aethod such as the PLL will allow us to determine if enhancement
f SWS can improve or restore regulation of these functions, partic-larly if they are already impaired. If this method proves successful,hen the acoustic stimulation of SWS could be a novel and non-harmacologic intervention to treat common diseases with major
mplications for health.
. Conclusions
The PLL has been used in many engineering applications, but itas had relatively limited use as a tool for brain stimulation. Heree demonstrated a novel PLL implementation that used online
stimation of slow-wave phase to facilitate the regular alterna-ion between the up and down states of cortical activity duringWS. Given the relevance of EEG oscillations for neural functionn general, this technique has potential for applications in whichnhancement of SWS is desirable, such to improve neurocognitivend cardio-metabolic functions.
cknowledgments
Research reported in this publication was supported byorthwestern Memorial Foundation Dixon Translational Researchrantunder Grant no. P01AG11412. In addition, this work was sup-orted, in part, by the National Institutes of Health’s National Centeror Advancing Translational Sciences, Grant no. UL1TR001422. Theontent is solely the responsibility of the authors and does not nec-ssarily represent the official views of the National Institutes ofealth.
eferences
hissar E, Kleinfeld D. Closed-loop neuronal computations: focus on vibrissasomatosensation in rat. Cereb Cortex 2003;13(1):53–62.
mzica F, Steriade M. Cellular substrates and laminar profile of sleep K-complex.Neuroscience 1998;82(3):671–86.
erens P. CircStat: A MATLAB toolbox for circular statistics. J Stat Softw2009;31(10):1–21.
roughton R, Healey T, Maru J, Green D, Pagurek B. A phase locked loop devicefor automatic detection of sleep spindles and stage 2. Electroencephalogr ClinNeurophysiol 1978;44(5):677–80.
runner C, Scherer R, Graimann B, Supp G, Pfurtscheller G. Online control of abrain–computer interface using phase synchronization. IEEE Trans Biomed Eng2006;53(12):2501–6.
uxton OM, Cain SW, O’Connor SP, Porter JH, Duffy JF, Wang W, et al. Adversemetabolic consequences in humans of prolonged sleep restriction combinedwith circadian disruption. Sci Transl Med 2012;4(129):129ra43.
olten HR, Altevogt BM. Sleep disorders and sleep deprivation: an unmet publichealth problem. Washington, DC: National Academies Press; 2006.
ox R, Korjoukov I, de Boer M, Talamini LM. Sound asleep: processing and retentionof slow oscillation phase-targeted stimuli. PLoS One 2014;9(7):e101567.
ang-Vu TT. Neuronal oscillations in sleep: insights from functional neuroimaging.Neuromol Med 2012;14(3):154–67.
iekelmann S, Born J. The memory function of sleep. Nat Rev Neurosci2010;11(2):114–26.
arazian M, Larson LE, Gudem PS. Fast hopping frequency generation in digital CMOS.New York: Springer-Verlag; 2013.
errarelli F, Huber R, Peterson MJ, Massimini M, Murphy M, Riedner BA, et al.Reduced sleep spindle activity in schizophrenia patients. Am J Psychiatry2007;164(3):483–92.
erri R, Huber R, Arico D, Drago V, Rundo F, Ghilardi MF, et al. The slow-wave compo-nents of the cyclic alternating pattern (CAP) have a role in sleep-related learningprocesses. Neurosci Lett 2008;432(3):228–31.
ung MM, Peters K, Redline S, Ziegler MG, Ancoli-Israel S, Barrett-Connor E, et al.Decreased slow wave sleep increases risk of developing hypertension in elderlymen. Hypertension 2011;58(4):596–603.
ais S, Born J. Declarative memory consolidation: mechanisms acting during humansleep. Learn Mem 2004;11(6):679–85.
nce Methods 259 (2016) 101–114
Hileman RE, Dick DE. Detection of phase characteristics of alpha waves in the elec-troencephalogram. IEEE Trans Biomed Eng 1971;18(5):379–82.
Hinze T, Schumann M, Bodenstein C, Heiland I, Schuster S. Biochemical frequencycontrol by synchronisation of coupled repressilators: an in silico study of mod-ules for circadian clock systems. Comput Intell Neurosci 2011;2011:262189.
Horne J. Human slow-wave sleep: a review and appraisal of recent findings,with implications for sleep functions, and psychiatric illness. Experientia1992;48(10):941–54.
Iber, C., A.A.o.S. Medicine. The AASM manual for the scoring of sleep and associatedevents: rules, terminology and technical specifications. Westchester, IL; 2007.
Kimura H, N Y. Circadian rhythm as a phase-locked loop. In: Proceedings of the IFACworld congress, Czech Republic; 2005.
Koren D, Levitt Katz LE, Brar PC, Gallagher PR, Berkowitz RI, Brooks LJ. Sleep archi-tecture and glucose and insulin homeostasis in obese adolescents. Diabetes Care2011;34(11):2442–7.
Lang N, Siebner HR, Ward NS, Lee L, Nitsche MA, Paulus W, et al. How does transcra-nial DC stimulation of the primary motor cortex alter regional neuronal activityin the human brain? Eur J Neurosci 2005;22(2):495–504.
Lee. Y-Y, Lo P-C. Categorization of EEG rhythmic patterns based on PLL approach. In:Proceedings of the International Conference on Signal Processing, Beijing; 2000.
Leproult R, Van Cauter E. Role of sleep and sleep loss in hormonal release andmetabolism. Endocr Dev 2010;17:11–21.
Mander BA, Rao V, Lu B, Saletin JM, Lindquist JR, Ancoli-Israel S, et al. Prefrontalatrophy, disrupted NREM slow waves and impaired hippocampal-dependentmemory in aging. Nat Neurosci 2013;16(3):357–64.
Marshall L, Molle M, Hallschmid M, Born J. Transcranial direct current stimulationduring sleep improves declarative memory. J Neurosci 2004;24(44):9985–92.
Marshall L, Helgadottir H, Molle M, Born J. Boosting slow oscillations during sleeppotentiates memory. Nature 2006;444(7119):610–3.
Ng BS, Logothetis NK, Kayser C. EEG phase patterns reflect the selectivity of neuralfiring. Cereb Cortex 2013;23(2):389–98.
Ngo HV, Claussen JC, Born J, Molle M. Induction of slow oscillations by rhythmicacoustic stimulation. J Sleep Res 2013a;22(1):22–31.
Ngo HV, Martinetz T, Born J, Molle M. Auditory closed-loop stimulation of the sleepslow oscillation enhances memory. Neuron 2013;78(3):545–53.
Ong JL, Lo JC, Chee NI, Santostas iG, Paller KA, Zee PC, et al., Effects of phase-lockedacoustic stimulation during a nap on eeg spectra and declarative memory con-solidation, (Submitted).
Oudiette D, Santostasi G, Paller KA. Reinforcing rhythms in the sleeping brain witha computerized metronome. Neuron 2013;78(3):413–5.
Pei-Chen L, Yu-Yun L. Applicability of phase-locked loop to tracking the rhythmicactivity in EEG. Circuits Syst Signal Process 2000;19:171–86.
Plihal W, Born J. Effects of early and late nocturnal sleep on declarative and proce-dural memory. J Cogn Neurosci 1997;9(4):534–47.
Poreisz C, Boros K, Antal A, Paulus W. Safety aspects of transcranial direct cur-rent stimulation concerning healthy subjects and patients. Brain Res Bull2007;72(4–6):208–14.
Riedner BA, Bellesi M, Hulse BK, Santostasi G, Ferrarelli F, Cirelli C, et al. Enhanc-ing slow waves using acoustic stimuli. Society for Neuroscience Meeting posterpresentation; 2013.
Sayk F, Teckentrup C, Becker C, Heutling D, Wellhoner P, Lehnert H, et al. Effectsof selective slow-wave sleep deprivation on nocturnal blood pressure dippingand daytime blood pressure regulation. Am J Physiol Regul Integr Comp Physiol2010;298(1):R191–7.
Schabus M, Dang-Vu TT, Heib DP, Boly M, Desseilles M, Vandewalle G, et al. The fateof incoming stimuli during NREM sleep is determined by spindles and the phaseof the slow oscillation. Front Neurol 2012;3:40.
Schilling RJ. Control of a biological clock with light. Int J Syst Sci 1982;13(5):517–23.Schilling RJ, Robinson CJ. A phase-locked loop model of the response of the postural
control system to periodic platform motion. IEEE Trans Neural Syst Rehabil Eng2010;18(3):274–83.
Talbot DB. A review of PLL fundamentals. In: Frequency acquisition techniques forphase locked loops. Hoboken, New Jersey: John Wiley & Sons, Inc; 2012. p. 3–15.
Tasali E, Leproult R, Ehrmann DA, Van Cauter E. Slow-wave sleep and the risk of type2 diabetes in humans. Proc Natl Acad Sci U S A 2008;105(3):1044–9.
Tononi G, Cirelli C. Sleep and synaptic homeostasis: a hypothesis. Brain Res Bull2003;62(2):143–50.
Tononi G, Cirelli C. Sleep function and synaptic homeostasis. Sleep Med Rev2006;10(1):49–62.
Tononi G, Riedner BA, Hulse BK, Ferrarelli F, Sarasso S. Enhancing sleep slow waveswith natural stimuli. MedicaMundi 2010;54(2):73–9.
Van Cauter E, Leproult R, Plat L. Age-related changes in slow wave sleep and REMsleep and relationship with growth hormone and cortisol levels in healthy men.J Am Med Assoc 2000;284(7):861–8.
VanCauter E, Plat L. Physiology of growth hormone secretion during sleep. J Pediatr1996;128(5):S32–7.
Viterbi AJ, Cahn CR. Optimum coherent phase + frequency demodulation of class ofmodulating spectra. IEEE Trans. Space Electron Telem 1964;10(3) (95-&).
Volgushev M, Chauvette S, Mukovski M, Timofeev I. Precise long-range synchroniza-tion of activity and silence in neocortical neurons during slow-wave oscillations[corrected]. J Neurosci 2006;26(21):5665–72.
Westerberg CE, Mander BA, Florczak SM, Weintraub S, Mesulam MM, Zee PC,et al. Concurrent impairments in sleep and memory in amnestic mild cognitiveimpairment. J Int Neuropsychol Soc 2012;18(3):490–500.
Xie L, Kang H, Xu Q, Chen MJ, Liao Y, Thiyagarajan M, et al. Sleep drives metaboliteclearance from the adult brain. Science 2013;342(6156):373–7.