journal of marketing for higher education 2010
TRANSCRIPT
The influence of organizational image on college selection:what students seek in institutions of higher education
Andrea M. Pampaloni∗
Communication Department, La Salle University, PA, USA
Colleges and universities rely on their image to attract new members. Thisstudy focuses on the decision-making process of students preparing to applyto college. High school students were surveyed at college open houses toidentify the factors most influential to their college application decision-making. A multi-methods analysis found that institutional characteristicswere more influential than interpersonal or informational resources usedby students. More specific results revealed that size, housing, andknowing someone who attended a school predicted students’ views of theschool’s atmosphere. Key findings are discussed and recommendationsoffered to address issues related to organizational image.
Keywords: organizational image; decision-making; higher education
Introduction
For many students the decision to attend a college immediately after high schoolis foregone, having been decided years before any application is due. Other stu-dents might decide to pursue higher education in response to the realization thatthe life they have thus enjoyed is about to change drastically. For most, however,it is a stressful process (Whitehead, Raffan, & Deaney, 2006) that generallybegins in conjunction with the start of high school, with a much more dedicatedeffort undertaken as the junior year approaches (Hossler, Schmit, & Vesper,1999). Regardless of the incentive, the commitment to pursue continued edu-cation is often the first major, life-changing decision an individual will make.As such it warrants attention for two reasons. First, external influences arealmost certain to be solicited to seek recommendations for guidance and direc-tion. A better understanding of whom and what these influences are and howthey contribute to the final decision may offer valuable insights intothe decision-making process and help to identify possible outcomes. Second,considering the desired long-term outcome related to this decision, presumablya job upon graduation, it makes sense from an organizational perspective torecognize the factors that influence the decision-making process at this earlystage. Gaining a better understanding of the influences on and outcomes of the
ISSN 0884-1241 print/ISSN 1540-7144 online
# 2010 Taylor & FrancisDOI: 10.1080/08841241003788037
http://www.informaworld.com
∗E-mail: [email protected]
Journal of Marketing for Higher EducationVol. 20, No. 1, January–June 2010, 19–48
decision-making process of this population allows organizations to adapt theirrecruitment messages to target desired potential new employees who providethe best ‘fit’ within that organization. This study looks at how organizationalimage and the factors that contribute to it influence the decision-makingprocess of new, first-year college students.
To begin, a definition and overview of organizational image is provided. Next,influences on decision-making specifically within the context of higher education,are reviewed. This is discussed at two levels: first looking at the influences affect-ing potential students when selecting a college, and next considering the organiz-ational influences that colleges employ to influence prospective members. Theresults of a survey of high school students conducted to identify characteristicsinfluential to their decision-making are reported, and key findings are discussed,including recommendations for institutions of higher education to address thecriteria identified by potential students as influential to their decision-making.Within this text the terms colleges and universities are used interchangeably.
Organizational image
Although image has been defined as the perception of an organization held byboth internal and external publics (Margulies, 1977; Scott & Jehn, 2003), or theviews that organizational members believe outsiders hold of the organization(Dutton & Dukerich, 1991; Dutton et al., 1994), for the purposes of this discus-sion organizational image is considered to be the views and perceptions of anorganization held by non-members exclusively (Berg, 1986; Hatch &Schultz, 2002). Image is created by an organization to persuade outsiders thatthe organization represents specific and desirable characteristics. It can be con-veyed interpersonally, through direct or indirect contact with an organization orits members, or more indirectly based on the mission statement and stated goalsof the organization (Gray, 1991). The perceptions non-members have of anorganization directly influences future contact with that organization.
Although universities share some characteristics with their corporate peers,such as competition for members, the nature of their business is very different,and they do not function under the same parameters (Cerit, 2006; Lewison &Hawes, 2007; Luque-Martinez & Del Barrio-Garcia, 2009). As such, the strategiesand tactics they use to attract potential members and the image that is created as aresult of their efforts takes on added importance. For schools that are smaller andnot as well-known as others with which they compete for new students, there is anadded burden because image has greater significance when consumers have hadminimal direct experience with an organization (Sung & Yang, 2008). Likewise,research suggests that the image of a given school is relative to that of otherschools. As such the perception of image is more influential than the actualimage (Elliot & Healy, 2001; Ivy, 2001). For example, if University X is featuredin news reports because students were arrested for fighting, potential students(and those that influence their decision-making) may perceive that the school is
20 A.M. Pampaloni

unsafe. This may hold true even after it is determined that the fight occurred acrossthe street from campus, the people involved were not enrolled at the school, andUniversity X has the safest campus in the city. This supports Wan and Schell’s(2007) view that image congruency – the reflection of the public’s desires andexpectations – strongly influences how people view organizations.
For institutions of higher education, image is important because it helpscreate a positive view of the organization, which determines if potentialmembers are attracted enough to want to become affiliated. The influence ofimage can be seen in the decision-making process of potential members; thatis, first time students, which is discussed next.
Factors influencing students’ decision-making
Deciding to attend college is often monumental to a young person. It is com-pounded by the fact that a defined time frame mandates the process and thatthe outcomes can be potentially significant. Additional life-changing consider-ations include the possibility of moving to a new location, developing newrelationships, accruing debt, and deciding on a course of action that mightsignificantly affect future life and career plans.
Galotti’s (1995) longitudinal study on the decision-making process of college-bound high school students provides insights on the number and type of criteriaused and the alternatives available to students as they make decisions about whatcolleges to pursue. The findings indicate that the types of criteria used to evaluateschools were only marginally different between students with higher or average aca-demic ability versus those with lower ability. Conversely, differences were reportedin the types of criteria reported, based on academic ability and gender. Galotti’s find-ings indicate that students’ academic ability influences both the number and types ofdecision criteria they consider when making decisions about college.
Other studies looking at factors that influence decision-making in adolescentsfocus on different demographic characteristics of students such as race (Freeman,1999), geographic origin (Kelpe Kern, 2000; Lapan, Tucker, Kim, & Kosciulek,2003; Powell & Luzzo, 1998), and financial issues (Bergerson, 2009; DesJardins,Ahlburg, & McCall, 2006; Perna & Titus, 2004). Related studies considerattributes that might influence students’ decisions to pursue higher education.For example, high school students with high levels of career maturity, includingcompetencies in decision-making skills, are more committed to making careerchoices (Powell & Luzzo, 1998). This could include the decision to attendcollege. Across studies, several factors emerged as being consistently influential.These can be categorized as interpersonal influences and informational influences.
Interpersonal influences
Interpersonal influences are the strongest influences on first time students whenengaging in decision-making about their future, specifically with reference to
Journal of Marketing for Higher Education 21

higher education or careers. Of the individuals from whom high school studentssought guidance and information, parents are overwhelmingly identified as thesingle strongest influence during the school selection process (Bergerson, 2009;Cabrera & LaNasa, 2000; Helwig, 2004; Hossler et al., 1999; Ketterson &Bluestein, 1997; Moogan, Baron, & Harris, 1999; Otto, 2000; Paulsen, 1990;Rowan-Kenyon, Bell, & Perna, 2008; Sachs, 2002; Scott & Daniel, 2001).Parental involvement has many components. It can be classified loosely asunstructured support such as encouragement, motivation, and providing asense of expectations, and as practical support such as assisting with preparationof forms, or offering to pay for, or, more notably, actually saving to pay forcollege (Cabrera & LaNasa, 2000; Hossler et al., 1999). An interesting contra-diction to this finding is that as students come closer to finalizing their decision-making plans, typically in the second half of their final year of high school, theinfluence of counselors and teachers increases, sometimes becoming even moreprominent than that of parents (Helwig, 2004; Hossler et al., 1999). Friends andother family members are also influential in the college decision-makingprocess, though to a notably lesser extent than parents (Hossler et al., 1999).
Given their role in the college application process, it is not surprising thatschool counselors influence students’ decision-making. However, throughoutthe literature, counselors are portrayed simultaneously as being influential andneeding to be more influential in the process (Baker, 2002; Helwig, 2004;Johnson, 2000; Kelpe Kern, 2000; Ketterson & Bluestein, 1997; Mitchell,1975). One area identified as a way in which counselors can be more proactiveis through career planning (Baker, 2002; Lane, 2000; Lapan et al., 2003). Careerplanning has been found to help students develop skills, including self-acceptance,awareness and understanding of work-related concepts, decision-making, andself-development skills (Mitchell, 1975).
Informational resources
In addition to interpersonal influences, potential college students receive infor-mation produced by schools, either intentionally through a direct request orunintentionally as part of a marketing campaign from the school (Cabrera &LaNasa, 2000). The influence of printed college literature on decision-making is mixed. In a longitudinal study following eight students from highschool through their college years, the general consensus was that materialssent from the colleges were not used to come to a decision, though they wereinfluential in confirming a choice (Hossler et al., 1999). Another study specificto viewbook photos found a strong emphasis on the social and relational aspectsof colleges with minimal, if any, reference to more realistic or specific elementssuch as health and safety or religious beliefs. This study also noted that althoughdifferences were found in the emphasis and quantity of photos used by top tierand lower tier schools, the visual images shown were generally similar(Klassen, 2000). Nonetheless, viewbooks remain an instrumental promotional
22 A.M. Pampaloni
tool used by schools to depict both the lifestyle students who attend the schoolcan expect as well as their institution’s values (Anctil, 2008).
The preferred medium of students seeking information about colleges is theInternet (Adams & Eveland, 2007; Anctil, 2008; Ramasubramanian, Gyure, &Mursi, 2002). Students entering college today are among the highest users ofcomputers and online technologies (Day, Janus, & Davis, 2005). Twentypercent of college students began using computers between the ages of fiveand eight; by the time they were 16 to 18 years old all of today’s currentcollege students had begun using computers (Jones, 2002). Further, a 2009report by Pew Internet Project found that 93% of teens between the ages of12–17 use the Internet regularly. The Internet continues to grow as a resourcefor students for seeking information about colleges (Horrigan & Raine, 2006;Mentz & Whiteside, 2003), with 57% of online teenagers saying that theyhave gone online to get information about a college, university, or otherschool they are thinking about attending (Lenhart, Madden, & Hitlin, 2005).
Since current students have had Internet access for their entire lives, it is notsurprising that it is their primary resource for researching colleges and univer-sities (Mentz & Whiteside, 2004). Multiple studies have looked at the increas-ing importance of Web sites to students seeking information about college(Gordona & Berhow, 2009; Kang & Norton, 2006; McAllister-Spooner,2008; Poock & Lefond, 2001; Ramasubramanian, Gyure, & Mursi, 2002).While schools recognize the importance of maintaining an updated, well-orga-nized, and content-appropriate site, there are areas in which they can improvethe information they are providing and how they present it to better meet theexpectations of their technologically savvy audiences (Hegeman, Davies, &Banning, 2007; Kang & Norton, 2006; McAllister & Taylor, 2007). Thistakes on added importance because students are influenced by the reputationand word-of-mouth recommendations of others when making decisions aboutwhich school to pursue (Anctil, 2008; Sung & Yang, 2008), thus collegesand universities must be attentive to the image they portray through their organ-ization’s site.
Several other factors emerge as influential when selecting a college. Whilecertainly not an exhaustive list, five criteria beyond the interpersonal influencesalready noted are identified repeatedly. They are majors/programs offered,reputation, financial issues – specifically costs and availability of aid, extracur-ricular/sporting opportunities, and campus attributes, such as location, setting,and atmosphere (Cabrera & LaNasa, 2000; Coccari & Javalgi, 1995; Comm &LaBay, 1996; Galotti & Mark, 1994; Henrickson, 2002; Hossler et al., 1999;Kelpe Kern, 2000; Letawsky, Schneider, Pedersen, & Palmer, 2003; Mattern& Wyatt, 2009). These factors are consistently identified as influential acrossgender, geography, and socioeconomic groups, suggesting they are highlyrelevant to students during their decision-making process.
It is also important to recognize that potential students may have differentgoals. Many students attend college to prepare for a future career, while
Journal of Marketing for Higher Education 23

others select a specific school because of the opportunities offered, such asfinancial aid or scholarships. Still others may make their choice based on thelocation of the school or specific programs offered. Failing to consider differingaudience goals and to whom the message is directed can impede the recipient’sdecision-making process. For example, a study evaluating the factors that influ-ence athletes to consider attending a university finds that the messages sent hada narrow focus (Letawsky et al., 2003). That is, the messages focused on issuesrelated to athletics and did not address the academic concerns cited by athletesas most important to their decision-making. Of the five reasons cited by partici-pants as factors influencing their college choice, only two were related to ath-letics, and neither was the most frequently identified. Sending an unclear orlimited message may portray an image that is inconsistent with the school’sintent and thus negatively influence potential members.
To make students aware of these and other characteristics that might influencetheir decision-making, schools provide targeted information via their print litera-ture and Web sites. Schools should present a message that is both accurate anddesirable to provide adequate information to allow for informed decision-making. Recognizing this, many schools have adapted their Web sites to show-case specific images and incorporate key features such as online tours andapplications that appeal to students seeking information (Anctil, 2008; Ramasu-bramanian, Gyure, & Mursi, 2002). Regarding the effectiveness of organiz-ational literature, however, students’ perceptions are mixed. This couldindicate a need for organizations to adapt their strategies in using these resourcesto influence potential members. One alternative is for colleges to target distri-bution of organizational literature to coincide with students’ increased searchactivities. This typically occurs during their third year of school during whichtime they focus on external sources of information (Hossler et al., 1999). Forstudents who have indicated an interest in a school, follow-up informationshould be sent early in the beginning of their final year in school since moststudents apply to colleges between October and April of their senior year, with50% of applications sent between November and January (Hossler et al., 1999).
Research questions
This research underscores the intertwined relationship between individuals andorganizations. Understanding the factors that influence decision-making ofpotential members provides a clearer picture of their desired relationship withan organization. Gaining a clearer understanding of what members arelooking for allows for a better match between the student and the school,which could lead to higher retention rates. Likewise a rewarding college experi-ence could result in more satisfied and active alumni as well as increased word-of-mouth promotion for the university. These outcomes benefit both studentsand the school. The primary objective of this research is to identify theresources used by potential members – high school students – when making
24 A.M. Pampaloni

decisions about the colleges and universities to which they will apply. Thefollowing research questions are posed:
(RQ1) What types of interpersonal and informational resources influence thedecision-making process of a potential student to become affiliatedwith an institution of higher education?
(RQ2) What characteristics associated with institutions of higher educationare most consistently desired by new members?
(RQ3) How do institutions of higher education make potential membersaware that they have the characteristics desired by potential members?
Having a greater awareness of the factors that contribute to student decision-making allows schools to focus on those key areas. While schools cannot andshould not attempt to be everything to everyone, recognizing characteristics thatstudents deem as important might help schools address these key factors,thereby providing students with relevant information necessary to informtheir selection process. Doing so may contribute to a more positive organiz-ational image by potential members.
Method
To understand how outsiders view an organization, their direct involvementmust be solicited. This research considered viewpoints of external audiencesby surveying potential organizational members; that is, high school studentsplanning on attending college.
Data collection
Permission to attend an open house to survey potential incoming students wasrequested and granted from seven schools in New Jersey that had participated inrelated research. Permission was requested for the primary researcher and/or anassistant to attend an open house for high school students for the purpose of col-lecting survey data. In exchange for authorizing attendance, each school wasoffered copies of the results upon completion of the study.
Open houses provided an excellent venue for collecting data for severalreasons. Since parents typically accompany students to open houses, consentcould be obtained for the participation of the students who were under theage of 18 years. Also, attendance at an open house suggests a higher level ofinterest and commitment to pursuing affiliation with a college than do morepassive types of research such as reviewing viewbooks or conducting an Inter-net search. As such, these students are likely to be more aware of the character-istics that are important to their decision-making. Likewise, any previousresearch conducted via review of printed materials, a Web search, or interper-sonal contacts informs students of the possible attributes a school might
Journal of Marketing for Higher Education 25

have, which might alert them to the presence of key characteristics that mayaffect their pursuit of a specific characteristic(s) or school. This heightenedawareness made students attending open house events preferred participantsfor the survey.
At each open house, the primary researcher or an assistant approachedstudents who were together with their parents. A brief introduction and over-view of the project was offered, and their participation was requested. Theassent form required a signature from the students to ensure they understoodwhy the survey was being conducted and how the results would be used.Students who were under 18 years of age were given a consent form alongwith the survey and parents were also given a consent form. Students whowere 18 years or older were given only the assent form and survey. Bothconsent forms and assent forms were separated from the surveys at the endof each open house and stored separately to ensure participant anonymity.Students who declined to participate were thanked for their time and leftalone. Parents had the option of requesting a copy of the final results by check-ing a box on the consent form and providing a mailing address. Those whomade such a request were sent a copy of the results.
Instrument
The primary objective of the survey (Appendix 1) was to identify theresources that influence high school students when making decisions aboutapplying to colleges or universities. Four open-ended questions requestedthat students identify specific desirable qualities or characteristics theysought in schools. In addition, students were asked to select responses froma series of 7-point Likert scale questions, with 1 being ‘strongly disagree’and 7 being ‘strongly agree,’ that listed various institutional characteristics,interpersonal sources, and informational resources that might influence theirdecision-making in this context. Demographic data about the students’ highschool, their accessibility to computers, and their attendance at college openhouses was also requested. Additional open-ended questions positioned afterthe Likert-scale questions offered students the opportunity to add informationthat was not included on the survey (e.g., ‘Is there something else you look forin a school that is not on the list?’). A total of 249 surveys were collected.Although not all surveys were completed entirely, either the open-ended orthe Likert-type questions were answered on every survey, making them allusable in some form.
Open-ended questions
Four open-ended questions solicited information about characteristics ofschools that students sought when making decisions about applying or attend-ing. Two respondents did not complete any of the open-ended questions.
26 A.M. Pampaloni
In some cases one or more open-ended questions were not answered (Q1: n ¼4; Q2: n ¼ 17; Q3: n ¼ 18; Q4: n ¼8). Open-ended questions allow for a richerdescription than is afforded by limited response choices and also allows theopportunity for respondents to include or expand on the selection criteria thatthey deem as important in the school selection process. Students were askedto write answers to the following questions:
(1) What are three things that would make you choose a certain college?(2) How do colleges let you know that they are the kind of school that you
want to go to?(3) Realistically, what school (or what kind of school) do you think you will
attend and why?(4) Please finish this sentence: ‘When I finally select a college to attend it
will be because ________________.’
As suggested by previously cited research (Bergerson, 2009; Cabrera & LaNasa,2000; Galotti and Mark, 1994; Henrickson, 2002; Hossler et al., 1999; KelpeKern, 2000; Letawsky et al., 2003; Rowan-Kenyon, Bell, & Perna, 2008), stu-dents consider multiple characteristics when applying to a college. Thus it isworthwhile to consider the influence of these characteristics on the decision-making process. The intent of the open-ended questions was to solicit specificinformation from students to isolate unique or common characteristics thatmay be more influential than others. To better understand the influence ofthese emergent characteristics, it was decided that the results of the open-ended questions would serve as dependent variables for the data analyses. Thefirst dependent variable (DV1) would be represented by the number of distinct,nonrepeated decision criteria stated by respondents across all four open-endedquestions. The second (DV2) and third dependent (DV3) variables would bedetermined by the responses provided to the third and fourth open-endedquestions, respectively, as these questions best encapsulate the desired decisionoutcomes of the participants.
Likert-scale items
The Likert-scale items represented the independent variables and were presentedin two sections. The first set of items included institutional characteristics thatstudents might seek when deciding to apply to a school. Responses include aca-demic programs, athletics, commuter versus dorm school, cost, faculty, family orfriend who had attended, availability of aid, organizations, housing, internships,location, religious affiliation, reputation, safety school, size, social life, and studyabroad programs. The second set of responses identified sources of informationthat might be influential to students. The responses in this category cite bothinterpersonal and informational sources. Interpersonal sources include clergy,family member or friend, recruiters, teachers, interviews, campus tours, and
Journal of Marketing for Higher Education 27

college fairs. Informational sources include Web sites, magazine rankings,college guides, materials sent by schools, and materials requested by students.Research suggests the influence of printed materials on students is limited(Anctil, 2008; Galotti, 2000; Hossler et al., 1999). This study will attempt tobetter determine if and how informational sources are used by students.
A pilot test was conducted to confirm the clarity of the open-ended questionsand to determine if additional characteristics would be suggested by respon-dents. Undergraduate students from two communication courses at a large,mid-Atlantic university were offered extra credit to complete the survey. Allstudents participated, and 41 surveys were collected. The responses providedwere in line with the expectations for the listed questions, and no new charac-teristics were suggested, thus the survey was considered valid.
Data analysis
Open-ended questions
Responses to each of the four questions were transcribed and entered into anExcel spreadsheet to help organize and sort responses. The four questionsyielded more than 1800 responses. Multiple responses to an individual questionwere often provided. In such cases each response was treated as a separateanswer. For example, if a student answered that cost and location werefactors that would influence his or her decision to attend a school, bothresponses (cost and location) were coded individually.
Since the questions sought different types of responses and respondentsoften provided multiple answers, a broad range of categories was defined.The primary researcher reviewed all responses and used an open-codingsystem to create a preliminary coding scheme consisting of 23 categories. Asis typical of this methodology, the number of categories (Appendix 2) were col-lapsed to a total of 15 through regrouping and consolidation (Lindlof & Taylor,2002; Strauss & Corbin, 1998).
The primary researcher and three coders, one undergraduate and two gradu-ate students, analyzed a random sample of 20% of the completed surveys (n ¼50) to validate the coding categories. A coding sheet created by the primaryresearcher was provided to the three other coders and the categories explained.Although the primary coder had developed the coding sheet, her participation inthe coding session was deemed appropriate because as a result of the sortingprocess all responses had been grouped alphabetically rather than by respon-dent. This process, combined with the sheer volume of data, made it virtuallyimpossible to link any individual responses back to a specific survey. Thus,although she had greater knowledge of the coding categories, her role incoding the survey data was comparable to that of the other coders.
A pretest was given to the three coders to ensure a common understanding ofthe categories. Representative examples taken from the completed surveys were
28 A.M. Pampaloni
listed and the coders were asked to independently identify the category they feltbest described the response. All three coders provided responses identical tothose of the primary researcher. After reviewing the pretest, all four coders inde-pendently coded the 50 surveys. Intercoder reliability was computed basedon the number of times identical responses were provided among the coders.Cronbach’s alpha was .97 (range ¼ .961–.975; M ¼ 1.8; SD ¼ 1.04).
A limited number of responses were provided to the three additional open-ended questions; those comments were consolidated by the primary researcherand collectively discussed by all four coders rather than independently coded. Aresponse that matched one of the characteristics included among the Likert-scale choices was coded accordingly. All remaining responses were reviewedand categorized using one of the coding categories that resulted from analysisof the four open-ended questions.
Likert-scale items
A multiple methods approach using quantitative analyses of data was employed.In coding the responses to the open-ended questions, several write-in responsesmatched characteristics that were included in the Likert-scales. Where dupli-cation existed between write-in responses and the Likert-scale responses, bivari-ate correlation procedures were performed. A Pearson’s correlation coefficientwas determined using pairwise-exclusion and a two-tailed test of significance.Correlations indicate the degree of the relationship between two variables. Inthis case, correlations were run between responses to the open-ended questionsand the Likert-scale choices to determine if the responses were consistent. Forexample, a student might write in programs, cost, and atmosphere as reasonsfor choosing a school. The first two responses, programs and cost, are listedamong the Likert-scale choices. Thus it is reasonable to expect that a studentwho provided such responses would give a high ranking to the identicalLikert-scale choices, suggesting greater consistency of responses.
Descriptive statistics and multiple regression analyses were also calculatedfor the Likert-scale questions. Multiple regression analysis was used to evaluatethe Likert-scale responses. This method is used to predict a relationshipbetween a dependent variable and multiple independent variables. Within thisstudy it provided a better understanding of the relationship between influenceson students’ college decision-making and the resources they seek. Multipleregression also explains the relative degree to which a series of variables con-tribute to the multiple prediction of a variable (Williams & Monge, 2001). Anexploratory analysis was conducted to test the influence of the independent vari-ables (the Likert-scale items) on three separate dependent variables. As noted,dependent variable 1 (DV1) was represented by the number of distinct decision-making criteria employed by students. DV2 represented a specific school ortype of school a student would like to attend. DV3 reflected the more intangibleaspects of the school to which students were drawn, frequently described as the
Journal of Marketing for Higher Education 29
‘environment’ or ‘feel’ of the school. The most frequently cited responses to thethird and fourth open-ended questions from the survey were used to determinethese variables. Because these responses were unique from the Likert-scaleresponses, their distinctiveness from the independent variables confirmedtheir validity as dependent variables.
In total, the multiple methodologies allow for more comprehensive analysesof the data. Using different tests allows for both exploration and confirmation ofthe findings. In addition, because all methodologies have weaknesses, usingmultiple methods can offer clarity and complimentarity of the analysis,thereby avoiding any limitations that may be inherent in a given method.
Results
The surveys considered the views of potential members – first time students –as critical to the organizational image. A multi-method approach was used toanalyze survey data in response to the research questions that look at theschool characteristics and the interpersonal and informational resources thatinfluence students in their decision-making process.
Descriptive statistics
Demographic information related to the college selection process was requestedof participants. The majority of students (N ¼ 227) were White (71.4%, n ¼162). Other ethnic groups included Asian Americans/Pacific Islanders (9.6%,n ¼ 24), Hispanics/Latin Americans (8.8%, n ¼ 20), African Americans/Black (4.4%, n ¼ 10), and Native American/American Indian (0.4%, n ¼ 1).Although this distribution is slightly skewed based on national trends (USDepartment of Education, 2005; US Department of Labor, 2000), it supportsmore recent studies that report increased enrollments among racially diversepopulations, particularly Hispanic and Asian American (Anderson, 2003). Allrespondents reported ‘a lot’ (93.4%) or ‘some’ (6.6%) computer access, andall but one respondent had a computer at home.
The majority of respondents (N ¼ 224) were high school seniors (75%, n ¼168). Participants were from both public (87.5%, n ¼ 196) and private (12.5%,n ¼ 28) high schools, primarily from New Jersey (87.3%, n ¼ 185) as well assurrounding states (NY: 4.7%, n ¼ 10; PA: 4.2%, n ¼ 9; CT: 1.9%, n ¼ 4;New England area: 1.4%, n ¼ 3).
The majority of respondents began planning to attend college between oneand two years prior to taking the survey (56.7%, n ¼ 105). The majority of par-ticipants were beginning their high school senior year when they completed thesurvey suggests that planning began between their sophomore and senior year.This is in line with other research that finds that students increase their schoolsearch activity in their junior year of high school (Hossler et al., 1999).Additionally, participants had visited between one and 15 colleges, with a
30 A.M. Pampaloni

mean of 3.32 (SD ¼ 2.38) schools each. Demographic characteristics are sum-marized in Table 1.
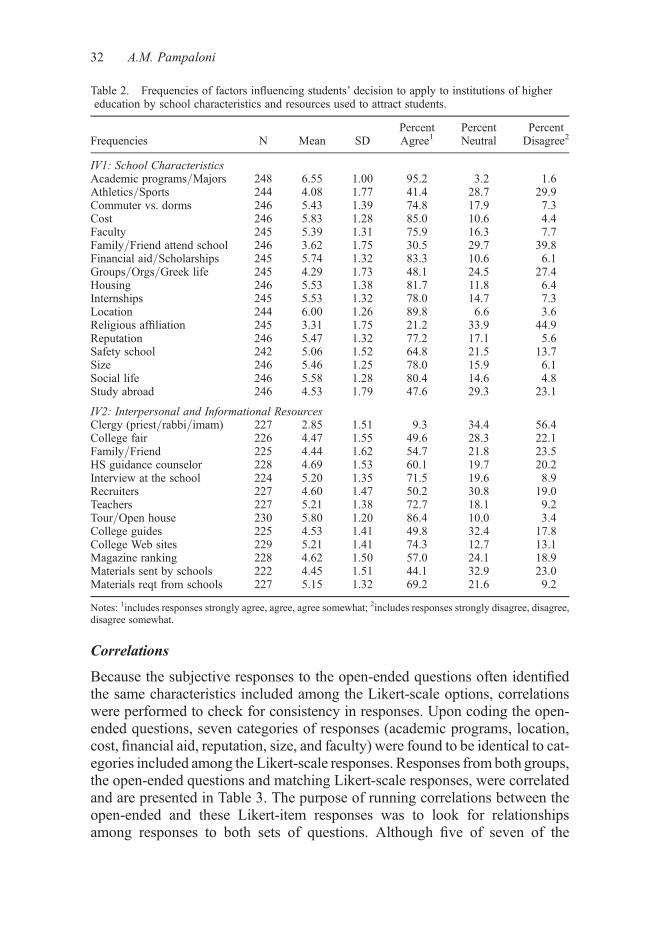
Descriptive statistics were performed on the seven-point Likert-scale items.The institutional characteristics most frequently cited by students as influentialto their decision-making were in line with previous research. The characteristicswere academic programs (95%, M ¼ 6.55, SD ¼ 1.00), location (90%, M ¼6.00, SD ¼ 1.26), and cost (85%, M ¼ 5.83, SD ¼ 1.28). The least influentialwere religious affiliation (21%, M ¼ 3.31, SD ¼ 1.75), family or friendattended the school (31%, M ¼ 3.62, SD ¼ 1.75), and athletics (41%, M ¼4.08, SD ¼ 1.77).
Responses to the interpersonal and informational resources used to attractnew students were not as strong. The most influential interpersonal sourceswere tours/open house (86%, M ¼ 5.80, SD ¼ 1.20), teachers (73%, M ¼5.21, SD ¼ 1.38), and interviews at the school (72%, M ¼ 5.20, SD ¼1.35). The least influential interpersonal sources were clergy (9%, M ¼ 2.85,SD ¼ 1.51), family/friends (55%, M ¼ 4.44, SD ¼ 1.62), and college fairs(50%, M ¼ 4.47, SD ¼ 1.55). The most influential informational resourceswere college Web sites (74%, M ¼ 5.21, SD ¼ 1.41), materials requestedfrom schools (69%, M ¼ 5.15, SD ¼ 1.32), and magazine rankings (57%, M¼ 4.62, SD ¼ 1.50). College guides (50%, M ¼ 4.53, SD ¼ 1.41) and unsoli-cited materials sent by schools (44%, M ¼ 4.45, SD ¼ 1.51) were at the lowerend of the informational resources used. Table 2 displays frequencies, percen-tages, and measures of central tendency for these variables.
Table 1. Demographic characteristics of students applying to institutions of higher education.
Variable N Responses
Public PrivatePublic vs. private HS 224 87.5 12.5
Family Student NoneComputer ownership 229 59 40.6 0.4
A lot Some NoneComputer access 227 93.4 6.6
1–3 4–6 7–9 10 +Number of colleges visited 225 64.4 26.7 5.3 3.4
Senior Junior Soph Non-HSYear in HS 224 75 21 1.3 2.7
NJ NY PA CT OtherState HS located 212 87.3 4.7 4.2 1.9 1.9
Other NJMiddlesex Bergen Monmouth county Non-NJ
County HS located 193 14.5 10.9 8.3 53.9 12.4Asian Am.
Pacific Hispanic/ AfricanWhite Islander Latino American Other
Ethnicity 227 71.4 10.6 8.8 4.4 4.8
Note: HS ¼ high school.
Journal of Marketing for Higher Education 31
Correlations
Because the subjective responses to the open-ended questions often identifiedthe same characteristics included among the Likert-scale options, correlationswere performed to check for consistency in responses. Upon coding the open-ended questions, seven categories of responses (academic programs, location,cost, financial aid, reputation, size, and faculty) were found to be identical to cat-egories included among the Likert-scale responses. Responses from both groups,the open-ended questions and matching Likert-scale responses, were correlatedand are presented in Table 3. The purpose of running correlations between theopen-ended and these Likert-item responses was to look for relationshipsamong responses to both sets of questions. Although five of seven of the
Table 2. Frequencies of factors influencing students’ decision to apply to institutions of highereducation by school characteristics and resources used to attract students.
Percent Percent PercentFrequencies N Mean SD Agree1 Neutral Disagree2
IV1: School CharacteristicsAcademic programs/Majors 248 6.55 1.00 95.2 3.2 1.6Athletics/Sports 244 4.08 1.77 41.4 28.7 29.9Commuter vs. dorms 246 5.43 1.39 74.8 17.9 7.3Cost 246 5.83 1.28 85.0 10.6 4.4Faculty 245 5.39 1.31 75.9 16.3 7.7Family/Friend attend school 246 3.62 1.75 30.5 29.7 39.8Financial aid/Scholarships 245 5.74 1.32 83.3 10.6 6.1Groups/Orgs/Greek life 245 4.29 1.73 48.1 24.5 27.4Housing 246 5.53 1.38 81.7 11.8 6.4Internships 245 5.53 1.32 78.0 14.7 7.3Location 244 6.00 1.26 89.8 6.6 3.6Religious affiliation 245 3.31 1.75 21.2 33.9 44.9Reputation 246 5.47 1.32 77.2 17.1 5.6Safety school 242 5.06 1.52 64.8 21.5 13.7Size 246 5.46 1.25 78.0 15.9 6.1Social life 246 5.58 1.28 80.4 14.6 4.8Study abroad 246 4.53 1.79 47.6 29.3 23.1
IV2: Interpersonal and Informational ResourcesClergy (priest/rabbi/imam) 227 2.85 1.51 9.3 34.4 56.4College fair 226 4.47 1.55 49.6 28.3 22.1Family/Friend 225 4.44 1.62 54.7 21.8 23.5HS guidance counselor 228 4.69 1.53 60.1 19.7 20.2Interview at the school 224 5.20 1.35 71.5 19.6 8.9Recruiters 227 4.60 1.47 50.2 30.8 19.0Teachers 227 5.21 1.38 72.7 18.1 9.2Tour/Open house 230 5.80 1.20 86.4 10.0 3.4College guides 225 4.53 1.41 49.8 32.4 17.8College Web sites 229 5.21 1.41 74.3 12.7 13.1Magazine ranking 228 4.62 1.50 57.0 24.1 18.9Materials sent by schools 222 4.45 1.51 44.1 32.9 23.0Materials reqt from schools 227 5.15 1.32 69.2 21.6 9.2
Notes: 1includes responses strongly agree, agree, agree somewhat; 2includes responses strongly disagree, disagree,disagree somewhat.
32 A.M. Pampaloni
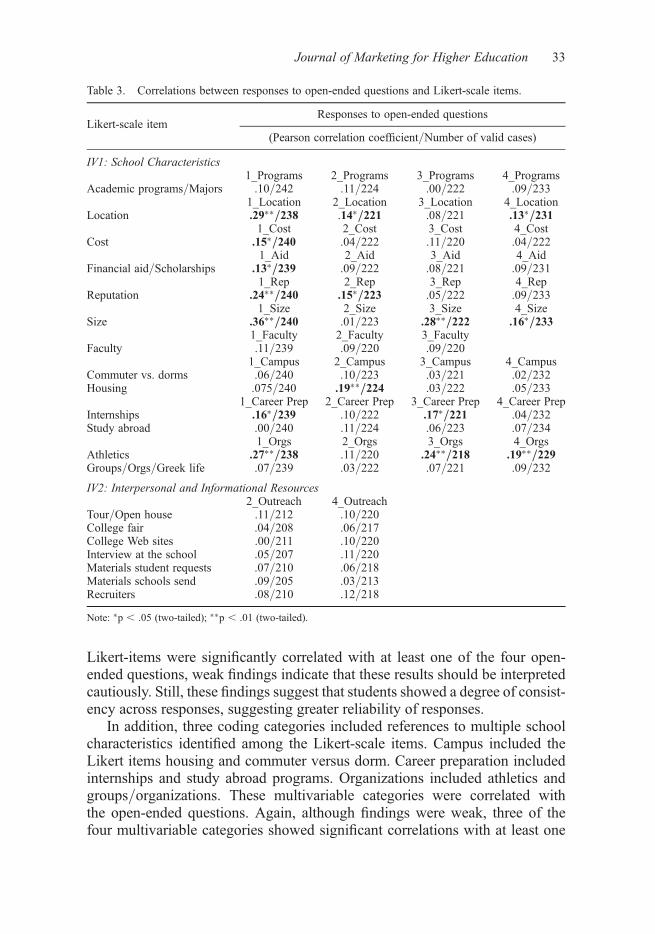
Likert-items were significantly correlated with at least one of the four open-ended questions, weak findings indicate that these results should be interpretedcautiously. Still, these findings suggest that students showed a degree of consist-ency across responses, suggesting greater reliability of responses.
In addition, three coding categories included references to multiple schoolcharacteristics identified among the Likert-scale items. Campus included theLikert items housing and commuter versus dorm. Career preparation includedinternships and study abroad programs. Organizations included athletics andgroups/organizations. These multivariable categories were correlated withthe open-ended questions. Again, although findings were weak, three of thefour multivariable categories showed significant correlations with at least one
Table 3. Correlations between responses to open-ended questions and Likert-scale items.
Likert-scale itemResponses to open-ended questions
(Pearson correlation coefficient/Number of valid cases)
IV1: School Characteristics1_Programs 2_Programs 3_Programs 4_Programs
Academic programs/Majors .10/242 .11/224 .00/222 .09/2331_Location 2_Location 3_Location 4_Location
Location .29∗∗/238 .14∗/221 .08/221 .13∗/2311_Cost 2_Cost 3_Cost 4_Cost
Cost .15∗/240 .04/222 .11/220 .04/2221_Aid 2_Aid 3_Aid 4_Aid
Financial aid/Scholarships .13∗/239 .09/222 .08/221 .09/2311_Rep 2_Rep 3_Rep 4_Rep
Reputation .24∗∗/240 .15∗/223 .05/222 .09/2331_Size 2_Size 3_Size 4_Size
Size .36∗∗/240 .01/223 .28∗∗/222 .16∗/2331_Faculty 2_Faculty 3_Faculty
Faculty .11/239 .09/220 .09/2201_Campus 2_Campus 3_Campus 4_Campus
Commuter vs. dorms .06/240 .10/223 .03/221 .02/232Housing .075/240 .19∗∗/224 .03/222 .05/233
1_Career Prep 2_Career Prep 3_Career Prep 4_Career PrepInternships .16∗/239 .10/222 .17∗/221 .04/232Study abroad .00/240 .11/224 .06/223 .07/234
1_Orgs 2_Orgs 3_Orgs 4_OrgsAthletics .27∗∗/238 .11/220 .24∗∗/218 .19∗∗/229Groups/Orgs/Greek life .07/239 .03/222 .07/221 .09/232
IV2: Interpersonal and Informational Resources2_Outreach 4_Outreach
Tour/Open house .11/212 .10/220College fair .04/208 .06/217College Web sites .00/211 .10/220Interview at the school .05/207 .11/220Materials student requests .07/210 .06/218Materials schools send .09/205 .03/213Recruiters .08/210 .12/218
Note: ∗p , .05 (two-tailed); ∗∗p , .01 (two-tailed).
Journal of Marketing for Higher Education 33
of the four open-ended questions, further suggesting that students showed adegree of consistency across responses.
Multiple regression analysis
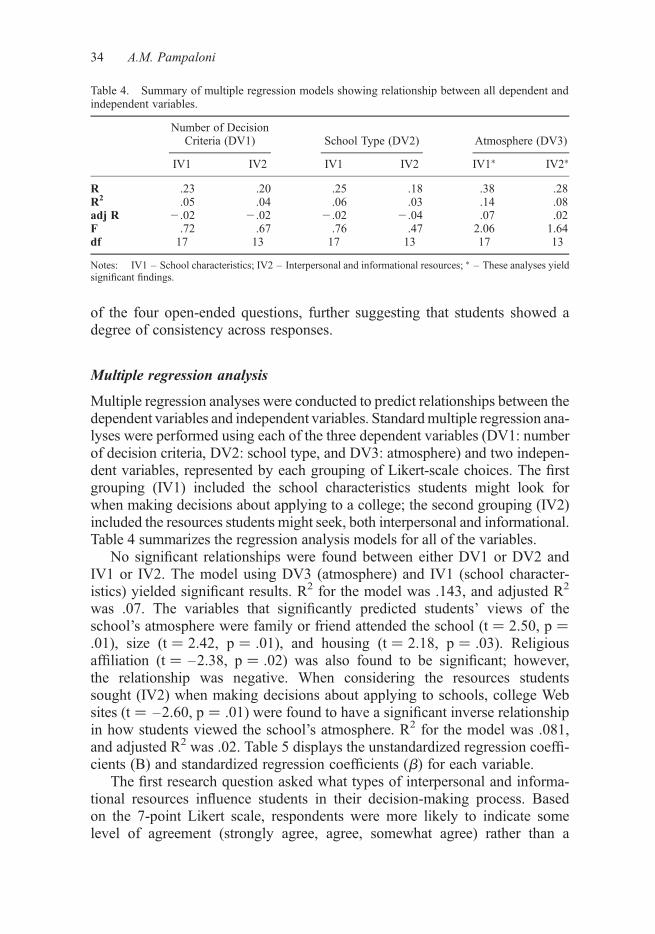
Multiple regression analyses were conducted to predict relationships between thedependent variables and independent variables. Standard multiple regression ana-lyses were performed using each of the three dependent variables (DV1: numberof decision criteria, DV2: school type, and DV3: atmosphere) and two indepen-dent variables, represented by each grouping of Likert-scale choices. The firstgrouping (IV1) included the school characteristics students might look forwhen making decisions about applying to a college; the second grouping (IV2)included the resources students might seek, both interpersonal and informational.Table 4 summarizes the regression analysis models for all of the variables.
No significant relationships were found between either DV1 or DV2 andIV1 or IV2. The model using DV3 (atmosphere) and IV1 (school character-istics) yielded significant results. R2 for the model was .143, and adjusted R2
was .07. The variables that significantly predicted students’ views of theschool’s atmosphere were family or friend attended the school (t ¼ 2.50, p ¼.01), size (t ¼ 2.42, p ¼ .01), and housing (t ¼ 2.18, p ¼ .03). Religiousaffiliation (t ¼ –2.38, p ¼ .02) was also found to be significant; however,the relationship was negative. When considering the resources studentssought (IV2) when making decisions about applying to schools, college Websites (t ¼ –2.60, p ¼ .01) were found to have a significant inverse relationshipin how students viewed the school’s atmosphere. R2 for the model was .081,and adjusted R2 was .02. Table 5 displays the unstandardized regression coeffi-cients (B) and standardized regression coefficients (b) for each variable.
The first research question asked what types of interpersonal and informa-tional resources influence students in their decision-making process. Basedon the 7-point Likert scale, respondents were more likely to indicate somelevel of agreement (strongly agree, agree, somewhat agree) rather than a
Table 4. Summary of multiple regression models showing relationship between all dependent andindependent variables.
Number of DecisionCriteria (DV1) School Type (DV2) Atmosphere (DV3)
IV1 IV2 IV1 IV2 IV1∗ IV2∗
R .23 .20 .25 .18 .38 .28R2 .05 .04 .06 .03 .14 .08adj R 2.02 2.02 2.02 2.04 .07 .02F .72 .67 .76 .47 2.06 1.64df 17 13 17 13 17 13
Notes: IV1 – School characteristics; IV2 – Interpersonal and informational resources; ∗ – These analyses yieldsignificant findings.
34 A.M. Pampaloni

level of disagreement (strongly disagree, disagree, somewhat disagree) thatinterpersonal sources had some influence on their decision to apply to acollege. These included campus tours/open houses (M ¼ 5.80, SD ¼ 1.20),teachers (M ¼ 5.21, SD ¼ 1.39), interviews at the school (M ¼ 5.20, SD ¼1.35), high school guidance counselors (M ¼ 4.69, SD ¼ 1.53), recruiters(M ¼ 4.60, SD ¼ 1.47), college fairs (M ¼ 4.47, SD ¼ 1.55), and familymembers/friends (M ¼ 4.44, SD ¼1.62). The sole exception in this categorywas clergy (M ¼ 2.85, SD ¼ 1.51). The average of the means of thesescores (M ¼ 4.66) suggests neutrality to weak agreement that interpersonalresources influence students’ decision to apply to a school. It appears interper-sonal sources physically located at colleges are most influential, as indicated byhigher frequencies for open houses and interviews at the school.
Table 5. Summary of regression analysis for variables predicting that school characteristics andinterpersonal/informational resources will influence students’ view of atmosphere.
Variables B SE B b
IV1: School CharacteristicsAcademic programs/Majors 2.73E-02 .04 .06Athletics 3.14E-02 .02 .11Commuter vs. dorms –1.76E-02 .03 2.05Cost –2.11E-02 .03 2.06Faculty 2.30E-04 .03 .00Family/Friend attend school 5.21E-02 .02 .19∗
Financial aid/Scholarships –6.61E-03 .03 2.02Groups/Organizations/Greek life 1.37E-03 .02 .01Housing 6.07E-02 .03 .17∗
Internships –2.26E-02 .03 2.06Location –1.35E-02 .03 2.04Religious affiliation –5.27E-02 .02 2.19∗
Reputation –4.07E-02 .03 2.11Safety school –5.07E-02 .03 2.16Size 7.32E-02 .03 .19∗
Social life –2.77E-02 .03 2.07Study abroad –6.82E-03 .02 2.03
IV2: Interpersonal and Informational ResourcesTour/Open house 1.23E-02 .03 .03Clergy (priest/rabbi/imam) –4.42E-02 .03 2.14College fair 2.26E-02 .03 .07College guides 2.35E-02 .03 .07College Web sites –7.75E-02 .03 -.22∗∗
Family/friend 1.16E-02 .03 .04HS guidance counselor 4.69E-02 .03 .15Interview at the school 1.88E-02 .03 .05Magazine ranking 3.30E-02 .03 .10Materials students request 1.51E-02 .03 .04Materials schools send –4.91E-02 .03 2.15Recruiters 2.17E-02 .03 .07Teachers –6.20E-02 .03 2.17
Note: ∗p , .05; ∗∗p , .01; HS ¼ high school.
Journal of Marketing for Higher Education 35

Responses to the open-ended questions yielded mixed results regarding theinfluence of interpersonal sources. For example, although faculty was identifiedas a reason why a student would select a school, only 2.57% of respondents ident-ified it specifically. The campus category was identified by 13.93% of respondentsand included references to staff, students, and people at the school, among othercharacteristics. However, individual characteristics were not analyzed separatelyto determine to what degree they contributed to the overall category. Another cat-egory, outreach, was comprised of multiple interpersonal and informationalsources and was frequently identified (70.2%). As with the campus category,however, the degree to which individual interpersonal or informational resourcescontributed to the overall results was not determined.
The survey also allowed for write-in responses to explicate the Likert scales.Twenty-seven respondents provided comments. After eliminating responsesthat duplicated the Likert-scale choices, comments referencing interpersonalinfluences included coaches (n ¼ 2), alumni (n ¼ 1), other people whoattended or visited the school (n ¼ 3), word of mouth (n ¼ 1), peers (n ¼ 1),and phone calls (n ¼ 1). In summary, although several interpersonal sourceswere cited, their effect appears limited.
Similar levels of agreement were found among the informational resources:materials requested from schools (M ¼ 5.15, SD ¼ 1.32), magazine rankings(M ¼ 4.62, SD ¼ 1.50), college guides (M ¼ 4.53, SD ¼ 1.41), and unsoli-cited materials sent by schools (M ¼ 4.45, SD ¼ 1.51). Although the multipleregression analysis found college Web sites to have a negative influence, thefrequency with which the category was identified by students as influential(M ¼ 5.21, SD ¼ 1.41) indicates mixed results. A possible explanation forthis could be confusion about the category. Although the Likert-scale itemwas labeled as ‘college Web sites,’ some students may have considered othercollege-related Web sites to be included, such as collegeboard.com. The fre-quency with which this was included in the write-in responses suggests thatit is a notable resource among this group.
Additional resources identified through the open-ended questions includedonline sources, information packets, catalogs, mailed information, advertising,and other materials used by colleges to solicit new members. As noted,however, these responses were combined with multiple other responses, thusthe individual influence of these specific resources was not calculated. Amongthe write-in answers, electronic sources were most frequently identified (n ¼10), including six responses that cited a specific Web site (collegeboard.com)as an additional resource. Similar to the interpersonal sources, the average ofthe informational resources scores (M ¼ 4.79) likewise suggested neutralityto weak agreement regarding the influence of informational resources on stu-dents’ decision to apply to a school.
School characteristics (IV1) were rated higher than the interpersonal andinformational resources (IV2) used by students to make their decisions toapply. Thus in response to RQ2, size, housing, and knowing a family member
36 A.M. Pampaloni

or friend who attended the school influenced prospective students. Additionally,the frequency with which respondents identified programs offered (M ¼ 6.55,SD ¼ .99) and location (M ¼ 6.00, SD ¼ 1.26) indicate that they likewise influ-ence student decision-making. Five other areas had mean scores of over 5.5,suggesting higher levels of agreement than neutrality. Those areas were cost(M ¼ 5.83, SD ¼ 1.28), financial aid/scholarships (M ¼ 5.74, SD ¼ 1.32),social life (M ¼ 5.58, SD ¼ 1.28), housing (M ¼ 5.53, SD ¼ 1.38), andinternships (M ¼ 5.53, SD ¼ 1.32). This broad range of characteristics citedby students suggests that schools should be comprehensive in addressingmultiple aspects of their image when appealing to potential members.
Various means were used to make potential members aware that schools haddesired characteristics (RQ3). As noted, the outreach category that emergedfrom the coding of the second open-ended question accounted for the majorityof the responses (70.2%) and reflected multiple practices through which stu-dents were made aware of the characteristics they desired. Among othersthese included tours, open houses, campus visits, marketing via mail and theInternet, presentations, publications, and word of mouth. Among the Likert-scale responses, tours/open house ranked highest among interpersonalresources and third overall among all variables in frequency (86.5%, M ¼5.8, SD ¼ 1.20), suggesting that visiting the school in person is an importantmeans through which students gather information.
In summary, these analyses found that characteristics directly associatedwith schools, such as programs, location, cost, tours/open house, and others,were most influential to students when making decisions about colleges.Both the Likert-item and open-ended responses supported these findings.This was perhaps best supported by the number of students (60%) who indepen-dently stated that a school’s atmosphere or environment, that is something theyfound desirable when visiting the campus, would be the determining factor intheir decision to pursue a college. This suggests that potential students seekboth concrete and abstract qualities about a school when making decisionsabout whether or not to affiliate (RQ2).
Both interpersonal and informational resources were found to be influen-tial in students’ decision-making as well (RQ1). Interpersonal sources influ-enced potential members, though to a lesser degree overall than did schoolcharacteristics. Tours/open houses, teachers, and interviews at the schoolwere the most influential characteristics in this category. Informationalresources, such as materials requested by potential members, were somewhatinfluential. Other informational resources that influenced potential studentsincluded third-party sources such as college guides or magazine rankings.These sources were also among the means used by schools to make studentsaware of the characteristics they possessed (RQ3). Outreach by schools,including both interpersonal and informational efforts, was cited by 70% ofstudents responding to a question asking why they would attend a certaincollege. This suggests that efforts made by schools are both necessary as
Journal of Marketing for Higher Education 37
well as instrumental in influencing a student’s ultimate decision on whether toapply to a school.
Discussion
As organizations, including institutions of higher education, and their member-ship continue to evolve, scholars must likewise reconsider how we think aboutthem (Cheney & Christensen, 2001; Gioia et al., 2000). This study attempts tocontribute to our understanding of the characteristics of organizational imagethat influence the decision-making of potential members. First, similaritiesamong characteristics of college-seeking students are reviewed. Next, theimportance of direct contact with a school is noted. Finally, the influence ofspecific attributes, including institutional characteristics, interpersonalsources, and informational resources as well as intangible factors are discussed.
Consistency of members
Perhaps the most consistent finding of this study is that college-bound studentsare a uniform group. Regardless of demographic factors, no specific type ofstudent emerged from these analyses. Although a few institutional character-istics were more significant to students overall, most students indicated somelevel of interest about a wide range of school attributes. It appears thatgaining information about multiple aspects about colleges is an integral partof their decision-making process. Attempting to fulfill the need for knowledgeabout such a broad range of concerns could complicate an already stressfuldecision-making period for the student. Indeed, students who commented onthe decision-making process noted that it was ‘a long, tedious, stressful pro-cedure’ and the ‘hardest and most stressful process.’ Given the magnitude ofthe decision and the potential long-term benefits and risks (Anctil, 2008;Moogan, Baron, & Harris, 1999), there is little wonder that the process canbe overwhelming. From the school’s perspective, adequately and effectivelyaddressing the many and diverse concerns of potential members adds to the dif-ficulty of creating a unified image. To benefit both groups, schools would dowell to be comprehensive in addressing their multiple attributes. Providing atleast a thumbnail view on a variety of topics allows schools to highlight keyareas that both address student concerns and offer insights into the school.For the student, coverage of a broad range of topics might help fill informationalgaps, thereby providing the necessary resources for making a decision.
Seeing is believing
One way students narrowed their college choices was to visit schools person-ally. Students’ perceptions after physically visiting a school weighed heavilyin the decision-making process. As one respondent said students wanted a
38 A.M. Pampaloni
sense of what the school represents, literally and symbolically, more so thanhearing what others have to say about it. Students identified open houses ortours (86%) as the third most influential factor in their decision-makingprocess, after programs and location. Students believe that at ‘open housesyou can tell a lot of things’ about the school and they allow students to ‘seethe school for [their] own eyes.’ They also found that visiting campusesallowed them to see ‘the way [schools] present themselves’ and helped the stu-dents to answer questions such as ‘Am I welcome? Would I fit in?’ Open housesoffer multiple opportunities for schools to communicate a positive image(Fischbach, 2006). Interviews at the school (72%) were also considered impor-tant to many students. Students use open houses and on-site visits to determineif a school is one they want – or do not want – to attend (Anctil, 2008;McAllister-Spooner, 2008; McAllister & Taylor, 2007; Moogan et al., 1999).For many, seeing a school firsthand provides them with the information theyfeel they need to make a decision about a school. As summarized by a student’sresponse, ‘Visiting a college tells me more than most pamphlets or bookletscould ever tell me.’
Due to time and financial restraints it may be difficult for students (andparents) to visit each of the schools to which they would like to apply. Thismay contribute to the reason why the majority of students (88.2% nationwide)remain in state to attend college (US Department of Education, 2000).Advances in technologies that provide more detailed graphic representationsof the physical attributes of the school may be an option for schools thatwould like to encourage out-of-state enrollment. Still, schools should bemindful that personally seeing and experiencing the campus, including physicalas well as academic and social aspects, influences many aspects of studentdecision-making. Frequent evaluation of open house programs should be under-taken by schools to ensure they offer appropriate opportunities for potentialmembers to experience many different aspects of the campus and its offerings.Presenting a desirable image to potential members can also serve as an initialstep to anticipatory socialization (Jablin, 1987). Thus open houses offer a poten-tial benefit to schools because socialization experiences influence informationand feedback-seeking behaviors (Mignerey, Rubin, & Gorden, 1995). For stu-dents deciding among several options, a positive campus experience can lead tocontinued contact with the school and perhaps future enrollment.
Institutional aspects versus secondary sources of information
As noted, characteristics associated with schools appeared more influential thandid the sources of information. However, both interpersonal and informationalsources contributed to the decision-making process. Students were more likelyto respond to information they found on their own, through Web sites (74%) ormaterials that they requested (69%) rather than material that was arbitrarily sentto them (44%). This was reinforced by responses to a write-in question asking
Journal of Marketing for Higher Education 39

about additional resources used to gather information about college. Of the 13responses (43%) that identified informational sources, the majority (12)reflected efforts they had undertaken through use of the Internet or use ofcollege guides. This supports research that found materials sent by schoolshave little influence on students’ college selection process (Hossler et al.,1999). The level of effort put forth by potential members suggests a willingnessand desire to gain a comprehensive overview of several schools in order to bewell-informed in their decision-making. This, again, reinforces the potentialbenefit to schools in hosting open house events to both showcase the physicalattributes of their campus and to address the students’ many concerns.
Of the three overarching categories – school characteristics, informationalresources, and interpersonal sources – the latter category was least influentialoverall. Indeed the category receiving the lowest ranking overall by a distinctmargin (9.3%) was an interpersonal source (clergy). Among other interpersonalsources, this study found that teachers were most influential. While this sup-ports some previous research (Helwig, 2004; Moogan et al., 1999), it contra-dicts a preponderance of research that suggests that parents are mostinfluential (Cabrera & LaNasa, 2000; Hossler et al., 1999; Ketterson & Blue-stein, 1997; Otto, 2000; Paulsen, 1990; Sachs, 2002; Scott & Daniel, 2001).A possible explanation for this is that parents were not identified as a separatesurvey item. Instead, a broader category labeled ‘family member/friend’ wasoffered. Separating these categories or identifying parents as an option distinctfrom other family members may have yielded different results. Another con-sideration is that parents’ ideas and expectations about what schools theirchild should attend can cause stress for their children, as does the influencethey hold over them (Broekemier & Hodge, 2008).
Beyond those who are well-known to students such as parents and teachers,respondents also noted the influence of people affiliated with the schools thatthey visited. Prospective students indicated that ‘the people already there’and the ‘students who either went here or are still here’ let them know thatthe school may be somewhere they might attend. This supports the findingsof Capraro, Patrick, and Wilson (2004) whose study on social life at collegesindicates that there is a positive relationship between attractiveness of sociallife at a school, which includes ‘people that you’d fit in with’ or ‘hang outwith’ (p. 98) and likelihood to undertake decision approach actions (i.e.,request information, visit, or apply) toward that school.
Despite evidence indicating that measurable factors contribute to the decision-making process, many students made their final decision based on much less tan-gible factors. The influence of these indefinable aspects is discussed next.
Intangible influences: the ‘It’ factor
Although students clearly identified institutional characteristics as important totheir selection process, the more ambiguous aspects of school were equally
40 A.M. Pampaloni

relevant to their decisions. Almost 60% of students identified the atmosphere ofthe school as the reason they would ultimately decide to attend. They choseschools because ‘it feels right’ or ‘comfortable,’ or ‘[the student] really likedsomething about it,’ or ‘because it’s where [the students] feel at home for allthe right reasons.’ Students want to feel ‘like [they] belong at the school’ orthat ‘it’s where [they’re] supposed to be.’ Perhaps one student’s view best cap-tures the essence of the ‘it’ factor: ‘I fell in love with it and can’t wait to begin.’
Thus, while students are confident that they will know what they want whenthey see it or feel it, there was a lack of clarity about what ‘it’ is. This reinforcesthe need for organizations to provide a complete and accurate picture of whatthey are, both in their materials and during campus visits (Cable, Aiman-Smith, Mulvey, & Edwards, 2000). As Anctil (2008) describes, schools needto ‘make the intangible tangible’ (p. 32). Although achieving a balancebetween accuracy and desirability of image may be difficult, doing so providesstudents with a more informed view of the school.
Conclusion
This study provides a clearer picture of the characteristics that potentialmembers seek when deciding if affiliation with a specific college or universityis desirable. Respondents seek a broad range of information to inform themabout the attributes of selected schools. This suggests that schools provide atleast minimal information on a host of subjects. One way of doing so is forschools to recognize the influence of direct contact with the school via tours,open houses, or on-campus interviews. As such, these provide excellent oppor-tunities for schools to highlight their strengths and address student concerns.Furthermore, because potential members are often unable to articulate thespecific qualities that appeal to them, personal visits offer an opportunity forstudents to identify or experience characteristics specific to each school. Thismay help them narrow their decision. Ultimately schools benefit even if astudent decides not to apply, because students who decide not to attend maybe students who would eventually transfer or leave due to some type ofincompatibility.
ReferencesAdams, J., & Evenland, V. (2007). Marketing online degree programs: How do traditional resi-
dential programs compare? Journal of Marketing for Higher Education, 17, 67–90.Anctil, E.J. (2008). Selling higher education: Marketing and advertising America’s colleges and
universities. ASHE Higher Education Report, 34(2), 1–121.Anderson, E.L. (2003). Changing U.S. demographics and American higher education. New
Directions for Higher Education, 121, 3–12.Baker, H.E. (2002). Reducing adolescent career indecision: The ASVAB Career Exploration
Program. Career Development Quarterly, 50, 359–370.
Journal of Marketing for Higher Education 41
Berg, P.O. (1986). Symbolic management of human resources. Human Resources Management,25, 557–559.
Bergerson, A.A. (2009). College choice as a comprehensive process. ASHE Higher EducationReport, 35, 21–46.
Broekemier, G.M., & Hodge, K.A. (2008). Stressors for college bound high school studentsbased on sex of respondents. Journal of Marketing for Higher Education, 18, 34–49.
Cable, D.M., Aiman-Smith, L., Mulvey, P.W., & Edwards, J.R. (2000). The sources and accu-racy of job applicants’ beliefs about organizational culture. Academy of ManagementJournal, 43, 1076–1085.
Cabrera, A.F., & LaNasa S.M. (2000). Understanding the college-choice process. InA.F. Cabrera & S.M. LaNassa (Eds.), New directions for institutional research:Understanding the college choice of disadvantaged students (No. 107, pp. 5–22)San Francisco: Jossey-Bass.
Capraro, A.J., Patrick, M.L., & Wilson, M. (2004). Attracting college candidates: The impact ofperceived social life. Journal of Marketing for Higher Education, 14, 93–105.
Cerit, Y. (2006). Organizational image perceptions of the university by undergraduate studentsof school of education. Educational Administration: Theory & Practice, 47, 359–365.
Cheney, G., & Christensen, L.T. (2001). Organizational identity: Linkages between internal andexternal communication. In F.M. Jablin & L.L. Putnam (Eds.), The new handbook of organ-izational communication: Advances in theory, research, and methods (pp. 231–269).Thousand Oaks, CA: Sage.
Coccari, R.L., & Javalgi, R.J. (1995). Analysis of students’ needs in selecting a college or uni-versity in a changing environment. Journal of Marketing for Higher Education, 6, 27–39.
Comm, C.L., & LaBay, D.G. (1996). Repositioning colleges using changing student quality per-ceptions: An exploratory analysis. Journal of Marketing for Higher Education, 7, 21–34.
Day, J.C., Janus, A., & Davis, J. (2005). Computer and Internet use in the United States: 2003(pp. 23–208). Washington, DC: US Census Bureau.
DesJardins, S.L., Ahlburg, D.A., & McCall, B.P. (2006). An integrated model of application,admission, enrollment, and financial aid. The Journal of Higher Education, 7, 381–429.
Dutton, J.E., & Dukerich, J.M. (1991). Keeping an eye on the mirror: Image and identity inorganizational adaptation. Academy of Management Journal, 34, 517–554.
Dutton, J.E., Dukerich, J.M., & Harquail, C.V. (1994). Organizational images and memberidentification. Administrative Science Quarterly, 39, 239–263.
Elliott, K.M., & Healy, M.A. (2001). Key factors influencing student satisfaction related torecruitment and retention. Journal of Marketing for Higher Education, 10, 1–11.
Fischbach, R. (2006). Assessing the impact of university open house activities. College StudentJournal, 40, 227–34.
Freeman, K. (1999). The race factor in African Americans’ college choice. Urban Education,34, 4–25.
Galotti, K.M. (1995). A longitudinal study of real-life decision making: Choosing a college.Applied Cognitive Psychology, 9, 459–484.
Galotti, K.M., & Mark, M.C. (1994). How do high school students structure an important lifedecision? A short-term longitudinal study of the college decision making process.Research in Higher Education, 35, 589–607.
Gioia, D.A., Schultz, M., & Corley, K.G. (2000). Organizational identity, image, and adaptiveinstability. Academy of Management Review, 1, 63–81.
Gordona, J., & Berhow, S. (2009). University Websites and dialogic features for buildingrelationships with potential students. Public Relations Review, 35, 150–152.
Gray, L. (1991). Marketing education. Milton Keynes, England: Open University Press.Hatch, M.J., & Schultz, M. (2002). The dynamics of organizational identity. Human Relations,
55, 989–1018.Hegeman, D.L., Davies, T.G., & Banning, J.H. (2007). Community colleges’ use of the Web to
communicate their mission: Slights of commission and omission. Community CollegeJournal of Research and Practice, 31, 129–147.
Helwig, A.A. (2004). A ten-year longitudinal study of the career development of students:Summary findings. Journal of Counseling and Development: JCD, 82, 49–57.
42 A.M. Pampaloni
Henrickson, L. (2002). Old wine in a new wineskin. Social Science Computer Review, 20,400–419.
Horrigan, J., & Raine, L. (2006). The Internet’s growing role in life’s major moments.Washington, DC: American Institutes for Research for Pew Internet and American LifeProject.
Hossler, D., Schmit, J., & Vesper, N. (1999). Going to college: How social, economic, and edu-cational factors influence the decision students make. Baltimore, MD: Johns HopkinsUniversity Press.
Ivy, J. (2001). Higher education institution image: A correspondence analysis approach.International Journal of Educational Management, 15(6), 276–282.
Jablin, F.M. (1987). Organizational entry, assimilation and exit. In F.M. Jablin, L.L. Putnam,K.H. Roberts, & L.W. Porter (Eds.), Handbook of organizational communication: An inter-disciplinary perspective (pp. 679–740). Newbury Park, CA: Sage.
Johnson, L.S. (2000). The relevance of school to career: A study in student awareness. Journalof Career Development, 26, 263.
Jones, S. (2002). The Internet goes to college: How students are living in the future with today’stechnology. Washington, DC: American Institutes for Research for Pew Internet andAmerican Life Project.
Kang, S., & Norton, H.E. (2006). College and universities’ use of the World Wide Web: A publicrelations tool for the digital age. Public Relations Review, 32, 426–428.
Kelpe Kern, C.W. (2000). College choice influences: Urban high school students respond.Community College Journal of Research & Practice, 24, 487–494.
Ketterson, T.U., & Blustein, D.L. (1997). Attachment relationships and the career explorationprocess. Career Development Quarterly, 46, 167–178.
Klassen, M.L. (2000). Lots of fun, not much work, and no hassles: Marketing images of highereducation. Journal of Marketing for Higher Education, 10, 11–26.
Lane, J. (2000). A scientific approach for developing and testing a students’ job-career planbefore 11th grade. Education, 120, 605–613.
Lapan, R.T., Tucker, B., Kim, S.-K., & Kosciulek, J.F. (2003). Preparing rural adolescentsfor post-high school transitions. Journal of Counseling and Development: JCD, 81,329–342.
Lenhart, A., Madden, M., & Hitlin, P. (2005). Teens and technology. Washington, DC:Pew Internet and American Life Project.
Letawsky, N.R., Schneider, R.G., Pedersen, P.M., & Palmer, C.J. (2003). Factors influencing thecollege selection process of student-athletes: Are their factors similar to non-athletes?College Student Journal, 37, 604–610.
Lewison, D.M., & Hawes, J.M. (2007). Student target marketing strategies for universities.Journal of College Admission, 196, 14–19.
Lindlof, T.R., & Taylor, B.C. (2002). Qualitative communication research methods. ThousandOaks, CA: Sage Publications.
Luque-Martı́nez, T., & Del Barrio-Garcı́a, S. (2009). Modelling university image: The teachingstaff viewpoint. Public Relations Review, 35, 325–327.
Margulies, W. (1977, July–August). Make the most of your corporate identity. HarvardBusiness Review, 66–77.
Mattern, K., & Wyatt, J.N. (2009). Student choice of college: How far do students go for an edu-cation? Journal of College Admissions, 203, 18–29.
McAllister, S.M., & Taylor, M. (2007). Community college Websites as a tool for fostering dia-logue. Public Relations Review, 33, 230–232.
McAllister-Spooner, S.M. (2008). Users perceptions of dialogic public relations tactics via theInternet. Public Relations Journal, 2, 1–18.
Mentz, G., & Whiteside, R. (2003a). Internet college recruiting and marketing: Web promotion,techniques and law. Journal of College Admission, 181, 10–17.
Mentz, G., & Whiteside, R. (2003b). Web promotion, techniques, and law: An overview ofeffective engine placement and strategy for college enrollment management. Journal ofCollege Admissions, 181, 10–17.
Mignerey, J.T., Rubin, R.B., & Gorden, W.I. (1995). Organizational entry: An investigation ofnewcomer communication behavior and uncertainty. Communication Research, 22, 51–85.
Journal of Marketing for Higher Education 43

Mitchell, A.M. (1975). Emerging career guidance competencies. Personnel and GuidanceJournal, 53, 700–703.
Moogan, Y.J., Baron, S., & Harris, K. (1999). Decision-making behaviour of potential highereducation students. Higher Education Quarterly, 53, 211–228.
Otto, L.B. (2000). Youth perspectives on parental career influence. Journal of CareerDevelopment, 27, 111–118.
Paulsen, M.B. (1990). College choice: Understanding student enrollment behavior. ASHE-ERIC Higher Education Report No. 6. Washington, DC: The George WashingtonUniversity, School of Education and Human Development.
Perna, L.W., & Titus, M.A. (2004). Understanding differences in the choice of college attended:The role of state public policies. Review of Higher Education, 27, 501–525.
Pew Internet and American Life Project. (2009). Trend data. Demographics of Internet users.Retrieved 21 January, 2010, from http://www.pewinternet.org/Static-Pages/Trend-Data/Whos-Online.aspx
Poock, M.C., & Lefond, D. (2001). How college-bound prospects perceive university Web sites:Findings, implications, and turning browsers into applicants. College & University, 77,15–21.
Powell, D.F., & Luzzo, D.A. (1998). Evaluating factors associated with the career maturity ofhigh school students. The Career Development Quarterly, 47, 145–158.
Ramasubramanian, S., Gyure, J.F., & Mursi, N.M. (2002). Impact of Internet images:Impression-formation effects of university Web site images. Journal of Marketing forHigher Education, 12, 59–68.
Rowan-Kenyon, H.T., Bell, A.D., & Perna, L.W. (2008). Contextual influences on parentalinvolvement in college going: Variations by social class. Journal of Higher Education,79, 564–586.
Sachs, S.B. (2002). Voices of reason: Adolescents talk about their futures over time. Westport,CT: Bergin & Garvey.
Scott, E.D., & Jehn, K.A. (2003). About face: How employee dishonesty influences a stake-holder’s image of an organization. Business & Society, 42, 234–266.
Scott, R., & Daniel, B.V. (2001). Why parents of undergraduates matter to higher education.New Directions for Student Services, 94, 83–89.
Strauss, A., & Corbin, J. (1998). Basics of qualitative research: Techniques and procedures fordeveloping grounded theory. Thousand Oaks, CA: Sage Publications.
Sung, M., & Yang, S. (2008). Toward the model of university image: The influence of brandpersonality, external prestige, and reputation. Journal of Public Relations Research, 20,357–376.
US Department of Education, National Center for Education Statistics. (2000). 1999–2000national postsecondary student aid study (NPSAS:2000). Washington, DC: Author.
US Department of Education, National Center for Labor Statistics. (2005). Postsecondaryinstitutions in the United States: Fall 2003 and degrees and other awards conferred:2002–03 (NCES 2005-154). Washington, DC: Author.
US Department of Labor, Bureau of Labor Statistics. (2000). College enrollment and workactivity of 1999 high school graduates. Washington, DC: Author.
Wan, H., & Schell, R. (2007). Reassessing corporate image—An examination of how imagesbridges symbolic relationships with behavioral relationships. Journal of Public RelationsResearch, 19, 25–45.
Whitehead, J.M., Raffan, J., & Deaney, R. (2006). University choice: What influences thedecisions of academically successful post-16 students? Higher Education Quarterly, 60,4–26.
Williams, F., & Monge, P. (2001). Reasoning with statistics: How to read quantitative research.Fort Worth, TX: Harcourt College Publishers.
44 A.M. Pampaloni

Appendix 1
Organizational image survey
Organizational image: factors influencing student decision-making
1. What are three things that would make you choose a certain college?
2. What do colleges do to let you know that they are the kind of school that you wantto go to?
3. Realistically, what school (or type of school) do you think you will attend andwhy?
4. Please finish this sentence: ‘When I finally select a college to attend it will bebecause. . .’
5. Please rate the following characteristics that may influence your decision to apply(or not to apply) to a college 1 ¼ strongly disagree; 2 ¼ disagree; 3 ¼ somewhatdisagree; 4 ¼ neutral; 5 ¼ agree somewhat; 6 ¼ agree; 7 ¼ strongly agree
5a. Is there something else that you look for in a school that is not included in the list?
Journal of Marketing for Higher Education 45

6. Please rate the following characteristics that may influence your decision to apply(or not to apply) to a college 1 ¼ strongly disagree; 2 ¼ disagree; 3 ¼ somewhatdisagree; 4 ¼ neutral; 5 ¼ agree somewhat; 6 ¼ agree; 7 ¼ strongly agree
6a. Is there another source that you use to gather information about colleges that is not includedon the list?
7. What else would you like to say about your college decision-making process thathasn’t been asked?
8. When did you begin to plan to attend college? ____________ (month/year)
9. How many colleges have you visited? ____________
10. Do you have a computer at home?____ Yes, everyone in my home shares a computer____ Yes, I have my own computer____ No, we do not have a home computer
11. How much access do you have to a computer? (at home, school, a friend’s house,the library, etc.)____ A lot ____ Some ____ None
12. What year are you in high school? ____ Senior ____ Junior____ Sophomore
13. What is your ethnic group?____ African American/Black ____ Middle Eastern____ Asian American/Pacific Islander ____ Native American/American Indian____ Hispanic/Latin American ____ White____ Other (please specify) ________________________
14. Please identify the type of high school you attend and where it is located____Public ____ Private State________ County____________
46 A.M. Pampaloni
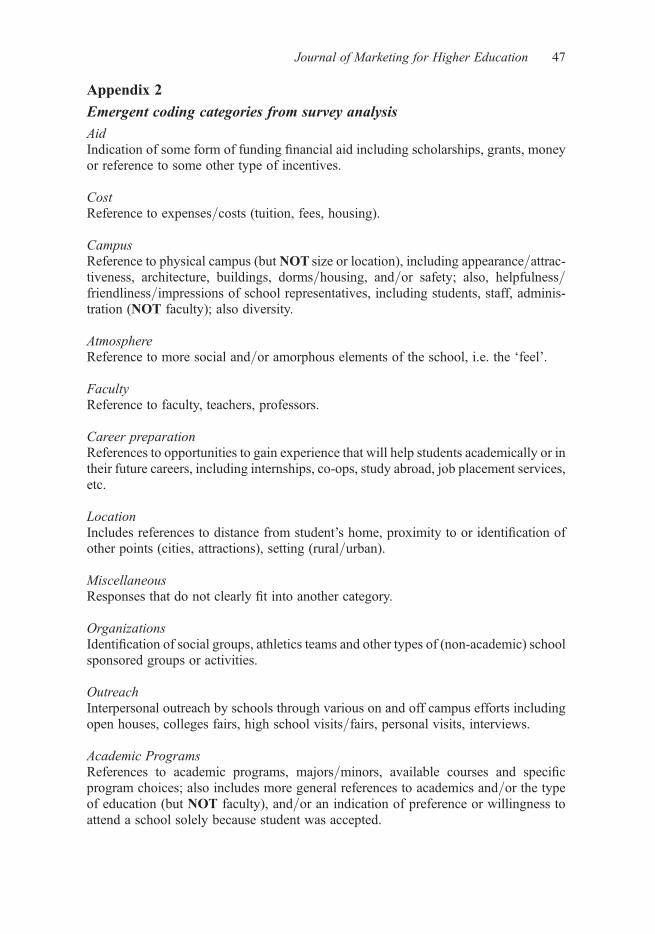
Appendix 2
Emergent coding categories from survey analysis
AidIndication of some form of funding financial aid including scholarships, grants, moneyor reference to some other type of incentives.
CostReference to expenses/costs (tuition, fees, housing).
CampusReference to physical campus (but NOT size or location), including appearance/attrac-tiveness, architecture, buildings, dorms/housing, and/or safety; also, helpfulness/friendliness/impressions of school representatives, including students, staff, adminis-tration (NOT faculty); also diversity.
AtmosphereReference to more social and/or amorphous elements of the school, i.e. the ‘feel’.
FacultyReference to faculty, teachers, professors.
Career preparationReferences to opportunities to gain experience that will help students academically or intheir future careers, including internships, co-ops, study abroad, job placement services,etc.
LocationIncludes references to distance from student’s home, proximity to or identification ofother points (cities, attractions), setting (rural/urban).
MiscellaneousResponses that do not clearly fit into another category.
OrganizationsIdentification of social groups, athletics teams and other types of (non-academic) schoolsponsored groups or activities.
OutreachInterpersonal outreach by schools through various on and off campus efforts includingopen houses, colleges fairs, high school visits/fairs, personal visits, interviews.
Academic ProgramsReferences to academic programs, majors/minors, available courses and specificprogram choices; also includes more general references to academics and/or the typeof education (but NOT faculty), and/or an indication of preference or willingness toattend a school solely because student was accepted.
Journal of Marketing for Higher Education 47

ReputationReference to school’s status, prestige, quality (specific to schools, NOT programs), cre-dentials, ranking.
SizeReference to population of school, desire for small/large school, number of students,size of class, number of students per class, desire for small/large classes, andstudent/teacher ratio.
Student researchAttempts by students to proactively solicit information about a school.
School typeReferences to identifiable characteristics associated with institutions of higher edu-cation by degree (community college, 4-year school, BA granting), general referenceto focus (liberal arts, engineering, etc.), funding source (public, state, private), orspecific mention of a school (by name).
48 A.M. Pampaloni

Copyright of Journal of Marketing for Higher Education is the property of Taylor & Francis Ltd and its content
may not be copied or emailed to multiple sites or posted to a listserv without the copyright holder's express
written permission. However, users may print, download, or email articles for individual use.