journal of hydrology - university of saskatchewan · a centre for hydrology, ... yet challenges...
TRANSCRIPT
Journal of Hydrology 521 (2015) 182–195
Contents lists available at ScienceDirect
Journal of Hydrology
journal homepage: www.elsevier .com/locate / jhydrol
Variability in evaporation across the Canadian Prairie region duringdrought and non-drought periods
http://dx.doi.org/10.1016/j.jhydrol.2014.11.0700022-1694/� 2014 Elsevier B.V. All rights reserved.
⇑ Corresponding author.E-mail address: [email protected] (R.N. Armstrong).
1 Permanent address: 330 Campion Crescent, Saskatoon, Saskatchewan S7H 3T9,Canada.
R.N. Armstrong a,b,⇑,1, J.W. Pomeroy a, L.W. Martz a
a Centre for Hydrology, Dept. of Geography and Planning, University of Saskatchewan, 117 Science Place, Saskatoon, Saskatchewan S7N 5C8, Canadab National Agroclimate Information Service, Science and Technology Branch, Agriculture and Agri-Food Canada, 107 Science Place, Saskatoon, Saskatchewan S7N 0X2, Canada
a r t i c l e i n f o s u m m a r y
Article history:Received 16 June 2014Received in revised form 28 October 2014Accepted 24 November 2014Available online 3 December 2014This manuscript was handled by AndrasBardossy, Editor-in-Chief, with theassistance of Ashish Sharma, AssociateEditor
Keywords:Spatiotemporal variabilityCold regions hydrological modellingplatformActual evaporationPenman–MonteithCanadian PrairiesLand surface parameterization
Knowledge of changes in spatial and temporal distributions of actual evaporation would be useful forland surface parameterizations in the Prairie region of Canada. Yet challenges persist for examiningthe variability of evaporation from land surfaces and vegetation over such a large region. This is due inpart to the existence of numerous methods of varying complexity for obtaining estimates of evaporationand a general lack of sufficient measurements to drive detailed models. Integrated approaches may beapplied for distributing evaporation over vast regions using energy and mass balance methods that inte-grate remote sensing imagery and surface reference data. Whilst informative, previous studies have notconsidered the variability of actual evaporation under drought and above normal moisture conditions.Continuous physically-based simulations were conducted for a 46 year period using the Cold RegionsHydrological Model (CRHM) platform. The Penman–Monteith model was applied in this platform to cal-culate estimates of actual evaporation at point locations which had sufficient hourly measurements. Vari-ations in the statistical properties and mapped distributions derived from point-scale modelling viaCRHM were instructional for understanding how evaporation varied spatially and temporally for a base-line normal period (1971–2000) and the years 1999–2005 which included both drought and above nor-mal moisture conditions. The modelling approach was applied successfully for examining the historicalvariability of evaporation and can be applied to constrain land surface parameterization schemes; vali-date more empirical predictive model outputs; inform operational agrometeorological and hydrologicalapplications in the Canadian Prairies.
� 2014 Elsevier B.V. All rights reserved.
1. Introduction
The actual evaporation from land surfaces, which includesevaporation from soils and vegetation, varies both spatially andtemporally across heterogeneous landscapes. Within the Prairieregion of Western Canada this is due in part to differences in soilconditions but is largely a result of the regional climate conditionsthat range from semi-arid to sub-humid. Consequently, from yearto year the spatial distribution of actual evaporation can varywidely over this large region. Relative spatiotemporal variationsin evaporation are of particular interest under drought and abovenormal moisture conditions for a wide range of hydrological andmeteorological type applications.
A general issue is that a detailed network of meteorological sta-tion observations of daily forcing data such as solar and/or netradiation, temperature, humidity and wind speed is often lackingto drive physically-based modelling. As a result estimates of evap-oration over extensive areas are often derived via empiricalschemes or indirectly via water and energy budget calculations.The latter commonly involves the application of complex numeri-cal methods that integrate land surface schemes and climate mod-elling techniques. In general, water budgets are calculated overentire watersheds and require reliable accounting of precipitation,infiltration, evaporation, changes in storage and runoff at a range ofappropriate scales (e.g. Wang et al., 2014a,b).
Energy budget methods integrate remote sensing techniquesthat provide measured surface variables over large areas to deriveinput data (Courault et al., 2005; Gowda et al., 2008). Remote sens-ing type approaches commonly use moderate to large scale grid-ded data to compute simplified energy budgets (e.g. Jacksonet al., 1977; Seguin et al., 1989; Bussières et al., 1997; Allenet al., 2007; Long et al., 2014). Process-based modelling approaches
R.N. Armstrong et al. / Journal of Hydrology 521 (2015) 182–195 183
have also been developed to integrate remote sensing, for example,with application to Canada’s landmass for a single year (e.g. Liuet al., 2003). Difficulties for remote sensing methods continue toexist, particularly for methods relying on optical and thermal satel-lite-based sensors, due to the inherent requirement for clear skyconditions (Long et al., 2014).
Some evaporation modelling methods are purely empirical anduse vegetation properties to index evaporation (e.g. Nagler et al.,2005). A review by Colaizzi et al. (2006) highlighted the applicationof scaling factors to distribute estimates from one-time-of-daymeasurements. In contrast, more complex methods have beendeveloped from, and validated by, intensive field studies. Forexample, Mu et al. (2007, 2011) and Fisher et al. (2008) derivedglobal scale estimates from AVHRR and MODIS imagery and nearsurface reference data which were validated against field measure-ments from the extensive global Fluxnet network.
A general limitation of remote sensing approaches is that evap-oration is often estimated indirectly as a residual term of theenergy balance or is distributed on an empirical basis. Due touncertainties in key inputs the error associated with residual esti-mates may be quite large. A more critical problem is these methodslack an adequate description of the physical process which makesit impossible to directly improve our understanding of the spatialor temporal variability of evaporation. In contrast, predictive mod-elling such as done via land surface schemes is physically-basedbut requires complex algorithms to solve the energy and water bal-ances. Specifically, numerical models diagnose the sensible andlatent heat fluxes which are required to parameterize the lowerboundary condition for coupled climate modelling.
Remote sensing information and forecasted reanalysis outputshave been used to force model simulations (e.g. Szeto, 2007;Szeto et al., 2008). Fernandes et al. (2007) applied the land surfacescheme, EALCO (Ecological Assimilation of Land and ClimateObservations) to generate a Canada wide examination of evapora-tion trends at climate stations with available records. Morerecently, Wang et al. (2013) examined monthly and seasonal aver-ages of evaporation obtained from EALCO using assimilated grid-ded land surface information for a Canada wide 30 yearsimulation (1979–2008).
In general, these types of land and climate assimilation studiesare informative and provide methodologies for distributing esti-mates of evaporation across Canada and examining historicaltrends. A limitation of forecasting approaches is that the modelsare relatively complex to parameterize and apply for less experi-enced users. More importantly, continuity equations for conserv-ing energy and mass must always be solved. So predictions areseldom constrained by available measurements. Rather theseobservations are generally used to verify the accuracy of outputsand correct notable biases.
Whilst informative, previous large scale studies have not con-sidered how the distribution of actual evaporation might vary dur-ing periods of drought and above normal moisture conditions.Spatial and temporal variability in meteorological and surface stateconditions, particularly in the Canadian Prairies, is an importantconcern for a variety of hydrological and meteorological research,operational and predictive applications. For example, knowledgeof changes in the spatiotemporal distribution of evaporation canbe used for constraining and verifying land surface parameteriza-tions under different surface state conditions; for improving cou-pled modelling of surface–atmosphere fluxes. This is crucial forimproving regional climate modelling and weather forecasting.This information is also important for agrometeorological andhydrological operational applications such as determining cropwater demand, flood forecasting and irrigation scheduling.
Without detailed sets of point-scale evaporation measurements(e.g. via eddy covariance) it is difficult to generate spatial and
temporal distributions of evaporation with absolute certainty.Calculating physically-based estimates of actual evaporationdirectly (i.e. not as a residual or based on vegetation indexes) canhelp to reduce the uncertainty. Models designed for this purposeinclude stand-alone point-scale equations which are oftenintegrated with processed-based hydrological simulations. However,input requirements for existing methods can vary widelydepending on theoretical considerations and model complexity.
In the present study a physically-based hydrological model wasassembled in the Cold Regions Hydrological Model (CRHM) plat-form. The classical form of the Penman–Monteith (Monteith,1965) equation was applied to simulate long term estimates ofactual evaporation during the snow free period at selected pointlocations in the Canadian Prairies. The model was driven by mete-orological records covering a 46 year period from Jan 1960 to Dec2005. The variability of seasonal estimates of evaporation wasexamined for a baseline normal period for the years 1971–2000.Daily estimates of evaporation were also examined for a highlyvariable period characterized by drought and above average wetconditions which occurred in the region during 1999–2005.
A key objective of the analysis was to compare the properties ofstatistical and mapped distributions to better understand the var-iability of evaporation during a baseline normal period and a per-iod characterized by drought and above normal moistureconditions; which is not well known for the Canadian Prairies.The distribution of annual growing season evaporation for thebaseline normal period was also used as a reference for calculatingexceedance fraction maps based on the individual years from 1999to 2005. The general spatial and temporal variability of evapora-tion was further quantified by computing the coefficient of varia-tion among the point locations across the Prairie region.
2. Study region
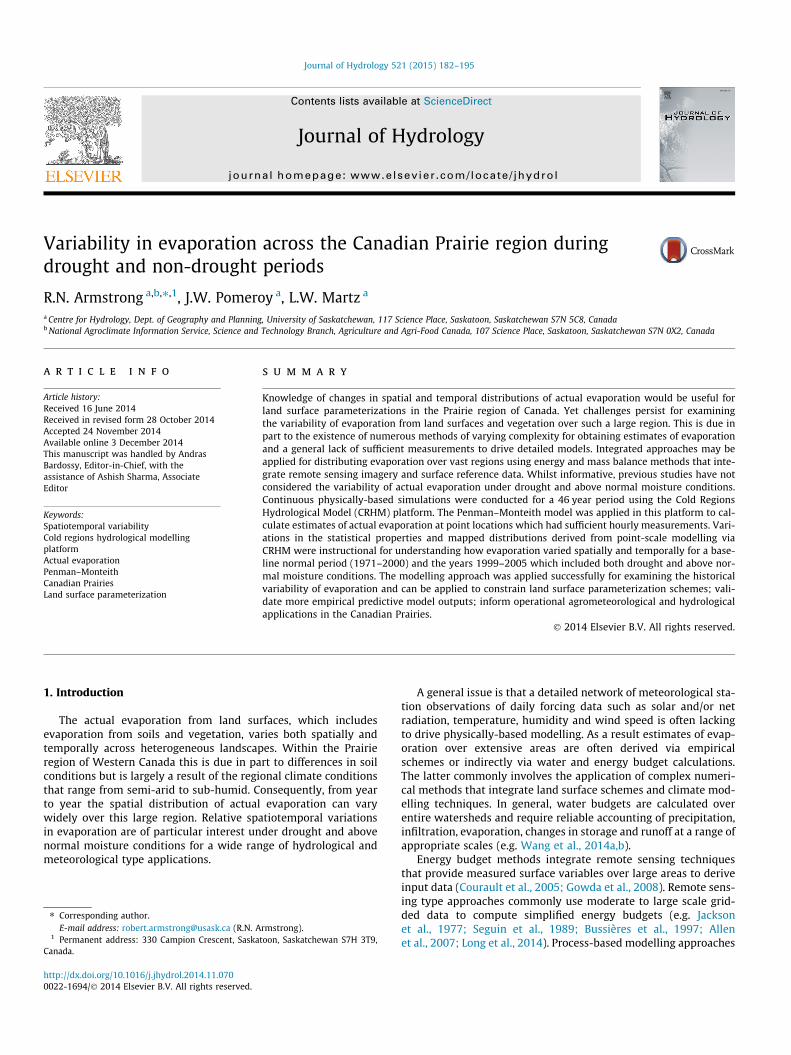
The spatial extent for this study was limited to the Prairie ecoz-one as shown in Marshall et al. (1996). A map of the region and 15station locations with suitable data sets for the modelling is pro-vided in Fig. 1. The Prairie ecozone extends across the southern por-tions of Alberta, Saskatchewan and Manitoba, and into the UnitedStates. The Canadian portion covers an area of approximately435,000 km2 and more than half of this area is characterized as asemi-arid region known historically as the Palliser Triangle. An ide-alized conceptual boundary of the Palliser region spanning portionsof southern Alberta and Saskatchewan, Canada is shown in Fig. 1.
2.1. General climate of the ‘Palliser Triangle’ region of Canada
In 1863, Captain John Palliser described a portion of the Prairieregion of Western Canada which seemed too arid for agriculturepurposes and potentially for settlement (Spry, 1959). Since thatreport, conceptual boundaries of the ‘Palliser Triangle’ have beendelineated over time. Subsequently, archived station records con-firm that this general area has historically been the driest regionof western Canada, but has also been interspersed with periodsof above normal moisture conditions. Cycles of major droughtshave occurred during the 1930s, 1960s and 1980s (Khandekar,2004); and more recently during a period from 1999 to 2005,which also included episodic, rapid shifts to well above normalmoisture conditions.
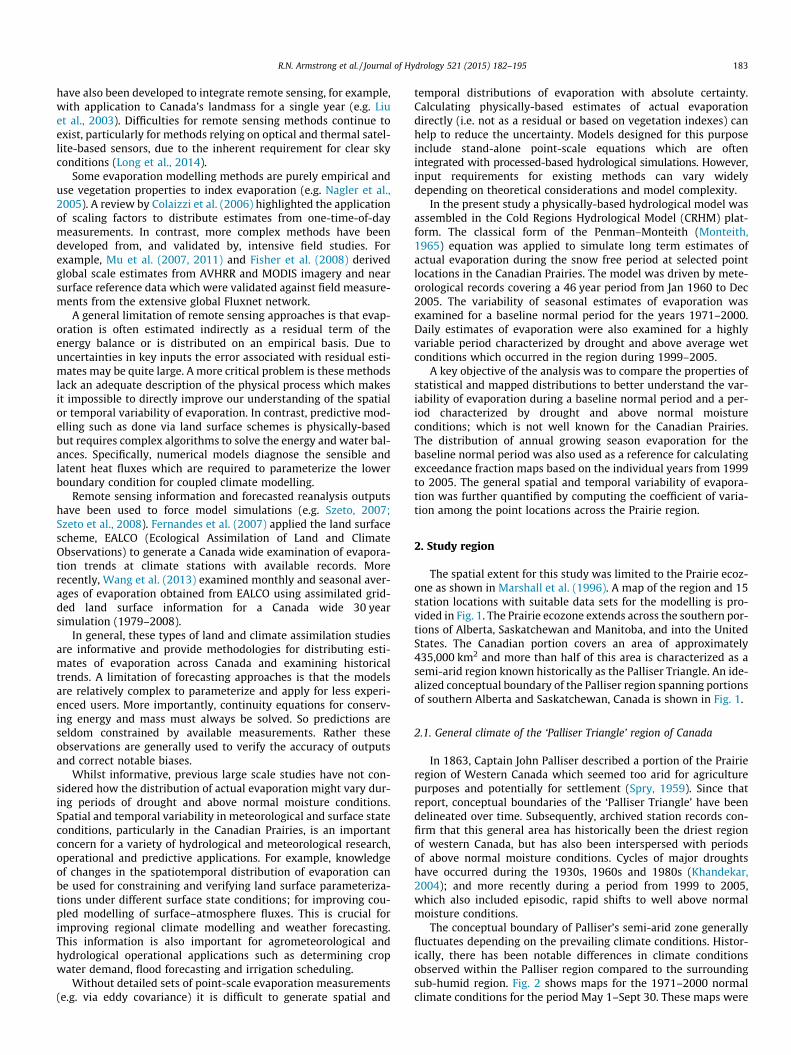
The conceptual boundary of Palliser’s semi-arid zone generallyfluctuates depending on the prevailing climate conditions. Histor-ically, there has been notable differences in climate conditionsobserved within the Palliser region compared to the surroundingsub-humid region. Fig. 2 shows maps for the 1971–2000 normalclimate conditions for the period May 1–Sept 30. These maps were
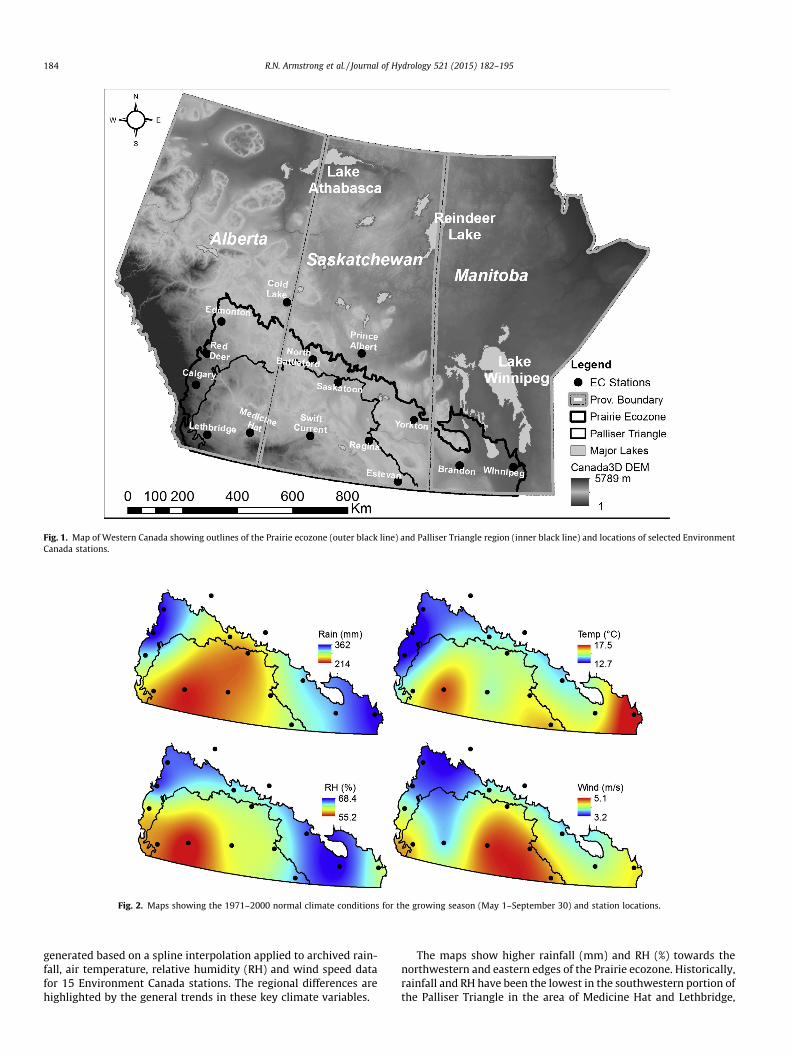
Fig. 1. Map of Western Canada showing outlines of the Prairie ecozone (outer black line) and Palliser Triangle region (inner black line) and locations of selected EnvironmentCanada stations.
Fig. 2. Maps showing the 1971–2000 normal climate conditions for the growing season (May 1–September 30) and station locations.
184 R.N. Armstrong et al. / Journal of Hydrology 521 (2015) 182–195
generated based on a spline interpolation applied to archived rain-fall, air temperature, relative humidity (RH) and wind speed datafor 15 Environment Canada stations. The regional differences arehighlighted by the general trends in these key climate variables.
The maps show higher rainfall (mm) and RH (%) towards thenorthwestern and eastern edges of the Prairie ecozone. Historically,rainfall and RH have been the lowest in the southwestern portion ofthe Palliser Triangle in the area of Medicine Hat and Lethbridge,
R.N. Armstrong et al. / Journal of Hydrology 521 (2015) 182–195 185
Alberta (see Fig. 1). As expected, air temperatures are observed todecline with increasing latitude and elevations along the edge ofthe western cordillera. Generally, wind speed increases from thenorthwest corner of the Prairie ecozone toward the southeast por-tion of the Palliser Triangle region. On average higher wind speedsare observed across a broad region that is bounded by Swift Current,Regina and Estevan (see Fig. 1).
3. Methods
3.1. The CRHM Model
The Cold Regions Hydrological Model (CRHM) platform containsa suite of physically-based hydrological process algorithms whichwere developed through extensive field investigations. These pro-cesses are fundamental to the hydrological interactions withinnorthern cold region environments. Pomeroy et al. (2007) haveprovided a comprehensive overview of CRHM core meteorologicaland hydrological processes and so these will not be discussed indetail here. Rather the present discussion focuses on the uniquetreatment of cold region and snow free period processes whichwere applied in CRHM for the long term continuous modelling
Fig. 3. Flowchart of CRHM hydrological modules assembled for mod
approach used for this study. The availability of these process mod-ules in CRHM is crucial for tracking changes in surface state condi-tions known to the cold regions of Western Canada.
For this study, a continuous simulation of the hydrologicalinteractions for both the cold snow covered and snow free periodswas used. It is important to note that with the exception of fieldresearch, required model inputs such as incoming solar radiation,net radiation and soil moisture are seldom measured or availableas archived records for the majority of Canada. As a result, specificmeteorological and hydrological process modules were assembledto estimate the components of the surface energy and mass bal-ances. A flowchart is provided in Fig. 3 showing links betweenthe respective modules assembled in CRHM.
In CRHM, spatial arrangements of biophysical landscape ele-ments in a basin are treated as individual hydrological responseunits (HRU). Each HRU has a specific set of parameters (e.g. area,slope, aspect, elevation, albedo, land cover type, etc.) and has aspecified flow connection within the network, if a connectionexists. Energy and mass balances are driven by the available forcingmeteorology and applied to each HRU independently. The transferof water and energy is applied at discrete time steps. For the presentstudy a daily time step was used.
elling evaporation at climate stations across the Prairie region.

186 R.N. Armstrong et al. / Journal of Hydrology 521 (2015) 182–195
Energy balance calculations included the seasonal estimation ofincoming solar radiation, atmospheric transmissivity, surface netshortwave and net longwave energy components needed to obtainthe net radiation for driving the evaporation process. For the win-ter/spring period the spring melt energy was estimated as a functionof the snow pack properties and meteorological state conditions.Mass balance calculations for the winter snow covered periodincluded blowing snow transport and snow sublimation, as well asinfiltration into frozen soils. For the snow free period the mass bal-ance included soil moisture accounting and estimation of the actualevaporation from the surface cover using the Penman–Montiethequation.
Meteorological inputs required for CRHM include solar or netradiation, air temperature, humidity, wind speed and precipitation.CRHM also provides empirical relationships and standard model-ling techniques to compute estimates of meteorological forcingdata when observations are not available. Specifically, these tech-niques are applicable to the calculation of energy balance compo-nents based on the current meteorological conditions, time of year,latitude, surface elevation, and associated astronomical earth–suncalculations.
3.2. Virtual basin hydrologic response units
For CRHM modelling purposes each station location was treatedconceptually as a virtual basin consisting of three HRUs (Fig. 4). Thistype of approach was applied for simplicity and to standardize themodelling to focus on the general spatiotemporal variability inevaporation across the region. The HRU selection and parameteriza-tion was based on field observations collected during a study in2006 and 2007 at the St. Denis National Wildlife Area, located in cen-tral Saskatchewan; which included eddy covariance measurements.
The first HRU was treated as a source of snow redistributionwhich is an important factor in the redistribution of water in thePrairies due to wind transport by blowing snow. This HRU was cov-ered by a standard cereal crop that alternated between crop/stub-ble (fallow). In the winter period snow was captured when stubblewas present and could be transported to other HRUs when thesnowpack exceeded the stubble height, or in fallow years. The sec-ond HRU was treated as a perennial mixed alfalfa–grass type sur-face (primarily consisting of alfalfa) and is the primary focus ofthe evaporation analysis. It was assumed that no lateral transportof surface moisture occurred between the crop and alfalfa–grassHRUs. Any runoff generated from these HRUs was routed directlyto a third HRU, treated as a grass/coulee, which served as thevirtual basin outlet.
Fig. 4. Diagram of conceptualized virtual basin with 3 HRUs.
All HRUs were assumed to be relatively flat in order to eliminatevariations in slope and aspect which could exert a strong influenceon the net radiation balance and seasonal estimates of evaporation.Constant rooting depths were set for the HRUs based on historicalfield research that included detailed soil excavations (Weaver,1926, 1968). A rooting depth of 1.5 m was assumed for the croppedHRU which is typical of fibrous root systems for domestic wheat orbarely cereal crops. A depth of 3 m was assumed for the Alfalfa –grass mix which included tall perennial grass species. This depthwas considered reasonable as the alfalfa tap root has beenobserved to extend to several metres or more into the soil evenunder drought conditions.
3.3. Data sources and vegetation tracking
3.3.1. Archived meteorological dataEnvironment Canada meteorological stations within the Prairie
ecozone were selected based on the availability of long term hourlydata of air temperature, relative humidity, wind speed, and dailyobservations of snowfall and rainfall. A total of 15 stations withthe most complete continuous hourly records over a period from1960 to 2005 were selected and data gaps in the records were filledusing data from nearby stations. Where more than one suitable sta-tion was available data gaps were filled using the average values.
3.3.2. Soil typesSoil infiltration capacities and water holding capacities can be
highly variable across large regions depending on differences insoil textures. These variations influence the amount of soil waterthat may be accessible by growing vegetation. For simplicity, abulk soil type was determined for each location based on an anal-ysis of the SLC v3.1.1 (Soil Landscapes of Canada Working Group,2007). The database consists of compiled soil survey maps at ascale of 1:1 million.
The SLC database contains information for 3–5 soil layers andtwo or more soil components which describe the stoniness, slopegradient, and percent occupied by each component typically downto a profile depth of 1 m. The soil layer information identified thespecific properties of the soil such as the type of soil, horizon name,percentages of sand, silt and clay, and bulk density etc which wasrelevant for parameterizing the soils at the various locations. Thebulk soil type was determined at each location using a standardsoil texture triangle based on the computed weighted average ofsand, silt, and clay percentages for soil layers within the soil profile.Representative parameters (e.g. porosity, hydraulic conductivity,and threshold ratios for moisture limited evaporation rates, etc.)were set from CRHM look-up tables based on the specified bulk soiltype (e.g. loam, clay, clay-loam, etc.).
3.3.3. Tracking vegetation growthChanges in vegetation height and leaf area were tracked over
the growing season. Continuous vegetation height inputs for anideal crop and tall grass were estimated using a linear regressionbetween observed heights collected during the field study at theSt. Denis National Wildlife Area (SDNWA) in 2006 which includedcrops and the mixed field of alfalfa and other tall grasses whichreached heights of 1 m or more. Leaf area was assumed to varybetween the minimum and maximum values as a linear functionof relative changes in vegetation height.
For the cropped HRU cultivation and fallow periods wereassumed to alternate annually. In cropped years, vegetationgrowth was assumed to start in early June and maturity wasreached in mid-September. This is a typical life cycle for a cerealcrop from emergence to harvest; i.e. 90–110 days. A post-harveststubble height of 20 cm was set for capturing blowing snow. Forthe alfalfa–grass HRU new growth was started in early May and
R.N. Armstrong et al. / Journal of Hydrology 521 (2015) 182–195 187
was shut down at the end of September. A post-harvest stubbleheight of 20 cm was set for blowing snow capture and new growthwas initiated the next spring.
3.4. Estimating key evaporation factors: Energy and water availability
Energy and water availability are two key factors required forestimating actual evaporation. For this study the general form ofthe Penman–Monteith (Monteith, 1965) equation was applied tocalculate daily estimates of evaporation during the snow freegrowing season period. This method combines the simplified equa-tions for the energy balance and water vapour transfer, and alsorequires estimates of the aerodynamic and canopy resistances thatinfluence evaporation rates. Application of this method and model-ling assumptions for field studies in the Prairie region of Canadahave been described previously by Armstrong et al. (2008, 2010).
Under conditions when soil water is in abundant supply theevaporation rate can be computed without imposing soil moisturelimitations (i.e. the continuity equation). In this case the evapora-tion process is mainly driven by the energy available for convertingwater to vapour, and is enhanced or limited by variations in tem-perature, humidity and wind speed. Across the Prairie ecozone soilwater availability is often highly variable on a seasonal basis and istypically a key limitation during the summer period. Under theseconditions continuity (i.e. conservation of mass) must be enforcedfor estimating the moisture limited evaporation rate.
In combination methods the evaporation process is mainly dri-ven by the available surface energy as a function of the net radiationbalance; the sum of net shortwave and longwave radiation. Meteo-rological inputs required for this calculation include incoming solarradiation, air temperature, vapour pressure and sunshine hours. Aprincipal component of the net radiation balance is incoming solarradiation. This is computed as a function of the solar radiation tothe top of the atmosphere, and estimates of atmospheric transmit-tance derived from the daily range of air temperatures and the alti-tude (Annandale et al., 2001; Shook and Pomeroy, 2011; ).
When soil water is in limited supply conservation of mass mustbe enforced and the actual evaporation rate is restricted as a func-tion of soil moisture limits and soil texture properties. The simula-tions performed for this study applied functions based ondevelopments by Zahner (1967) and modifications by Leavesleyet al. (1983). This method requires tracking of the soil wetnessratio, which is the ratio of current soil moisture, h, to the maximumwater holding capacity of the soil, hmax.
The actual evaporation rate is defined here as E and the soilmoisture limited rate as EL. When water is not a limitation the soilmoisture tension is low and soil water is depleted without restric-tions at the actual evaporation rate E. For example, for the case of aclay-loam soil the evaporation rate is allowed to continue unre-stricted while h/hmax > 0.67, and
EL ¼ E: ð1Þ
Under drying conditions, while 0.67 > h/hmax > 0.33 the soilmoisture tension increases and soil water depletion is reduced asa function of the available soil moisture, where
EL ¼h
hmaxE: ð2Þ
Soil water availability is considered to be severely limited whenh/hmax < 0.33, (e.g. very dry to drought conditions). In this case soilmoisture tension increases more rapidly and soil water depletion isseverely restricted. In this case the evaporation rate is reduced to
EL ¼ 0:5h
hmaxE: ð3Þ
Variations in the soil moisture balance and soil texture proper-ties were used to parameterize the Penman–Monteith canopyresistance term required for the water vapour transfer equation.
3.5. Modelling period, initial conditions and analysis methods
The availability of long term meteorological forcing dataallowed for continuous hydrologic simulations to be run for a per-iod of 46 years from 1960 to 2005. This allowed the hydrologicalmass balance to stabilize over a long period. In other words the ini-tial starting conditions were not a critical factor beyond the firstfew years of the simulation. The distributions of actual estimatesof growing season evaporation were of general interest for twokey periods across the Prairie region. This included a normal period(1971–2000) that served as a baseline reference for relative com-parisons against individual years from 1999 to 2005. This periodwas characterized by a mix of drought and above normal moistureconditions across the region. Results for the individual years span-ning 1999–2005 were used to assess the spatial and temporal var-iability of the seasonal evaporation totals.
Statistical and graphical analysis was done using the ‘R’ soft-ware environment (R Core Team, 2013). Results were summarizedfor point locations via boxplots and cumulative probability distri-butions. Boxplots were used to describe the data graphically basedon seven statistical measures. The 1st and 3rd quartiles (interquar-tile range) are indicated by the lower and upper limits of the boxframe; also equivalent to the 25th and 75th percentiles. Withinthe box frame, a line and point show the location of the medianand mean values respectively. Whiskers extending from the frameindicate the minimum and maximum values within 1.5 times theinterquartile range. Points falling outside the whisker limits areconsidered outliers relative to the majority of data values.
4. Results and discussion
4.1. Comparison of modelled evaporation estimates withmeasurements and integrated remote sensing assimilation methods inthe Prairies
This section briefly compares the realism of CRHM Penman–Monteith model estimates of evaporation with available measure-ments and remote sensing techniques that have been partially ver-ified using flux measurements. A key limitation is that reporting onlong term measurements (e.g. eddy covariance) or remote sensingtechniques for crop type surfaces is very limited for the CanadianPrairie region. Measurements have been mostly restricted to inten-sive field studies and boreal forest locations have received thegreatest attention in this regard. It should be noted that eddycovariance may be of limited use during wet periods, and in thecase of continuous remote sensing (e.g. satellites), key surface vari-ables are obtained using optical (e.g. albedo) and thermal (i.e. LST)sensors which is limited to clear-sky conditions. New approachesto obtaining surface fluxes have seen the development of complexmethods that integrate land surface modelling and remote sensingdata assimilation which have been applied more recently to exam-ine historical trends across Canada (e.g. Wang et al., 2013).
In the current study an alfalfa–grass HRU, the main focus of theevaporation analysis, was treated as a simple and standardizedcover within each virtual basin for the 15 Prairie locations. CRHMmodelled total growing season estimates of evaporation amongthe 15 locations ranged from approximately 150–200 mm (underdrought) to over 400 mm under above normal moisture conditionsin 2005. Much lower estimates were obtained in the semi-aridregion (e.g. Lethbridge and Medicine Hat) due to the higher vari-ability in climate and soil moisture conditions which included

188 R.N. Armstrong et al. / Journal of Hydrology 521 (2015) 182–195
drought. Higher estimates were obtained under above normalmoisture conditions in the semi-arid region and within the sub-humid zone. Modelled peak daily estimates were found to be inthe order of 2.8 mm/day under drought to between 4.5 mm/dayand over 5 mm/day under more favourable conditions (e.g. bothat the Lethbridge location).
The CRHM-derived point estimates compare well with the mag-nitudes of eddy covariance measurements and estimates derivedfrom integrated remote sensing methods. This includes measure-ments collected for the Lethbridge Ameriflux temperate grasslandduring 1998–2006. Under drought conditions (2000 and 2001) theCRHM total growing season evaporation was between approxi-mately 150–200 mm at Lethbridge, Alberta. For the same years,Wever et al. (2002) and Zha et al. (2010) reported measured (eddycovariance) totals for various growing season periods in the orderof 175–220 mm. A similar agreement was found for evaporationderived during above normal moisture in 2005 between CRHMderived evaporation (e.g. see Fig. 17) and the over 400 mm mea-sured at Lethbridge (Zha et al., 2010). For the same site Weveret al. (2002) indicated peak estimates were in the order of4.5 mm/day in 1998 prior to the onset of drought and only3 mm/day under drought in 2000 which are very similar to theCRHM estimates stated above (and to be discussed further).
Further, an intensive field study was conducted during the sum-mer in central Saskatchewan in 1991 around the time of the peakevaporation period for the region. During this study, Bussières et al.(1997) obtained an average of 5 mm/day based on GOES-7 satelliteobservations. Granger and Bussières (2005) presented regionalmaps for remote sensing estimates derived on July 14 from NOAAAVHRR observations. For the land surface portions of the map theestimates largely ranged from between 3 mm and 6 mm. Morerecent, integrated EALCO modelling studies produced estimatesof long term average annual evaporation aggregated for the Prairieecozone in the order of >300 mm (Fernandes et al., 2007; Wanget al., 2013).
4.2. Interannual variation of growing season total evaporation for the1971–2000 normal period
Analysis for the normal period from 1971 to 2000 focused onthe estimates of evaporation obtained from the mixed alfalfa–grassHRU for the growing season period from May 1 to Sept 30. Thisperiod was used to develop baseline estimates of growing seasonevaporation for comparisons against estimates obtained for the
Interannual Variability of Evaporation
Eva
pora
tion
(mm
)
150
200
250
300
350
400
450
BrandonCalgary
EdmontonRed Deer
WinnipegYorkton
Location
Fig. 5. Boxplots and cumulative distributions for the interannual variability
period of drought and above normal moisture conditions. Figs. 5and 6 show the interannual variability of growing season totalevaporation for stations located in the sub-humid and semi-aridzones respectively. Striking differences are apparent based on acomparison of the distributions for the two climatic zones. Therange of seasonal estimates for stations located in the sub-humidregion (Fig. 5) was much narrower than for locations within thesemi-arid Palliser region (Fig. 6). Estimates were generally higherin the sub-humid zone ranging from 340 mm to 410 mm withmedian and mean values ranging between 360 mm and 390 mm.
In contrast seasonal estimates for nearly all stations located inthe semi-arid region were highly variable. The North Battlefordlocation which is considered to be near the edge, but within, thesub-humid zone, exhibited similar variability to stations in thesemi-arid region. For these cases seasonal estimates were broadlydistributed and the median and mean values ranged from only280 mm to 350 mm. For the case of Estevan which is located withinthe Palliser region, over 60% of the seasonal values were distributedwithin a very narrow range which was more characteristic of thesub-humid locations.
Variations in the shape and location of the distributions ofactual evaporation can reasonably be expected given the variabilityin climate and soils across the region. However, it is very interest-ing to note the characteristic differences among distributions forlocations within the sub-humid zone compared to those withinthe semi-arid Palliser region. In general, shifts among distributionsacross the range of estimates are mainly attributed to regionalvariations in precipitation. Seasonal variations in evaporation canalso be partly attributed to differences in soil properties that con-trol water storage capacities, infiltration, and runoff generation.
The daily depletion of soil moisture progressively becomes morerestricted during periods of drying and less restricted followinginfiltration events. The magnitude of these variations will dependon the hydraulic properties of different soil classes. For most loca-tions within the sub-humid zone (except North Battleford) the dis-tributions were observed to be relatively uniform and clusteredaround higher seasonal totals. This suggests average annual precip-itation is sufficient to maintain favourable soil moisture levels atlocations influenced by the sub-humid prairie climate.
As a result, seasonal totals of actual evaporation were less likelyto be restricted by soil moisture limitations over the growing sea-son. In contrast there was much larger variability amongst distri-butions for the semi-arid locations (except Estevan). Theseseasonal totals were scattered across a large range because of the
Interannual Variability of Evaporation
Evaporation (mm)
Cum
ulat
ive
Fra
ctio
n
150 200 250 300 350 400 450
0.0
0.2
0.4
0.6
0.8
1.0
BrandonCalgaryEdmontonRed DeerWinnipegYorkton
of growing season evaporation among stations in the sub-humid zone.

Interannual Variability of Evaporation
Evaporation (mm)
Cum
ulat
ive
Fra
ctio
n
150 200 250 300 350 400 450
0.0
0.2
0.4
0.6
0.8
1.0
EstevanLethbridgeMedicine HatNorth BattlefordReginaSaskatoonSwift Current
Interannual Variability of Evaporation
Eva
pora
tion
(mm
)
150
200
250
300
350
400
450
Estevan
Lethbridge
Medicine Hat
North BattlefordRegina
Saskatoon
Swift Current
Location
Fig. 6. Boxplots and cumulative distributions for the interannual variability of growing season evaporation among stations within the Palliser Triangle and for NorthBattleford, SK.
Daily Evaporation at Edmonton
Evaporation (mm/day)
Cum
ulat
ive
Fra
ctio
n
0 1 2 3 4 5
0.0
0.2
0.4
0.6
0.8
1.0
1999200020012002*2003*2004*2005Normal
Daily Evaporation at Edmonton
’99 ’00 ’01 ’02 ’03 ’04 ’05 ’71−’00
Year
Eva
pora
tion
(mm
/day
)
01
23
45
67
8
Fig. 7. Boxplot and cumulative distributions for the interannual variability of growing season daily evaporation at Edmonton.
R.N. Armstrong et al. / Journal of Hydrology 521 (2015) 182–195 189
increased variability of annual precipitation and stronger seasonalmoisture limitations. For these cases relative differences in soilproperties among the locations would have an influence on the soilmoisture limited evaporation rates on a daily basis, and also vari-ations in seasonal evaporation totals.
4.3. Interannual variation of growing season daily evaporation for aperiod of drought and above normal moisture conditions
In the following sections, graphical summaries of the interan-nual variability for growing season daily estimates for the mixedalfalfa–grass HRU for 1999–2005 are provided for selected stations.This period was of interest due to the rapid shifts from drought toabove normal moisture conditions across the region. Growing sea-son daily estimates of evaporation for 1971–2000 comprised thereference distribution which was used for a two-sample K–S testagainst the distributions derived for the individual years from1999 to 2005. Significant differences (Prob. < 0.05) between thedistributions for the normal period and the years 1999–2005 aredenoted in the figures by an asterisk.
4.3.1. Sub-humid zoneGraphical summaries are provided below for several stations
located in the sub-humid zone. These include Edmonton, AB(Fig. 7), Yorkton, SK (Fig. 8), and Winnipeg, MB (Fig. 9). Under nor-mal to wet conditions, evaporation rates for the alfalfa–grass HRUpeaked at approximately between 4 mm/day and 4.5 mm/day dur-ing the growing season. This is consistent with observationsobtained over the mixed grass field (4.4 mm/day) during theSDNWA field study in 2006, and for other studied over grass fieldsas reported by Kelliher et al. (1993), Meyers (2001), Wever et al.(2002) and Baldocchi et al. (2004).
A comparison of distributions for the sub-humid locationsunder dry to wet conditions showed that the interannual variabil-ity among daily estimates increased with the transition to rapiddrying and drought conditions. During periods of extendeddrought large proportions of the distributions expectedly shifttoward lower values. Under more normal to wet conditionsapproximately 60% of the daily evaporation rates were less than3 mm/day. Under drought conditions between 40% and 60% ofthe daily estimates fell below 2 mm/day.

Daily Evaporation at Yorkton
Evaporation (mm/day)
Cum
ulat
ive
Fra
ctio
n
0 1 2 3 4 5
0.0
0.2
0.4
0.6
0.8
1.0
199920002001*2002*2003*2004*2005Normal
Daily Evaporation at Yorkton
’99 ’00 ’01 ’02 ’03 ’04 ’05 ’71−’00
Year
Eva
pora
tion
(mm
/day
)
01
23
45
67
8
Fig. 8. Boxplot and cumulative distributions for the interannual variability of growing season daily evaporation at Yorkton.
Daily Evaporation at Winnipeg
Evaporation (mm/day)
Cum
ulat
ive
Fra
ctio
n
0 1 2 3 4 5
0.0
0.2
0.4
0.6
0.8
1.0
1999*20002001*2002*2003*2004*2005Normal
Daily Evaporation at Winnipeg
’99 ’00 ’01 ’02 ’03 ’04 ’05 ’71−’00
Year
Eva
pora
tion
(mm
/day
)
01
23
45
67
8
Fig. 9. Boxplot and cumulative distributions for the interannual variability of growing season daily evaporation at Winnipeg.
190 R.N. Armstrong et al. / Journal of Hydrology 521 (2015) 182–195
As shown in the figures, only a few estimates out of nearly 4900values were between 5 mm/day and 8 mm/day. This can be attrib-uted to evaporative losses in the early spring from bare soils undersaturated conditions, when the surface resistance was set to zeroprior to new growth. Adjusting the surface resistance to zero undercertain conditions (e.g. surface saturation) is a conventionalapproach. However the literature lacks guidance for increasingthe surface resistance under fully saturated soil conditions whichwould effectively reduce the estimates for these rare occurrences.Further partitioning of the surface heat flux into increased soilwarming would also reduce the energy available for evaporationto occur. As such, it is unclear if these higher bare soil estimatesare truly representative of the unrestricted evaporation rate inthe spring prior to new growth.
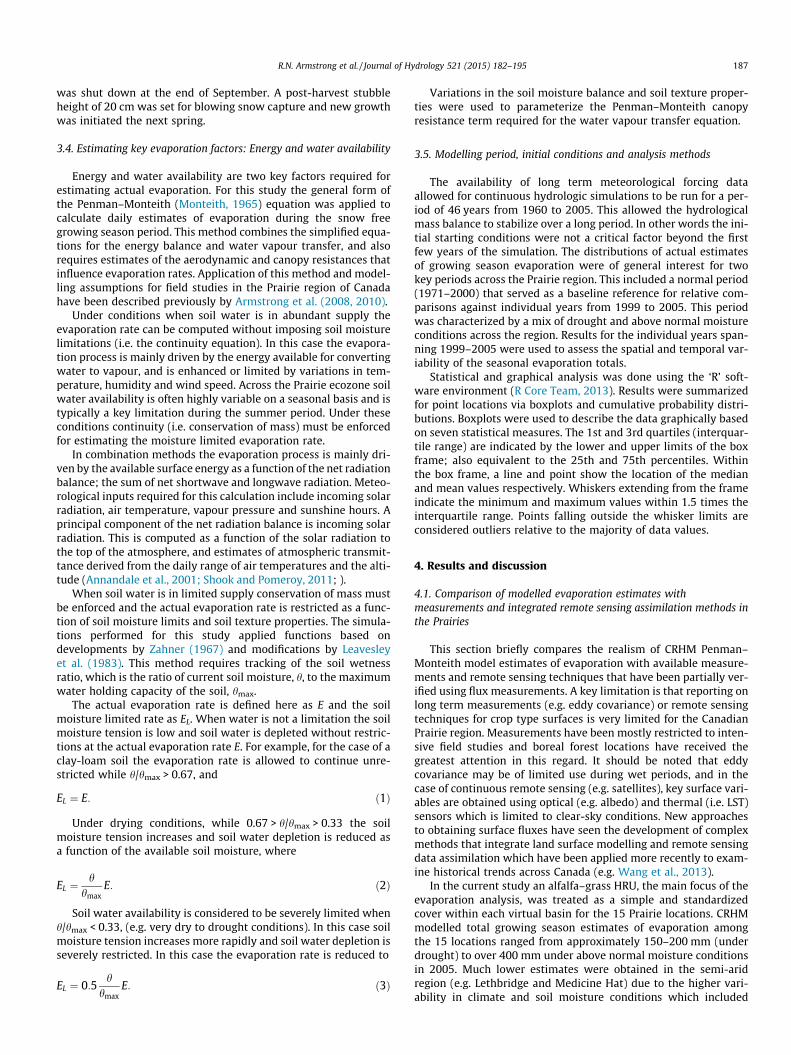
4.3.2. Semi-arid zoneGraphical summaries were generated for several locations hav-
ing a semi-arid climate, which included Lethbridge, AB (Fig. 10),North Battleford, SK (Fig. 11), and Saskatoon, SK (Fig. 12). Duringthe period of drought and above normal moisture conditions from1999 to 2005 the variability in the daily estimates for these
locations was much greater than for the sub-humid locations.Under normal to wet conditions evaporation rates during thegrowing season also peaked at approximately between 4 mm/dayand 5 mm/day. A few higher estimates attributed to bare soilsand saturated conditions were also observed in this case.
The shapes of seasonal cumulative distributions at these loca-tions were generally different from those for the sub-humid zone.In these cases the position of the interquartile ranges and medianvalues shown in the boxplots varied widely as a result of highlyvariable moisture and meteorological conditions. Of particularnote were the severe drought conditions at Lethbridge, AB in2000 and 2001 when peak estimates were in the order of only2.8 mm/day and 3.5 mm/day respectively. These estimates wereconsistent with observations reported for grasses under droughtconditions as reported by Meyers (2001) and Wever et al. (2002)for an AmeriFlux grass site located at Lethbridge, Alberta.
In general, differences in the positions and shapes of distribu-tions within the semi-arid region can be attributed to dramaticand rapid shifts between drought and above normal moisture con-ditions. When conditions were either extremely wet or dry, yearlydistributions of growing season evaporation clustered around
Daily Evaporation at Lethbridge
Evaporation (mm/day)
Cum
ulat
ive
Fra
ctio
n
0 1 2 3 4 5
0.0
0.2
0.4
0.6
0.8
1.0
1999*2000*2001*2002*2003*20042005*Normal
Daily Evaporation at Lethbridge
’99 ’00 ’01 ’02 ’03 ’04 ’05 ’71−’00
Year
Eva
pora
tion
(mm
/day
)
01
23
45
67
8
Fig. 10. Boxplot and cumulative distributions for the interannual variability of growing season daily evaporation at Lethbridge.
Daily Evaporation at North Battleford
Evaporation (mm/day)
Cum
ulat
ive
Fra
ctio
n
0 1 2 3 4 5
0.0
0.2
0.4
0.6
0.8
1.0
1999*20002001*2002*2003*20042005*Normal
Daily Evaporation at North Battleford
’99 ’00 ’01 ’02 ’03 ’04 ’05 ’71−’00
Year
Eva
pora
tion
(mm
/day
)
01
23
45
67
8
Fig. 11. Boxplot and cumulative distributions for the interannual variability of growing season daily evaporation at North Battleford.
Daily Evaporation at Saskatoon
Evaporation (mm/day)
Cum
ulat
ive
Fra
ctio
n
0 1 2 3 4 5
0.0
0.2
0.4
0.6
0.8
1.0
1999*2000*2001*2002*2003*2004*2005*Normal
Daily Evaporation at Saskatoon
’99 ’00 ’01 ’02 ’03 ’04 ’05 ’71−’00
Year
Eva
pora
tion
(mm
/day
)
01
23
45
67
8
Fig. 12. Boxplot and cumulative distributions for the interannual variability of growing season daily evaporation at Saskatoon.
R.N. Armstrong et al. / Journal of Hydrology 521 (2015) 182–195 191

Growing Season Evaporation Among Sites
Evaporation (mm)
Cum
ulat
ive
Fra
ctio
n
0 50 100 150 200 250 300 350 400 450
0.0
0.2
0.4
0.6
0.8
1.0
199920002001*2002200320042005Normal
Growing Season Evaporation
’99 ’00 ’01 ’02 ’03 ’04 ’05 ’71−’00
Year
Eva
pora
tion
(mm
)
050
100
150
200
250
300
350
400
450
Fig. 13. Boxplot and cumulative distributions for the regional variation of growing season evaporation among the 15 locations.
Fig. 14. Coefficient of variation for seasonal evaporation among the locations from1999 to 2005.
192 R.N. Armstrong et al. / Journal of Hydrology 521 (2015) 182–195
higher or lower evaporation rates respectively. For individual years,however, the shape and position of the distributions for each loca-tion varied due to the spatial and temporal variations in soil mois-ture across the region. Distributions across the semi-arid region for2001 were the general exception due to the areal extent of thesevere drought conditions.
4.4. Regional variation in growing season evaporation among stations
An analysis of variations in growing season estimates of evapo-ration was also conducted among all 15 locations for the yearsfrom 1999 to 2005. Despite the limited number of locations, resultspresented here depict the general variability in actual evaporationas driven by differences in climate factors and soil moisture condi-tions. Maps showing the distribution of evaporation and exceed-ance fractions relative to estimates for the normal period areuseful for highlighting variations in the spatial organization ofdrought and above normal moisture conditions over a series ofyears.
Boxplots and cumulative distributions of the growing seasontotal evaporation are provided in Fig. 13. Spatial variations in sea-sonal evaporation totals among the locations are characterized bypositional differences in the interquartile ranges and median val-ues. For example, the interquartile range of estimates for all loca-tions in the driest year (2001) was in the order of 130 mm;approximately 260 mm to 390 mm of evaporation. For the wettestyear (2005) the range in estimates was reduced to just 17 mm andevaporation across the region was between 358 mm and 375 mm.
Understandably, mean and median values of the estimates aremore easily influenced when only a limited number of point loca-tions are available. In some years (e.g. 1999–2002) the lower rangeof estimates (and outliers) had a large influence on the mean value.Fig. 13 showed that there can be large variability among estimatesfalling below the median value which is mainly attributed here tolarge differences in soil moisture. For the higher range of estimateswater availability is less of a limitation and evaporation from rela-tively flat surfaces is mainly driven by energy availability; which ismuch less variable than soil moisture for this region on a seasonalbasis across similar latitudes.
The variability in estimates of evaporation increased across theregion as the drought progressed from 1999 to 2001. More notably,two extreme lower seasonal totals of evaporation (outliers) for2000 and 2001 highlighted the severe drought conditions experi-enced at the Medicine Hat, AB and Lethbridge, AB locations. A rapid
shift to above normal moisture conditions ensued in 2002 acrossthe southern portion of the region due to higher spring precipita-tion. For 2003–2005 a gradual decline in the variability of seasonaltotals across the region was observed with a transition toward amore uniform moisture state.
The regional variability of evaporation among all locations wasquantified annually via changes in the Coefficient of Variation, CV(Fig. 14). In general, the yearly changes in CV appeared to be linear.Interestingly, the magnitude and direction of the changes underdrying and wetting conditions were considerably different. Varia-tions in seasonal estimates among the semi-arid and sub-humidlocations became larger as the drought conditions intensified from1999 to 2001. As a result, consecutive sharp increases in the CVwere observed for 2000 and 2001. A sharp reduction in the CVwas noted in 2002 followed by a more progressive decline from2003 through 2005. In the latter case, variability among the pointestimates was greatly reduced as much wetter conditions ensuedacross the region.
The observed transition in the CV gives rise to an interestingquestion regarding the potential effects of antecedent conditions,and also the influence of prolonged drought. Based on the results

Fig. 15. Growing season evaporation and exceedance fraction maps for 2000 and 2001.
Fig. 16. Growing season evaporation and exceedance fraction maps for 2002 and 2003.
R.N. Armstrong et al. / Journal of Hydrology 521 (2015) 182–195 193
of the CV analysis, the increase or reduction in the variability of theestimates may depend on whether the surface hydrological condi-tions (and relative extent of the areas impacted), are likely to be ina transitional state from drying to wetting or vice versa. For exam-ple, where the initial state condition is uniformly wet the CV will
undoubtedly increase under a rapid or progress shift toward a stateof drying.
In contrast, more rapid shifts to wetter conditions and reducedvariability are possible when well above normal precipitation anddeluges occur, effectively offsetting drought or drying conditions. It

Fig. 17. Growing season evaporation and exceedance fraction maps for 2004 and 2005.
194 R.N. Armstrong et al. / Journal of Hydrology 521 (2015) 182–195
is unclear, however, whether the CV would have increased furtheror suddenly declined in the case of more prolonged or extensivedrying within the region. Statistically, changes in the CV each yearcan only describe potential initial states from which further dryingor wetting may ensue. Unfortunately, a multitude of spatial distri-butions can produce similar CV values for the region. In essence,the results show that detailed estimates of evaporation should beobtained to capture the potential variability within larger regions.
Variations in the mapped distributions of evaporation for theyears 2000–2005 are provided in Fig. 15 (2000–2001), Fig. 16(2002–2003) and Fig. 17 (2004–2005). These maps show yearlychanges in the spatial distributions of seasonal evaporation andexceedance fractions during the progression through the droughtand wet periods. The exceedance maps are useful in that theseshow the fraction of seasonal estimates for the 1971–2000 baselinenormal period that are exceeded by seasonal estimates obtainedfor the years 2000–2005. When displayed in this manner variationsin seasonal evaporation compared to the baseline normal periodare instructive for understanding the relative magnitudes ofchanges during drought and above normal moisture conditions.
5. Summary and conclusions
The spatial and temporal variability of physically-based actualestimates of evaporation were examined at 15 locations acrossthe Prairie region. A hydrological model was assembled withinCRHM and run continuously over a 46 year period from Jan 1,1960 to Dec 31, 2005. The Penman–Monteith combination evapora-tion model was integrated with physically-based algorithmsdescribing processes relevant to Canadian Prairie hydrology andparameterized with archived meteorological station forcing data.Growing season (May 1 to Sept 30) daily estimates and seasonaltotals of evaporation for a perennial alfalfa–grass type surface wereanalysed yearly for a baseline normal period (1971–2000) and for a
period characterized by both drought and above normal moistureconditions (1999–2005).
The continuous modelling approach used here offers someadvantages over other methods that calculate estimates of evapo-ration as residuals of energy and water balances, or rely on empir-ical or simple aridity indexes. More importantly, results showedhow spatially variable and temporally dynamic estimates of actualevaporation can be as a result of the complex physical interactionsand interdependencies between surface states and atmosphericconditions. Within the sub-humid zone of the Canadian Prairieecozone distributions of growing season evaporation where clus-tered within a narrow range and were relatively similar in shape.In contrast, distributions for locations in the semi-arid Palliser Tri-angle region were generally very broad and highly variable fromyear to year predominantly as a result of rapid shifts in the climateand surface state conditions.
For years when water availability differed among the pointlocations, particularly when severe drought conditions ensued inthe semi-arid zone, the variability among point scale estimateswas much larger but rapidly and sharply declined under a periodof enhanced precipitation. Although not explicitly analysed here,variations in soil properties for locations characterized by semi-arid climate within the Palliser region, also likely had an influencein reducing seasonal totals of evaporation. Based on the observedbehaviour among distributions and changes in CV values, onemight also reasonably expect at some point for there to be reducedvariability across the region under more uniform drought condi-tions that extends further into the sub-humid region.
Estimates of actual evaporation are typically not considered asprimary descriptors of drought conditions in Canada. Distributedevaporation and exceedance fraction maps were instructional forshowing yearly variations in seasonal estimates under rapidchanges in drought and above normal moisture conditions acrossthe Canadian Prairies. Specifically, the pattern of evaporation chan-ged rapidly and dynamically during the period and the exceedance

R.N. Armstrong et al. / Journal of Hydrology 521 (2015) 182–195 195
maps provided a diagnosis of the severity of drought compared towhat might be expected for a baseline normal period. Such infor-mation may find application for parameterizing initial state condi-tions for operational agrometeorology, for evaluating predictiveland surface models or for verifying the lower boundary conditionsrequired for coupled surface–atmosphere and forecast modelling.
Acknowledgements
Funding support for this study was provided by the DroughtResearch Initiative (Canadian Foundation for Climate and Atmo-spheric Sciences) and the Canada Research Chairs programme.The authors are grateful to the anonymous reviewers who pro-vided valuable comments and editorial suggestions which haveenhanced the manuscript for publication.
References
Allen, R.G., Tasumi, M., Trezza, R., 2007. Satellite-based energy balance for mappingevapotranspiration with internalized calibration (METRIC)-model. J. Irrig. Drain.Eng. 133, 380–394.
Annandale, J.G., Jovanovic, N.Z., Benadé, N., Allen, R.G., 2001. Software for missingdata analysis of Penman–Monteith reference evapotranspiration. Irrig. Sci. 21,57–67.
Armstrong, R.N., Pomeroy, J.W., Martz, L.W., 2008. Evaluation of three evaporationestimation methods in a Canadian prairie landscape. Hydrol. Process. 22, 2801–2815.
Armstrong, R.N., Pomeroy, J.W., Martz, L.W., 2010. Estimating evaporation in aPrairie landscape under drought conditions. Canadian Water Resour. J. 35, 173–186.
Baldocchi, D.D., Xu, L., Kiang, N.Y., 2004. How plant functional-type, weather,seasonal drought, and soil physical properties alter water and energy fluxes ofan oak-grass savanna and an annual grassland. Agric. For. Meteorol. 123, 13–39.
Bussières, N., Granger, R.J., Strong, G.S., 1997. Estimates of regionalevapotranspiration using Goes-7 satellite data: Saskatchewan case study, July1991. Can. J. Remote Sens. 23, 3–14.
Colaizzi, P.D., Evett, S.R., Howell, T.A., Tolk, J.A., 2006. Comparison of five models toscale daily evapotranspiration from one-time-of-day measurements. Am. Soc.Agric. Biol. Eng. 49, 1409–1417.
Courault, D., Seguin, B., Olioso, A., 2005. Review on estimation of evapotranspirationfrom remote sensing data: from empirical to numerical modelling approaches.Irrig. Drain. Syst. 19, 223–249.
Fernandes, R., Korolevych, V., Wang, S., 2007. Trends in land evapotranspirationover Canada for the period 1960–2000 based on in situ climate observationsand a land surface model. J. Hydrometeorol. 8, 1016–1030.
Fisher, J.B., Tu, K.P., Baldocchi, D.D., 2008. Global estimates of the land-atmospherewater flux based on monthly AVHRR and ISLSCP-II data, validated at 16FLUXNET sites. Remote Sens. Environ. 112, 901–919.
Gowda, P.H., Chavez, J.L., Colaizzi, P.D., Evett, S.R., Howell, T.A., Tolk, J.A., 2008. ETmapping for agricultural water management: present status and challenges.Irrig. Sci. 26, 223–237.
Granger, R., Bussières, N., 2005. Evaporation/Evapotranspiration Estimates withRemote Sensing. In: Duguay, C.R., Pietroniro, A. (Eds.), Remote Sensing inNorthern Hydrology: Measuring Environmental Change. American GeophysicalUnion, Washington, D.C. http://dx.doi.org/10.1029/163GM08.
Jackson, R.D., Reginato, R.J., Idso, S.B., 1977. Wheat canopy temperature: a practicaltool for evaluating water requirements. Water Resour. Res. 13, 651–656.
Kelliher, F.M., Leuning, R., Schulze, E.D., 1993. Evaporation and canopycharacteristics of coniferous forests and grasslands – review. Oecologia 95,153–163.
Khandekar, M.L., 2004. Canadian Prairie Drought: A Climatological Assessment.Report Prepared for Alberta Environment, 37p.
Leavesley, G.H., Lichty, R.W., Troutman, B.M., Saindon, L.G., 1983. Precipitation-Runoff Modelling System: User’s Manual. US Geological Survey WaterResources Investigations Report 83-4238, 207p.
Liu, J., Chen, J.M., Cihlar, J., 2003. Mapping evapotranspiration based on remotesensing: an application Canada’s landmass. Water Resour. Res. 39. http://dx.doi.org/10.1029/2002WR001680.
Long, D., Longuevergne, L., Scanlon, B.R., 2014. Uncertainty in evapotranspirationfrom land surface modeling, remote sensing, and GRACE satellites. WaterResour. Res. 50. http://dx.doi.org/10.1002/2013WR014581.
Marshall, I.B., Smith, C.A., Selby, C.J., 1996. A national framework for monitoring andreporting on environmental sustainability in Canada. Environ. Monit. Assess. 39,25–38.
Meyers, T.P., 2001. A comparison of summertime water and CO2 fluxes overrangeland for well watered and drought conditions. Agric. For. Meteorol. 106,205–214.
Monteith, J.L., 1965. Evaporation and environment. Symp. Soc. Exp. Biol. 19, 205–234.
Mu, Q., Heinsch, F.A., Zhao, M., Running, S.W., 2007. Development of a globalevapotranspiration algorithm based on MODIS and global meteorology data.Remote Sens. Environ. 111, 519–536.
Mu, Q.Z., Zhao, M., Running, S.W., 2011. Improvements to a MODIS global terrestrialevapotranspiration algorithm. Remote Sens. Environ. 115, 1781–1800.
Nagler, P.L., Cleverly, J.R., Glenn, E.P., Lampkin, D., Huete, A.R., Wan, Z., 2005.Predicting riparian evapotranspiration from MODIS vegetation indices andmeteorological data. Remote Sens. Environ. 94, 17–30.
Pomeroy, J.W., Gray, D.M., Brown, T., Hedstrom, N.R., Quinton, W.L., Granger, R.J.,Carey, S.K., 2007. The cold regions hydrological model, a platform for basingprocess representation and model structure on physical evidence. Hydrol.Process. 21, 2,650–2,667.
R Core Team, 2013. R: A Language and Environment for Statistical Computing. RFoundation for Statistical Computing, Vienna, Austria. <http://www.R-project.org/>.
Seguin, B., Assad, E., Freaud, J.P., Imbernon, J.P., Kerr, Y., Lagouarde, J.P., 1989. Use ofmeteorological satellite for rainfall and evaporation monitoring. Int. J. RemoteSens. 10, 1,001–1,017.
Shook, K., Pomeroy, J., 2011. Synthesis of incoming shortwave radiation forhydrological simulation. Hydrol. Res. 42, 433–446.
Soil Landscapes of Canada Working Group, 2007. Soil Landscapes of Canada v3.1.1Agriculture and Agri-Food Canada (digital map and database at 1:1 millionscale).
Spry, I.M., 1959. Captain John Palliser and the exploration of Western Canada.Geogr. J. 125, 149–184.
Szeto, K.K., 2007. Assessing water and energy budgets for the Saskatchewan RiverBasin. J. Meteorol. 85, 167–186.
Szeto, K.K., Tran, H., MacKay, M.D., Crawford, R., Stewart, R.E., 2008. The MAGSwater and energy budget study. J. Hydrometeorol. 9, 96–115.
Wang, S., Yang, Y., Luo, Y., Rivera, A., 2013. Spatial and seasonal variations inevapotranspiration over Canada’s landmass. Hydrol. Earth Syst. Sci. Discuss. 10,6107–6151.
Wang, S., McKenney, D.W., Shang, J., Li, J., 2014a. A national-scale assessment oflong-term water budget closures for Canada’s watersheds. J. Geophys. Res.:Atmos. 119. http://dx.doi.org/10.1002/2014JD02951.
Wang, S., Huang, J., Li, J., Rivera, A., McKenney, D., Sheffield, J., 2014b. Assessment ofwater budget for sixteen large drainage basins in Canada. J. Hydrol. 512, 1–15.
Weaver, J.E., 1926. Root Development of Field Crops. McGraw-Hill Book Company,Inc., New York, 291p.
Weaver, J.E., 1968. Prairie Plants and Their Environment: A Fifty-year Study in theMid-west. University of Nebraska Press, Lincoln, 276p.
Wever, L.A., Flanagan, L.B., Carlson, P.J., 2002. Seasonal and interannual variation inevapotranspiration, energy balance, and surface conductance in a northerntemperate grassland. Agric. For. Meteorol. 112, 31–49.
Zahner, R., 1967. Refinement in empirical functions for realistic soil moistureregimes under forest cover. In: Sopper, W.E., Lull, H.W. (Eds.), Forest Hydrology.Pergamon, Oxford, p. 261.
Zha, T., Barr, A.G., van der Kamp, G., Black, T.A., McCaughey, J.H., Flanagan, L.B., 2010.Interannual variation of evapotranspiration from forest and grasslandecosystems in western Canada in relation to drought. Agric. For. Meteorol.150, 1476–1484.