journal of environmental science and engineering beprints.ulm.ac.id/1888/1/journal of environmental...
TRANSCRIPT


Volume 5, Number 4, April 2016 (Serial Number 46)
Journal of Environmental
Science and Engineering B
David
David Publishing Company
www.davidpublisher.com
PublishingDavid

Publication Information: Journal of Environmental Science and Engineering B (formerly parts of Journal of Environmental Science and Engineering ISSN 1934-8932, USA) is published monthly in hard copy (ISSN 2162-5263) and online (ISSN 2162-5271) by David Publishing Company located at 616 Corporate Way, Suite 2-4876, Valley Cottage, NY 10989, USA.
Aims and Scope: Journal of Environmental Science and Engineering B, a monthly professional academic journal, covers all sorts of researches on environmental management and assessment, environmental monitoring, atmospheric environment, aquatic environment and municipal solid waste, etc..
Editorial Board Members: Prof. Joaquín Jiménez Martínez (France), Dr. J. Paul Chen (Singapore), Dr. Vitalie Gulca (Moldova), Prof. Luigi Maxmilian Caligiuri (Italy), Dr. Jo-Ming Tseng (Taiwan), Prof. Mankolli Hysen (Albania), Dr. Jungkon Kim (South Korea), Prof. Samira Ibrahim Korfali (Lebanon), Prof. Pradeep K. Naik (India), Dr. Ricardo García Mira (Spain), Prof. Konstantinos C. Makris (Gonia Athinon & Nikou Xiouta), Prof. Kihong Park (South Korea).
Manuscripts and correspondence are invited for publication. You can submit your papers via Web Submission, or E-mail to [email protected], [email protected] or [email protected]. Submission guidelines and Web Submission system are available at http://www.davidpublisher.com.
Editorial Office: 616 Corporate Way, Suite 2-4876, Valley Cottage, NY 10989, USA Tel: 1-323-984-7526, 323-410-1082 Fax: 1-323-984-7374, 323-908-0457 E-mail: [email protected]; [email protected]; [email protected]
Copyright©2016 by David Publishing Company and individual contributors. All rights reserved. David Publishing Company holds the exclusive copyright of all the contents of this journal. In accordance with the international convention, no part of this journal may be reproduced or transmitted by any media or publishing organs (including various websites) without the written permission of the copyright holder. Otherwise, any conduct would be considered as the violation of the copyright. The contents of this journal are available for any citation. However, all the citations should be clearly indicated with the title of this journal, serial number and the name of the author.
Abstracted/Indexed in: Google Scholar CAS (Chemical Abstracts Service) Database of EBSCO, Massachusetts, USA Chinese Database of CEPS, Airiti Inc. & OCLC Cambridge Science Abstracts (CSA) Ulrich’s Periodicals Directory Chinese Scientific Journals Database, VIP Corporation, Chongqing, China Summon Serials Solutions Proquest
Subscription Information: Price (per year): Print $600, Online $480 Print and Online $800
David Publishing Company 616 Corporate Way, Suite 2-4876, Valley Cottage, NY 10989, USA Tel: 1-323-984-7526, 323-410-1082; Fax: 1-323-984-7374, 323-908-0457 E-mail: [email protected] Digital Cooperative Company: www.bookan.com.cn
David Publishing Companywww.davidpublisher.com
DAVID PUBLISHING
D

Journal of Environmental Science and Engineering B
Volume 5, Number 4, April 2016 (Serial Number 46)
Contents Aquatic Environment
161 Experimental Model to Treat BOD5, COD in Wastewater by Eichhornia Crassipes Raft, and Propose a Plan to Restore Water Source of To Lich River, Hanoi, Vietnam
Nguyen Thuc Hien and Nguyen Minh Khuyen
Environmental Biology
167 Study of the Opuntia ficus indica and Its Radioactive Potassium Content Using the Gamma Spectrometry
Guillermo Espinosa, José-Ignacio Golzarri and Edgar Padilla-Soriano
Environmental Energy
173 Analysis of an SME using Silicon and Flexible Organic Solar Cells as Replacements for Fossil Fuel Sources of Electricity in UK and Iraq
Azad Azabany, Ari Azabanee, Khalid Khan, Mahmood Shah and Waqar Ahmed
Environmental Constrution
179 Semi-automatic Building Extraction from Quickbird Imagery
Selassie David Mayunga
189 Analytical Architectural Study on Nuclear Power Plants
Mohamed Farahat
Environmental Management
207 Coastal Community Welfare of Mining Areain Kotabaru Regency, South Kalimantan Province
Ahmad Alim Bachri, Udiansyah, Nasruddin and Deasy Arisanty

Journal of Environmental Science and Engineering B 5 (2016) 161-166 doi:10.17265/2162-5263/2016.04.001
Experimental Model to Treat BOD5, COD in Wastewater
by Eichhornia Crassipes Raft, and Propose a Plan to
Restore Water Source of To Lich River, Hanoi, Vietnam
Nguyen Thuc Hien1 and Nguyen Minh Khuyen2
1. Pupil of Chu Van An High School, Hanoi 100000, Vietnam
2. Department of Water Resources Management, Ministry of Natural Resources and Environment, Hanoi 100000, Vietnam
Abstract: This paper presents the results of studies on evaluating the effectiveness of wastewater treatment by Eichhornia crassipes raft, the influent is the water of To Lich river. This study was conducted 3 times with 3 different velocity (0.037 m/s, 0.0099 m/s and 0.0126m/s) in the tank of eichhornia crassipes. Each time took 04 water samples for analysis at 4 locations: the influent source and 3 points at a distance of 4.0 m, 8.0 m and 12.0 m from the influent. Based on the experimental results, it proposes the size, number and type of raft to control the growth of eichhornia crassipes and treat the sewage of To Lich river to meet the Vietnamese Water Standard QCVN 08 (column A2, B1) and combine ecological landscaping.
Key words: Wastewater treatment, eichhornia crassipes, restore water resources.
1. Introduction
To Lich river basin has a total area of 77.5 km2
including 8 sub-basins: Westlake, To Lich, Lu river
upstream, Lu downstream, Set, Kim Nguu, Hoang Liet
and Yen So, with the length of 14.6 km [1]. Currently,
there are over 200 large and small outlets to discharge
wastewater into the river causing polution, many
indicators exceeded the limitation of column A2 of the
National Technical Regulation on Surface Water
Quality QCVN 08 [2], affectting the health of people
living around [3, 4]. Therefore, research and solutions
to restore water quality of To Lich river are necessary.
In Vietnam, eichhornia crassipes is most widely
used in wastewater treatment ponds [5]. It is living in
the water with fast growth speed, unecessary to care,
easy to adapt to the environment of waste water [6].
Besides, it can limit or prevent algae growth by
shielding light from the surface [7, 8]. Thus,
eichhornia crassipes is very useful and easy to treat
polluted water [9].
Corresponding author: Nguyen Thuc Hien, pupil, research
field: biology.
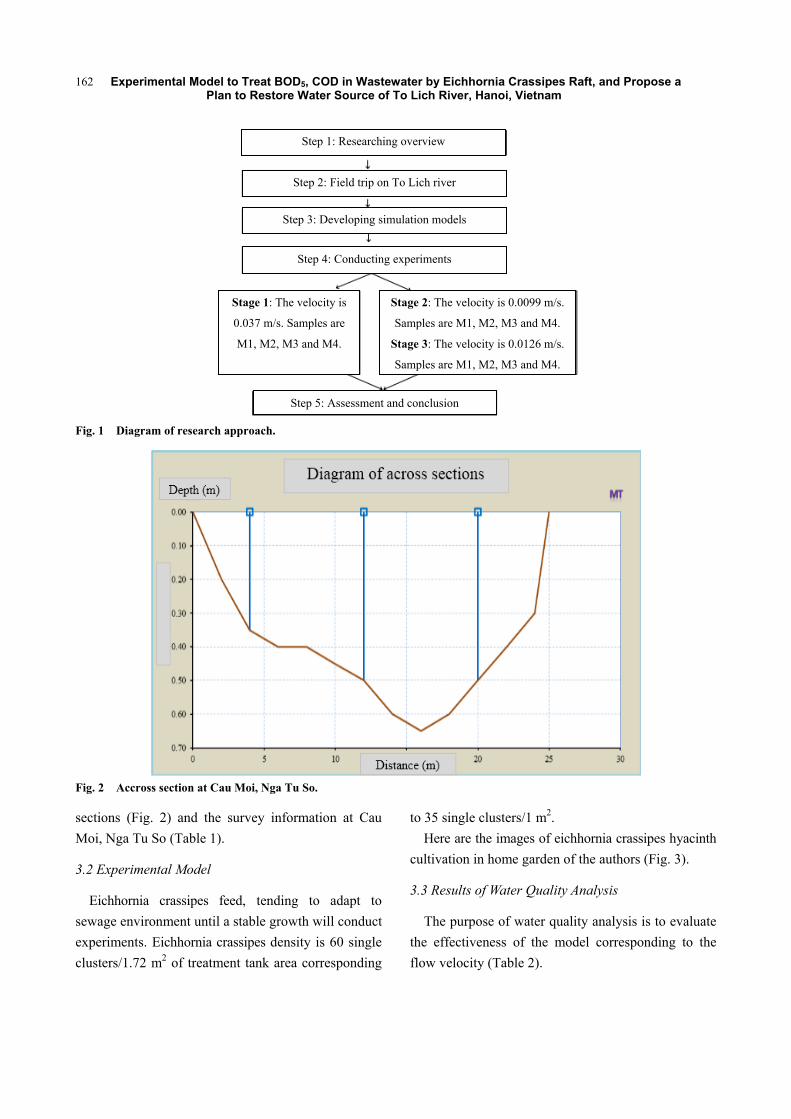
2. The Approach and Methodology
2.1. Approach Method
The approach method is shown in Fig. 1.
2.2. Research Method
Method of inheritance: inheriting the results of
the previous studies on flow, the status of wastewater
discharge into water sources;
Field survey: some major methods are:
topographic, velocity and water quality measurements;
Method of modeling: used to simulate the flow
on the river;
Statistical method: to evaluate the relationship
among water quality, length of treatment tank and
flow velocity.
3. Experimental Model of Wastewater Treatment by Eichhornia Crassipes Raft and Effective Treatment
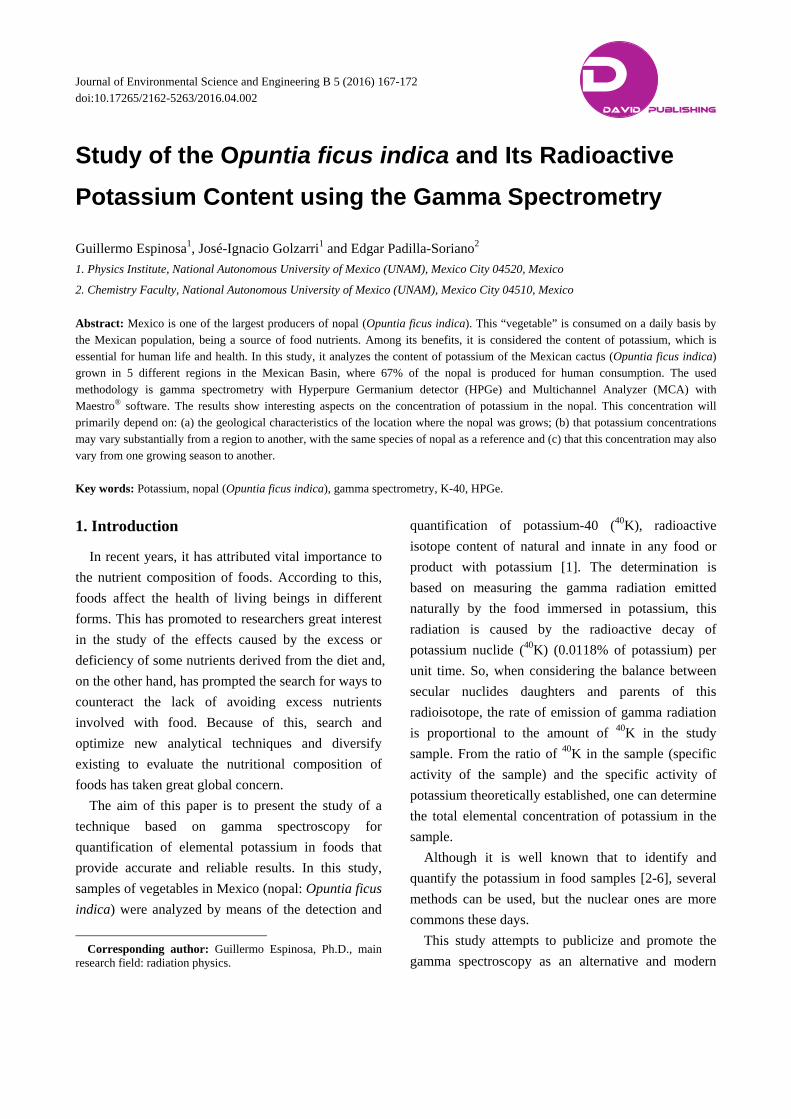
3.1 Survey Results on To Lich River
Here is the diagram of the surveyed river across
D DAVID PUBLISHING
Experimental Model to Treat BOD5, COD in Wastewater by Eichhornia Crassipes Raft, and Propose a Plan to Restore Water Source of To Lich River, Hanoi, Vietnam
162
Fig. 1 Diagram of research approach.
Fig. 2 Accross section at Cau Moi, Nga Tu So.
sections (Fig. 2) and the survey information at Cau
Moi, Nga Tu So (Table 1).
3.2 Experimental Model
Eichhornia crassipes feed, tending to adapt to
sewage environment until a stable growth will conduct
experiments. Eichhornia crassipes density is 60 single
clusters/1.72 m2 of treatment tank area corresponding
to 35 single clusters/1 m2.
Here are the images of eichhornia crassipes hyacinth
cultivation in home garden of the authors (Fig. 3).
3.3 Results of Water Quality Analysis
The purpose of water quality analysis is to evaluate
the effectiveness of the model corresponding to the
flow velocity (Table 2).
Step 1: Researching overview
Step 2: Field trip on To Lich river
Step 3: Developing simulation models
Step 4: Conducting experiments
Stage 1: The velocity is
0.037 m/s. Samples are
M1, M2, M3 and M4.
Stage 2: The velocity is 0.0099 m/s.
Samples are M1, M2, M3 and M4.
Stage 3: The velocity is 0.0126 m/s.
Samples are M1, M2, M3 and M4.
Step 5: Assessment and conclusion

Experimental Model to Treat BOD5, COD in Wastewater by Eichhornia Crassipes Raft, and Propose a Plan to Restore Water Source of To Lich River, Hanoi, Vietnam
163
Table 1 Survey information at Cau Moi, Nga Tu So.
No Parameters Unit Result
1 Discharge m3/s 2.96
2 Across section area m2 10.6
3 Average velocity m/s 0.28
4 Max velocity m/s 0.32
5 The width of the water m 25
6 Average depth m 0.42
7 The biggest depth m 0.5
Fig. 3 Eichhornia crassipes has developed normally.
3.4 Treatment Efficiency
The results of water quality analysis showed that:
The farther locations from the influent source is,
the lower the concentration of the indicators are;
The wastewater velocity in the experimental
tanks range from 0.0099 m/s to 0.037 m/s, through
12 m length of treating tank, processing performance
indicators from 14.3% to 96.7% and is shown in
Table 3;
Treatment efficiency of BOD5 achieved 17.3% to
44.9%;
Treatment efficiency of COD achieved 24.5% to
51.1%.
3.5 Evaluating the Length of Treatment Tank
Corresponding to Flow Velocity for Water Quality
Meet the Standard QCVN08
3.5.1 For Experiment Velocity
Based on the results of water quality analysis, it
showed that the relationship between treatment
efficiency and the distance from the influent source to
the sampling location is linear and close, the
correlation coefficient (R2) is over 0.75 and is shown
in Fig. 4.
Therefore, it can be estimated as: assuming that the
sewage concentration target is C0, through the tank
length is Ld (Ld has been identified on the model), the
water quality is Cd in the tank length Ld (C0 and Cd
were analyzed by experiments), then the calculation of
Lx (length of tank is x) to qualify standard Cq can be
interpreted according to the diagram in Fig. 5.
Then, from Fig. 5, it can calculate as:
(1)
According to Eq. (1), the length of experimental
tank (Lx) is 25.7 m for Cq to achieve regulation of
column A2 corresponding to the effluent velocity on
the experimental tanks is highest (v1); Lx = 12.5 m for
Cq to achieve regulation of column B1 corresponding
to the effluent velocity on the experimental tanks is
highest (v1). The results are shown in Table 4.
Input tank Crib containing eichhornia crassipes
Tank containing effluent to
prepare for the next experiment

Experimental Model to Treat BOD5, COD in Wastewater by Eichhornia Crassipes Raft, and Propose a Plan to Restore Water Source of To Lich River, Hanoi, Vietnam
164
Table 2 Results of water quality analysis.
Phase Number of sample Sampling locations on experimental tank (m)
BOD5 (mg/L) COD (mg/L)
I Phase 1, v1 = 0.037 m/s M1 influent 0 22.9 65.6
M2 4 16.9 48.3 M3 8 16.1 46 M4 12 14.7 42
II Phase 2, v2 = 0.0099m/s M1 influent 0 32.3 79.4 M2 4 26.7 46.2 M3 8 20.1 42.8 M4 12 17.8 38.8
II Phase 3, v3 = 0.0126m/s M1 influent 0 32.6 94
M2 4 24.4 71 M3 8 19.3 52 M4 12 18.9 52
IV QCVN08 [6] Standard A2 6 15 Standard B1 15 30 Standard B2 25 50
Table 3 Wastewater treatment efficiency at different positions (behind influent source) on experimental tanks.
No Indicator analysis Processor performance of indicators (%) Sampling locations (m) BOD5 COD
I Phase 1, wastewater velocity, v1 = 0.037 m/s
1 Behind the influent source 4 m 4 26.2 26.4 2 Behind the influent source 8 m 8 29.7 29.9 3 Behind the influent source 12 m 12 35.8 36
II Phase 2, wastewater velocity, v2 = 0.0099 m/s
1 Behind the influent source 4 m 4 17.3 41.8 2 Behind the influent source 8 m 8 37.8 46.1 3 Behind the influent source 12 m 12 44.9 51.1
III Phase 3, wastewater velocity, v3 = 0.0126 m/s
1 Behind the influent source 4 m 4 25.2 24.5 2 Behind the influent source 8 m 8 40.8 44.7 3 Behind the influent source 12 m 12 42 44.7
MIN 17.3 24.5 MAX 44.9 51.1 TB 33.3 38.4
Fig. 4 The relationship between treatment efficiency of BOD5, COD and the distance from the influent source to the sampling location.
y = 1.2x + 20.967R² = 0.9761
0
10
20
30
40
0 5 10 15Tre
atm
ent e
ffic
ienc
y of
B
OD
5st
age
1 (%
)
Distance (m)
y = 1.1625x + 37.033R² = 0.9981
0102030405060
0 5 10 15
Tre
atm
ent e
ffic
ienc
y of
C
OD
sta
ge 2
(%
)
Distance (m)

Experimental Model to Treat BOD5, COD in Wastewater by Eichhornia Crassipes Raft, and Propose a Plan to Restore Water Source of To Lich River, Hanoi, Vietnam
165
Fig. 5 Diagram method of calculating the length of experiment tank.
3.5.2 For Real Speed on the River
Base on the results in Table 4, it presents drawing
chart and relation between experimental flow velocity
and length of experiment tank. It is shown in Fig. 6
that correlation coefficient (R2) is over 0.75. So,
correlation equation can be used to calculate length of
experiment tank for real flow velocity of river.
From Fig. 6, the correlation equation between flow
velocity and length of tank is:
87.356 21.534 (2)
199.64 18.474 (3)
Where, y is length of experiment tank (m), x is
experimental flow velocity (m/s).
In fact, river flow is about 0.32 m/s when having no
rain and maximum 6.0 m/s when having heavy rain.
Thus, from Eqs. (2) and (3), it calculate the maximum
value of tank length is 1,216 m to treat river water
quality Cq towards A2 column for domestic purposes
but requiring appropriate treatment technology.
3.6 Calculating the Amount and Arrangement of Eichhornia Crassipes Raft to Treat To Lich River Water to Achieve Quality as A2 Column in Regulation QCVN08
(1) Design raft style: each raft is designed to float,
having beveled shape (front and rear) and grid to
locate and control growth of eichhornia crassipes,
ensure the density of eichhornia crassipes in each raft
is 35 single clusters/1 m2. Dimension is proposed as in
Fig. 7 (5.0 m length, 2.0 m width and 8.0 m2 area).
Table 4 The results of calculating the length of experiment tank corresponding to velocity of experiment flow.
No
Flow velocity on the tank (m/s)
C0 (mg/L) C3 (mg/L) C0-C3 (after 12 m (mg/L)
C0-Cq (A2) (mg/L)
C0-Cq (B1) (mg/L)
Lx of tank to reduce Cq to A2 (m)
Lx of tank to reduce Cq to B1 (m)
I For BOD5
1 v1 0.037 22.9 14.7 8.2 16.9 7.9 24.7 12.5
2 v2 0.0099 32.3 17.8 14.5 26.3 17.3 21.8 10.1
3 v3 0.0126 32.6 18.9 13.7 26.6 17.6 23.3 9.3
II For COD
1 v1 0.037 65.6 42 23.6 50.6 35.6 25.7 8
2 v2 0.0099 79.4 38.8 40.6 64.4 49.4 19 9.9
3 v3 0.0126 94 52 42 79 64 22.6 7.9
MAX 25.7 12.5
Fig. 6 Relation between experimental flow velocity and length of tank.
Fig. 7 Raft structure.
y = 199.64x + 18.474R² = 0.7899
15
20
25
30
0 0.02 0.04 0.06Exp
erim
ent t
ank
leng
th
(m)
Flow velocity (m/s)

Experimental Model to Treat BOD5, COD in Wastewater by Eichhornia Crassipes Raft, and Propose a Plan to Restore Water Source of To Lich River, Hanoi, Vietnam
166
(2) Calculating the amount and arrangement of rafts
to treat To Lich river water achieving QCVN08: in
fact, width of river is about 25 m, and raft
arrangement needs to ensure flow circulation. Thus,
author proposes raft arrangement as in Fig. 8. With
this arrangement, length of river part for rafts is
7,296 m.
4. Conclusion
(1) Studied natural conditions of To Lich river flow,
average flow velocity when having no rain is 0.28 m/s,
and velocity is 6.0 m/s when having heavy rain;
(2) Based on natural conditions of To Lich river
flow, author built experimental model to treat water of
To Lich river by eichhornia crassipes with eichhornia
crassipes density of 35 single clusters/1 m2.
When water flows through 12 m length of tank with
velocity 0.0099 m/s, concentrations of pollution
indicators decreased significantly, BOD5 ecreased
44.9% and COD decreased 51.1%. When the flow
velocity increases, the performance decreases, with
the velocity 0.0137 m/s, BOD5 decreased 35.8% and
COD decreased 36%;
(3) Based on the experimental result of the model,
the length of treatment tank is 1,296 m to treat river
water achieving A2 column of surface water
regulation for domestic use but requiring appropriate
treatment technology. And based on it, proposed raft
design to float, having grid, ensure the density of
eichhornia crassipes in each raft is 35 single clusters/1
m2 (5.0 m length, 2.0 m width and 8.0 m2 area). With
this raft style and arranged into clusters, there are 3
rafts according to river cross section and 5 rafts
according to river length. Clusters are arranged
staggered, even rows 2 clusters with distance 6 m, odd
rows 1 cluster at the center. Space between odd and
even clusters is 10 m, then minimum raft amount is
13,683 rafts and arranged river part of 4,864 m length.
If achieving B1 column, it needs 7,212 rafts and
arranged in river part of 2,564 m length.
Reference
[1] JICA. 2007. The Comprehensive Urban Development
Programme in Hanoi Capital City of the Socialist
Republic of Vietnam (HAIDEP). Hanoi: Vietnam
Development Information Center and Services.
[2] QCVN 08:2008/BTNMT. 2008. National Technical
Regulations on Surface Water Quality. Vietnam: MoNRE.
[3] Hang, K. T. 2009. Research on the Effect of Domestic
Wastewater to Water Quality of To Lich River and
Propose the Methods to Handle. Vietnam: National
University of Science.
[4] Quyen, N. T. N. 2012. Research on the Current Status of
Water Environment Serving for Planning the Wastewater
Treatment System of To Lich River, Stretch from Hoang
Quoc Viet to Nga Tu So. Vietnam: Ha Noi University of
Science.
[5] Cat, L. V. 2007. Wastewater Treatment Compounds
Containing Nitrogen and Phosphorus. Hanoi: Natural
Sciences and Technology.
[6] Nguyet, V. T., Tua, T. V., Kien, N. T., and Kim, D. D.
2014. Research on Using Eichhornia Crassipes to Treat
Nitrogen and Phosphorus in Wastewater. Vietnam:
Academy of Sience and Technology.
[7] Spagni, A., and Bundy, J. 2001 “Experimental
Considerations on Monitoring ORP, pH, Conductivity
and DO in Nitrogen and Phosphorus Biological Removal
Process.” Wat. Sci. Technol. 43 (11): 197-204.
[8] Eum, Y., and Choi, E. 2002. “Optimization of Nitrogen
Removal from Piggery Waste by Nitrite Nitrification.”
Wat. Sci. Technol. 45 (12): 89-96.
[9] Hang, P. T. T., and Hue, N. T. M. 2012. Using
Eichhornia Crassipes to Clean Contaminated Waterin
Thai Nguyen. Vietnam: Thai Nguyen University.
Journal of Environmental Science and Engineering B 5 (2016) 167-172 doi:10.17265/2162-5263/2016.04.002
Study of the Opuntia ficus indica and Its Radioactive
Potassium Content using the Gamma Spectrometry
Guillermo Espinosa1, José-Ignacio Golzarri1 and Edgar Padilla-Soriano2
1. Physics Institute, National Autonomous University of Mexico (UNAM), Mexico City 04520, Mexico
2. Chemistry Faculty, National Autonomous University of Mexico (UNAM), Mexico City 04510, Mexico
Abstract: Mexico is one of the largest producers of nopal (Opuntia ficus indica). This “vegetable” is consumed on a daily basis by the Mexican population, being a source of food nutrients. Among its benefits, it is considered the content of potassium, which is essential for human life and health. In this study, it analyzes the content of potassium of the Mexican cactus (Opuntia ficus indica) grown in 5 different regions in the Mexican Basin, where 67% of the nopal is produced for human consumption. The used methodology is gamma spectrometry with Hyperpure Germanium detector (HPGe) and Multichannel Analyzer (MCA) with Maestro® software. The results show interesting aspects on the concentration of potassium in the nopal. This concentration will primarily depend on: (a) the geological characteristics of the location where the nopal was grows; (b) that potassium concentrations may vary substantially from a region to another, with the same species of nopal as a reference and (c) that this concentration may also vary from one growing season to another. Key words: Potassium, nopal (Opuntia ficus indica), gamma spectrometry, K-40, HPGe.
1. Introduction
In recent years, it has attributed vital importance to
the nutrient composition of foods. According to this,
foods affect the health of living beings in different
forms. This has promoted to researchers great interest
in the study of the effects caused by the excess or
deficiency of some nutrients derived from the diet and,
on the other hand, has prompted the search for ways to
counteract the lack of avoiding excess nutrients
involved with food. Because of this, search and
optimize new analytical techniques and diversify
existing to evaluate the nutritional composition of
foods has taken great global concern.
The aim of this paper is to present the study of a
technique based on gamma spectroscopy for
quantification of elemental potassium in foods that
provide accurate and reliable results. In this study,
samples of vegetables in Mexico (nopal: Opuntia ficus
indica) were analyzed by means of the detection and
Corresponding author: Guillermo Espinosa, Ph.D., main
research field: radiation physics.
quantification of potassium-40 (40K), radioactive
isotope content of natural and innate in any food or
product with potassium [1]. The determination is
based on measuring the gamma radiation emitted
naturally by the food immersed in potassium, this
radiation is caused by the radioactive decay of
potassium nuclide (40K) (0.0118% of potassium) per
unit time. So, when considering the balance between
secular nuclides daughters and parents of this
radioisotope, the rate of emission of gamma radiation
is proportional to the amount of 40K in the study
sample. From the ratio of 40K in the sample (specific
activity of the sample) and the specific activity of
potassium theoretically established, one can determine
the total elemental concentration of potassium in the
sample.
Although it is well known that to identify and
quantify the potassium in food samples [2-6], several
methods can be used, but the nuclear ones are more
commons these days.
This study attempts to publicize and promote the
gamma spectroscopy as an alternative and modern
D DAVID PUBLISHING

Study of the Opuntia ficus indica and Its Radioactive Potassium Content using the Gamma Spectrometry
168
analysis method, offers great advantages over other
methods such as a non-destructive technique, which
does not require complex sample preparation and
allows results with high reliability and accuracy.
Potassium is an essential dietary mineral, required
to sustain biological processes. It constitutes 5% of the
total mineral content of the human body [7]. Natural
potassium comprises the isotopes 39K, 40K and 41K,
where 39K and 41K are stable elements and 40K is a
radioactive isotope (isotopic abundance 0.0118%)
with a half-life of 1.28 × 10⁹ years, and is the most
abundant radioactive substance in the human body. 40K decays to 40Ca by decay (89%) and to 40Ar by
+ decay (11%), the latter associated with the
emission of a gamma ray of 1,462 keV which is used
for the determination of 40K concentration [8].
HPGe gamma spectrometry is a nondestructive
analytical method and used here for the analysis of 40K in nopal. The secular equilibrium between
daughter nuclides and the naturally occurring parents
implies that the gamma ray emission rate for the decay
to 40Ar is proportional to the amount of 40K in nopal
[9]. The aim of this study is to assess the potassium
concentrations in Mexican nopal.
2. Methodology
2.1 Specific Activity of Potassium
The specific activity of potassium (number of
disintegrations per second per gram) is given by Eq.
(1), where NA = Avogadro’s constant (6.02 × 10²³
mol-1), a = isotopic abundance of 40K (0.0118%), MW
= molecular weight of potassium (39.1 g/mol) and T1/2
= half-life of 40K (1.27 × 10⁹ y) [10, 11].
gKBq
TM
aNA
W
A
c 19.31100
2ln
2/1 (1)
2.2 Detection Efficiency
The detection efficiency Eff is given by the number
of counts per second per gram from the KCl standard
divided by the specific activity of potassium Ac in Eq.
(2), where Cst = total counts (1,461 keV peak) from
the standard (including background); A = percentage
gamma radiation emission from 40Ar; CB = total
counts from the background radiation, MKSt = mass of
K in the KCl standard (g) and T = analysis time (s).
120784 5832
31.19 0.11 192.27 80000
st Bff
c KSt
C CE
A A M T
0.0022 0.22% (2)
The specific activity of a particular sample AS is
given by Eq. (3), where CS = total count (1,461 keV
peak) from the sample; CB = total counts from the
background radiation; WS = mass of the sample (g); T
= analysis time (s) and Eff = detection efficiency [12].
( ) /S BS
S ff
C C TA
W E A
(3)
Finally, dividing the specific activity of a sample AS
by the specific activity of potassium Ac yields the
concentration of potassium of the sample (Eq. (4)).
Here the authors express the results as a percentage, or,
equivalently, the number of grams of potassium per
100 g (or mL) of sample.
% 100S
c
AK
A (4)
2.3 Sample Description
The nopal (Opuntia spp.) is a plant of the family
Cactaceae Opuntia, which is produced mainly in dry
tempered, semi-arid and tropical zones. Being the
cactus species, Opuntia ficus indica is commonly
known as “nopal”. The first indication in the
history of mankind on the use of nopal attributed to
the Mesoamerican man, dating from 7,000 BC to
9,000 BC according to archaeological discoveries
conducted by Mac Neish, R. S. [13] in semiarid
regions of Tamaulipas and the Valley of Tehuacan,
Puebla.
2.4 Sample Selection
In the selection of the samples analyzed, the
metropolitan area of Mexico valley was chosen

Study of the Opuntia ficus indica and Its Radioactive Potassium Content using the Gamma Spectrometry
169
because it contributes 52.7% of total production in
Mexico and is further characterized by production of
nopal Opuntia ficus indica. All samples were
collected in 2012. Samples of the nopal plants are
shown in Fig. 1.
The location where the nopal are produced are
shown in Fig. 2, and the location names, political
demarcations, metropolitan area of Mexico, elevation
above sea level and geographic coordinates are shown
in Table 1.
3. Instrumentation
3.1 Sample Preparation
The nopal samples did not have a special preparation,
only each fresh nopal was cut in small pieces. This
aimed to fill the Marinelli container with the same
weight of material of each sample, and keep the same
detection geometry in all the samples.
(a)
(b)
(c)
Fig. 1 Samples of nopal plants: (a) nopal plant; (b) nopal leaves and (c) nopal plantations.
Fig. 2 Map of the studied region, with the locations of the nopal production: Milpa Alta (1-3), Xochimilco (4), Atlacomulco (5), Tizayuca (6), Zumpango (7-8) and Texcoco (9).
Fig. 3 Picture of the HPGe and MCA used system.
The equipment used included an EG & G Ortec®
Hyper Pure Germanium (HPGe) detector, an Ortec
439® bias supply, an Ortec 570® amplifier, an Ortec
ACE 4K® multichannel card and a PC. The gamma ray
spectra were obtained using the Maestro 2® program
and analyzed using the Gamma Vision program. A 36.4
× 33.6 × 35 cm old lead box of wall thickness 7.5 cm
was used to reduce background radiation [7]. Old lead
was used to ensure better and low background. In Fig. 3,
it showed the picture of the HPGe and multichannel
analysis system used PAD-IFUNAM.
3.2 Determination of the Background
In order to determine the analysis system
background, five spectra of 24 h were taken with an
empty Marinelli. The environmental 40K photopeak of
the background spectrum appears as usual.

Study of the Opuntia ficus indica and Its Radioactive Potassium Content using the Gamma Spectrometry
170
Table 1 Location names, political demarcations (locality and municipality), state of the republic state, elevation above sea level and geographic coordinates.
Sample ID Location name Origin of the samples Elevation above sea
level (m) Geographic coordinates lon./lat.Locality Municipality State
1 Milpa Alta 1 San Lorenzo Tlacoyucan
Milpa Alta Mexico city 2,600 19°60’ N 99°00’ W
2 Milpa Alta 2 Villa Milpa Alta
3 Milpa Alta 3 Villa Milpa Alta
4 Xochimilco Santa Cruz Acalpixcan Xochimilco Mexico city 2,240 19°27’ N 99°12’ W
5 Atlacomulco Atlacomulco AtlacomulcoEstado de México
2,578 19°48’ N 99°51’ W
6 Nopal Tizayuca (Silvestre)
Emiliano Zapata Tizayuca Hidalgo, México.
2,240 19°20’ N 99°11’ W
7 Otumba Otumba Zumpango Estado de México
2,760 19°37’ N 98°40’ W
8 San Martin San Martin de las Pirámides Zumpango Estado de México
2,300 19°37’ N 98°45’ W
9 Texcoco Texcoco Texcoco Estado de México
2,250 19°25’ N 98°55’ W
3.3 Energy Calibration
The HPGe analysis system was calibrated in energy
using the Gamma Vision program with the radioactive
sources of 241Am (60 keV), 137Cs (662 keV) and 60Co
(1,173 keV and 1,332 keV) and natural potassium 40K
(1,460 keV).
3.4 KCl Standard Calibration
The potassium standard used was 366.6 g of
potassium chloride crystal assayed by the supplier
Backer, J. T.TM. The KCl was placed inside the
500 mL Marinelli beaker and analyzed with the
spectrometer system over 24 h. The energy of the
photopeak was 1,460 keV and the energy resolution
(FWHM) was 2.5 keV.
3.5 Measurement Conditions
The measurements of the different samples were
carried out under identical conditions. The nopal was
distributed homogenously inside the Marinelli beaker
and covered the top of the detector. The relevant
detection efficiency of 0.22% was calculated above.
The different samples of nopal were also analyzed to
determine their potassium concentrations.
4. Results and Discussion
In Fig. 4, it showed the gamma spectra of potassium
(40K) of the nopal samples (1 to 9), and can observe
each one in different potassium concentrations. The
photopeak analysis was done using
ORTEC-MAESTRO® software, and the proposed
methodology and calculation on the previous section.
Table 2 shows the numerical results of the gamma
spectrometry analysis content: sample code, sample
weight, net area, potassium contents in the sample
(Bq/m3) and normalized content of potassium (mg of
potassium per 100 g of sample). This last column
content information is presented in Fig. 5. As can be
observed in the Fig. 5, the concentration of potassium
is different in each one of the samples studied, from
330.6 mg/100 g of potassium (the highest) to 37.9
mg/100 g (the lowest). The potassium content in the
nopal is independent to the kind of plant. The
potassium concentration will depend on the ground
location and its natural compounds in the soil.
For example, the nopal samples from the Milpa Alta
(1-3) location have variation of potassium contents, the
zone to zone of production, and shown a big
differences with other locations as it is between nopal
from Texcoco (9) and nopal from Xochimilco (4).
This work also shows that consuming of nopal as
ingest of potassium will be very dependent of the
content of potassium in the nopal, in turn, this will
depend on the region or area where it grew.

Study of the Opuntia ficus indica and Its Radioactive Potassium Content using the Gamma Spectrometry
171
1 2 3
4 5 6
7 8 9
Fig. 4 Gamma spectra of each one of nopal samples in the 40K region (1,460 keV).
Table 2 Results of the spectra analysis and the calculus of potassium content in the samples.
Sample ID Amount (g) Net area (counts)
As nopal (Bq/g nopal) mg K/100 g nopal
1 350 ± 0.1 380 ± 5 0.0571 183.2 ± 2.4
2 350 ± 0.1 337 ± 5 0.0507 162.5 ± 2.3
3 350 ± 0.1 441 ± 8 0.0664 212.8 ± 3.8
4 350 ± 0.1 685 ± 10 0.1031 330.6 ± 5.0
5 350 ± 0.1 187 ± 4 0.0280 89.9 ± 1.6
6 350 ± 0.1 272 ± 4 0.0408 131.0 ± 2.5
7 350 ± 0.1 190 ± 3 0.0285 91.5 ± 1.4
8 350 ± 0.1 405 ± 7 0.0609 195.2 ± 3.3
9 350 ± 0.1 79 ± 4 0.0118 37.9 ± 0.5
Fig. 5 Potassium content in the different varieties species of Mexican nopal samples.

Study of the Opuntia ficus indica and Its Radioactive Potassium Content using the Gamma Spectrometry
172
5. Conclusions
The analysis of potassium concentrations of foods
and beverages is becoming more important in terms of
both public health guidelines and policies, also the
treatment or management of specific diseases. The
gamma spectrometric analysis of the 40K and the total
potassium in the samples is facilitated by the use of
HPGe detectors and the automatic analysis software.
The method is excellent, precise, highly reliable,
non-destructive and requires less time and effort than
conventional chemical analysis. It is a suitable
analysis method for determining the potassium
concentrations of a wide variety of beverages, seeds,
grains, vegetables and other foods.
The potassium content variability found among the
samples analyzed in this study can be attributed to
different types of soils, and chemical compounds and
amounts of potassium fertilizers are added in different
nopal producing lands, but not by the species of plants
by self.
Acknowledgements
The authors wish to thank to García, A., Gonzalez,
N., Martinez, J., Novoa, L., Veytia, M., Huerta, A.,
and Chavarría, A. for their technical helps. This work
was partially supported by PAPIIT-DGAPA-UNAM
grants 1N103013 and IN103316.
References
[1] Brodsky, A. 1990. Handbook of Radiation Measurement and Protection, 3rd Edition. USA: CRC Press.
[2] Eisenbud, M., and Gesell, T. 1997. Environmental Radioactivity from Natural, Industrial and Military Sources. San Diego: Academic Press.
[3] Thulasi Brindha, J., Rajaram, S., and Kankan, V. 2007. “A Comparative Study of Body Potassium Contents in Males and Females at Kalpakkam (India).” Radiat. Prot.
Dosim. 123: 36-40. [4] Argonne National Laboratory. 2005. “Human Health Fact
Sheet.” EVS. Accessed February 4, 2016. http//www.remm.nlm.gov/ANL_ContaminantFactSheets_All_070418.pdf.
[5] Navarrete, M., Campos, J., Martínez, T., and Cabrera, L. 2005. “Determination of Potassium Traces in Foodstuffs by Natural 40K Radiation.” J. Radioanal. Nucl. Chem. 265: 133-135.
[6] Espinosa, G., Hernandez-Ibinarriaga, I., and Golzarri, J. I. 2009. “An Analysis of the Potassium Concentrations of Soft Drinks by HPGe Gamma Spectrometry.” J. Radioanal. Nucl. Chem. 282: 401-405.
[7] Espinosa, G., Golzarri, J. I., and Navarrete, M. 2016.
“Determination of the Natural and Artificial
Radioactivity of a Selection of Traditional Mexican
Medicinal Herbs by Gamma Spectrometry.” J. Radioanal.
Nucl. Chem. 307: 1717-1721.
[8] Mheemeed, A. K., Najam, L. A., and Hussein, A. K. 2014.
“Transfer Factors of 40K, 226Ra, 232Th from Soil to
Different Types of Local Vegetables, Radiation Hazard
Indices and Their Anual Doses.” J. Radioanal. Nucl.
Chem. 302: 87-96.
[9] Navarrete, J. M., Espinosa, G., Golzarri, J. I., Muller, G.,
Zuñiga, M. A., and Camacho, M. 2014. “Marine
Sediments as a Radioactive Pollution Repository in the
World.” J. Radioanal. Nucl. Chem. 299: 843-847.
[10] Navarrete, M., Zuñiga, M. A., Espinosa, G., and Golzarri,
J. I. 2014. “Radioactive Contamination Factor (RCF)
Obtained by Comparing Contaminant Radioactivity
(137Cs) with Natural Radioactivity (40K) in Marine
Sediments Taken up from Mexican Sea Waters.”
World Journal of Natural Sciences and Technology 4:
158-162.
[11] Padilla-Soriano, E. 2013. “Study of the Potassium
Content in Mexican Nopal (opuntia ficus indica) through
Nuclear Techniques.” Ph.D. thesis, University of Mexico.
[12] Yoram, N. E. 1997. “Traceability in the Amount-of-Substance Analysis of Natural Potassium, Thorium and Uranium by the Method of Passive Gamma-Ray Spectroscopy.” Accred. Qual. Assur. 2: 193-198.
[13] Mac Neish, R. S., Nelken-Terner, A., and Weitlaner, I. 1969. “The Non-Ceramic Artifacts.” American Journal of Archaeology 73 (1): 101-104.

Journal of Environmental Science and Engineering B5 (2016) 173-178 doi:10.17265/2162-5263/2016.04.003
Analysis of an SME using Silicon and Flexible Organic
Solar Cells as Replacements for Fossil Fuel Sources of
Electricity in UK and Iraq
Azad Azabany1, Ari Azabanee1, Khalid Khan2, Mahmood Shah1 and Waqar Ahmed3
1. Lancashire Business School, University of Central Lancashire, Preston PR1 2HE, United Kingdom
2. School of Engineering, University of Central Lancashire, Preston PR1 2HE, United Kingdom
3. School of Medicine, University of Central Lancashire, Preston PR1 2HE, United Kingdom
Abstract: Currently, 86% of the energy originates from fossil fuelsforelectricity. These are expected to run out, causing severe environmental damage threatening future generations. The total impact of Small and Medium Enterprises (SMEs) on the economy is significant. Solar cells harness the sun’s energy to generate electricity in an environmentally friendly manner. This study compares silicon solar cells to flexible Organic Photovoltaic solar cells (OPV) for electricity energy for a micro-business in the UK and Iraq. It shows that it is feasible to replace existing fossil fuel sources with solar cells in Iraq due to a greater amount of solar radiation striking the earth’s surface. Flexible solar cells can replace a proportion of the energy requirements in the UK and a larger proportion in Iraq. Using existing 20% efficient solar cells, 28% and 83% of the energy requirements of the microbusiness can be replaced in UK and Iraq respectively. Assuming 20% efficiency for solar cells placed on windows, 74% and 220% of the energy requirements of UK and Kurdistan can be replaced respectively and the surplus stored.
Key words: Energy management, silicon solar cells, flexible organic solar cells, CO2 emissions, Iraq, United Kingdom.
1. Introduction
Fossil fuels are finite and with increasing demand
will run out with dire consequences on the economy,
lifestyle and transportation [1]. The crisis needs to be
overcome urgently and new sources of energy
developed to replace existing sources. The Middle East
represents 5% of the world’s population but has about
66% of world’s oil reserves and 43% of world gas
reserves [2]. Some Middle Eastern countries are rich,
however, the wealth is unevenly distributed and does
not always lead to a widespread economic
development [3]. Currently, the majority of businesses
deriveenergy from non-renewable fossil fuel sources.
A major problem with this resource is major
environmental problems associated with climate
change arising due to rapidly increasing demand from
Corresponding author: Waqar Ahmed, Ph.D., research
field: nanotechnology.
population growth, increased lifespan, global warming
causing ice caps to melt, rising sea levels, flooding and
depletion of the ozone layer. Numerous studies have
focused on large distributors, manufacturing
companies and domestic users. However, very studies
have focused on SMEs particularly in the service sector.
There are a large number of SMEs in UK and Iraq and
their combined impactsare massive.
Previously, an analysis of a number of small service
businesses in terms of its energy utilization and CO2
generation has been presented [4]. The feasibility of
replacing fossil fuels sources of electricity with flexible
organic solar energy from the sun has been investigated
and a comparison was made between UK and Iraq
assuming an efficiency of 20%.
Research and development shows promise in
developing new generation of solar cells such as
flexible organic solar cells [5]. Latest nanotechnologies
will improve the efficiency, reliability and application
D DAVID PUBLISHING

Comp
174
of solar cells
fossil fuels e
cells, which
reliability. F
cheaper tha
widely appli
disadvantage
be replaced.
2. Backgro
To meet
photovoltaic
growth over
this emergin
crystalline s
being develo
near future.
organic sola
conversion e
over establi
potential of
semi-transpa
weight [7]. I
structures of
as costly as t
them. As pa
glass, solar c
cheaper than
involving co
coating the p
the molecul
method, the
directly onto
Traditiona
energy to ele
years, but ar
Currently, S
the global re
global energ
as OPVs are
electricity an
paritive Analy
s, making it f
energy source
h have mu
Flexible solar
an silicon so
icable [6]. Si
e of degradin
ound
the demand
c sector ha
r the last few
ng market wa
silicon techno
oped and fore
One of these
ar cell. Tho
efficiency, th
ished technol
cheap proce
arency,mecha
In convention
f the panel lik
the photovolt
aper costs ap
cells using pr
n conventiona
oating paper
paper with a
lar scale rou
e photovolta
o untreated pa
al inorganic
ectricity with
re costly and
Si-PVs accoun
enewable ene
gy generation
e only able to
nd have a ma
ysis of an SMFossil Fuel S
feasible to rep
es with new ge
uch higher
r cells would
lar cells, mo
ilicon solar ce
ng over time
d for renewa
as experienc
w years. In 20
as dominated
ology. New
ecast to enter
e promising a
ough still lac
hey exhibit se
logies. Amon
ssing on larg
anical flexibil
nal solar pane
ke glass, brack
taic materials
pproximately
rinting proces
al solar panel
r with materi
smooth mate
ghness of pa
aic material
aper [7].
Si-PVs conv
an average li
d complicated
nt for 13% o
ergy sector an
sector [8]. Th
o convert 8%
aximum life
ME using SilicSources of El
place the exis
eneration of s
efficiencies
be less intrus
ore efficient
ells also have
and thus nee
able energy,
ced exponen
004, over 90%
d by wafer-b
technologies
the market in
alternatives i
cking behind
everal advant
ng these are
ge areas, poss
lity and very l
ls, the suppor
kets etc. are tw
manufacture
a thousandt
sses can be m
ls. Other meth
ials include
erial to counte
aper. But in
can be co
vert 25% of
ife span of tw
d to manufact
f market shar
nd 3% of the t
hin film PVs s
of sun energ
span of one
con and Flexiblectricity in U
sting
solar
and
sive,
and
e the
ed to
the
ntial
% of
ased
s are
n the
is an
d in
ages
e the
sible
light
rting
wice
ed on
th of
much
hods
first
eract
this
oated
sun
wenty
ture.
re in
total
such
gy to
year
eve
OPV
ene
man
amo
eco
env
roll
of a
high
Cur
Si-P
arou
com
1 an
3. R
T
bus
T
the
arch
obje
repl
foss
num
be g
the
T
pow
Fig.
ble Organic SUK and Kurdis
en with enca
Vs have the
ergy and can
nufacturing m
ount of raw
nomical ma
vironmental
-to-roll manuf
a number of t
h profitabil
rrently, the in
PVs is aroun
und $2.50/
mpetitiveness
nd 2 show a t
Results and
The energy
inesses were
The efficiency
developmen
hitectures ha
ectives of thi
lacing electr
sil fuels with
mber of facto
generated fro
use of flexib
These includ
wer rating, po
. 1 Flexible o
Solar Cells asstan, Iraq
apsulation. It
potential to c
n be fabricate
methods usin
materials [6
anufacturing
damage. T
facturing has r
thin films PV
ity and lo
nitial cost of
nd $3.20/W, a
W, which
against conv
typical flexibl
d Discussio
consumed
open are sho
y of solar cell
nt of new m
ave been d
is study is to
ricity genera
flexible orga
ors effecting h
om silicon sol
le organic so
de the size,
osition on the
rganic solar ce
s Replacemen
t has been r
convert up to
ed by low co
ng significan
6]. This resu
and also
The compat
resulted in the
V technologie
w cost ma
investment fo
and that of O
enables h
ventional tech
le organic sol
n
and the da
own in Table
s has been inc
materials. Tec
developed. O
examine the
ated from no
anic solar cell
how much el
lar panels on
lar cells.
number of p
roof or avail
ell.
nts for
reported that
o 17% of sun
ost roll-to-roll
ntly reduced
ults in more
creates less
tibility with
e development
es that aim at
anufacturing.
for traditional
OPVs is only
higher cost
hnology. Figs.
lar cell [9].
ays that the
1.
creasing with
hnology and
One of the
feasibility of
on-renewable
l. There are a
lectricity can
the roof and
panels, their
lable window
t
n
l
d
e
s
h
t
t
.
l
y
t
.
e
h
d
e
f
e
a
n
d
r
w

Comparitive Analysis of an SME using Silicon and Flexible Organic Solar Cells as Replacements for Fossil Fuel Sources of Electricity in UK and Kurdistan, Iraq
175
Fig. 2 Comparison between average daily sunshine in Northern Iraq with UK in 2012.
Table 1 Dayscentre was open in 2012 and electricity used.
Month Days open Units consumed (kWh)
Jan. 26 355
Feb. 25 367
Mar. 27 532
April 25 574
May 27 461
June 26 426
July 26 427
Aug. 27 404
Sept. 25 460
Oct. 27 543
Nov. 26 416
Dec. 20 372
Total 307 5,337
space and hours of sunlight. Standard production
silicon solar panels generate 1,000 W/m2 with an
efficiency of about 15%-20%. Hence, a 1 m2 panel
produces about 150-200 W in good sunlight and less in
cloudy and dull conditions. The efficiencies of
commercial solar are expected to rise because
research has already produced higher efficiency solar
cells, however, this still needs to be translated to
production.
To consider how much CO2 can be prevented from
getting into the atmosphere and how it will impact the
environment, calculations relating electricity generated
to the equivalent CO2 producedwere examined. In the
UK, 1 kWh electricity generates an equivalent of 0.43
kg of CO2. Hence, the amount of CO2 that can be
prevented from entering the atmosphere can be
calculated (1 kWh electricity = 0.43 kg of CO2). Therefore, the amount of CO2 for the micro-business
released onto the atmosphere per year can be calculated
as: 0.43 × 5,337 kg of CO2 = 2,295 kg.
Solar cells rely on sunlight for their operation.
Hence, the average number of sunlight hours in the UK
and Northern Iraq are presented in Fig. 2.
Fig. 2 shows that the number of sunlight hours
fluctuates during the whole year in UK and Iraq. The
average sunlight hours per day in the UK is around 4
hours, but in Iraq, it is about 10 hours. This indicates
that Iraq is more conducive to the use of solar cell
technology than the UK.
The expected electricity generated in kWh per day
using solar panels using the Eq. (1) is:
1,000 (1)
A is the area of solar panels, is the efficiency and t
is the hours of sunlight.
Considering a micro-business such as Blue Apple
Printing, the amount of electricity that can be generated
0
2
4
6
8
10
12
14
16
Jan Feb Mar Apri May Jun Jul Aug Sep Oct Nov Dec
Ave
rage
dai
ly s
inli
ght
UK
& n
orth
ern
Ira
q

Comparitive Analysis of an SME using Silicon and Flexible Organic Solar Cells as Replacements for Fossil Fuel Sources of Electricity in UK and Kurdistan, Iraq
176
daily in UK and Iraq can be calculated [4]. The
physical dimensions of the roof are 6 × 2 = 12 m2 and
about 50% of it is available for installation of silicon
solar cells. Hence, an area of 6 m2 is available for solar
cell installation. The amount of electricity generated in
a typical day UK is: Electricity (UK) = 6 × 1,000 × 0.2
× 4 = 4,800 Wh/day = 4.8 kWh/day.
For Kurdistan, the calculation involves longer hours
of daily sunlight and the intensity of sun is much higher,
hence repeating the calculation gives: Electricity
(Northern Iraq) = 6 × 1,000 × 0.2 × 12 = 14,400
Wh/day = 14.4 kWh/day.
The trend in solar cell technology is towards
increased efficiency and versatile organic solar cells
and mounted onto windows readily in the form of
transparent thin films. Using solar cells on the
windows of Blue Apple Printing, and assuming a
projected efficiency of 20% from the current value of
5%, the solar cells as a viable alternative to fossil fuels
is highly attractive. Application of flexible solar cells
to windows can provide additional electricity.
The windows on the Blue Apple Printing measure
2.1 × 3.8 = 7.98 m2, which is approximately 8 m2 and
therefore, two windows give an area of 16 m2.
Therefore, the amount of electricity that generated with
5% efficient organic solar cells can be calculated:
electricity (UK) = 16 × 1,000 × 0.05 × 4 = 3,200
Wh/day = 3.2 kWh/day and electricity (Northern Iraq)
= 16 × 1,000 × 0.05 × 12 = 9,600 Wh/day = 9.6
kWh/day.
If the organic solar efficiencies were increased to 20%
comparable to silicon solar cells, then these numbers
increase to 12.8 kWh and 38.4 kWh for UK and Iraq,
respectively. Hence, northern Iraq, produces 3 times
more electricity per day using flexible organic solar
cells. Based on UK calculations (0.43 kg/kWh), if a
switch was made from non-renewable fossil fuels to
flexible organic solar cells,the amount of CO2
reduction can be calculated. For Kurdistan-Iraq, the
Mexico data (0.52 kg/kWh) is suitable because the
weather conditions are similar in the two countries.
A comparison can be made of the use of silicon solar
cells to organic solar cells with 5% and 20%
efficiencies. The corresponding reductions in harmful
carbon dioxide emissions can be calculated (Table 2).
Clearly, calculations for the replacement of fossil
fuels with solar cells show that the carbon emission
willdecrease and reduce damage to the atmosphere.
The benefits in Iraq would be much greater due to more
sunlight and about 5 times the reduction in CO2
emissions compared to UK. This is also applicable to
other countries in the Middle East. Hence, the use of
solar cells in the Middle Eastern countries is
particularly advantageous.
For the UK, the percentage of electricity generated
from 20% efficient solar cells compared to fossil fuels
as in Eq. (2):
% 100
,
,100 28% (2)
However, for the same business in Iraq with 20%
efficient silicon solar cells and longer day light hours,
the percentage of electricity needs replaced with solar
cells may be calculated.
Calculations show that using the solar panel with
efficiency of 20% can replace only 28% of the total
electricity required to run Blue Apple Printing in the
UK. The replacement of fossil fuels with solar cells
will reduce the carbon emission into the atmosphere
and reduce damage to the environment. However, in
Iraq due to longer daily and annual daylight hours, 83%
of the energy needs with silicon solar cellscan be
replaced (Table 3).
Existing flexible organic solar cells can replace 18%
and 55% in the UK and Iraq respectively. With
accelerating developments in nanotechnologies
particularly use of the 2D material graphene and new
materials, the efficiency is expected to increase rapidly
to 20% and beyond in the next few years. When the
efficiency reaches 20%, then, 74% and 220%
replacement in the UK and Iraq would be possible.
Comparitive Analysis of an SME using Silicon and Flexible Organic Solar Cells as Replacements for Fossil Fuel Sources of Electricity in UK and Kurdistan, Iraq
177
Table 2 Comparison of UK and Northern Iraq for silicon solar cells, 5% and 20% efficient organic solar cells and amount of CO2 reduction.
Silicon solar cell efficiency (%) Organic solar cell efficiency (%) UK (kWh) Northern Iraq (kWh)
5 3.2 9.6
20 12.8 38.4
20 4.8 14.4
Annual (307 days)
5 982 2947
20 3,930 11,789
20 1,474 4,421
Annual CO2 reduction (kg)
5 422 1,533
20 1,690 6,130
20 634 2,299
Table 3 Comparison of the percentage of current electricity requirements that can be replaced with solar with silicon solar cells and flexible organic solar cells.
Solar cell type Energy requirements replaced with solar (UK) (%)
Energy requirements replaced with solar (Northern Iraq) (%)
Silicon solar cells (20%) 28 83
Flexible organic solar cells
5% 18 55
20% (theoretical) 74 220
In the summer in Iraq, it has a requirement for cooling.
The electricity for the cooling systems may come from
the surplus solar energy. Hence, there will be no
detriment to the environment and no need to use fossil
fuel sources of electricity to run this small business. In
addition, these results in 1,690 kg and 6,130 kg
decrease in the CO2 emissions from this small business
alone. The approach and methodology employed in this
analysis is applicable to other microbusinesses and
with millions of microbusinesses operating. There will
be a major reduction in carbon emission if all the
businesses could employ solar energy for their daily
energy needs.
4. Conclusions
Micro-businesses in the UK and Iraq have been
analysed and compared for energy utilization. A large
proportion of fossil fuel sources can be replaced with
flexible organic solar cells. Existing silicon solar cells
can replace 28% and 83% of the energy requirements
of the microbusiness in the UK and Northern Iraq,
respectively. However, with flexible organic solar cells
placed on windows with a projected 20% efficient
solar cells will be able to replace 74% and 220% of the
energy requirements in the UK and Iraq due to their
flexibility and larger areas where they can be utilized.
Using flexible organic solar cells will lower costs, and
with larger areas possible, this technology can be
usedwidely in Iraq. They can also be applied to other
countries with similar climate.This study shows that
with increasingly advanced new technology becoming
available and greater efficiencies being made with
solar cells, the opportunities to utilize these will
provide benefit both to society and the environment.
References
[1] Griffin, P. W., Hammond, G. P., Ng, K. R., and Norman, J. B. 2012. “Impact Review of Past UK Public Industrial Energy Efficiency RD & Amp; Dprogrammes.” Energy Conversion and Management 60: 243-250.
[2] Tsui, K. K. 2011. “More Oil, Less Democracy: Evidence from Worldwide Crude Oil Discoveries.” The Economic Journal 121: 89-115.
[3] Ross, M. L. 2001. “Does Oil Hinder Democracy?” World Politics 53: 325-361.
[4] Azabany, A., Khan, K., and Ahmed, W. 2014. “Energy

Comparitive Analysis of an SME using Silicon and Flexible Organic Solar Cells as Replacements for Fossil Fuel Sources of Electricity in UK and Kurdistan, Iraq
178
Analysis for Replacing Fossil Fuel Energy Source of Electricity with Solar Cells in the UK and Kurdistan.” Asian Journal of Science and Technology 5 (9): 557-560.
[5] Hoppe, H., and Sariciftci, N. S. 2004. “Organic Solar Cells: An Overview.” Journal of Materials Research 19: 1924-1945.
[6] Pagliaro, M., Ciriminna, R., and Palmisano, G. 2008. “Flexible Solar Cells.” Chem. Sus. Chem. 1: 880-891.
[7] Brabec, C., Scherf, U., and Dyakonov, V. 2014. Organic
Photovoltaics: Materials, Device Physics, and Manufacturing Technologies. Weinheim: John Wiley & Sons.
[8] Chopra, K. L., Paulson, P. D., and Dutta, V. 2004. “Thin Film Solar Cells: An Overview.” Progress in Photovoltaics: Research and Applications 12: 69-92.
[9] Al-Mohamad, A. 2004. “Solar Cells Based on Two Organic Layers.” Energy Conversion and Management 45: 2661-2665.

Journal of Environmental Science and Engineering B 5 (2016) 179-188 doi:10.17265/2162-5263/2016.04.004
Semi-automatic Building Extraction from Quickbird
Imagery
Selassie David Mayunga
School of Geospatial Sciences and Technology, Ardhi University, Dar Es Salaam 35176, Tanzania
Abstract: Automatic extraction features and buildings in particular from digital images is one of the most complex and challenging task faced by computer vision and photogrammetric communities. Extracted buildings are required for varieties of applications including urban planning, creation of GIS databases and development of urban city models for taxation. For decades, extraction of features has been done by photogrammetric methods using stereo plotters and digital work stations. Photogrammetric methods are tedious, manually operated and require well-trained personnel. In recent years, there has been emergence of high-resolution space borne images, which have disclosed a large number of new opportunities for medium and large-scale topographic mapping. In this paper, a semi-automatic method is introduced to extract buildings in planned and informal settlements in urban areas from high resolution imagery. The proposed method uses modified snakes model and radial casting algorithm to initialize snakes contours and refinement of building outlines. The extraction rate is 91 percent as demonstrated by examples over selected test areas. The potential, limitations and future work is discussed.
Key words: High-resolution imagery, building extraction, informal settlements, snakes models.
1. Introduction
Automatic extraction of features from digital
images is one of the most complex and challenging
task faced by computer vision and photogrammetric
communities. Feature extraction and buildings in
particular are required for varieties of applications
such as urban planning, creation and updating of
Geographic Information Systems databases and
creation of urban city models for taxation. In practice,
the extraction of buildings from digital images is
complex because buildings particularly in dense urban
areas, which have complex forms and roofs of various
compositional materials. For decade’s extraction of
features in the developing world, it has been manually
used stereo plotters or occasionally digital
workstations. Manual based building extraction is
slow, expensive and requires well-trained operators.
However, for rapid urbanizing and high-densely urban
areas, it becomes even more difficult [1].
Numerous efforts have been made in the past two
Corresponding author: Selassie David Mayunga, Ph.D.,
research fields: geodesy and geomatics engineering.
decades to automate building extraction from digital
images [2-4]. Fully automatic feature extraction
systems are limited to specific applications and not yet
operational [5]. In the absence of fully automatic
systems, semi-automatic systems seem to be an
alternative solution [6] for feature extraction. In recent
years, there has been emergence of high-resolution
space borne images, which have shown potential for
medium and large-scale mapping in urban areas [7]. In
order to effectively utilize the availability of high
resolution satellite images, new techniques and tools
are urgently required.
In this paper, an effective semi-automatic method is
introduced to extracts buildings in planned and
informal settlements in urban areas by measuring a
single point on the approximate centre of the building.
Then, after a radial casting, algorithm is invoked to
initialize the snakes contour and refinement of the
building outlines.
1.1 Related Works/Previous Work
In an effort to make building extraction processes
efficient, various attempts to automate building
D DAVID PUBLISHING

Semi-automatic Building Extraction from Quickbird Imagery
180
extraction processes have been reported in the past
two decades. However, existing automated building
extraction techniques are still operating at a very
rudimentary level [8]. One first difficulty for
automated building extraction is caused by image
variation in terms of type, scale and required level of
detail [9]. Secondly, automatic recognition of semantic
information of an object using computers is very
difficult as existing automatic algorithms tend to fail
whenever a new situation on the image is encountered.
A well-extracted building requires well interpretation
of the image to recognize its location and extent, and
then automated processes are employed.
Sohn, G. and Dowman, I. [10] proposed an
automatic method of extracting buildings in densely
urban areas from IKONOS images. In their study,
large detached buildings were used but there was no
analysis on the accuracy and modeling of the
structures. Fraser, C. S. et al. [11] compared buildings
extracted from IKONOS imagery with those obtained
using black and white aerial photographs to evaluate
the potential of high-resolution images. Toutin, T.,
and Cheng, P. [12] investigated the potential of
quickbird image for spatial data acquisition and
showed that quickbird sensors of 0.6 m have narrowed
the gap between satellite images and aerial
photographs for large scale mapping. In the same
perspective, Thomas, N., Hendrix, C., and Goglton, R.
[13] assessed three different classification methods for
extracting land cover information from
high-resolution images. In their investigations, it was
concluded that high-resolution satellite imagery is a
valuable tool for large scale mapping urban areas. In
the absence of automatic building extraction systems,
semi-automatic systems seem to be an alternative
solution for feature extraction [14].
Semi-automatic building extraction methods have
been investigated by photogrammetry communities
and computer vision experts for more than two
decades, although most of the existing methods are
limited to specific applications. Brunn, A., and
Weidner, U. [15] used building detection and building
reconstruction techniques to extract buildings,
however, these tasks are tedious as cannot be
combined. The application of geometrical
representation with rectangular models developed by
Weidner, U., and Ballard, C. et al. [16, 17] used
multiple images and polyhedral shapes to describe
building outlines. Generally, most of the existing
semi-automatic methods referred above work well
where buildings are assumed to follow a certain
pattern or code. Therefore, using such methods in
areas where buildings does not follow any particular
pattern or code especially in informal settlements
areas cannot provide realistic results [18]. Buildings in
informal settlements areas are made of diverse
materials, very close to each other, have complex
structures and have no proper orientation which makes
the extraction process very difficult. Informal
settlements are commonly found in the developing
world and accounts from 60 percent to 70 percent of
buildings in urban areas. In Tanzania, for example,
about 70 percent of buildings in urban areas are in
informal settlements.
There have been very limited attempts to develop
tools and methods to extract buildings in informal
settlements areas as compared to the research efforts
made to extract buildings in planned settlements.
Recent efforts include collection of social and spatial
information, used fused shadow data with 2D building
blobs derived from normalized Digital Surface Model
(DSM) and the use of still video camera (DCS460c) to
extract shacks in South Africa [19]. A method
developed by Li, J., and Ruther, S. H. [20] used DSM,
shadow and linear feature data derived from low-cost
small-format digital imagery to extract buildings in
informal settlements.
A common feature for building extraction methods
referred above, achieves their extraction process
utilizes a DSM or DEM. The main disadvantages of
using DSM and DEM generated by image matching
technique includes insufficient ground sampling data

Semi-automatic Building Extraction from Quickbird Imagery
181
and matching errors caused by poor image quality,
occlusion and shadows which leads to poor definition
of buildings outlines [21]. For the technology to be
effective, it must be able to extract buildings both in
planned and informal settlements. Active contour
models or commonly known as “snake’s models” at
present seem to be an alternative and useful model to
extract buildings in informal settlements.
1.2 Existing Snake’s Models
Active contour models also known as “snake’s
model” was first introduced by Kaas, M., Witkin, A.,
and Terzopoulos, D. [22]. In the theory of snakes, the
control points on the closed curve are guided by active
contour models, which minimized a weighted
combination of internal, image and external energy
forces. The internal energy force describes the shape
of the snake. The image force attracts the snakes to the
boundaries of the object, while the external energy
force comes from the image itself or a higher level of
image processing. The solution of the snake’s models
are activated by its intrinsic trend of minimizing its
energies. The function is defined in such a way that its
energy reaches minimum when the snakes control
points locks the boundaries of an object.
Kaas, M., Witkin, A., and Terzopoulos, D. [22]
represented a contour by a vector, v(s) = [x(s), y(s)],
having the arc length s as a parameter, where x and y
are the coordinates of a snakes contour point. The
snake model is represented in Eq. (1):
(1)
Where: E is the total energy of the snake, is
internal energy formed by the snake configuration.
(2)
is the sum of the contour geometric constraints,
defined in Eq. (2), where is the continuity
energy. Minimizing over all the snake control
points causes the snake control points become more
equidistant. is the contour curvature energy.
The smoother the contour is, the less is the curvature
energy.
From Eq. (1), is the external energy and can
be defined as Eq. (3):
(3)
Where, is the image energy, which can be
the image intensity or intensity gradient, and is
external constraint, variable constraints which can be
introduced into snake’s model. For each control point
on snake contour, its total energy can be represented
as described in Eq. (4).
(4)
Where, , , µ are the weights of every
kind of energy.
1.3 Limitation of Existing Snake’s Models
There are limitations on the use of snake’s model
for building extraction which have not yet completely
solved. For example, it is difficult to determine the
appropriate weighted coefficients of the energy
functions which cause bunching up of snake’s points
on an image. Also, there is no simple way of
initializing snakes contours. Several approaches have
been proposed to remedy the above-mentioned
limitations. For example, Trinder, J., and Li, H. [23]
used snake’s model and least squares to extract
buildings in 2D and 3D using aerial photography and
satellite images. Cohen, L. D. [24] used pressure force
to control the movement of snake’s contour. Although
these modified methods works well in many cases, but
the parameters that controls the inflating force of the
contour is not easy to set especially for high level of
noise in the image.
Tabb, K. [25] combined snakes and neural networks
to a different position of control point on the contours
detect and categorize objects in images. In this
approach, a snake’s contour is stored as a vector of (x,
y) coordinates and each (x, y) coordinate reflecting
spline. Then the coordinates are used as input into the
neural network.
Kreschner, M. [26] used homologous twin snakes
and integrated in a bundle adjustment to extract
buildings. This technique often fails when a wrong

Semi-automatic Building Extraction from Quickbird Imagery
182
snake’s contour is selected. Ruther, H., Hagai, M., and
Mtalo, E. G. [27] used snakes and dynamic
programming optimization technique to model
buildings in informal settlement areas. However, the
dynamic programming is computational expensive
and occasionally fails to determine the exact shape of
the buildings. Guo, T., and Yasuoka, Y. [28] adopted
“balloon snake’s model” with Multiple Height Bin
(MHB) technique to obtain the approximate snakes
contour. However, the MHB technique could not
provide correct representation of the extracted
building contour.
1.4 Improved Snake’s Model for Energy Minimization
Function
In attempt to solve the limitations of snake’s model
as described above, an improved snake’s model is
introduced whereby a snakes external energy term that
is disregarded, which creates boundary effects for
buildings. Instead, the weighted coefficients
, , and are fixed to allow a uniform strength
of the snakes energy terms. The improved snake’s
algorithm for building extraction in planned and
informal settlements is represented in Eq. (4):
(5)
Where, and are energy terms as
expressed in Eq. (1). The first and second internal
energy terms are briefly described in discrete form:
(1) Continuity term
Let be a snake’s control point on an
image space, from Eq. (4), continuity term is
expressed as in Eq. (5):
| | (5)
Where, is the mean distance between two snake’s
control points and it is expressed as in Eq. (6):
∑ (6)
Where, is the number of control points. This
term constrained the snake’s control points to have
equally spaced avoiding points to be grouped in one
point and at the same time, minimizing the distance
among these points.
(2) Curvature term
This term expresses the curvature of the snake’s
control points and smoothness of the snake’s contour
and mathematically is defined as in Eq. (7):
| 2 | (7)
(3) Image term
The image term describes the radiometric content of
the image and it restricts the snake’s control points to
move towards the points of highest gradient. The
gradient of image at each control point is normalized
to show small differences in values at the
neighborhood of that control point. In this case, the
gradient magnitude is negative to enable control
points with large gradient to have small values. An
expression of the image term is defined as in Eq. (8):
(8)
Where, is the image energy term, is the
minimum gradient magnitude in the neighborhood
is the gradient magnitude at each control point,
and is the maximum gradient magnitude in the
neighborhood. The image energy terms described
above attract the snakes to the image points with
minimum gradient magnitude.
1.5 Radial Casting Algorithm
In order to overcome the limitations of snake’s
model, a radial casting algorithm is developed to
initialize the snake’s control points. A single seed
point called Centre (C) is measured at approximate
centre of each building. The radial lines from this
point grow radically to lock the building outlines. The
radial casting lines are shown in Fig. 1.
For each seed point (C):
(1) The contour’s centre point C is measured and
from this point, radial lines are projected outwards at
definable angular intervals. The angular interval
consists of four, eight or sixteen radial lines ranging
from 0°-360°. The number of radial lines depends on
the complexity of the building;

Semi-automatic Building Extraction from Quickbird Imagery
183
Fig. 1 The radial line representation.
(2) The distances of radial lines joining the central
point C in the snake’s contour is computed. The radial
line is termed as the l’s line;
(3) The centre point C of the building polygon is
always fixed and the radial distances to the snake’s
control points which is variable depending on the size
of the building object. Several different radial lines
were tested to identify an optimal number of lines
suitable for building extraction in informal settlement
areas. Following this experiment and based on the
dynamics of buildings in informal settlements, 8 and
13 radial lines for simple and complex buildings
respectively were adopted as an optimal number of
lines for this application;
(4) Each snake’s control point in image space,
advance to a new position where the gradient energy
in a search window is maximum.
During radiation process of the snake’s control
points from point C, it is possible that the snake’s
curve becomes smaller than desired. If this happens,
the generated snake’s control points can be deleted
and a new centre point C can be established.
2. Materials
In this method, there are two main processes: image
pre-processing and building extraction.
2.1 Image Pre-processing
To process high-resolution satellite images for
subsequent building extraction, the operation aspects
of the image acquisition have to be taken into
consideration [29]. These aspects have effects on the
homogeneity or non-homogeneity of image quality
particularly in high-densely built-up areas. The image
quality is mostly affected by variations in sensor view
angle, sun angle, shadowing and atmospheric conditions
[30]. These effects become worse in areas, where
buildings roofs have various composition materials.
For example, high-resolution images with 8 bits have
a loss of information in shadow or in bright areas [31].
Ross, L. [32] discussed difficulties commonly observed
when dealing with urban shadowed areas. In his study,
he recommended the use of 11-bits image in order to
improve visual interpretation of objects.
l
β
β
β
β
β
C

Semi-automatic Building Extraction from Quickbird Imagery
184
The variation in illumination conditions of the
image, shadows and building density in urban areas
makes it very difficult to distinguish individual
buildings from its surrounding particularly in informal
settlements. In order to solve this problem, a
non-linear anisotropic diffusion model was adopted
and implemented to normalize the noise effects
around the buildings [33]. The diffusion process
establishes a scale-space which normalizes image
noise concentration. The aim of image normalization
is to bring the variation of pixels around the buildings
at the same level. The diffused image is then used as
an input into the modified snake’s algorithm for
subsequent extraction of the building outlines.
2.2 Building Extraction
To effectively extract buildings using snake’s models
and radial casting algorithm, an operator measures a
single point at the approximate at the centre of the
building in the image space and then the snake’s
points along the contour are automatically generated.
As soon as the snake’s points are generated, the
operator has an option to accept or reject the snake’s
contour. In the event of rejecting a snake’s contour, a
single snake’s contour or all generated snake’s
contours can be deleted. Conversely, if the snake
contour is accepted, then a minimization function is
invoked, and for each snakes, control point at 3 × 3
search window whereby the minimum and maximum
energy values in the neighborhood are computed. This
process is iterative and at the end, the point with a
minimum energy is selected as a new position in the
image space and a final solution is reached when
snakes contour locks the building outline.
3. Results and Discussion
3.1 Data Used and Studied Area
The method developed in this study was applied to
extract buildings from informal settlements in Dar Es
Salaam city, Tanzania and on planned area of
Oromocto, Township in New Brunswick to compare
the effectiveness of this method.
3.2 Building Extraction Results
The snake’s model and radial casting algorithm
have been implemented whereby Fig. 2a shows
extracted buildings in informal settlement and Fig. 2b
shows the result of building extraction in vector layer.
Fig. 3 shows extracted buildings in planned area.
It is worth to mention that most of the buildings
outline from informal settlements (Fig. 2) and planned
settlements (Fig. 3) areas were well extracted.
3.3 Analysis of the Results
In this study, the qualitative and quantitative
analysis was performed to compare the extracted
buildings using snakes and radial casting algorithm
with the results obtained by manual plotted using
photogrammetric analytical plotter.
3.3.1 Qualitative Analysis
In the qualitative analysis, the objective was to
determine the practicability of the proposed approach
whereby a building extracted percentage rate which is
calculated. For this metric, a modified form of
approach used by Avrahami, Y. [34] has been applied.
In the model, a weighted parameter k = 0.5 for
buildings partially mapped was used to compute the
extraction percentage rate. Since the extraction
process was carried out in the same environment, each
parameter in the model has equal contribution to the
final computation of the building extraction rate. In
the modified form, the building extraction rate is
expressed as in Eq. (9):
(9)
Where, BER is the Building Extraction Rate, BCE
is the Building Correctly Extracted, BPE is the
number of Buildings Partially Extracted and BNE is
number of Buildings not extracted. Table 1 presents
the extraction rate in each test area. These results
show that from three test areas, buildings were
extracted at 93.6 percentage rates.

Semi-automatic Building Extraction from Quickbird Imagery
185
3.3.2 Quantitative Analysis
In quantitative analysis, building corner points from
2D vector layer were randomly selected and measured.
The measured points were compared with their
corresponding points measured from photogrammetric
method. A total of 20 points were measured from test
area 1 as shown in Table 2.
From 20 randomly measured points, the mean Root
Mean Square Error (RMSE) was computed to
determine the internal accuracy of the measurement.
The standard deviations in x and y were also computed
as summarized in Table 2. The results showed that the
standard deviations are 0.80 m and 0.98 m in x and y
respectively. However, it is important to mention that
the proposed method has not been able to clearly
define building corners for some buildings in the same
(a)
(b)
Fig. 2 (a) Extracted buildings from informal settlements and (b) Extracted buildings polygons (from vector layer).

Semi-automatic Building Extraction from Quickbird Imagery
186
Fig. 3 Extracted buildings from planned settlements (Oromoncto area).
Table 1 Building extraction percentage rate from three test areas.
Test area 1 Test area 2
BCE 74 36
BPE 4 1
BNE 2 1
Extraction rate 92.5 94.7
Table 2 The RMSE and deviations of randomly measured building corner points.
Test areas No. of points RMSE (m) Std. Dev. in (x) Std. Dev. in (y)
Dar es salaam test area 20 1.22 0.8 0.98
Table 3 Time used to extract a single building in the test areas.
Time used to extract a single building Time used for each building (in seconds)
Semi-automatic Manually plotted using photogrammetric technique
Scene navigation 34 37
Building extraction 10 20
Total time used 44 57
manner as appeared from ground truth data. The
possible reason could be the closeness of buildings in
informal settlements as well as the resolution of the
image. The higher random noise effects in
high-resolution imagery causes edges of the building
along the corner of buildings to wobble from their
correct positions.
3.3.3 Comparison on Time Used to Extract Building
The time used to extract a single building consists
of the parameters:
(1) Scene navigation;
(2) Building extraction.
The aim of this test was to provide an indication of
the efficiency of extracting a single building between
modified snake’s model and manual system. Scene
navigation time is recorded when the human operator
is interacting with the image before building extraction
process and building extraction time which is the actual
time used to extract a single building. The recorded
time during experiment is illustrated in Table 3.

Semi-automatic Building Extraction from Quickbird Imagery
187
Based on the same level of details extracted
between manual and semi-automated processes, it was
revealed that the semi-automated process developed in
this study reduced the time to extract a single building
by about 23%.
4. Conclusions
This paper demonstrates that the modified snake’s
models and radial casting algorithm improved the
extraction rate by 23%, and delivered a significant
result of building extraction from high-resolution
satellite imagery. This method shows that, for all tests,
areas buildings with different shapes and orientation
were extracted with reliable accuracy.
In addition, the minimum time used to extract a
single building using conventional photogrammetric
method is 57 seconds as reported by Ruzgienė, B. [35].
However, by using snake’s models and radial casting
algorithm, a single building can be extracted for 44
seconds only. This extraction time is significantly
smaller as compared to conventional photogrammetric
technique. Therefore, it can be reported here that
building extraction using modified snake’s model and
radial casting algorithm can be practically used in
planned as well as in informal settlements areas.
References
[1] Ruther, H., Hagai, M. M., and Mtalo, E. G. 2002. “Application of Snakes and Dynamic Programming Optimization in Modelling of Buildings in Informal Settlement Areas.” ISPRS Journal of Photogrammetry & Remote Sensing 56: 269-282.
[2] Gulch, E. 2000. “Digital Systems for Automated Cartographic Feature Extraction.” International Archieves of Photogrammetry and Remote Sensing and Spatial Information Sciences XXXIII (B2): 241-255.
[3] Baltsavias, E., and Mason S. 1995. Image-Based Reconstruction of Informal Settlements. Berlin: Birkhauser Verlag.
[4] Haverkamp, D. 2003. “Automatic Building Extraction from IKONOS Imagery.” Accessed May 20, 2003. http://www.spaceimaging.com/whitepapers_pdfs /2004/.
[5] Rottensteriner, F. 2001. “Semi-automatic Building Extraction Based on Hybrid Adjustment Using 3D Surface Models and Management of Building Data in a
TIS.” Ph.D. thesis, Institute of Photogrammetry and Remote Sensing Vienna.
[6] Gruen, A. and Wang, X. 1998. “CC-Modeler: A Topology Generator for 3-D City Models.” ISPRS Journal of Photogrammetry and Remote Sensing 53 (5): 286-295.
[7] Toutin, T, P. 2002. “3D Models for High Resolution Images: Examples with Quickbird, IKONOS and EROS.” Photogrammetic Engineering and Remote Sensing 58: 417-422.
[8] Gruen, A. 2000. “Potential and Limitation of High-Resolution Satellite Imagery.” Presented at 21st Asian Conference on Remote Sensing.
[9] Wang, S., and Tseng, Y. H. 2003. “Semi- Automated Building Extraction Based on CSG Model-Image Fitting.” Photogrammetry Engineering & Remote Sensing 69 (2): 171-180.
[10] Sohn, G., and Dowman, I. 2001. “Extraction of Buildings from High-Resolution Satellite Data.” In Automated Extraction of Man-Made Objects from Aerial and Space Images (III), edited by Baltsavias, E., Gruen, A., and Van Gool, L. Lisse: Balkema Publishers.
[11] Fraser, C. S., Baltsavias, E., and Gruen, A. 2002. “Processing of IKONOS Imagery for Submetre 3D Positioning and Building Extraction.” International Journal of Photogrammetry and Remote Sensing 56: 177-194.
[12] Toutin, T., and Cheng, P. 2002. “3D Models for High Resolution Images: Examples with Quickbird, IKONOS and EROS.” Presented at Symposium on Geospatial Theory, Processing and Applications.
[13] Thomas, N., Hendrix, C., and Cogalton, R. G. 2003. “A Comparison of Urban Mapping Methods Using High-Resolution Digital Imagery.” Photogrammetric Engineering and Remote Sensing 69 (9): 963-972.
[14] Rottensteriner, F. 2000. “Semi-automatic Building Extraction based on Hybrid Adjustment using 3D Surface Models and Management of Building Data in a TIS.” Accessed May 20, 2003. http://www.ipf.tuwien.ac.at/fr/buildings/diss/dissertation.html.
[15] Brunn, A., and Weidner, U. 1997. “Extracting Buildings from Digital Surface Models.” International Archieves of Photogrammetry and Remote Sensing 32: 3-4.
[16] Weidner, U., and Forstner, W. 1995. “Towards Automatic Building Extraction from High-Resolution Digital Elevation Models.” International Society of Photogrammetry and Remote Sensing 50 (4): 38-49.
[17] Ballard, C., and Zisserman, A. 2000. “A Plane-Sweep Strategy for the 3D Reconstruction of Buildings from Multiple Images.” IASPRS XXXIII (B2): 56-62.
[18] Ruther, H., Hagai, M. M., and Mtalo, E. G. 2002.

Semi-automatic Building Extraction from Quickbird Imagery
188
“Application of Snakes and Dynamic Programming Optimization in Modeling of Buildings in Informal Settlement Areas.” ISPRS Journal of Photogrammetry and Remote Sensing 56: 269-282.
[19] Barry, M., and Rüther, H. 1999. “Data Collection and Management for Informal Settlements Upgrades.” Accessed May 20, 2003. http://www.fig.net/pub/proceedings/nairobi/barry-ruther-ts13-2.pdf.
[20] Baltsavias, E., and Mason, S. 1997. “Automated Shack Reconstruction Using Integration of Cues in Object Space.” In Proceedings ISPRS Commission III/IV Workshop, 96-105.
[21] Li, J., Mason, S. O., and Rüther, H. 1997. “Experiences in Automated Shack Extraction Using Multispectral Image lassification.” Accessed May 20, 2003. https://www.google.com/?gws_rd=ssl#q=+CONSAS+'97%2C+Durban%2C+South+Africa.
[22] Kaas, M., Witkin, A., and Terzopoulos, D. 1988. “Snakes: Active Contour Models.” International Journal of Computer Vision 1: 321-331.
[23] Trinder, J., and Li, H. 1995. Semi-automatic Feature Extraction by Snakes, Automatic Extraction of Man-Made Objects from Aerialand Space Images. German: Birkhauser Verlang Heidelberg.
[24] Cohen, L. D., and Cohen, I. 1990. “A Finite Element Method Applied to New Active Contour Models and 3-D Reconstruction from Crossing Sections.” In Proceedings of the Third International Conference on Computer Vision, 587-591.
[25] Tabb, K., Davey, N., and Stella, G. 2000. “Analysis of Human Motion Using Snakes and Neural Networks.” Accessed May 20, 2003. http://homepages.feis.herts.ac.uk/~nngroup/pubs/papers/tabb-amdo00.pdf.
[26] Kreschner, M. 2001. “Homologous Twin Snakes Integrated in a Bundle Block Adjustment.” Accessed May 20, 2003. http://www.ipf.tuwien.ac. at/publications/mk_p_isprs98/paper3.html.
[27] Li, J., and Ruther, S. H. 1999. “IS-Modeller: A Low-Cost Image-Based Tool for Informal Settlements Planning, Geoinfomatics.” In 99th Conference Ann. Arbor., 1-9.
[28] Guo, T., and Yasuoka, Y. 2003. “Snake-Based Approach for Building Extraction from High-Resolution Satellite Images and Height Data in Urban Areas.” Accessed May 20 2003. http://www.gisdevelopment.net/aars/acrs/2002/vhr/018.pdf.
[29] Fraser, C. S., Baltsavias, E., and Gruen, A. 2001. “3D Building Reconstruction from High-Resolution Ikonos Stereo-Imagery.” In Automatic Extraction of Man-Made Objects from Aerial and Space Images (III), edited by Baltsavias, E. P., Gruen, A., and Gool, L. V. Tokyo: Balkema Publishers.
[30] Cheng, P.; Toutin, T., and Zhang, Y. 2003. “Quickbird-Geometric Correction, Data Fusion, and Automatic DEM Extraction.” Presented at Proceedings of the Asian Conference on Remote Sensing (ACRS) and International Symposium on Remote Sensing (ISRS) 2003.
[31] Jacobsen, K. 2002. “Comparison of High Resolution Mapping from Space.” Indian Cartographer 22. Accessed May 20, 2003. http://www.ipi.unihannover.de/html/publikationen/2002/paper/hiresspa.pdf.
[32] Rossi, L. 2003. “Satellite High Resolution New Applications: Quickbird.” Accessed May 20, 2003. http://www.date.hu/efita2003/centre/pdf/0605.pdf.
[33] Weickert, J. 1999. “Coherence-Enhancing Diffusion Filtering.” International Journal of Computer Vision 31: 111-127.
[34] Avrahami, Y. R., and Doytsher, Y. Y. 2004. “Semiautomatic 3D Mapping of Buildings From Medium Scale (1:40,000) Aerial Photographs.” In International Society for Photogrammetry and Remote Sensing Commission III Istanbu, 96-105.
[35] Ruzgienė, B. 2004. “Requirements for Aerial Photography.” Geodesy and Cartography 30 (3): 75-79.
Journal of Environmental Science and Engineering B 5 (2016) 189-206 doi:10.17265/2162-5263/2016.04.005
Analytical Architectural Study on Nuclear Power Plants
Mohamed Farahat
Department of Siting and Environment, Egyptian Nuclear and Radiological Regulatory Authority, Cairo 11787, Egypt
Abstract: This paper aims to study the architectural design and components of Nuclear Power Plants (NPPs). It is also focusing on the simulation system. Its main objective is to set general guidelines for architects. They should be aware of the basics of nuclear facilities designs and components. A traditional nuclear power plant consists of a nuclear reactor, a control building, a turbines building, cooling towers, service buildings (an office building & a medical research center) and a nuclear & radiation waste storage building. Bushehr nuclear power plant in Iran and Angra nuclear power plant in Brazil have been chosen as examples. Furthermore, this paper presents design analyses for Bushehr nuclear power plant and Angra nuclear power plant that include design theory (linear design and radial design) and positive & negative aspects of these designs. At the end of this paper, results and recommendations on the architectural and urban aspects of nuclear power plants are revealed. Key words: Analytical study, architectural study, nuclear power plants, nuclear power reactors.
1. Introduction
The nuclear history started in 1934, when the Italian
scientist Erinco Fermi discovered the uranium. The
German scientist Ida Noddack and Erinco Fermi put a
definition of the nuclear energy “the fission of a heavy
nucleus into two middle weight nuclei that produces a
huge amount of energy as a result of a nuclear reaction”
[1].
Nuclear energy is one of the most important factors
for the human development. Energy is the key element
for the flourishing of all civilizations throughout the
human history. Developing countries need to ensure
energy sources in their development plans to use them
properly. The international reserve of oil is 46 years.
The oil reserve in the Middle East is more than 90 years
and it could be less than 10 years in Asia, Europe and
America. So, the imports of oil for these countries will
rise remarkably in the coming decade as a result of
having an oil reserve shortage. It is noticed that the CO2
emissions have been increased due to the human
activities, especially energy generated from coal and
natural gas, and the use of oil products in transportation
and aviation [2].
Corresponding author: Mohamed Farahat, Ph.D., research
field: architecture.
The acid rain is a type of rain that contains various
acids. It has a destructive effect on plants and marine
life. It is mostly formed from nitrogen compounds and
sulfur emanating from human activities. Those
compounds will form acids due to interacting with the
air. In the last decade, many governments work hard on
establishing laws to prevent the emulation of these
acidic components. The main sources of them are the
huge power plants which emulate 70% of sulfur
dioxide and 30% of nitrogen dioxide, transportations
and petroleum industries [3].
Therefore, governments should depend on renewed
sources of energy in building sustainable societies. A
nuclear power plant that generates 1,000 megawatts
needs 26 tons of uranium annually. This amount of
energy needs 1.5 million tons of oil, 2.2 million tons of
coal and 1.1 million tons of natural gas. There is a big
difference between nuclear energy and other sources of
energy [4].
Only three developed countries owned 49% of the
nuclear power plants all over the world: USA, France
and Japan. While, Spain has six nuclear power plants
and nine nuclear reactors which generate 26% of its
electricity. Canada has five nuclear power plants and
nine nuclear reactors which generate 15% of its
electricity. South Korea has four nuclear power plants
D DAVID PUBLISHING

Analytical Architectural Study on Nuclear Power Plants
190
and twenty one nuclear reactors which generate 29% of
its electricity. Sweden has five nuclear power plants
and ten nuclear reactors which generate 45% of its
electricity. As for India, it has seven nuclear power
plants and twenty nuclear reactors (two of them are
under construction) generate 3% of its electricity [4].
The amount of nuclear fuel needed for generating a
big quantity of electric energy is much less than that of
coal or oil. For example, a ton of uranium generates
electric energy much more than millions of barrels of
oil, or millions of tons of coal. In addition, using solar
energy is more expensive than the nuclear energy [4].
For this reason, this paper is important as it reveals the
need to study nuclear installations and give
recommendations to the architects on how to deal with
these vital facilities that have an increasing demand on
the international, regional and national levels. Due to
the situation of the international reserve of non
renewable energy sources and the great potential of the
nuclear energy, the nations should rely on the nuclear
energy on the national and international levels for
sustainable development. This paper presents NPPs
components in details to dissolve the mystery of NPPs.
Also, the paper presents design analyses for Bushehr
nuclear power plant in Iran and Angra nuclear power
plant in Brazil. These analyses include the design
theory (linear design and radial design) and positive &
negative aspects of these designs. Bushehr NPP in Iran
and Angra NPP in Brazil have been established to
contribute in the development of developing countries.
2. Design and Components of a Nuclear Power Plant
Nuclear reactors are huge installations that control
the nuclear fission process and provide suitable
conditions for its continuation without causing
explosions during serial fission. The nuclear reactors
are used for the purposes of power generation and
removal of salts and other minerals from the water.
They are also used in conversion of certain chemical
elements into other elements and create isotopes with
the effectiveness of radiation used in various purposes.
The nuclear reactor could also be defined as an
integrated system where investment serial fission
reaction in production of slow or fast neutrons and
emission of fission heat transmitted by the radiator to
the cooling towers for reuse again, or to the steam
generators (in power reactors) for the production of
steam to rotate the turbines to generate electricity [5].
Nuclear reactors are divided into three main
types [6]:
(1) Educational research reactors;
(2) Commercial research reactors;
(3) Advanced application reactors (high tech).
Research reactors are used to conduct scientific
research and the production of isotopes for medical and
industrial purposes. They are not used for power
generation. At the moment, there are 284 nuclear
research reactors work worldwide in 52 countries.
Research reactors are ranging in capacity between
2 megawatts to 30 megawatts [7]. The power reactors
are used to generate electric power. At the moment,
there are more than 55 nuclear power plants work to
generate nuclear energy which convert into electrical
energy, and the number can be increased as a result of
the expansion in the construction of the reactors due to
the need for power generation. Power reactors are
ranging in capacity between 55 megawatts to 1,200
megawatts [8].
Nuclear reactor has been evolved throughout history
from just a hall to conduct research tests inside a small
research reactor that produces 2 megawatts of power.
To a huge building contains (the entrances, exits,
management and control offices, locked out corridors
and escaping avenues, piping system to control the
reduction or increase of the interaction, treated airtight
concrete core includes the reactor and bars of
interaction, control and safety equipment, electronic
control systems, monitors to follow the interaction,
heavy water stores, pipes of chilled water, steam
outlets, ...... etc.), the architectural design of the reactor
develops with the development of each generation of

Analytical Architectural Study on Nuclear Power Plants
191
reactors. Therefore, the pressurized water reactor needs
a building which has a different design than gas-cooled
reactor [9].
The nuclear fission generates heat. The nuclear
power plants use this generated heat in the reactor
(such as pressurized water reactors, boiling water
reactors, gas-cooled reactors .... etc.), which transfer by
the cooling water of the reactor to the steam generator
in the process of generating steam. The generated
steam passes through turbines to convert the steam
energy into revolving mechanical energy which
operate power generators. Steam comes out of the
turbine to the condenser. The maintenance of the
nuclear reactors is very complex because of their
radioactivities. The determinants of quality are very
strict over the purity of the water to ensure the
maintenance of the boiler from rust and oxidation to
less degree. The nuclear reactor uses enriched uranium
in the form of “pellets” of the fuel. The size of each one
of them is about the size of the currency and its length
is about an inch. The pellets are formed as long bars
known as packets and kept inside the highly insulation
compressed chamber. In many nuclear power plants,
there are immersions for the packages in the water to
keep them cool. Other plants use carbon dioxide or
dissolved metal to cool the reactor core [10].
Linking of the project elements with each other is the
main challenge facing the architect. First, he is required
to determine the main spaces and how to allocate them.
He should provide a link between the services spaces
and the main spaces without affecting their function.
The design of a nuclear power plant should provide a
maximum safety for workers in the reactor, and to
ensure that, they will not have any injuries or problems,
whether in normal operating or in cases of accidents.
This requires the provision of exits for safety and
escape stairs in order to provide instant means of quick
and safe departure. The nature of the existing
equipments inside the plant spaces (such as the main
reactor space) is different. The architect deals with
spaces that have specific heights depending on the
measures designed for reactor installations. Pressure
Water Reactor (PWR) (Fig. 1), for example, differs
from Boiling Water Reactor (BWR) (Fig. 2), which
would require an architect in collaboration with the
main manufacturers of the reactor so that he can master
the design. This is evident in the designs big companies
such as Toshiba, Westinghouse, General, Electric, etc..
These companies provide an architectural design that
accompanies the project.
The design of the nuclear power plant has four
types [11]:
(1) Architectural design: includes architectural
design, landscaping and supervision of the construction
of buildings and finishing works;
(2) Civil design: includes the site implementation
works, concrete and reinforcement works and
supervision of the construction of buildings;
(3) Mechanical design: includes the installation of
pipes and welds works, and installation of the devices,
especially in the reactor;
(4) Electrical design: includes sensors and wiring,
the installation of measuring equipment and
communication equipment with control rooms.
The nuclear power plant consists of:
2.1 Nuclear Reactor
Nuclear reactor includes main spaces such as reactor
space, diesel generators, refueling, the required power
space for the performance of the interaction, the
withdrawal space of this energy, cooling interaction
operations and emergency systems.
Nuclear reactor building is the most important
building of the plant. It is the building in which the
required interaction had been performed. The rest of
buildings are considered to be facilities for it.
Therefore, the designer must provide protection and
safety for the building in the first place, as well as,
working on reducing costs as much as possible. The
Japanese architect who design (Valley Tenssee) reactor
was careful for seismic risk of the region and the
process of securing the building in the first place.

Analytical Architectural Study on Nuclear Power Plants
192
Fig. 1 Pressurized water reactor [12].
Fig. 2 Boiling water reactor [13].
Despite the choice of location in a mountainous area,
the designer was careful not to display any of the
project elements for any surprises.
Design of the reactor building needs to study many
of the views. Reactor building follows functional
buildings used by many users. There is a power
engineer, workers, technicians, scientists and control
building engineers. Many of the staff of these buildings
work for long hours, which makes the designer is
always trying to eliminate negative effect of the
building on the psychology of workers that makes them
feel bored or depressed. So, surrounding the building
with a distinctive landscaping system may be canceling
this sense from the workers in these buildings. The
study of the standards for the reactor building and its
compatibility with the machinery are the most
important factors that should be included in any logical
design [14].
Ideal standards for reactor building spaces [15]:
(1) Reactor pressure vessel
Internal height 21 meters;
Internal diameter 7.10 meters;
Wall thickness 174 mm.
(2) Containment

Analytical Architectural Study on Nuclear Power Plants
193
Height 36.10 meters;
Internal diameter (maximum) 29 meters.
(3) Reacrtor core
Maximum height 3.71 meters;
Internal diameter 5.16 meters.
2.2 Control Building
It has a control room, an automated computer
network associated with the reactor and a reactor
cooling system. The area of the main control room
should not be less than 15 × 15 meters, up to 15 × 30
meters (Fig. 3). This room is often designed in the form
of horseshoe shape.
Control room (Fig. 4) includes three systems:
(1) Follow-up system for the reactor cooling pumps,
the secondary cooling systems and the main system for
the cooling water;
(2) Control system for the level of pressure inside
the reactor, the reactor cooling system and the
emergency operations;
(3) Operating system for the emergency case. In case
of an accident or an emergency, this system should
alert on all workers by using the light clarifying plates
or the audio stimulation [16].
2.3 Turbines Building
It is a building which contains the turbines that
generate the electricity which move directly to the
power network (Fig. 5). It is often placed away from
the reactor. The link between the reactor and the
turbine building is the steam path resulting from the
water boiling by the reaction temperature or energy
path resulting from water boiling. The spaces of the
turbines building are often huge. Turbines are large
equipments to generate electricity. So, the use of Steel
Truss System in construction of the turbines building is
the best.
Turbines building is a building which converts the
generated energy by the interaction into useful energy
for mankind. Turbines building is often designed on
the hangar shape. It also includes control rooms,
Fig. 3 American design of the control room [17].
Fig. 4 Japanese design of the control room [18].
Fig. 5 Turbines for generating electricity [19].
administration rooms, operators’ rooms, maintenance
rooms and storages. Turbines space commensurates
with the size of the turbines. Turbines should be
connected with the electricity distribution centers by
electricity transmission wires [16].
2.4 Cooling Towers
They are special towers to permit the resulting steam
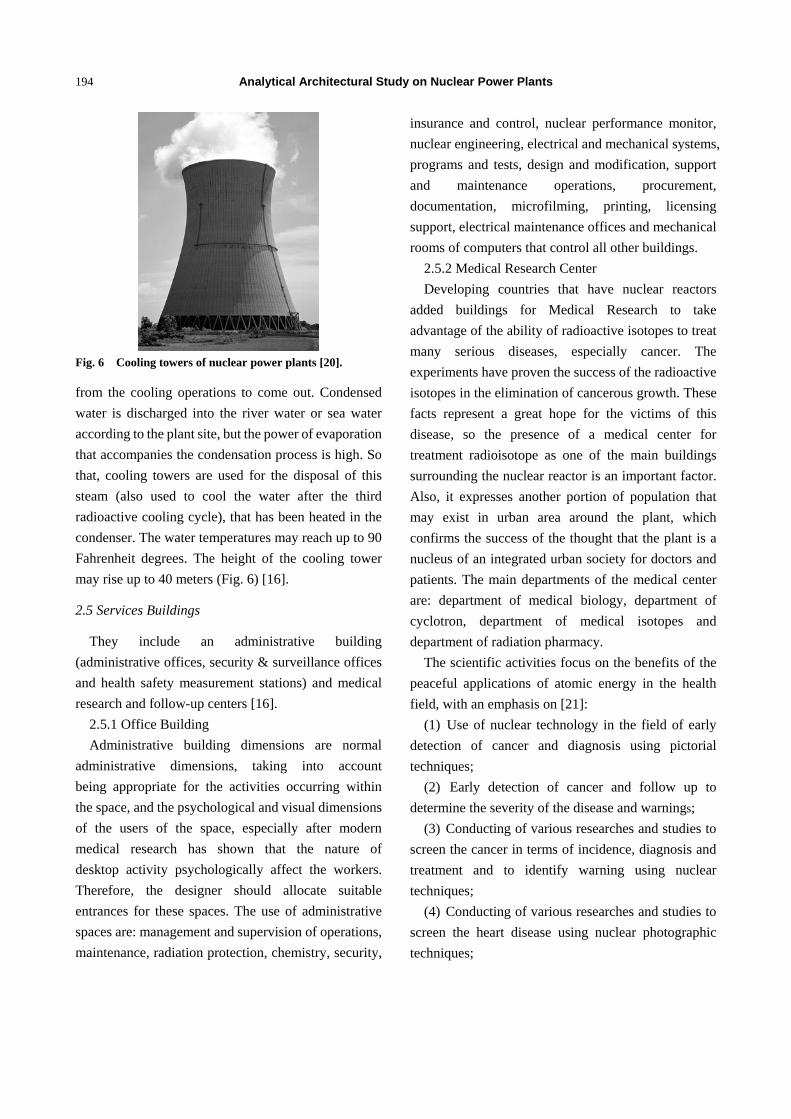
Analytical Architectural Study on Nuclear Power Plants
194
Fig. 6 Cooling towers of nuclear power plants [20].
from the cooling operations to come out. Condensed
water is discharged into the river water or sea water
according to the plant site, but the power of evaporation
that accompanies the condensation process is high. So
that, cooling towers are used for the disposal of this
steam (also used to cool the water after the third
radioactive cooling cycle), that has been heated in the
condenser. The water temperatures may reach up to 90
Fahrenheit degrees. The height of the cooling tower
may rise up to 40 meters (Fig. 6) [16].
2.5 Services Buildings
They include an administrative building
(administrative offices, security & surveillance offices
and health safety measurement stations) and medical
research and follow-up centers [16].
2.5.1 Office Building
Administrative building dimensions are normal
administrative dimensions, taking into account
being appropriate for the activities occurring within
the space, and the psychological and visual dimensions
of the users of the space, especially after modern
medical research has shown that the nature of
desktop activity psychologically affect the workers.
Therefore, the designer should allocate suitable
entrances for these spaces. The use of administrative
spaces are: management and supervision of operations,
maintenance, radiation protection, chemistry, security,
insurance and control, nuclear performance monitor,
nuclear engineering, electrical and mechanical systems,
programs and tests, design and modification, support
and maintenance operations, procurement,
documentation, microfilming, printing, licensing
support, electrical maintenance offices and mechanical
rooms of computers that control all other buildings.
2.5.2 Medical Research Center
Developing countries that have nuclear reactors
added buildings for Medical Research to take
advantage of the ability of radioactive isotopes to treat
many serious diseases, especially cancer. The
experiments have proven the success of the radioactive
isotopes in the elimination of cancerous growth. These
facts represent a great hope for the victims of this
disease, so the presence of a medical center for
treatment radioisotope as one of the main buildings
surrounding the nuclear reactor is an important factor.
Also, it expresses another portion of population that
may exist in urban area around the plant, which
confirms the success of the thought that the plant is a
nucleus of an integrated urban society for doctors and
patients. The main departments of the medical center
are: department of medical biology, department of
cyclotron, department of medical isotopes and
department of radiation pharmacy.
The scientific activities focus on the benefits of the
peaceful applications of atomic energy in the health
field, with an emphasis on [21]:
(1) Use of nuclear technology in the field of early
detection of cancer and diagnosis using pictorial
techniques;
(2) Early detection of cancer and follow up to
determine the severity of the disease and warnings;
(3) Conducting of various researches and studies to
screen the cancer in terms of incidence, diagnosis and
treatment and to identify warning using nuclear
techniques;
(4) Conducting of various researches and studies to
screen the heart disease using nuclear photographic
techniques;

Analytical Architectural Study on Nuclear Power Plants
195
(5) Input of modern nuclear technologies in the field
of nuclear medicine;
(6) Use of radioactive pharmaceuticals in order to
diagnose and treating the various medical conditions;
(7) Production and quality control of isotopes for
positrons and gamma emitters;
(8) Operating and maintenance of cyclotron (a
device for developing the medical isotopes);
(9) Production of new isotopes using Cyclotron and
follow up its various medical applications.
2.6 Nuclear and Radiological Waste Storage Building
It is one of the most important buildings of the
nuclear power plant. It contains solid and liquid waste.
The waste should be reserved in this building for period
up to twenty years before being transported off-site for
the burial in places far away. The waste storage
building should be designed in order to contain all
storage types of waste, whether horizontal or vertical
storage. The waste is a product of nuclear fuel after a
continuous consumption process. Also, there is a liquid
fuel which is placed in containers. There is a vital need
to protect these facilities from terrorist attacks or
natural factors such as earthquakes, hurricanes and
volcanoes [16].
Dimensions of horizontal storage spaces:
Height is 6 meters. Dimensions are not less than 15
meters × 15 meters.
Dimensions of vertical storage spaces:
Height is 10 meters. Dimensions are not less than 25
meters × 25 meters.
Dimensions of storage spaces for containers that
contain radioactive fluids:
Height is not less than 4 meters. Dimensions are not
less than 6 meters × 6 meters.
3. Simulation System (Simulator)
It is one of the most important systems that operate
nuclear reactor system, especially before the full
operation of the reactor operations, or before any
modifications on the operating system of the reactor.
Simulation system is the full operation of the devices of
the reactor (Fig. 7). It is an imaginative process. The
reactor appears in the control room as it is already
working. It can represent an emergency case, and how
to deal with it, such as cases of power outage, stop of
cooling water pumps, a malfunction in the control arms,
etc.. So, the simulation system is the most important
Fig. 7 Simulator within the main control room [23].
(Closed circuit TV)
(Alarm indicators)
(Wide display panels)
(Fixed mimic display)
(Variable display)
(Main control console)
(Flat display)
(Supervisory console)
(Hard switch) panels
(Flat display

Analytical Architectural Study on Nuclear Power Plants
196
program that should be included in the reactor. The
control room workers should be trained to follow up
these experiments to measure the speed of the reaction
in emergency situations and provide external support
via the internet or networks [22].
4. Analytical Architectural Study on Bushehr Nuclear Power Plant in Iran
Bushehr is a city in Iran (Fig. 8). The research
studies Bushehr nuclear power plant. It has been
established for the purpose of energy production,
nuclear researches, medical researches and
desalination of sea water.
4.1 History of Bushehr Nuclear Power Plant
In 1953, Iran’s nuclear program started. Suitable
sites were selected for the establishment of the reactor
(Fig. 9). Tehran Nuclear Research Center (TNRC) was
founded. It contained the first research reactor. Its
capacity was 5 megawatts. In 1967, the center was
inaugurated. The enriched uranium was used in the
reactor. In 1974, Iran decided to begin the construction
of the first nuclear power plant in the city of Bushehr
on the Arab Gulf coast with the capacity of 23
megawatts. It was intended to reach 1,196 megawatts
by the year 1981. In 2007, it started with the capacity of
1,000 megawatts. In 2007, its capacity was reached
1,000 megawatts [24].
Historical overview of Bushehr city [24]:
(1) The nuclear power plant is located on the
Arabian Gulf in south of Bushehr city. It is an industrial
city with a variety of investments;
(2) Bushehr city is located about 1,200 km
southwest of the capital Tehran;
(3) Bushehr province is a densely populated
province (8 million people) and it faces the
Arabian Gulf (Fig. 8). It is one of the most important
provinces;
(4) Bushehr nuclear power plant is designed to
provide Bushehr city with high electric energy and for
the development of industrial projects in the city. It was
Fig. 8 Bushehr province in Iran [25].
Fig. 9 Sites of Iranian nuclear reactors [26].
opened in April 2007 in cooperation with Russia and it
produces 1,000 megawatts.
4.3 Analysis of Bushehr Nuclear Power Plant, Iran
4.3.1 Site selection
(1) Topography and levels
Unpaved flat land and does not have a large
difference in contour and levels (Figs. 10 and 11).
(2) Climatic factors
Deal with climatic element in a traditional way.
(3) Water sources

Analytical Architectural Study on Nuclear Power Plants
197
The nuclear power plant depends on the Arabian
Gulf waters.
4.3.2 Main Function of the Nuclear Power Plant
This nuclear power plant is used for energy
production, nuclear researches, medical researches
and desalination of sea water.
4.3.3 Planning and Design Theories
(1) Layout
Linear design (Fig. 12).
(2) Visual concept
Distinctive visual experience. Its distinction is
partly due to media focus on the design and
uniqueness of performance (Fig. 11).
4.3.4 Analysis of the Urban
(1) Positive impact effects
Site viewing the Arabian Gulf (provides a water
source for cooling operations);
Site is an extension of several urban industrial and
governmental projects;
The project is a nucleus for many industrial and
urban projects;
There is a station in the plant for desalination of
sea water and to provide safe drinking water for the
province.
(2) Negative impact effects
The location is close to the residential area, which
may psychologically affect the residents of the region;
Lack of awareness among the population with
protection plans in case of emergency.
4.3.5 Design Standards (Fig. 13)
(1) Natural environmental systems and preservation
of the environment
Ignore the environmental aspects, and not to exploit
the well featured site of the reactor, with the greatest
emphasis on the functional aspects.
(2) Flexibility and ease of movement in accordance
with the requirements of IAEA
Obtain the flexibility factor and the ease of
movement, according to the reports of International
Atomic Energy Agency.
(3) Radiation protection
Fig. 10 Perspective snapshot of the plant [27].
Fig. 11 Perspective snapshot of the plant [27].
Achieve the protection factor from radiation,
according to the reports of the International Atomic
Energy Agency.
4.3.6 Design Criteria (Fig. 14)
(1) Dominant thought
Economic-functional thought.
(2) Reactor space site
It is situated as a major center for all nuclear power
plant items.
(3) Idea of design
It (linear design) is based on a main axis linking the
two main domes of the two buildings which contain the
two reactors. From the middle of this axis a main axis
has been designed to connect all auxiliary buildings of
the two reactors. The services and activities have been
distributed by this axis on both sides.

Analytical Architectural Study on Nuclear Power Plants
198
Fig. 12 Linear design of Bushehr nuclear power plant, linking the centers of two domes to link the design of two reactors [28].
1. The main road leading to the plant. 2. The plant’s main entrance. 3. The main road leading to the two reactors in the middle of the plant. 4. The first reactor and its attachments. 5. The second reactor and its attachments. 6. The main axis which links between the two centers of the two domes of the nuclear power plant. 7. The alternative road behind the two reactors. 8. The control building. 9. The waste storage building. 10. The Arabian Gulf direction.
Fig. 13 Analysis of layout of Bushehr nuclear power plant [28].

Analytical Architectural Study on Nuclear Power Plants
199
1. The first reactor. 2. The second reactor. 3. The cooling towers leaking the steam resulting from the interaction process. 4. The waste buildings and the main laboratories. 5. The use of planting and good landscaping of the site to give a distinctive character for the plant.
Fig. 14 Analysis of perspective of Bushehr nuclear power plant [29].
(4) Analysis of design concept
Clarity and simplicity-Ease of perception;
Spreading-Pheasant-Ease of distribution;
Relay.
(5) Positive aspects of the design
Good employment of the elements and
components in an integrated framework;
Interest with the insurance operations of the
reactor by changing the tracks. Confirmation of the
overall shape of the design by using a distinctive
dome.
(6) Negative aspects of the design
The extreme adjacency between the two reactors.
(7) Dominant character
The typical design of this type of reactors. The
distinctive dome contributed to the uniqueness of the
design.
5. Analytical Architectural Study on Angra Nuclear Power Plant in Brazil
Angra is a city in Brazil. This research studies Angra
nuclear power plant. It has been established for the
purpose of energy production, nuclear researches,
medical researches and desalination of sea water.
5.1 History of Angra Nuclear Power Plant
In 1970, Brazil decided to build two reactors (Angra
1 and 2) to provide it with its needs of electricity and
the development of researchs in the nuclear field.
Brazil began to develop an advanced nuclear program
and launched an international tender. In 1971, the
company (Westinghouse) had got a license to build the
first reactor (Angra 1). The region had been selected
between Rio de Janeiro city and Sao Paulo city. In 1975,
Brazil decided to become self-sufficient in the field of
nuclear technology. There was a cooperation protocol
between Brazil and West Germany to supply Brazil
with three units of energy production. Their capacity
was 1,300 megawatts. In 1982, the first reactor had
been opened. It produced 626 megawatts. In 2000, the
second reactor (Angra 2) had been opened. It produced
1,270 megawatts (Fig. 15) [30].
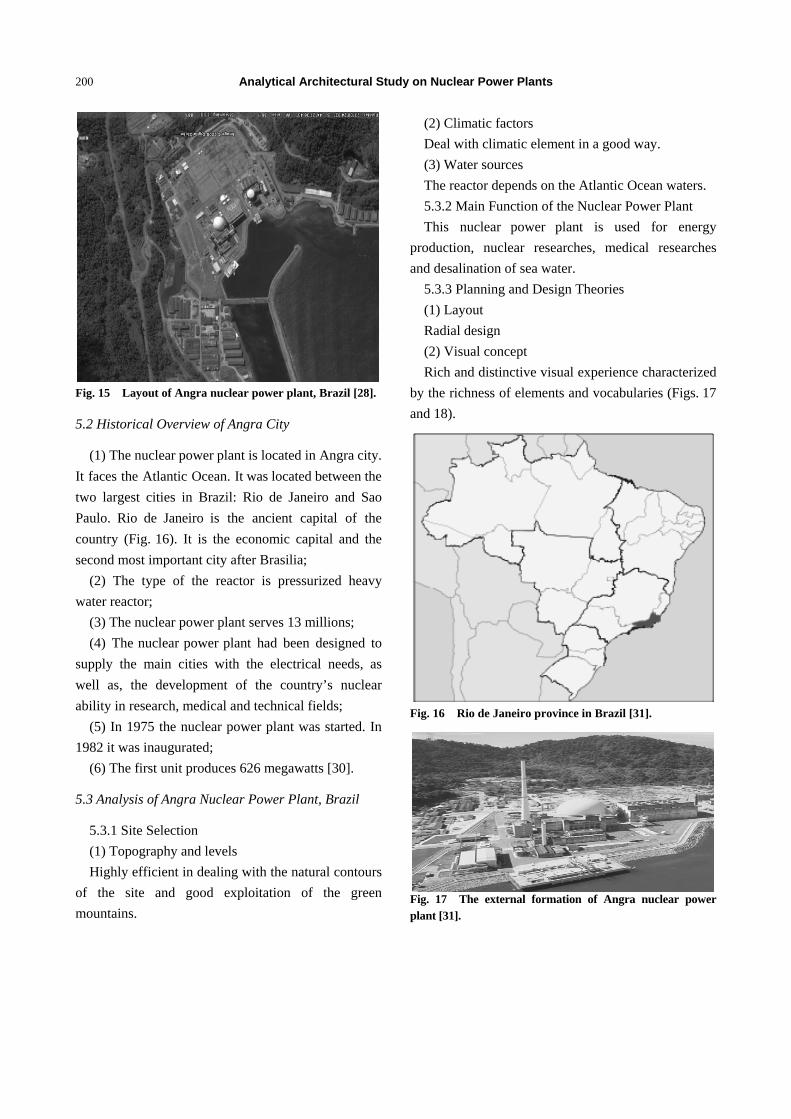
Analytical Architectural Study on Nuclear Power Plants
200
Fig. 15 Layout of Angra nuclear power plant, Brazil [28].
5.2 Historical Overview of Angra City
(1) The nuclear power plant is located in Angra city.
It faces the Atlantic Ocean. It was located between the
two largest cities in Brazil: Rio de Janeiro and Sao
Paulo. Rio de Janeiro is the ancient capital of the
country (Fig. 16). It is the economic capital and the
second most important city after Brasilia;
(2) The type of the reactor is pressurized heavy
water reactor;
(3) The nuclear power plant serves 13 millions;
(4) The nuclear power plant had been designed to
supply the main cities with the electrical needs, as
well as, the development of the country’s nuclear
ability in research, medical and technical fields;
(5) In 1975 the nuclear power plant was started. In
1982 it was inaugurated;
(6) The first unit produces 626 megawatts [30].
5.3 Analysis of Angra Nuclear Power Plant, Brazil
5.3.1 Site Selection
(1) Topography and levels
Highly efficient in dealing with the natural contours
of the site and good exploitation of the green
mountains.
(2) Climatic factors
Deal with climatic element in a good way.
(3) Water sources
The reactor depends on the Atlantic Ocean waters.
5.3.2 Main Function of the Nuclear Power Plant
This nuclear power plant is used for energy
production, nuclear researches, medical researches
and desalination of sea water.
5.3.3 Planning and Design Theories
(1) Layout
Radial design
(2) Visual concept
Rich and distinctive visual experience characterized
by the richness of elements and vocabularies (Figs. 17
and 18).
Fig. 16 Rio de Janeiro province in Brazil [31].
Fig. 17 The external formation of Angra nuclear power plant [31].
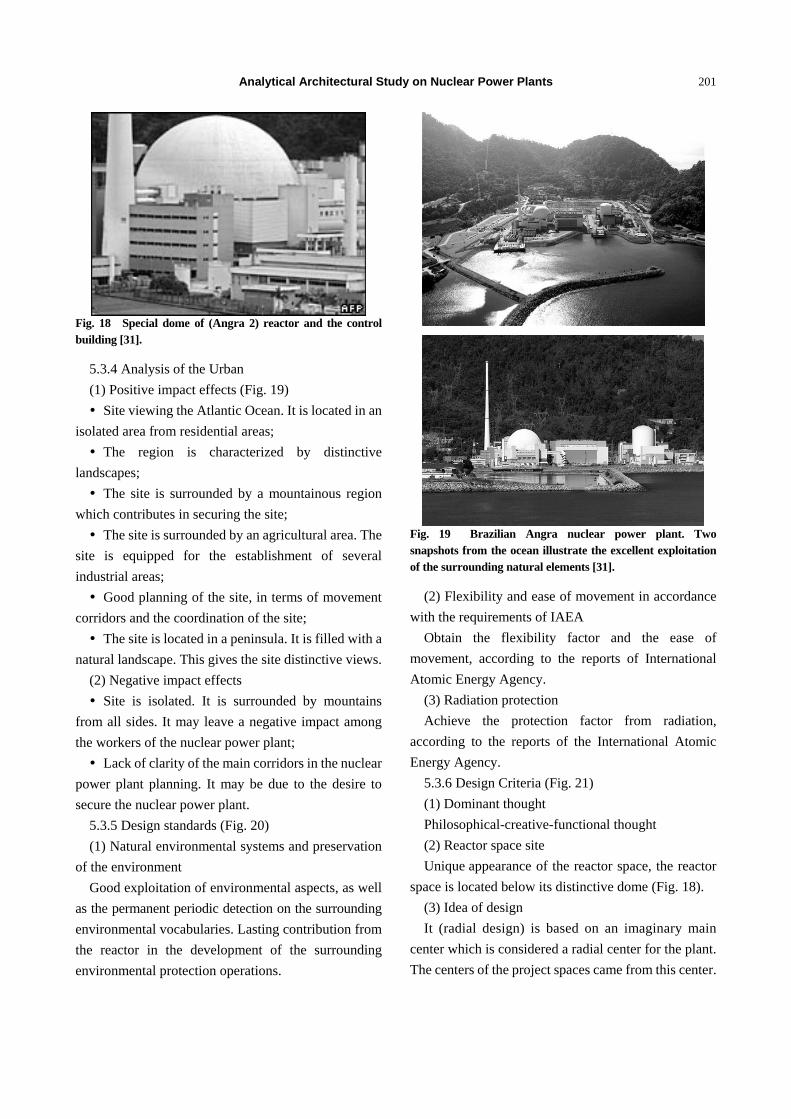
Analytical Architectural Study on Nuclear Power Plants
201
Fig. 18 Special dome of (Angra 2) reactor and the control building [31].
5.3.4 Analysis of the Urban
(1) Positive impact effects (Fig. 19)
Site viewing the Atlantic Ocean. It is located in an
isolated area from residential areas;
The region is characterized by distinctive
landscapes;
The site is surrounded by a mountainous region
which contributes in securing the site;
The site is surrounded by an agricultural area. The
site is equipped for the establishment of several
industrial areas;
Good planning of the site, in terms of movement
corridors and the coordination of the site;
The site is located in a peninsula. It is filled with a
natural landscape. This gives the site distinctive views.
(2) Negative impact effects
Site is isolated. It is surrounded by mountains
from all sides. It may leave a negative impact among
the workers of the nuclear power plant;
Lack of clarity of the main corridors in the nuclear
power plant planning. It may be due to the desire to
secure the nuclear power plant.
5.3.5 Design standards (Fig. 20)
(1) Natural environmental systems and preservation
of the environment
Good exploitation of environmental aspects, as well
as the permanent periodic detection on the surrounding
environmental vocabularies. Lasting contribution from
the reactor in the development of the surrounding
environmental protection operations.
Fig. 19 Brazilian Angra nuclear power plant. Two snapshots from the ocean illustrate the excellent exploitation of the surrounding natural elements [31].
(2) Flexibility and ease of movement in accordance
with the requirements of IAEA
Obtain the flexibility factor and the ease of
movement, according to the reports of International
Atomic Energy Agency.
(3) Radiation protection
Achieve the protection factor from radiation,
according to the reports of the International Atomic
Energy Agency.
5.3.6 Design Criteria (Fig. 21)
(1) Dominant thought
Philosophical-creative-functional thought
(2) Reactor space site
Unique appearance of the reactor space, the reactor
space is located below its distinctive dome (Fig. 18).
(3) Idea of design
It (radial design) is based on an imaginary main
center which is considered a radial center for the plant.
The centers of the project spaces came from this center.

Analytical Architectural Study on Nuclear Power Plants
202
1. The main road leading to the plant. 2. The plant’s main entrance. 3. The main entrance building, the nuclear exhibition and the parking garages. 4. The old reactor (Angra 1) as cylindrical shape. 5. The new reactor (Angra 2) is surrounded by its own services. 6. The station that supply the two reactors with sea water. 7. The turbine building. 8. The conversion of the electrical output to high power. 9. The nuclear research building. 10. The Atlantic Ocean direction.
Fig. 20 Analysis of layout of Angra nuclear power plant, Brazil [28].
Fig. 21 Analysis of perspective of Angra plant, it is completely surrounded by mountains except for the direction of the sea [31].

Analytical Architectural Study on Nuclear Power Plants
203
Table 1 Evaluation of site selection, main function, planning theory, urban factors, design standards and design criteria for Nuclear Power Plants which have different design concept.
Angra NPP Radial C. Grade
Bushehr NPP Linear C. Grade
Proposed Rate (%) Grade
Site selection, main function, planning theory, urban factors, design standards and design criteria
No.
4 3 5 Topography and levels 1
4 3 5 Climatic factors 2
4 4 5 Water sources 3
4 4 5 Main function of the nuclear power plant 4
4 3 5 Visual concept 5
4 3 5 Positive impact effects 6
3 2 5 Negative impact effects 7
8 4 10 Natural environmental systems and preservation of the environment 8
4 3 5 Flexibility and ease of movement in accordance with the requirements of IAEA9
8 8 10 Radiation protection 10
4 3 5 Dominant thought 11
4 3 5 Reactor space site 12
4 2 5 Idea of design 13
9 7 10 Design concept 14
4 3 5 Positive aspects of the design 15
4 3 5 Negative aspects of the design 16
4 3 5 Dominant character 17
80 61 100 Total
There is proximity between the service buildings and
the reactor core. The use is more suitable shape for the
design of the reactor. In spite of the implementation of
the reactor (Angra 2) after many years of the reactor
(Angra 1), the centrality of the design has made the
design balance is linked to the center of the larger
reactor (Angra 2). The design of reactor (Angra 2) is
different from the design of reactor (Angra 1). The
dome was used to cover the reactor (Angra 2) core,
while the cylindrical shape was used to cover the
reactor (Angra 1) core.
(4) Analysis of design concept
Proliferation;
Ease of perception;
Equilibrium;
Pheasant;
The control of the main mass and an easily
realization.
(5) Positive aspects of the design
Good employment of the elements and
components in an integrated framework;
Interest with the insurance operations of the
reactor by changing the tracks. Confirmation of the
overall shape of the design by using a distinctive
dome that covers the reactor core to give a special
uniqueness;
Proximity of the service units from the reactor
core did not decrease the strength of the design. The
reactor building became a one unit;
Change the shape of the second reactor from the
first reactor, characterized the second reactor and
make it visible and unique;
Accuracy of the design, clarity of the passages,
good employment of the services and the exploitation
of the natural landscapes have contributed in the
beauty of the design.
(6) Negative aspects of the design
Change the shape of the second reactor from the
first reactor, caused the obliteration for the design of
the first reactor. It is not appearing due to the strength
of the design of the second reactor (Angra 2);
No distribution of the services away from the
reactor core. No exploitation of the available spaces.
(7) Dominant character

Analytical Architectural Study on Nuclear Power Plants
204
The use of a distinctive dome is to cover the center
of the second reactor. The use of a cylindrical shape is
to cover the first reactor. The company which
implemented the first reactor is different from the
second company. The site has contributed in the
uniqueness and excellence of the design.
It could be observed in Table 1 that Angra Nuclear
Power Plant in Brazil (radial concept) is better than
Bushehr Nuclear Power Plant in Iran (linear concept) in
terms of design and planning, taking into account the
radiation safety considerations. Angra NPP has big
advantages over Bushehr NPP.
6. Results
The design of Bushehr NPP and Angra NPP is
innovative. The linear design of NPPs is distinctive for
its clarity, simplicity, realization, gradualism and easy
distribution. The radial design of NPPs is distinctive
for its clarity, simplicity, realization, equilibrium and
clarity of the main space as a center for the buildings.
Bushehr NPP well utilized the surrounding area to
serve the design and the general layout of the plant.
Bushehr NPP has been established in good agreement
with the climactic aspects according to the site nature
and conditions. Functionally, the design of Bushehr
NPP focused on achieving reasonable rates of spaces
and dimensions, and on the natural aspects of the
surrounding environment (water aspects, terrain, etc.).
Angra NPP has dealt well with surrounding urban
which has been exploited to serve the design. The
impact of surrounding urban has been reflected on the
overall shape of the plant, its vocabulary and its
interaction with the surrounding area. The plant has
dealt accurately and carefully with the climatic
elements depending on the circumstances and the
nature of the site.
Angra NPP has shown keen interest with proportions
of the spaces, good distribution of the services and
good employment of the elements and components in
an integrated manner. The addition of a new reactor
which has a new shape to the plant gives a spirit of
excitement for the plant. Also, ther is clarity, ease of
movement between the activities & the buildings and
keen interest with insurance operations.
Angra NPP tried to be environmental friendly by
establishing an environmental studies and research
center inside the plant and by establishing an exhibition
which explains to the visitors how the plant works for
the development of the region. The treatments, the
materials and the colors have been selected in Angra
NPP. The compatible materials with the surrounding
area have been used which give a good impression to
the plant customers.
Radiation safety is an important aspect in the design
of NPPs. Site selection for placing a NPP is a very
important aspect. Many factors should be taken into
consideration such as topography, levels, climatic
factors, natural environmental systems, water sources,
radiation protection, etc.. NPPs sites should not be
located in or near heavily built-areas and are best
situated in rural or semi-rural districts.
7. Recommendations
The architects are recommended to identify the
suitable sites for constructing NPPs. They are
recommended to clarify the feasibility of establishing
NPPs from urban, architectural and environmental
terms. They are recommended to design the different
types of NPPs.
The architects who design NPPs should be aware of
the nuclear reactors, safety requirements and other
previous designs to produce designs with the required
quality. They should be aware of the standards
approved by the International Atomic Energy Agency.
The architects are recommended to deal with the
buildings of a NPP as one unit controlled by the control
building to serve the main building (the reactor). They
are recommended to be able to work in close
co-operation with other engineers from different
departments.
The architects are recommended to design and plan
the NPPs taking into consideration the radial planning

Analytical Architectural Study on Nuclear Power Plants
205
concept because it is the best with regard to radiation
safety requirements. They are recommended to follow
a scientific approach in designing NPPs and present
ideas that achieve the desired requirement of a good
design that takes all aspect into consideration.
The electricity problem in Egypt can be solved by
nuclear power generation from the plants to be
established. A plan should be set for spreading NPPs in
Egypt with focus on the international experiences in the
field of designing NPPs and establishing cooperation
with countries and companies that have experience in
this field.
The government, while taking a decision of
establishing a NPP is recommended to put
development plans in which a NPP is considered the
base of development. The design of a NPP aims at
improving the surrounding environment.
References
[1] World Nuclear Association. 2015. “Plans for New Reactors Worldwide.” Accessed April 1, 2015. http://www.world-nuclear.org/information-library/current-and-future-generation/plans-for-new-reactors-worldwide.aspx.
[2] OPEC Organisation. 2015. “OPEC Share of World Crude Oil Reserves.” Accessed June 3, 2015. http://www.opec.org/opec_web/en/data_graphs/330.htm.
[3] Weathers, K. C., and Likens, G. E. 2006. “Acid Rain.” In
Environmental and Occupational Medicine, edited by
Rom, W. N., and Markowitz, S. Philadelphia:
Lippincott-Raven Publ..
[4] International Atomic Energy Agency. 2015. “Nuclear
Power: Preparing for the Future.” Accessed October 7,
2015.
https://www.iaea.org/newscenter/statements/nuclear-pow
er-preparing-future-0.
[5] Duderstadt, J. J., and Hamilton, L. J. 1976. Nuclear
Reactor Analysis. San Francisco: Wiley.
[6] World Nuclear Association. 2015. “Advanced Nuclear
Power Reactors-Generation III+ Nuclear Reactors.”
Accessed January 2, 2015. http://www.world-nuclear.
org/information-library/nuclear-fuel-cycle/nuclear-power
-reactors/advanced-nuclear-power-reactors.aspx.
[7] PRIS-Country Statistics. 2015. “Number of Power
Reactors by Country and Status.” Accessed July 5, 2015.
https://www.iaea.org/PRIS/CountryStatistics/CountryStat
isticsLandingPage.aspx.
[8] World Nuclear Association. 2015. “Nuclear Power Plants, World-Wide, Reactor Types.” Accessed March 5, 2015. https://www.euronuclear.org/info/encyclopedia/n/npp-reactor-types.htm.
[9] Tong, L. S. 1988. Principles of Design Improvement for Light Water Reactors. Michigan City: Hemisphere Publication Corp.
[10] World Nuclear Association. 2015. “How Nuclear Power Works? How Stuff Works?” Accessed September 25, 2015. http://science.howstuffworks.com/nuclear-power.htm.
[11] Morgan, J. W., and Exelon N. 2011. “Upgrade Your BWR Recirc Pumps with Adjustable-Speed Drives.” Power: Business and Technology for the Global Generation Industry. Accessed November 15, 2015. http://broom02.revolvy.com/main/index.php?s=Boiling%20water%20reactor&item_type=topic.
[12] Weston, M. S. 2001. Nuclear Reactor Physics. Georgia: Wiley-Interscience Publication.
[13] International Atomic Energy Agency. 2012. Boiling Water Reactor Simulator with Passive Safety Systems. Vienna: IAEA.
[14] US Dept. of Energy. 2015. “Information Bridge: DOE Scientific and Technical Information “OSTI”.” US Dept. of Energy, Office of Scientific and Technical Information, OSTI. Accessed December 9, 2015. http://www.osti.gov/home/collections.html.
[15] Glasstone, S., and Sesonkse, A. 1994. Nuclear Reactor Engineering: Reactor Design Basics. Massachusetts, U.S.A.: Chapman and Hall.
[16] International Atomic Energy Agency. 2004. Construction and Commissioning Experience of Evolutionary Water Cooled Nuclear Power Plants. Vienna: IAEA-TECDOC-1390.
[17] Oak Ridge National Laboratory. 2015. “American Design of the Control Room.” Accessed April 25, 2015. http://web.ornl.gov/info/ornlreview/v38_1_05/article11.shtml.
[18] Daily Mail Online. 2015. “Japanese Design of the Control Room.” Accessed June 7, 2015. http://www.dailymail.co.uk/news/article-3193355/Protests-Japan-opens-nuclear-power-plant-time-Fukushima-disaster.html.
[19] Ask Meta Filter. 2014. “Turbines for Generating Electricity.” Accessed March 19, 2015. http://ask.metafilter.com/266311/Why-do-turbine-halls-have-high-ceilings.
[20] Engineering 360 Powered by IEEE Global Spec.. 2015. “Cooling Towers of Nuclear Power Plants.” Accessed August 5, 2015. http://www.globalspec.com/learnmore/ manufacturing_process_equipment/heat_transfer_equipment/cooling_towers.
[21] International Atomic Energy Agency. 2015. “Benefits of

Analytical Architectural Study on Nuclear Power Plants
206
the Peaceful Applications of Atomic Energy in the Health Field.” Accessed February 12, 2015. https://www.iaea.org/technicalcooperation/Pub/Learn-more-TC/Article1.html.
[22] International Atomic Energy Agency. 1996. Defence in Depth in Nuclear Safety. Vienna: International Nuclear Safety Advisory Group.
[23] Hitachi-GE Nuclear Energy, Ltd.. 2015. “Nuclear Power Plant Simulator.” Accessed October 24, 2015. http://www.hitachi-hgne.co.jp/en/business/examination/simulator/index.html.
[24] WIKIPEDIA-The Free Encyclopedia. 2015. “Nuclear Program of Iran.” Accessed September 17, 2015. https://en.wikipedia.org/wiki/Nuclear_ program _of_Iran.
[25] WIKIMEDIA COMMONS-the Free Media Repository. 2010. “Locator Map Iran Bushehr Province.” Accessed June 12, 2015. https://commons.wikimedia.org/wiki/File: Locator_map_Iran_Bushehr_Province.png.
[26] WIKIPEDIA-The Free Encyclopedia. 2015. “Nuclear Facilities in Iran.” Accessed April 5, 2015. https://en.wikipedia.org/wiki/Nuclear_ facilities _in_Iran.
[27] THE CLARION PROJECT CHALLENGING EXTREMISM I PROMOTING DIALOGUE. 2015. “Bushehr Nuclear Power Plant in Iran.” Accessed August 23, 2015. http://www.clarionproject.org/news/ earthquake-hits-iran-near-bushehr-nuclear-power-plant.
[28] Google Earth. 2015. “Maps of Bushehr Nuclear Power Plant in Iran and Angra Nuclear Power Plant in Brazil.” Accessed July 8, 2015. http://www.google.com/earth/index.html.
[29] FAS Weapons of Mass Destruction around the World. 2015. “Bushehr Nuclear Power Plant” Accessed January 4, 2015. http://fas.org/nuke/guide/iran/facility/bushehr.htm.
[30] WIKIPEDIA-The Free Encyclopedia. 2015. “Nuclear Program of Brazil.” Accessed November 8, 2015. https://en.wikipedia.org/wiki/Nuclear_program_of_Brazil.
[31] Outlook of Brazils Nuclear Energy Industry. 2016. “Angra Nuclear Power Plant in Brazil.” Innovation Norway. Accessed January 2, 2016. https://innovationhouserio.wordpress.com/2016/01/15/outlook-of-brazils-nuclear-energy-industry/.

Journal of Environmental Science and Engineering B5 (2016) 207-214 doi:10.17265/2162-5263/2016.04.006
Coastal Community Welfare of Mining Areain Kotabaru
Regency, South Kalimantan Province
Ahmad Alim Bachri1, Udiansyah1, Nasruddin2 and Deasy Arisanty2
1. Faculty of Economic, Lambung Mangkurat University, Banjarmasin 70123, Indonesia
2. Faculty of Teaching and Education Science, Lambung Mangkurat University, Banjarmasin 70123, Indonesia
Abstract: Kotabaru is richregency in mining and plantations. The sector has contributed to the regional income in the regency. Coastal communities in the area can certainly get the impact which is marked by the increasing prosperity of society. This study used a survey by sampling using questionnaire. The number of samples in this study were 100 respondents who live in the Serakaman village and the Ujung village of Sebuku sub-district, Kotabaru. Companies in the Serakaman village and the Ujung village are Sebuku Iron Lateritic Ores (SILO), Bahari Cakrawala Sebuku (BCS) and Metalindo Bumi Raya (MBR). Analysis stages of welfare based on the level of welfare standards from National Population and Family Planning Board of Indonesia. The results showed the level of welfare in the Sarakaman village and the Ujung village is the welfare stage I and the welfare stage. Although at this welfare stage I and welfare families, the level of education, access to banks and income is still low. The company through its Corporate Social Responsibility (CSR) program is expected to improve the welfare of the community around the company area.
Key words: Welfare, coastal, community, mining.
1. Introduction
Abundant resources and strategies for resource uses
is a determinant of economic growth. The meaning is
the physical factor and a factor in the management of
resource utilization determining economic growth [1].
The resources are abundant marine and coastal region
of Indonesia. The resource has the potential to build a
strong economy for Indonesia [2]. Increased public
economy should be accompanied by increased
prosperity in coastal areas.
Poverty is a state with a lower ability to meet basic
needs such as food, shelter, health and safety [3].
Causes of poverty in coastal areas is the limited of
public revenues, lower public welfare, low investment,
limited employment opportunities and high
unemployment [4].
Number of poverty in Indonesia based on National
Population and Family Planning Board of Indonesia
data decreases every year. Poverty people of Indonesia
Corresponding author: Deasy Arisanty, Ph.D., research
field: geography.
in 2012 are about 29,132 or 11.96%. Poverty people
in year 2013 are about 28,066 or 11.37%. Percentage
of poverty people in south Kalimantan are about
4.77%.
The level of welfare in Indonesia based on National
Population and Family Planning Board of Indonesia
classification are grouped into three stages, namely
pre-welfare stages, welfare family stage I and welfare
family. Pre-welfare families are families who do not
meet their basic needs. Welfare family stages I is a
family that has been able to meet their basic needs but
can not meet the needs of social psychology. Welfare
family is a family that has been able to meet basic
needs, psychological and social development of the
family, but have not been able to contribute to society.
The level of welfare of coastal communities in
mining areas should increase along with the use of
land around their homes. The reality is that there are
still many coastal areas on the poverty line despite the
abundant natural resources [5].
Kotabaru district is a district located in the eastern
part of south Kalimantan province. This district is
D DAVID PUBLISHING

Coastal Community Welfare of Mining Areain Kotabaru Regency, South Kalimantan Province
208
known for its abundance of both marine natural
resources and mining resources. The layout of this
district was strategically located between two large
islands of Kalimantan and Sulawesi. Its strategic
geographic location makes this district become
economically strategic [6-8].
Mining in Kotabaru district are coal and iron ore
which are scattered throughout the district of Kotabaru
[6, 7]. The existence of this company should be able
to have a positive impact on the economy of the
community which in turn can improve the well-being
of coastal communities around the mining area and the
plantation.
2. Research Methods
The method used in this study is a survey method.
Survey region are coastal areas in the mining area in
Kotabaru district which is in district Sebuku. Some
companies in the district Sebuku is Sebuku Iron
Lateritic Ores (SILO), Bahari Cakrawala Sebuku
(BCS) and Metalindo Bumi Raya (MBR). The village
located around the area of this company is Serakaman
village and the Ujung village [6, 7]. The number of
Sebuku residentis 7,650 inhabitants [9]. Samples are
coastal communities in the Serakaman village and
Ujung village which lives > 500 m and < 500 m from
the location of the company. The total number of
samples were 100 respondents, with 50 respondents in
the Serakaman village and 50 respondents in the
Ujungvillage. Serakaman village directly adjacent to
the BCS and MBR companies while Ujung village
directly adjacent to SILO company. The analysis is
based on the criteria of National Population and
Family Planning Board of Indonesia. The variables
and indicators used are:
The basis for determining the level of prosperous
families is based on variable stages of a prosperous
family. If there are criteria that do not meet one
variable at this stage of welfare family, then being
classified into a welfare family stage I. If there is a
variable that does not meet the welfare stage I, then
being classified into pre-welfare stages.
Table 1 Stages of family welfare.
Indicator Sub Indicator
Pre-welfare stages The family did not met one of the indicators for clothing, food, shelter, healthand education.
Welfare family stages 1
To worship according to the religious affiliation of each;
Eat two times a day or more;
Clothes for different purposes;
The house floor is not made of soil;
the sick child is brought to the facility/health workers.
Welfare family stages
Family members regularly practice their religion according to the religious affiliation of each;
At least once a week the family was providing meat/fish/eggs as a side dish;
Obtain a new outfit in the last year;
The floor area per occupant of the house is 8 m²;
Members of a family in a healthy state in the last three months, so that it can perform the function of each;
Families who are 15 years old or older have regular income;
Can read and write for family members of adults aged 10-60 years;
All children aged 7-15 years in school at this time;
Two or more children live and today still use contraceptives;
Families have efforts to increase religious knowledge;
The family have money savings;
Families usually eat together at least once a day;
Participate in community activities;
Families hold recreation at least once in 6 months;
Families can get news from newspapers/radio/television/magazine;
Family members can use the transportation facility.

Coastal Community Welfare of Mining Areain Kotabaru Regency, South Kalimantan Province
209
3. Results and Discussion
3.1. Characteristics of the Region
Sebuku sub-district is geographically located at
03°24’32.2” S and 116°24’25.7” E. Sebuku
sub-district has an area of 245.50 km2. The population
of the sebuku island district is 6,960 inhabitants.
Populous contained in Sekapung village with a
population of 1,506 inhabitants and an average of 41
inhabitants/km2. The population of the Serakaman
village is 819 inhabitants. The largest area of village is
located in the Kanibungan village with an area of 46
km2. Serakaman village have an area of 34 km2, and
the Ujung village have an area of 36.5 km2 [10].
Banjar Tribe is the dominant tribe settled in the
Serakaman village and the Ujung village. The Banjar
tribe has settled about 30 years in the Serakaman
village and the Ujung village. In addition to Banjar
tribe, other tribe that in this region is Bugis. Banjar
and Bugis tribes coexist peacefully and mating occurs
among the different tribes. Intermarriage has led to
acculturation, for example, on the language used in
everyday life, the term substitute name and the
marriage ceremony [10].
BCS has been operating in the District Sebuku in
1997. The mining system is an open system. Mining
area carried out by BCS in 2007 was 9,004 ha with an
area of 5,871 ha being assisted by two contractors:
MBR (2,885 ha) and KM (248 ha), with the permission
of exploitation 3 million tons/year [10, 11]. SILO
began operations in Sebuku Island in 2004 after BCS
[11]. BCS and SILO expands exploitation area to the
Serakaman village in 2010 [11]. BCR has had a
village built as a form of responsibility to the
surrounding community. The village built of BCR is
Serakaman village, Mandin village, Belambus village,
Sekapung village and Kanibungan village [10].
3.2 The Level of Public Welfare in Serakaman Village
3.2.1 Religion and Ethnicity
Religious affiliation of village communities
Serakaman around BCS and MBR companies is islam.
Tribe in the Serakaman village around BCS and MBR
companies is a banjar tribes rate of 92% and 8% of
Bugis tribes. Comunity of Serakaman village around
BCS and MBR companies are devout religious
believers to practice their religion regularly and
improve their knowledge in religion. This means that
the religious villagers in the Serakaman district
Sebuku Island has been good.
3.2.2 Education
The education level of the Serakaman village
community around BCS and MBR companies is the
majority of primary school graduates. The percentage
of primary school graduates is 54%, junior high
school graduates is 16%, high school graduates is
20%and diploma/bachelor is 6%. Serakaman village
community around BCS and MBR companies can
read and write latin despite their education majority
from primary school graduates. In addition, people of
school age in school due to the condition of school
facilities elementary and junior high schools is already
available in the region. This means that the education
community Serakaman village in Sebuku Island
around BCS and MBR companies has been good.
3.2.3 Work and Income
The job of Serakaman village community around
BCS and MBR companies is the majority of
employees. Percentage of employees in companies are
44%, fisherman is 18%, self-employed is 16%,
farmers is 14%, and civil servants is 8%. Percentage
of community income > 1,500,000 is 94%. Percentage
of income < 1,500,000 is 6%. People have a regular
income with diverse types of work and have a
sufficient income to meet their daily needs. Citizens
are able to provide side dishes for food. Citizens are
also able to buy clothes. Low earnings causing some
people can not afford to spend money on recreation.
Approximately 6% of low-income people are not
being able to recreation.
3.2.4 Residential Home
The home stay of serakaman village community

Coastal Community Welfare of Mining Areain Kotabaru Regency, South Kalimantan Province
210
Fig. 1 Administration map of Sebuku Island.
around BCS and MBR companies are majority-owned
whose percentages is 88%. While broad of their
homes are more than 8 m². This means that the
residence in Serakaman village around BCS and MBR
companies is already quite good.
3.2.5 Health
Public health of Serakaman village around BCS and
MBR companies are in good condition, as access to
health services readily available. Clinics distance from
their place is 30-400 meters. Serakaman village
community around BCS and MBR companies in the
last three months is in a healthy state because of
getting the health services, so they can carry out their
respective functions. The community also have used
contraceptives and implemented immunization. This
means that the health of the Serakaman villagers

Coastal Community Welfare of Mining Areain Kotabaru Regency, South Kalimantan Province
211
Fig. 2 Clinic in Serakaman village.
around BCS dan MBR companies is good. The
condition of health facilities in the Serakaman
contained in Fig. 2.
3.2.6 Savings
Majority of Serakaman village community around
BCS dan MBR companies have no savings of money
in bank, but they have the savings in the form of gold.
There are limited access to bank and cultural societies
prefer to save in the form of gold deposits compared
to the savings bank.
3.2.7 Social Capital
Majority of Serakaman village community around
BCS dan MBR companies has participation of mutual
cooperation and security of the region although it is
not scheduled. The Serakaman village communities
are always leaving an open attitude towards migrants.
3.2.8 Information
Information obtained by the public through
television, radio and newspapers. Information from
the television is easily obtained by the public because
they are readily available access to electricity in the
Serakaman village. 100% of the citizens already have
access to electricity. Therefore, people in the
Serakaman village already have a good in gaining
access to information.
3.2.9 Transportation
The road access in Serakaman village around BCS
dan MBR companies is in good condition. The type of
road is hardening. Facility of transportation is a
private motorcycle. This means that the public
transport in Serakaman village around BCS dan MBR
companies is already good.
Category of Serakaman villagers welfare around
BCS dan MBR companies are welfare families stages
I and welfare family. A total of 94% of the public
entrance on the stage of welfare families and 6%
entered the welfare stage I due to about 6% of the
people cannot recreation and have the low income.
Although most people already belong to the group of
welfare families, but need to improve on some aspects,
among others:
(1) Education, still high that society less educated;
(2) Access to bank, bank facilities also need to be in
the region to improve public access to the bank;
(3) Income, public revenue is quite high because
more than 1,500,000.00 rupiah, but the income is still
relatively low when compared with the high cost of
living in the district Sebuku [11].
Assistance by the company in the form of
Corporate Social Responsibility (CSR) program is in
the form of roads, educational facilities, markets,
scholarships, places of worship and health facilities.
Community knowledge of the CSR programs is still
relatively low, only about 8% were aware of CSR
programs, 20% less knowing, and 72% of people do
not know [10]. Meaning is not all people get the
information and assistance regarding CSR program.
The CSR program is not optimally improve the
welfare of the people in the Serakaman village.
3.3 Community Welfare in Ujung Village
3.3.1 Religious and Ethnic
Religious affiliation of Ujung village communities
around the SILO company is Islam. While the tribe in
the Ujung village around SILO company consist of
56% of Banjar ethnic, 42% of Bugis ethnic and 2% of
Madura ethnic. Ujung village community around
SILOcompany is devout religious believers to
practice their religion regularly. This means that
the religious in Ujung village community is already
good.
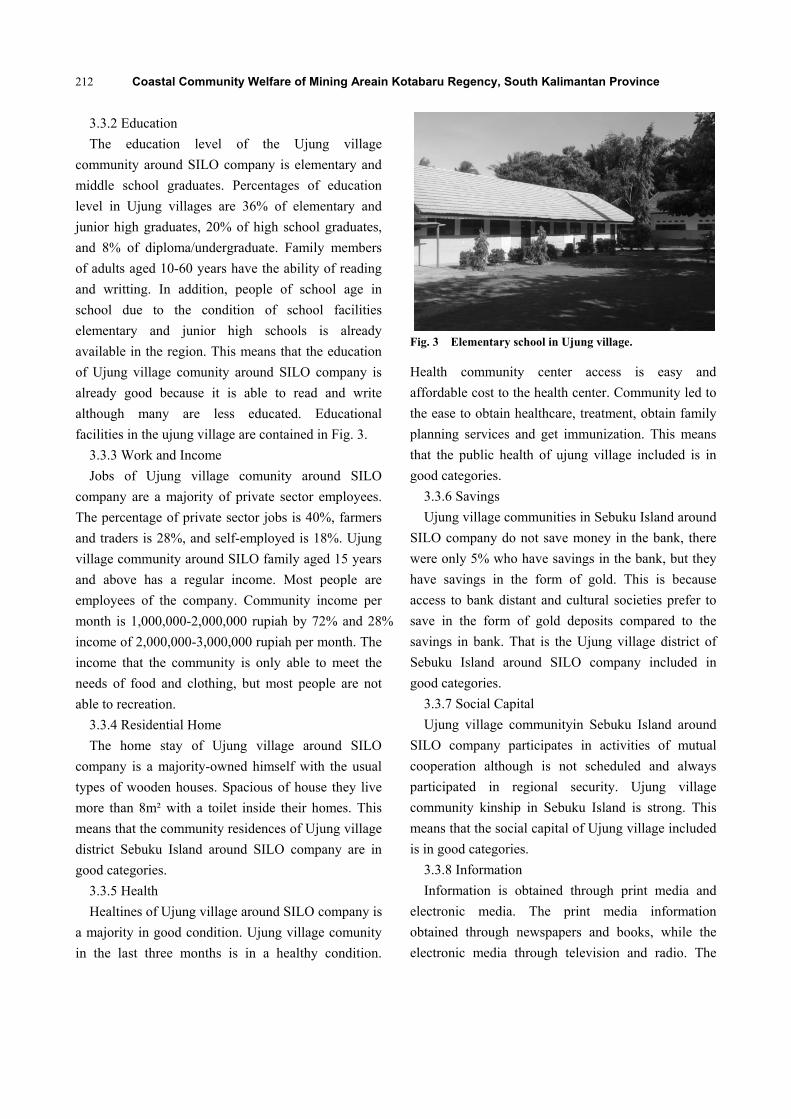
Coastal Community Welfare of Mining Areain Kotabaru Regency, South Kalimantan Province
212
3.3.2 Education
The education level of the Ujung village
community around SILO company is elementary and
middle school graduates. Percentages of education
level in Ujung villages are 36% of elementary and
junior high graduates, 20% of high school graduates,
and 8% of diploma/undergraduate. Family members
of adults aged 10-60 years have the ability of reading
and writting. In addition, people of school age in
school due to the condition of school facilities
elementary and junior high schools is already
available in the region. This means that the education
of Ujung village comunity around SILO company is
already good because it is able to read and write
although many are less educated. Educational
facilities in the ujung village are contained in Fig. 3.
3.3.3 Work and Income
Jobs of Ujung village comunity around SILO
company are a majority of private sector employees.
The percentage of private sector jobs is 40%, farmers
and traders is 28%, and self-employed is 18%. Ujung
village community around SILO family aged 15 years
and above has a regular income. Most people are
employees of the company. Community income per
month is 1,000,000-2,000,000 rupiah by 72% and 28%
income of 2,000,000-3,000,000 rupiah per month. The
income that the community is only able to meet the
needs of food and clothing, but most people are not
able to recreation.
3.3.4 Residential Home
The home stay of Ujung village around SILO
company is a majority-owned himself with the usual
types of wooden houses. Spacious of house they live
more than 8m² with a toilet inside their homes. This
means that the community residences of Ujung village
district Sebuku Island around SILO company are in
good categories.
3.3.5 Health
Healtines of Ujung village around SILO company is
a majority in good condition. Ujung village comunity
in the last three months is in a healthy condition.
Fig. 3 Elementary school in Ujung village.
Health community center access is easy and
affordable cost to the health center. Community led to
the ease to obtain healthcare, treatment, obtain family
planning services and get immunization. This means
that the public health of ujung village included is in
good categories.
3.3.6 Savings
Ujung village communities in Sebuku Island around
SILO company do not save money in the bank, there
were only 5% who have savings in the bank, but they
have savings in the form of gold. This is because
access to bank distant and cultural societies prefer to
save in the form of gold deposits compared to the
savings in bank. That is the Ujung village district of
Sebuku Island around SILO company included in
good categories.
3.3.7 Social Capital
Ujung village communityin Sebuku Island around
SILO company participates in activities of mutual
cooperation although is not scheduled and always
participated in regional security. Ujung village
community kinship in Sebuku Island is strong. This
means that the social capital of Ujung village included
is in good categories.
3.3.8 Information
Information is obtained through print media and
electronic media. The print media information
obtained through newspapers and books, while the
electronic media through television and radio. The
Coastal Community Welfare of Mining Areain Kotabaru Regency, South Kalimantan Province
213
easiest information obtained through the television.
People’s access to television broadcasts is very easy
for this village which also has access to electricity.
Therefore, the Ujung village community to get the
information included in good categories.
3.3.9 Transportation
The road access in Ujung village around SILO
company within easy condition to be passed with the
type of asphalt road. Ujung village community has the
own private motorcycle for transportation. This means
that the public transport in Ujung village included is in
good categories.
Based on several indicators from the National
Population and Family Planning Board of Indonesia,
welfare of the Ujung village community around SILO
community are family welfare stages I and welfare
family which means it can meet its basic needs. A
total of 72% of the society include the category of
welfare stage I and 28% include the category stages of
welfare family. Society has a job and an income. They
have a stable job, and have their own homes despite
the usual kind of wooden houses. The indicators also
strengthened in terms of savings, although the
majority of people do not have savings in the bank,
but they have savings in the form of gold deposits.
The same conditions with Sarakaman villageand the
Ujung village also have problems in education.The
villages are also low bank access and low income.
Although the community is classified in welfare
families stages I and welfare family, but their living
standards are still very low. A total of 36% of the
society is still less educated, 80% of people have little
access to banks, and 72% of people have income <
1,500,000 rupiah [7]. An improvement in the
economic life of the community is to improve the
welfare of society through CSR programs of the
company. The most important point of the CSR
program is to increase society’s ability to survive and
help people out of poverty [12]. Forms of CSR
activities that have a positive correlation with the
welfare of society are the goal of corporate social
responsibility, corporate social issues and corporate
relations program [13]. The fact that occurred in the
Ujung village is 60% of the people are not informed
about the program in the company [10, 14]. Therefore,
CSR program information needs to be disseminated
by the company so that the company’s presence could
affect the economic life of society.
4. Conclusion
The welfare level of Serakaman village around BCS
and MBR companies and Ujung village communities
around SILO company based on indicators from
National Population and Family Planning Board of
Indonesia are welfare families stages I and welfare
family. Although in terms of public education is still
low, the majority only finished elementary school,
they have jobs and incomes. Community has the
house with the usual types of wooden houses. The
majority of people do not have savings in the bank
because the access is difficult, but they have savings
in the form of gold deposits. Access to information
also can be obtained by either, as well as
transportation access.
References
[1] Riana, I. G., Wiagustini, N. L. P., and Meydianawathi, L.
G. 2015. “The Efforts for Coastal Community Welfare
Improvement and Economic Developent Acceleration in
Bali Province.” Journal of the International Association
of Advanced Technology and Science 16: 1.
[2] Tajerin. 2009. “Political Economic Role of Coastal and
Marine Resources Management in Promoting Sustainable
Development.” Mangrove and Coastal Journal 9 (1)
18-28.
[3] Bradshaw, T. K. 2006. “Theories of Poverty and
Anti-Poverty Programs in Community Development.” In
Rural Poverty Research Centre (RPRC) Working Paper,
5-6.
[4] O’Connor, K. 2004. “Understanding and Managing
Coastal Economic Development.” Presented at National
Coastal Symposium.
[5] Sundah Daisy, I. E., Suman Soemano, A., and Kindangen,
P. 2013. “How Coastal Development, Environmental
Change, and Adaptive Behavior Affects Fishermen’s
Welfare? (A Study of Traditional Fishermen from the

Coastal Community Welfare of Mining Areain Kotabaru Regency, South Kalimantan Province
214
Coastal Area of Manado Bay, Indonesia).” IOSR Journal
of Humanities and Social Science 17 (4): 24-34.
[6] Bachri, A. A., and Udiansyah, N., and Arisanty, D. 2014. “Economic Characteristic of Coastal Community at Mining Region, Kotabaru Regency, Indonesia.” Journal of Environmental Science and Engineering A 3: 1-13.
[7] Bachri, A. A., Udiansyah, N., and Arisanty, D. 2014. Management Model of Economic Empowerment in Coastal Area of Mining, Kotabaru Regency, Indonesia. Research report.
[8] Bachri, A. A., Udiansyah, N., and Arisanty, D. 2016. Coastal Community Empowerment in Mining Area of Kotabaru. Banjarmasin, Indonesia: LMU Press.
[9] Central Berau of Statistic (BPS). 2013. “Number of Kotabaru People Based on Gender.” Accessed February 20, 2015. http://kotabarukab.bps.go.id/linkTableDinamis/ view/id/816.
[10] Bachri, A. A., Nasruddin Mattiro, S., Setiadi, D., and Ziyad, M., 2013. Social Mapping of Bahari Cakrawala Sebuku Guidance Villages. Research report.
[11] Hakim, L., Kinseng, R. A., and Agusta, I. 2015. “Mining and Structural Poverty of Small Island Community (Case Study of Rural Community in Sarakaman, Sebuku Island, Kotabaru, South Kalimantan).” Journal of Rural Sociology 3 (1): 24-36.
[12] Ismail, M. 2009. “Corporate Social Responsibility and Its Role in Community Development: An International Perspective.” The Journal of International Social Research 2 (9): 199-209.
[13] Mapisangka, A. 2009. “Implementation of CSR Program for Community Welfare.” JESP 1: 1.
[14] Bachri, A. A., and Nasruddin Mattiro, S. 2014. Study of Community Attitudes and Perceptions about Corporate Social Responsibility (CSR) Program in Kotabaru Regency. Research report.
