journal of composite materials drilling analysis of woven
TRANSCRIPT

JOURNAL OFC O M P O S I T EM AT E R I A L SArticle
Drilling analysis of woven glassfiber-reinforced/epoxy composites
UA Khashaba1, IA El-Sonbaty2, AI Selmy2 and AA Megahed2
Abstract
This article deals with the effect of drilling parameters (feed, speed, and drill pre-wear) on the machinability parameters
(thrust force, torque, peel-up and push-out delaminations, surface roughness, and bearing strength) in drilling woven
glass fiber-reinforced. The results show that at high feeds (0.45 mm/rev), the drill point acts as a punch that pierces the
laminate with approximately constant push-out delamination size irrespective to the value of the thrust force. Surface
roughness increases with the increase of drill pre-wear due to the generated heat that assisted by the low thermal
properties of polymeric composites. Drilling at high feeds reduces the stiffness of the specimens and its ultimate bearing
loads. Artificial neural network and multivariable regression models were developed for predicting the bearing strength
of drilled holes.
Keywords
Composites, drilling, drill pre-wear, thrust force, torque, delamination, surface roughness, bearing strength, neural
networks
Introduction
Machining composite materials is a rather complex taskowing to their heterogeneity, anisotropy, and highabrasiveness of fibers, and it exhibits considerableproblems in drilling process such as delamination,fiber pull-out, hole shrinkage, spalling, fuzzing, andthermal degradation.1 Conventional machiningmethods should be adapted in such a way that theydiminish thermal and mechanical damage. Drillingoperations are extensively used for repairs and/orassembly operations in automotive and aircraft indus-tries. Delamination is often the limiting factor in the useof composite materials for structural applications.In the aircraft industry, 60% of all rejected partsduring final assembly of an aircraft structure were dueto delamination-associated drilling.2 The economicimpact of this is significant, considering the valueassociated with the part when it reaches the assemblystage. Two mechanisms of delamination associatedwith drilling fiber-reinforced plastic (FRP) compositeswere observed, they are known as peel-up at entranceand push-out at exit. In drilling polymeric compositematerials, the thrust force has been cited as the cause ofdelamination by several investigators. The thrust forcecan be controlled through selecting right cuttingparameters,3–6 using special drill bits,7 selecting toolgeometry,6,8 and reducing drill wear.6,9–15
Drill wear is one of the serious problems associatedwith the drilling process of either traditional orcomposite materials, which leads to changes in thecharacteristics of the produced holes and failure ofthe cutting tool. Many experimental techniques havebeen conducted to correlate tool wear with processvariables such as forces,6,9–11 surface finish,9,11 anddelamination.1,12 Due to the difficulties concerning thereliability, calibration, and cost in the use of theseexperimental detection techniques, a considerableattention has been paid in the last years to developand improve the machinability predictionmodels.1,12,16–19 Most of these models have beendevoted to correlate the machining variables (feed,speed, and drill diameter) with the machinabilityparameters (cutting forces, delamination, and surfaceroughness), while some of them were reported to
1Department of Production Engineering and Mechanical Systems Design,
Faculty of Engineering, King Abdulaziz University, Jeddah, Saudi Arabia2Department of Mechanical Design and Production Engineering, Faculty
of Engineering, Zagazig University, Egypt
Corresponding author:
UA Khashaba, Department of Production Engineering and Mechanical
Systems Design, Faculty of Engineering, King Abdulaziz University, P.O.
Box 80200, Jeddah 21589, Saudi Arabia.
Email: [email protected]; [email protected]
Journal of Composite Materials
47(2) 191–205
! The Author(s) 2012
Reprints and permissions:
sagepub.co.uk/journalsPermissions.nav
DOI: 10.1177/0021998312438620
jcm.sagepub.com

predict the effect of drill wear on the machinability ofcomposite materials.1,12
Basically, there are two main regions of tool wearin a cutting tool, i.e. flank wear on the tool flank faceand crater wear on the tool rake face.13 Davim andReis14 found that the delamination factor increaseswith both drilling parameters (cutting velocity andfeed rate) and the carbide drill shows a better wearresistance and hence a better drilling performancethan high-speed steel drill. Chen15 studied the effectof the cutting parameters and tool wear on the delam-ination factor, Fd, for drilling of carbon FRP compos-ite laminates. He concluded that the delaminationfactor increases with increasing flank wear of a drilland the effect of drill wear on Fd becomes significantas the spindle speed increases. The results ofBhattacharyya and Horrigan11 showed that in drillingKevlar composites, the thrust force and surface rough-ness increased gradually with increasing number ofdrilled holes (up to 250 hole), while torque tends todecrease marginally.
Rawat and Attia9 investigated the effect of drill wearon the thrust force and hole quality. They found strongcorrelations exist between the controllable processvariables (cutting and thrust forces) and tool wear aswell as the quality of the final hole (delamination,geometric errors, and surface finish). Finally, theyconcluded that a tool replacement strategy could bedevised by monitoring the cutting forces.
Persson et al.20 investigated the effects of holemachining defects on static strength and fatigue life ofcarbon/epoxy composite laminates. Traditional drillingprocesses were implemented using polycrystallinediamond-tipped drill (PCD) and cemented carbidedrill with a sharp tip angle (Dagger drill). Theyreported that hole machining defects significantlyreduced the static strength of pin-loaded PCDspecimens about 11% compared to defect-free holesspecimens, while this reduction percent become 2–3%for Dagger specimens. The fatigue strength at 106 cycleswas, respectively, reduced to about (19–27%) and(9–11%) for PCD and Dagger specimens compared todefect-free holes specimens. Hamdoun et al.21 showedthe influence of the drilling quality on cyclic compres-sion resistance of a composite material. They reportedthat, the absolute secant modulus of specimens with‘defect-free’ was slightly higher than those of defectedspecimens after 4� 105 cycles. Durao et al.22 investi-gated the influence of delamination on bearing stressof different hybrid laminated composites drilled withdifferent tools. A relation connecting damage ratioand bearing stress was established from the data col-lected during the experimental work done with a corre-lation factor higher than 0.8. This relation indicatesthat delamination extension can be correlated with
bearing stress showing that higher delamination has acorrespondence with lower bearing stresses.
Artificial neural network (ANN) algorithms areregarded as multivariate non-linear analytical toolscapable of recognizing patterns from noisy complexdata and estimating their non-linear relationships.20–24
Their major advantages include superior learning, noisesuppression, and parallel data processing capabilities.23
Further, the network is built directly from experimentaldata by its self-organizing capabilities.24 ANNs havehighly interconnected structure similar to brain cellsof human neural networks and consist of largenumber of simple processing elements called neurons,which are arranged in different layers in the network.Each network consists of input layer, output layer, andone or more hidden layers. One of the well-knownadvantages of ANN, is the ability to learn from thesample set that is called training set in a supervised orunsupervised learning process. Once the architecture ofnetwork is defined, then through learning process,weights are calculated so as to present the desiredoutput.25
In this study, the effect of drilling parameters (feed,speed, and drill pre-wear) on the machinability param-eters in drilling glass-fiber reinforced epoxy (GFRE)composites was investigated. Machinability parameterswere characterized by thrust force, torque, peel-upand push-out delaminations, surface roughness, andbearing strength of the drilled holes. ANN andmultivariable regression (MVR) models were developedfor predicting the machinability parameters of thedrilled holes.
Experimental work
Specimen preparation
Woven E-GFRE composite laminates were manufac-tured using hand lay-up technique. The epoxy matrixwas Araldite LY5138-2 and Hardener HY5138. Detailsabout the manufacturing technique are presented ear-lier, Khashaba.26 Care must be taken when cutting andlaying the woven glass fiber layers. The cutting must bethrough the warp and weft threads to ensure rightangles of all layers. The laminates consist of 25 layerswith 8.3mm thickness. The fiber volume fraction (Vf)was experimentally determined using the ignition tech-nique according to ASTM D3171-99. The averagevalue of Vf was 35%.
Drilling processes
A StankoImport (Moskva—SSSP) radial drill machine,21 spindle rotational speeds (range from 20 to2000 r/min) and 12 longitudinal feeds (range from
192 Journal of Composite Materials 47(2)

0.056 to 2.5mm/revolution), was used for drilling thespecimens. All specimens were drilled using cementedcarbide drill with 8mm diameter. The specimens weredrilled under dry cutting conditions with five spindlespeeds (V¼ 6.41, 12.70, 20.23, 32.04, and 50.64m/min), five feeds (f¼ 0.056, 0.112, 0.22, 0.315, and0.45mm/revolution), and five drill pre-wear values(fresh drill plus four artificially introduced pre-wearvalues; W¼ 0, 7, 19, 26, and 34 g� 10�4). Specimenswere clamped, on the dynamometer, between two pla-tes,each with a center hole of 26mm.
Thrust force and torque measurements
Two components dynamometer, based on strain-gagesensor, has been designed and manufactured to mea-sure the thrust force and torque during the drilling pro-cesses. Details about drilling set-up, and the drilldynamometer are illustrated elsewhere, Khashaba27
and Khashaba et al.28 The experimental results of themeasured thrust force and torque are illustratedin Table 1.
Delamination measurements
The surface delamination was measured using the‘AutoCad method’, which is suitable for quasi-transparent composite materials. Details for thetechnique set-up and the measuring processes are pub-lished earlier, Khashaba.27 The size of the delaminationis defined as the difference between the maximumdamage radius (Rmax) and the drilled hole radius(R¼ 4mm). The results are illustrated in Table 2.
Surface roughness measurements
The surface roughness of the drilled hole wall (Ra) wasmeasured using ‘Rank Taylor Hobson Surtronic 3þ’
Table 1. Experimental results of thrust force and torque in drilling GFRE composites
Speed
m/min
(RPM) Wear (g� 10�4)
Feeds (mm/rev.)
0.056 0.112 0.220 0.315 0.450
Ft (N) T (N.m) Ft (N) T (N.m) Ft (N) T (N.m) Ft (N) T (N.m) Ft (N) T (N.m)
6.41
(255)
0 30.06 0.252 61.71 0.392 89.07 0.590 115.02 0.809 150.41 0.840
7 167.61 0.374 207.14 0.416 269.85 0.724 322.41 0.818 396.17 0.892
19 212.11 0.438 246.11 0.593 333.67 0.833 412.95 0.874 507.46 0.895
26 219.06 0.454 273.06 0.615 383.47 0.855 451.60 0.875 595.69 0.900
34 237.98 0.493 292.27 0.650 398.60 0.890 506.80 0.934 627.37 0.944
12.70
(505)
0 40.15 0.257 58.72 0.377 90.56 0.534 112.13 0.723 141.16 0.800
7 157.56 0.317 201.06 0.404 274.49 0.701 342.28 0.825 431.72 0.874
19 209.01 0.400 265.11 0.480 383.25 0.786 482.62 0.828 590.61 0.946
26 210.12 0.435 265.44 0.505 422.11 0.830 528.77 0.882 649.02 0.921
34 238.94 0.486 297.35 0.560 484.28 0.873 613.79 0.926 772.68 0.966
20.23
(805)
0 27.64 0.150 50.42 0.200 90.00 0.399 114.09 0.612 150.87 0.720
7 153.26 0.329 206.81 0.406 311.92 0.678 381.37 0.809 449.28 0.857
19 202.39 0.447 285.86 0.517 443.20 0.782 532.86 0.881 665.69 0.907
26 204.71 0.436 294.92 0.529 476.44 0.852 612.58 0.878 732.16 0.911
34 264.44 0.479 354.98 0.528 578.68 0.898 717.14 0.931 877.24 0.961
32.04
(1275)
0 39.96 0.186 64.79 0.204 94.48 0.413 120.16 0.729 152.09 0.840
7 156.57 0.256 221.05 0.351 332.02 0.604 391.53 0.758 484.83 0.850
19 223.15 0.399 333.56 0.444 503.27 0.746 631.35 0.852 733.81 0.899
26 224.36 0.428 355.31 0.483 587.40 0.815 716.81 0.873 847.87 0.904
34 273.94 0.463 399.48 0.521 666.68 0.852 820.05 0.941 937.14 0.995
50.64
(2015)
0 44.91 0.171 68.25 0.223 101.39 0.477 123.98 0.763 146.02 0.850
7 168.16 0.365 247.33 0.404 360.39 0.659 423.22 0.822 498.44 0.870
19 268.75 0.356 435.14 0.485 619.31 0.758 704.11 0.886 773.11 0.923
26 300.22 0.409 447.07 0.487 669.88 0.806 801.39 0.876 884.67 0.940
34 328.26 0.459 522.26 0.540 793.06 0.852 903.16 0.909 990.80 1.011
GFRE: glass-fiber reinforced epoxy.
Khashaba et al. 193

Tab
le2.
Experi
menta
lre
sults
of
peel-up
and
push
-out
dela
min
atio
ns
and
surf
ace
rough
ness
indri
lling
GFR
Eco
mposi
tes
Speed
m/m
in
(RPM
)
Wear
(g�
10�
4)
Feeds
(mm
/rev.
)
0.0
56
0.1
12
0.2
20
0.3
15
0.4
50
Del.
(mm
)
Ra
(mm
)
Del.
(mm
)
Ra
(mm
)
Del.
(mm
)
Ra
(mm
)
Del.
(mm
)
Ra
(mm
)
Del.
(mm
)
Ra
(mm
)Peel
Push
Peel
Push
Peel
Push
Peel
Push
Peel
Push
6.4
1
(255)
00.6
33
1.2
91
2.4
50.7
25
1.3
46
2.8
20.7
48
1.5
94
2.9
91.0
72
2.5
56
3.1
31.1
83
2.9
06
3.2
3
71.3
22
1.8
00
4.5
91.3
99
2.2
71
5.3
21.4
26
2.4
00
5.3
41.4
32
2.6
28
5.3
51.4
96
2.9
36
5.4
6
19
1.3
50
2.2
70
5.5
11.4
50
2.3
07
5.5
81.5
00
2.7
38
5.3
51.5
70
2.7
50
5.5
51.6
30
2.9
67
5.6
5
26
1.4
00
2.2
73
6.6
51.4
82
2.4
00
6.6
61.5
33
2.7
51
6.1
61.6
42
2.7
99
6.1
91.7
90
2.9
71
6.2
5
34
1.4
00
2.2
84
7.7
81.4
49
2.5
52
7.8
21.6
24
2.8
33
7.9
21.7
65
2.8
52
7.6
31.8
00
2.9
86
7.9
3
12.7
0
(505)
00.7
30
1.3
45
2.7
10.9
24
1.3
48
2.7
70.9
45
2.3
32
3.0
40.9
50
2.9
25
3.1
11.0
07
3.0
08
3.1
7
71.0
00
2.0
50
4.7
31.1
00
2.2
00
5.0
91.2
00
2.6
22
5.0
71.5
45
2.9
31
5.1
81.5
58
3.1
01
5.3
2
19
1.1
92
1.9
20
5.8
21.1
98
2.3
62
5.8
41.3
07
2.7
37
6.0
11.5
11
2.8
89
6.2
11.5
90
3.1
39
6.5
26
1.1
22
2.1
87
7.0
81.2
46
2.3
46
6.2
31.2
72
2.7
98
6.5
21.4
02
2.9
57
8.0
71.6
00
3.2
19
8.1
4
34
1.2
81
2.2
87
8.0
11.2
81
2.3
60
8.0
71.3
51
3.0
02
8.2
61.5
94
3.0
10
9.1
11.6
39
3.3
08
9.4
5
20.2
3
(805)
00.7
45
1.1
88
2.2
90.9
42
1.2
02
2.5
0.9
40
2.2
75
3.2
80.9
69
2.8
22
3.2
80.9
77
3.4
16
3.8
7
71.0
10
1.8
51
4.6
91.1
00
2.1
76
5.1
91.3
00
2.5
10
5.7
91.4
31
2.8
51
5.7
61.4
58
3.4
51
5.8
9
19
1.1
00
2.2
01
5.7
51.1
20
2.7
26
5.9
51.4
13
2.9
21
5.9
61.5
15
2.9
31
6.0
71.5
70
3.4
51
6.0
6
26
1.1
33
2.4
10
6.4
51.1
50
2.7
71
6.5
51.4
84
2.9
21
6.9
24
1.5
08
3.0
20
7.4
21.6
00
3.5
21
7.8
55
34
1.1
59
2.5
47
7.6
61.2
69
2.8
21
7.3
31.3
45
2.9
12
7.4
31.5
20
2.9
17
8.3
51.6
19
3.6
28
8.4
5
32.0
4
(1275)
00.4
84
1.1
86
2.3
20.5
75
1.2
84
2.5
20.7
58
2.5
38
2.9
50.8
66
2.5
46
4.0
81.0
03
3.2
46
4.5
5
71.0
04
1.7
22
5.8
71.3
00
2.1
79
5.3
91.4
53
2.6
35
5.6
1.4
55
2.7
47
6.2
21.5
11
3.3
00
7.4
9
19
1.3
30
2.1
01
7.0
11.3
60
2.2
17
6.7
1.5
48
2.9
54
6.7
21.5
60
2.9
75
6.5
1.5
60
3.1
99
7.3
83
26
1.3
50
1.7
55
8.4
1.4
00
2.1
52
8.0
51.5
48
2.7
82
8.0
61.5
61
2.8
06
8.1
03
1.5
60
3.2
85
8.8
34
1.3
90
2.2
24
8.1
11.3
90
2.4
53
8.1
41.5
48
2.9
08
7.9
71.5
72
2.9
08
8.1
71.5
74
3.6
00
8.5
7
50.6
4
(2015)
00.5
12
1.1
51
2.5
80.5
72
1.3
07
2.9
50.8
17
2.4
96
3.7
10.8
24
2.5
33
3.7
50.8
66
3.1
29
3.8
1
71.0
11
1.7
09
5.2
35
1.0
52
1.8
76
5.2
51.1
02
2.3
13
5.3
1.1
53
2.6
17
5.6
51.3
01
3.1
60
6.1
5
19
1.0
21
2.2
01
6.2
1.0
78
2.7
64
6.2
21.1
57
2.9
67
6.3
71.2
12
2.9
82
6.4
29
1.4
19
3.2
42
6.5
7
26
1.0
82
2.3
64
6.8
36
1.0
94
2.5
67
6.9
11.2
13
2.9
73
7.4
11.2
50
2.7
70
7.2
21.4
58
3.0
01
7.8
4
34
1.1
77
2.5
92
7.3
41.2
07
2.8
35
7.0
61.3
62
2.9
94
7.6
1.3
70
2.9
95
7.8
51.4
99
3.2
04
8.0
3
GFR
E:gl
ass-
fiber
rein
forc
ed
epoxy.
194 Journal of Composite Materials 47(2)

surface roughness measuring instrument. The cut-offand traversing length values were taken as 0.8 and4mm, respectively.29 The surface roughness value ofeach specimen is the arithmetic average value of threesurface roughness measurements made across the lay,at three different positions along the circumference ofthe hole wall, separated by around 60� to 90�.29,30
The results are given in Table 2.
Bearing measurements
Pin-bearing strength is one of the most important cri-teria for the machinability analysis in drilling polymericcomposites for bolted joint issues. In most research onpinned joints, the interaction between pin diameter, d,and composite dimensions such as width, w, anddistance from hole center to composite end, e, resultingin w/d and e/d ratios, which represent the main param-eters for joint design. These parameters mainly dependon material type. In this study, the dimensions of thebearing specimen were selected as 48mm width and40mm height with half-hole (�8mm) at the centerline,
i.e. w/d¼ 6 and e/d¼ 5. To prepare identical bearingtest specimens, pieces of the composite laminate with96mm width and 80mm height were drilled at its centerwith a different machining condition (feed, speed, andfresh drill, W¼ 0, Table 3). The pieces were split,through its center, into two identical bearing test speci-mens with 48� 40mm2 and semi-circular hole,R¼ 4mm. The splitting process was implementedusing vertical band saw machine with very narrowpitch and recommended cutting conditions for cuttingGFR/polymer composites without delamination.
The dimensions of the test specimens (48� 40mm2)are recommended by Wang et al.,31 for compressionpin-bearing test, to ensure pure bearing failure mode.Also, these dimensions agree with ASTM D 5961(w/d¼ 6 and e/d¼ 3), for pin-bearing test in which thebearing load is created by pulling double-shear testspecimen in a testing machine.
In this study, special test fixture was designed andmanufactured for pin-bearing tests as schematicallyillustrated in Figure 1(a). Bearing tests were carriedout by compression of the specimen in the notchusing 8mm diameter hardened steel pin fixed on theupper jaw (loading member) of the testing machine,Figure 1(b). The maximum load observed during thetest was recorded as the bearing failure load. The bear-ing strength is the average value of two holes (four testspecimens). The experimental results of the bearingstrength of GFRE specimens machined at different cut-ting conditions are illustrated in Table 3.
Results and discussion
The following subsections illustrate a discussion on theeffect of drill pre-wear on the machinability parameters
Test fixture
P
φ8-Pin
Specimen
Base plate
(a) (b)
Figure 1. Pin-bearing test fixture: (a) test fixture and (b) bearing test set-up.
Table 3. Experimental results of bearing strength in drilling
GFRE composites with fresh drill
Speed (m/min)
Feeds (mm/revolution)
0.056 0.112 0.220 0.315 0.450
6.41 226.26 227.01 211.21 209.05 188.39
12.70 238.79 237.38 225.30 207.93 177.60
20.23 218.95 197.34 184.66 182.33 179.18
32.04 208.26 196.18 189.59 189.08 169.04
50.64 218.72 217.34 208.61 198.79 197.93
GFRE, glass-fiber reinforced epoxy.
Khashaba et al. 195
at different feeds and the extreme values of cuttingspeeds. The experimental results used in the develop-ment of ANNs are illustrated in Tables 1 to 3.
Effect of drill pre-wear and cutting conditions onthrust force (Ft) and torque (T)
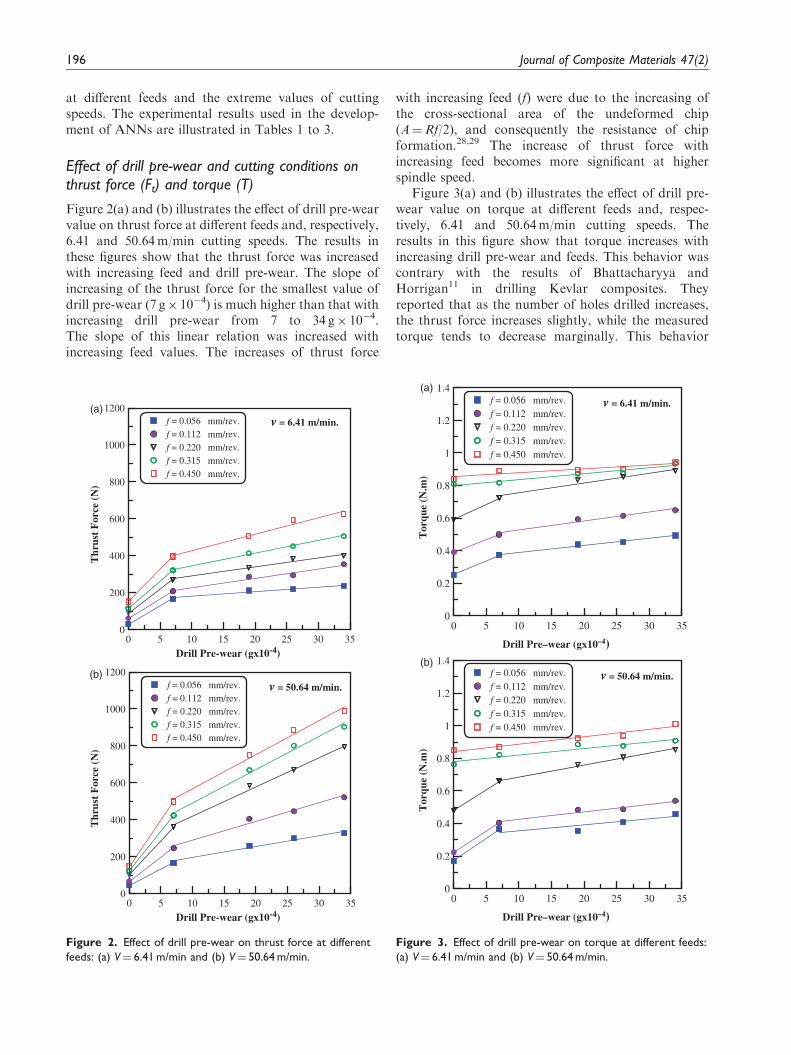
Figure 2(a) and (b) illustrates the effect of drill pre-wearvalue on thrust force at different feeds and, respectively,6.41 and 50.64m/min cutting speeds. The results inthese figures show that the thrust force was increasedwith increasing feed and drill pre-wear. The slope ofincreasing of the thrust force for the smallest value ofdrill pre-wear (7 g� 10�4) is much higher than that withincreasing drill pre-wear from 7 to 34 g� 10�4.The slope of this linear relation was increased withincreasing feed values. The increases of thrust force
with increasing feed (f) were due to the increasing ofthe cross-sectional area of the undeformed chip(A¼Rf/2), and consequently the resistance of chipformation.28,29 The increase of thrust force withincreasing feed becomes more significant at higherspindle speed.
Figure 3(a) and (b) illustrates the effect of drill pre-wear value on torque at different feeds and, respec-tively, 6.41 and 50.64m/min cutting speeds. Theresults in this figure show that torque increases withincreasing drill pre-wear and feeds. This behavior wascontrary with the results of Bhattacharyya andHorrigan11 in drilling Kevlar composites. Theyreported that as the number of holes drilled increases,the thrust force increases slightly, while the measuredtorque tends to decrease marginally. This behavior
0 5 10 15 20 25 30 35
Drill Pre–wear (gx10–4)
0
0.2
0.4
0.6
0.8
1
1.2
1.4
Tor
que
(N.m
)
f = 0.056 mm/rev.f = 0.112 mm/rev.f = 0.220 mm/rev.f = 0.315 mm/rev.f = 0.450 mm/rev.
v = 6.41 m/min.
0 5 10 15 20 25 30 35
Drill Pre–wear (gx10–4)
0
0.2
0.4
0.6
0.8
1
1.2
1.4
Tor
que
(N.m
)
f = 0.056 mm/rev.f = 0.112 mm/rev.f = 0.220 mm/rev.f = 0.315 mm/rev.f = 0.450 mm/rev.
v = 50.64 m/min.
(a)
(b)
Figure 3. Effect of drill pre-wear on torque at different feeds:
(a) V¼ 6.41 m/min and (b) V¼ 50.64 m/min.
0 5 10 15 20 25 30 35
Drill Pre-wear (gx10-4)
0
200
400
600
800
1000
1200
Thr
ust
For
ce (
N)
f = 0.056 mm/rev.f = 0.112 mm/rev.f = 0.220 mm/rev.f = 0.315 mm/rev.f = 0.450 mm/rev.
(b)v = 50.64 m/min.
0 5 10 15 20 25 30 35
Drill Pre-wear (gx10-4)
0
200
400
600
800
1000
1200
Thr
ust
For
ce (
N)
f = 0.056 mm/rev.f = 0.112 mm/rev.f = 0.220 mm/rev.f = 0.315 mm/rev.f = 0.450 mm/rev.
(a)v = 6.41 m/min.
Figure 2. Effect of drill pre-wear on thrust force at different
feeds: (a) V¼ 6.41 m/min and (b) V¼ 50.64 m/min.
196 Journal of Composite Materials 47(2)

may be attributed to the difference in the mechanicalproperties of GFRE and Kevlar composites.
The increases of thrust force and torque, in drillingGFRE composites, with increasing drill pre-wear weredue to abrasive action between the hard glass fiber andthe drill with chipping and abrasion wear, which resultin increasing the tangential (torque) and thrust forces.Cutting speeds have no clear effect on torque.
Effect of drill pre-wear and cutting conditions ondelamination size
Figure 4(a) and (b) shows the effect of drill pre-wearand cutting speeds on the peel-up and push-out delam-ination sizes at, respectively, 0.056 and 0.45mm/
revolution feeds. The figure also indicates that bothpeel-up and push-out delamination sizes increaseswith the increasing the drill pre-wear. The push-outdelamination size at high feeds ( f¼ 0.45mm/revolution)seems to be independent on drill pre-wear and conse-quently on the thrust force. This result was due to thefact that some parts of the twist drill point have neg-ative rake angle such as the chisel edge angle and theportion of the cutting edges near the center. Theseparts push on (extrude) the material, instead of cuttingthrough it.2,28 When the feed becomes too high, thehole drill point acts as a punch that pierces the lam-inate.32 The piercing action result in approximatelyconstant push-out delamination size irrespective tothe value of the thrust force (piercing force).
The effect of feed on push-out delamination is muchgreater than peel-up delamination. This result provedthat thrust force is the controlling factor for push-outdelamination. On the other hand, the peripheral cuttingforce is the limiting factor for peel-up delamination,which is a function of tool geometry and frictionbetween the tool and workpiece.2 The results inFigure 4(a) and (b) also indicate that the effect ofcutting speed at different drill pre-wear values ondelamination size is not clear.
Effect of drill pre-wear and cutting conditions onsurface roughness
Figure 5(a) and (b) illustrates the effect of drill pre-wearvalue on surface roughness at different feeds and,respectively, 6.41 and 50.64m/min cutting speeds. Theresults in this figure show that surface roughnessincreases with the increase of drill pre-wear. At lowcutting speed, the feed has insignificant effect on thesurface roughness (Figure 5(a)). On the other hand,high surface roughness was obtained when drilling athigh speed and feed (Figure 5(b)). The reason being, athigh feed and cutting speed, the removal of fibers fromthe matrix is partial and leads to relatively high surfaceroughness. In addition, drilling at high speed with pre-wear drills increases the generated temperature due tothe lower coefficient of thermal conduction and transi-tion temperature of GFRE composites. The accumu-lated heat around the tool edge destroys the matrixstability and deteriorates the heat affected zone of thehole resulting in rough cuts.
Effect of feed and speed on bearing strength ofdrilled hole (W¼ 0)
Figure 6 shows load–displacement diagram of pin-bearing specimens drilled at 20.23m/min cuttingspeed and different feeds. The initial zone of thisfigure is characterized by a non-linear behavior with
0 5 10 15 20 25 30 35 40
Drill Pre–wear (gx10–4)
0
1
2
3
4
5
Del
amin
atio
n (m
m)
Push–out
Peel–up
(a)v = 6.41 m/min. v = 12.70 m/min.v = 20.23 m/min.v = 32.04 m/min.v = 50.64 m/min.
f = 0.056 mm/rev.
0 5 10 15 20 25 30 35 40
Drill Pre–wear (gx10–4)
0
1
2
3
4
5
Del
amin
atio
n (m
m)
Peel–up
Push–out
(b)v = 6.41 m/min. v = 12.70 m/min.v = 20.23 m/min.v = 32.04 m/min.v = 50.64 m/min.
f = 0.45 mm/rev.
Figure 4. Effect of drill pre-wear on peel-up and push-out
delamination sizes at different feeds: (a) f¼ 0.056 mm/revolution
and (b) f¼ 0.45 mm/revolution.
Khashaba et al. 197
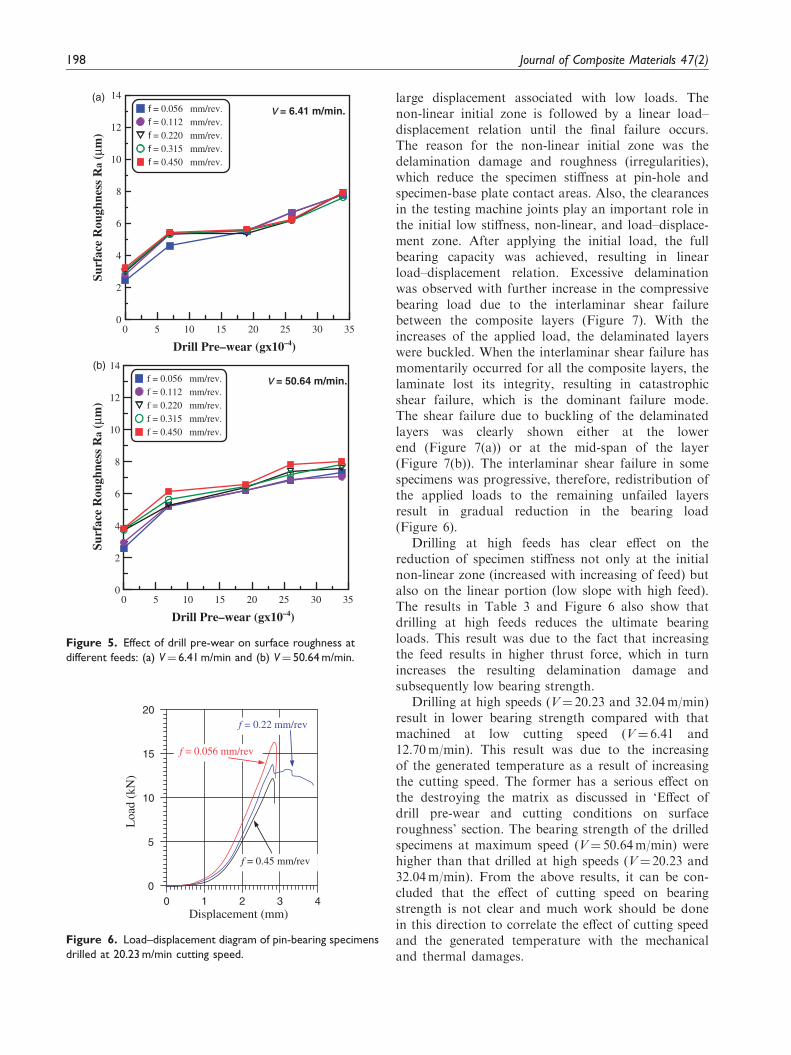
large displacement associated with low loads. Thenon-linear initial zone is followed by a linear load–displacement relation until the final failure occurs.The reason for the non-linear initial zone was thedelamination damage and roughness (irregularities),which reduce the specimen stiffness at pin-hole andspecimen-base plate contact areas. Also, the clearancesin the testing machine joints play an important role inthe initial low stiffness, non-linear, and load–displace-ment zone. After applying the initial load, the fullbearing capacity was achieved, resulting in linearload–displacement relation. Excessive delaminationwas observed with further increase in the compressivebearing load due to the interlaminar shear failurebetween the composite layers (Figure 7). With theincreases of the applied load, the delaminated layerswere buckled. When the interlaminar shear failure hasmomentarily occurred for all the composite layers, thelaminate lost its integrity, resulting in catastrophicshear failure, which is the dominant failure mode.The shear failure due to buckling of the delaminatedlayers was clearly shown either at the lowerend (Figure 7(a)) or at the mid-span of the layer(Figure 7(b)). The interlaminar shear failure in somespecimens was progressive, therefore, redistribution ofthe applied loads to the remaining unfailed layersresult in gradual reduction in the bearing load(Figure 6).
Drilling at high feeds has clear effect on thereduction of specimen stiffness not only at the initialnon-linear zone (increased with increasing of feed) butalso on the linear portion (low slope with high feed).The results in Table 3 and Figure 6 also show thatdrilling at high feeds reduces the ultimate bearingloads. This result was due to the fact that increasingthe feed results in higher thrust force, which in turnincreases the resulting delamination damage andsubsequently low bearing strength.
Drilling at high speeds (V¼ 20.23 and 32.04m/min)result in lower bearing strength compared with thatmachined at low cutting speed (V¼ 6.41 and12.70m/min). This result was due to the increasingof the generated temperature as a result of increasingthe cutting speed. The former has a serious effect onthe destroying the matrix as discussed in ‘Effect ofdrill pre-wear and cutting conditions on surfaceroughness’ section. The bearing strength of the drilledspecimens at maximum speed (V¼ 50.64m/min) werehigher than that drilled at high speeds (V¼ 20.23 and32.04m/min). From the above results, it can be con-cluded that the effect of cutting speed on bearingstrength is not clear and much work should be donein this direction to correlate the effect of cutting speedand the generated temperature with the mechanicaland thermal damages.
0 5 10 15 20 25 30 35
Drill Pre–wear (gx10–4)
0
2
4
6
8
10
12
14Su
rfac
e R
ough
ness
Ra
(μm
)f = 0.056 mm/rev.f = 0.112 mm/rev.f = 0.220 mm/rev.f = 0.315 mm/rev.f = 0.450 mm/rev.
(a)v = 6.41 m/min.
0 5 10 15 20 25 30 35
Drill Pre–wear (gx10–4)
0
2
4
6
8
10
12
14
Surf
ace
Rou
ghne
ss R
a (μ
m)
f = 0.056 mm/rev.f = 0.112 mm/rev.f = 0.220 mm/rev.f = 0.315 mm/rev.f = 0.450 mm/rev.
(b)
v = 50.64 m/min.
Figure 5. Effect of drill pre-wear on surface roughness at
different feeds: (a) V¼ 6.41 m/min and (b) V¼ 50.64 m/min.
0 1 2 3 4Displacement (mm)
0
5
10
15
20
Loa
d (k
N)
f = 0.056 mm/rev
f = 0.22 mm/rev
f = 0.45 mm/rev
Figure 6. Load–displacement diagram of pin-bearing specimens
drilled at 20.23 m/min cutting speed.
198 Journal of Composite Materials 47(2)

ANNs analysis
In this study, the measurement of the machinabilityparameters (thrust, torque, peel-up and push-outdelamination, and surface roughness) were imple-mented on 125 drilled hole with different cuttingparameters (feed and speed; Tables 1 and 2). The exper-imental results required to develop the neural networkswere selected randomly as follows: 100 holes for train-ing patterns and 25 holes for cross-validation patterns(that used as a training stoppage criterion). The devel-oped ANNs were multi-layer perceptron type andtrained using the back-propagation routine.33
A NeuroSolutions software (version 5; http://www.neurosolutions.com) was used in the training, val-idating, and testing process of the developed neuralnetworks. For training, a value of 0.7 was selectedfor the momentum term, a starting value of 1.0 wasassigned for the learning rate, and maximumepochs of 40,000 were chosen with batch weight
update method. The different ANNs structures wereobtained by training each network five times (runs)starting with five different initial weight values. Allstructures were trained using different epoch numbers.The best structure was selected based on the minimummean square error of the validation sets. The criterionof selecting the best net from the tried networks is theminimum mean square of the differences between themeasured and the predicted values obtained fromthe net, applied for the test data sets.
ANNs for thrust force and torque prediction
The inputs for the ANNs that predict the thrust forceand torque include: cutting speed, feed, and drill pre-wear. To obtain the neural network structure for eachof thrust force and torque, 11 neural network structureswere examined by changing both the number of hiddenlayers and the number of hidden units within each
Feed
Cutting speed
Input Information
InputLayerUnits
Drill pre-wear
OutputLayerUnit Output Information
HiddenLayer(s)
Units
Thrust force or Torque
Figure 8. Schematic diagram of the neural network for predicting thrust force and torque.
Figure 7. Photo of failed bearing specimen.
Khashaba et al. 199
hidden layer. These networks include: 3-3-1, 3-5-1, 3-7-1, 3-9-1, 3-3-3-1, 3-3-5-1, 3-5-3-1, 3-5-5-1, 3-5-8-1, 3-8-5-1, and 3-8-8-1. The neural networks 3-5-1 and 3-3-1with minimum data set error were selected to predictthrust force and torque, respectively. Figure 8 showsthe schematic diagrams of the neural networks for pre-dicting the thrust force and torque. The inputs to thenetworks are: cutting speed, feed, and drill pre-wear.
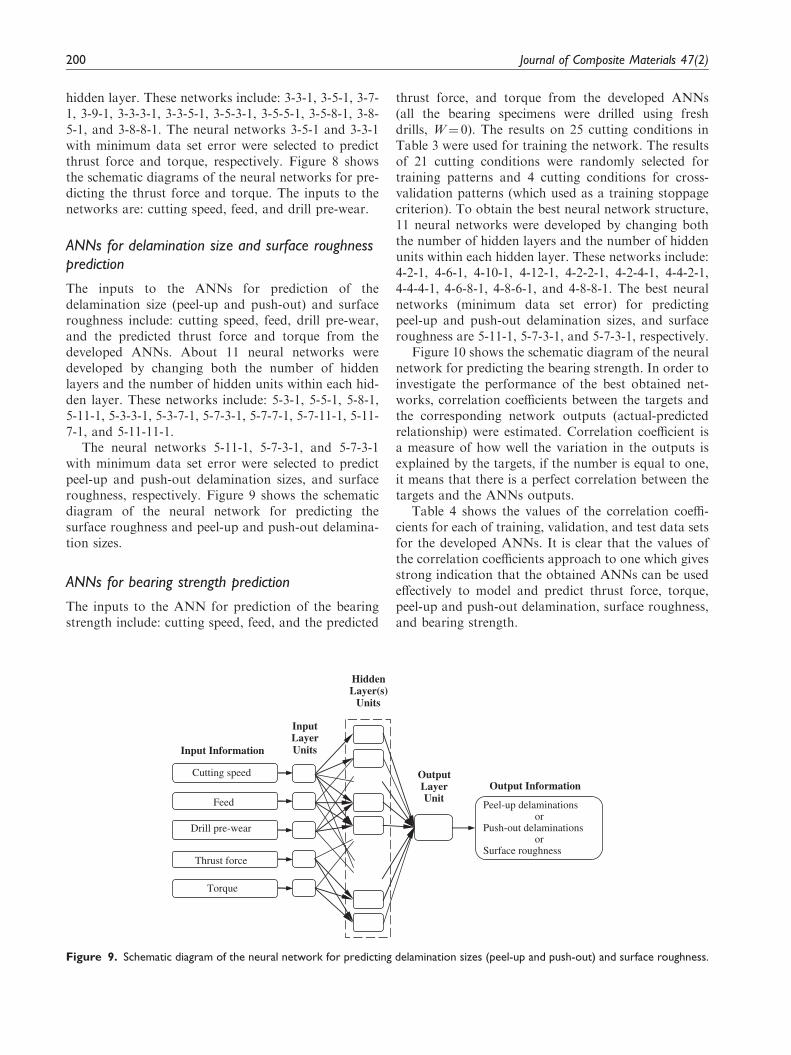
ANNs for delamination size and surface roughnessprediction
The inputs to the ANNs for prediction of thedelamination size (peel-up and push-out) and surfaceroughness include: cutting speed, feed, drill pre-wear,and the predicted thrust force and torque from thedeveloped ANNs. About 11 neural networks weredeveloped by changing both the number of hiddenlayers and the number of hidden units within each hid-den layer. These networks include: 5-3-1, 5-5-1, 5-8-1,5-11-1, 5-3-3-1, 5-3-7-1, 5-7-3-1, 5-7-7-1, 5-7-11-1, 5-11-7-1, and 5-11-11-1.
The neural networks 5-11-1, 5-7-3-1, and 5-7-3-1with minimum data set error were selected to predictpeel-up and push-out delamination sizes, and surfaceroughness, respectively. Figure 9 shows the schematicdiagram of the neural network for predicting thesurface roughness and peel-up and push-out delamina-tion sizes.
ANNs for bearing strength prediction
The inputs to the ANN for prediction of the bearingstrength include: cutting speed, feed, and the predicted
thrust force, and torque from the developed ANNs(all the bearing specimens were drilled using freshdrills, W¼ 0). The results on 25 cutting conditions inTable 3 were used for training the network. The resultsof 21 cutting conditions were randomly selected fortraining patterns and 4 cutting conditions for cross-validation patterns (which used as a training stoppagecriterion). To obtain the best neural network structure,11 neural networks were developed by changing boththe number of hidden layers and the number of hiddenunits within each hidden layer. These networks include:4-2-1, 4-6-1, 4-10-1, 4-12-1, 4-2-2-1, 4-2-4-1, 4-4-2-1,4-4-4-1, 4-6-8-1, 4-8-6-1, and 4-8-8-1. The best neuralnetworks (minimum data set error) for predictingpeel-up and push-out delamination sizes, and surfaceroughness are 5-11-1, 5-7-3-1, and 5-7-3-1, respectively.
Figure 10 shows the schematic diagram of the neuralnetwork for predicting the bearing strength. In order toinvestigate the performance of the best obtained net-works, correlation coefficients between the targets andthe corresponding network outputs (actual-predictedrelationship) were estimated. Correlation coefficient isa measure of how well the variation in the outputs isexplained by the targets, if the number is equal to one,it means that there is a perfect correlation between thetargets and the ANNs outputs.
Table 4 shows the values of the correlation coeffi-cients for each of training, validation, and test data setsfor the developed ANNs. It is clear that the values ofthe correlation coefficients approach to one which givesstrong indication that the obtained ANNs can be usedeffectively to model and predict thrust force, torque,peel-up and push-out delamination, surface roughness,and bearing strength.
Drill pre-wear
Thrust force
Feed
Cutting speed
Torque
Input Information
Input Layer Units
Hidden Layer(s)
Units
Output InformationOutput Layer Unit
Peel-up delaminations or
Push-out delaminations or
Surface roughness
Figure 9. Schematic diagram of the neural network for predicting delamination sizes (peel-up and push-out) and surface roughness.
200 Journal of Composite Materials 47(2)

MVR analysis
Considerable attention has been paid in the last fewyears to record the MVR models that correlate machin-ability parameters with machining conditions in drillingfiber-reinforced composites.1,16–19,34
In this study, MVR models of degree 2, correlationbetween cutting parameters versus machinabilityparameters in drilling GFR/epoxy composites wasdeveloped using Solver in Microsoft Excel. The follow-ing solver parameters were used to develop the models(equations (1) to (6))
. Set target Cell¼ Standard error of estimate (SEE),equation (7)
. By changing cells¼ Initial values of the coefficientsof the required model
. Subject constraints¼Coefficient of correlation(1�R2
��1)
Ft ¼ �14:2677þ 0:6294ðvÞ þ 792:5182ð f Þ
þ 11:521ðwÞ � 0:0357ðv2Þ � 1183:02ð f2Þ
� 0:3362ðw2Þ þ 8:008ðv:f Þ þ 0:1918ðv:wÞ
þ 34:001ð f:wÞ R2 ¼ 0:971
ð1Þ
T ¼ 0:09291� 0:00689ðvÞ þ 3:24987ð f Þ þ 0:01515ðwÞ
þ 0:00008ðv2Þ � 3:59415ð f2Þ � 0:00017ðw2Þ
þ 0:00576ðv:f Þ � 0:00956ð f:wÞ R2 ¼ 0:959
ð2Þ
Peel�DL ¼ 0:74329� 0:00483ðvÞ þ 1:59207ð f Þ
þ 0:042342ðwÞ � 1:26821ð f2Þ
� 0:00081ðw2Þ R2 ¼ 0:824
ð3Þ
Push�DL¼ 0:82004þ0:01337ðvÞþ6:23005ðfÞ
þ0:05953ðwÞ�0:00021ðv2Þ�3:42921ðf2Þ
�0:00066ðw2Þ�0:07919ð f:wÞ R2¼ 0:880
ð4Þ
Ra ¼ 2:10433þ 0:07218ðvÞ
þ 2:13989ð f Þ þ 0:20575ðwÞ
� 0:00107ðv2Þ � 0:00224ðw2Þ R2 ¼ 0:892
ð5Þ
�b ¼ 225:7521� 1:5710ðvÞ � 517:707ð f Þ
þ 0:40572ðFtÞ þ 175:8551ðTÞ þ 0:03886ðv2Þ
� 117:1479ðT2Þ þ 7:5194ðv:f Þ � 0:0268ðv:FtÞ
þ 1:3298ð f:FtÞ R2 ¼ 0:862
ð6Þ
SEE ¼
ffiffiffiffiffiffiffiffiffiffiffiffiffiffiffiffiffiffiffiffiffiffiffiffiffiffiffiffiffiffiffiffiffiffiPYexp � Yest
� �2n
sð7Þ
where v is the cutting speed (m/min), f the feed (mm/revolution), w the wear (g� 10�4), Ft the thrust force(N), T the torque (Nm), Peel-DL the peel-up delami-nation size (mm), Push-DL the push-out delaminationsize (mm), Ra the surface roughness (mm), �b thebearing strength (MPa), Yexp the experimental data,Yest the estimated values of Yexp, and n the numberof tests.
Torque
Feed
Cutting speed
Input Information
InputLayerUnits
Thrust force Bearing strength
OutputLayerUnit Output Information
HiddenLayer(s)
Units
Figure 10. Schematic diagram of the neural net for bearing strength prediction.
Khashaba et al. 201

The Minitab software was used to confirm thedeveloped MVR models and remove the terms, whichhave insignificant effect on the R2 and SEE. The valuesof regression coefficients (R2) clearly indicate that theMVR models were fair to fit the experimental data ofmachinability parameters. The correlation coefficientsof many investigators are closed to that obtained inthis study. Faraz et al.1 reports R2
¼ 0.87 for thelinear regression curve of exit delamination and flankwear. Tsao and Hocheng19 developed two linear regres-sion models for prediction thrust force and surfaceroughness in drilling carbon fiber/epoxy compositeswith R2
¼ 0.81 and 0.658, respectively.
Confirmation tests
A number of 12 confirmation tests were implemented atdifferent cutting conditions, Table 5, to compare
between the experimental results of the machinabilityparameters and the predicted values using the devel-oped ANNs and the MVR models. The results ofthrust force, torque, peel-up and push-out delamina-tions, surface roughness, and bearing strength are illus-trated in Figures 11 to 16, respectively. The results inthese figures show that the ANNs are found to be moreprecise than the MVR models. The SEE for thepredicted machinability parameters using MVRmodels were, respectively, 40.357, 0.047, 0.122, 0.197,0.586, and 7.119 for Ft, T, Peel-DL, Push-DL, Ra, and�b. On the other hand, the predicted values of the lattermachinability parameters using ANNs models exhibitrelatively lower SEE, 11.245, 0.067, 0.051, 0.107, 0.420,and 10.709, respectively. These results accompanied
Table 5. Cutting conditions for conformation tests
Test no.
Cutting conditions
Speed
(m/min)
Feed
(mm/revolution)
Wear
(g� 10�4)
1 10.05 0.08 0
2 15.83 0.16 0
3 40.21 0.08 0
4 25.13 0.16 0
5 15.83 0.16 7
6 40.21 0.90 7
7 07.92 0.32 19
8 20.25 0.16 19
9 10.05 0.08 26
10 25.13 0.16 26
11 40.21 0.32 34
12 25.13 0.22 34
Confirmation test number
Thr
ust f
orce
(N
)
Figure 11. Comparison between the experimental results of
thrust force and the predicted values using the ANN and
regression models. ANN, artificial neural network.
Confirmation test number
Tor
que
(Nm
)
Figure 12. Comparison between the experimental results of
torque and the predicted values using the ANN and regression
models. ANN, artificial neural network.
Table 4. Correlation coefficients for training, validation, and
test data sets
Correlation coefficients
Best networks
Training
data set
Validation
data set
Test data
set
Thrust force (3-5-1) 0.999 0.999 0.992
Torque (3-3-1) 0.963 0.985 0.919
Drill entry (5-11-1) 0.987 0.966 0.956
Drill exit (5-7-3-1) 0.980 0.883 0.967
Ra (5-7-3-1) 0.976 0.936 0.962
Bearing strength (4-2-1) 0.84 0.94 0.73
202 Journal of Composite Materials 47(2)

with that shown in Figures 11 to 16 verify that ANNsare demonstrated to be a practical and effective way forthe evaluation of the machinability parameters in dril-ling GFR/epoxy composites. Similar observations werereported by Krishnaraj et al.34
Conclusions
An experimental investigation was implemented toevaluate the effect of drilling parameters (feed, speed,and drill pre-wear) on the machinability parameters(thrust force, torque, peel-up and push-out delamina-tions, surface roughness, and bearing strength) indrilling GFRE composites. ANNs and MVR modelswere developed for prediction of the machinabilityparameters of the drilled holes.
The results show that the behavior of thrustforce during drilling process was greatly affected by
the drill pre-wear. This effect becomes more significantat high-cutting speed and feed, which in turn increasespeel-up and push-out delaminations. At high feeds(0.45mm/revolution), the drill point acts as a punchthat pierces the laminate, instead of cutting through it,with approximately constant push-out delaminationsize irrespective to the value of the thrust force.
Drilling at high speeds and drill pre-wear results inhigh surface roughness due to the generated tempera-ture that is assisted by a low-coefficient of thermalconduction and a low-transition temperature ofGFRE composites. In addition, the increasing ofthrust force as a result of increasing drill pre-wearleads to destruction of the fiber/matrix interfaces andsuccessive deterioration of the surface finish. Thepartially sheared fibers due to the abrasion action ofthe pre-wearied drill point are another reason for theincreasing of surface roughness.
Confirmation test number
Bea
ring
str
engt
h (M
Pa)
Figure 16. Comparison between the experimental results of
bearing strength and the predicted values using the ANN and
regression models. ANN, artificial neural network.
Confirmation test number
Push
-out
del
amin
atio
ns (
mm
)
Figure 14. Comparison between the experimental results of
push-out delaminations and the predicted values using the ANN
and regression models. ANN, artificial neural network.
Confirmation test number
Surf
ace
roug
hnes
s (μ
m)
Figure 15. Comparison between the experimental results of
surface roughness and the predicted values using the ANN and
regression models. ANN, artificial neural network.
Confirmation test number
Peel
-up
dela
min
atio
ns (
mm
)
Figure 13. Comparison between the experimental results of
peel-up delaminations and the predicted values using the ANN
and regression models. ANN, artificial neural network.
Khashaba et al. 203

The failure of the bearing specimen was initiatedwith delaminations owing to the interlaminar shearfailure between the composite layers, under thecompressive bearing load. The final failure was due tothe buckling of the delaminated layers, eithermomentarily (with catastrophic failure) or progres-sively (with gradual reduction in the bearing load).
The correlation coefficients for each of training,validation, and test data sets for the developed ANNsapproach to one, which gives strong indication that theobtained ANNs can be used effectively to model andpredict thrust force, torque, peel-up and push-outdelaminations, surface roughness, and bearing strength.The comparison between the experimental results ofconfirmation tests and the predicted values showedthat the ANNs have considerable lower errors thanMVLR models. This result proves that ANNs aredemonstrated to be a practical and effective way forthe evaluation of the machinability parameters indrilling GFR/epoxy composites.
Acknowledgment
The authors thank Dr Redouane Zitoune, Institute of
Clement Ader, IUT-University of Paul Sabatier, France, forhis guide in Microsoft Excel Solver to develop the MVRmodels.
References
1. Faraz A, Biermann D and Weinert K. Cutting edge round-
ing: an innovative tool wear criterion in drilling CFRP
composite laminates. Int J Mach Tools Manuf 2009; 49:
1185–1196.2. Khashaba UA. Delamination in drilling polymeric com-
posites: a review. In: Paulo Davim J (ed.) Drilling of com-
posite materials. Nova Science Publishers, Inc., 2009.3. Zitoune R, Krishnaraj V and Collombet F. Study of dril-
ling of composite material and aluminium stack. Compos
Struct 2010; 92: 1246–1255.4. Kilickap E. Optimization of cutting parameters on
delamination based on Taguchi method during drilling
of GFRP composite. Expert Syst Appl 2010; 37:
6116–6122.5. Shyha I, Soo SL, Aspinwall D, et al. Effect of laminate
configuration and feed rate on cutting performance when
drilling holes in carbon fiber reinforced plastic composites.
J Mater Process Technol 2010; 210: 1023–1034.
6. Iliescu D, Gehin D, Gutierrez ME, et al. Modeling and
tool wear in drilling of CFRP. Int J Mach Tools Manuf
2010; 50: 204–213.7. Schulze V, Becke C, Weidenmann K, et al. Machining
strategies for hole making in composites with minimal
workpiece damage by directing the process forces inwards.
J Mater Process Technol 2011; 211: 329–338.
8. Franke V. Drilling of long fiber reinforced thermoplastics-
influence of the cutting edge on the machining results.
CIRP Ann Manuf Technol 2011; 60(1): 65–68.
9. Rawat S and Attia H. Wear mechanisms and tool lifemanagement of WC–Co drills during dry high speed dril-ling of woven carbon fiber composites. Wear 2009; 267:
1022–1030.10. Varatharajan R, Malhotra SK, Vijayaraghavan L, et al.
Mechanical and machining characteristics of GF/PP andGF/polyester composites. Mater Sci Eng B 2006; 132:
134–137.11. Bhattacharyya D and Horrigan DPW. A study of hole
drilling in Kevlar composites. Compos Sci Technol 1998;
58: 267–283.12. Tsao CC and Hocheng H. Effect of tool wear on delam-
ination in drilling composite materials. Int J Mech Sci
2007; 49: 983–988.13. Liu HS, Lee BY and Tarng YS. In-process prediction of
corner wear in drilling operations. J Mater Process
Technol 2000; 101: 152–158.14. Davim JP and Reis P. Study of delamination in drilling
carbon fiber reinforced plastics (CFRP) using designexperiments. Compos Struct 2003; 59: 481–487.
15. Chen WC. Some experimental investigations in thedrilling of carbon fiber-reinforced plastic (CFRP) com-posite laminates. Int J Mach Tools Manuf 1997; 37:
1097–1108.16. Tsao CC. Experimental study of drilling composite mate-
rials with step-core drill. Mater Des 2008; 29: 1740–1744.
17. Rao BS, Rudramoorthy R, Srinivas S, et al. Effect ofdrilling induced damage on notched tensile and pin bear-ing strengths of woven GFR-epoxy composites. MaterSci Eng A 2008; 472: 347–352.
18. Gaitonde VN, Karnik SR, Rubio JC, et al. Analysis ofparametric influence on delamination in high-speed dril-ling of carbon fiber reinforced plastic composites.
J Mater Process Technol 2008; 203: 431–438.19. Tsao CC and Hocheng H. Evaluation of thrust force and
surface roughness in drilling composite material using
Taguchi analysis and neural network. J Mater ProcessTechnol 2008; 203: 342–348.
20. Persson E, Eriksson I and Zackrisson L. Effects of hole
machining defects on strength and fatigue life of compos-ite laminates. Composites Part A 1997; 28: 141–151.
21. Hamdoun Z, Guillaumat L and Lataillade J. Influence ofthe drilling quality on the fatigue compression behaviour
of carbon epoxy laminates. Int J Fatigue 2006; 28: 1–8.22. Durao LM, Magalhaes AG, Tavares JMRS, et al.
Analyzing objects in images for estimating the delamina-
tion influence on load carrying capacity of compositelaminates. Electron Lett Comput Vision Image Anal2008; 7(2): 11–21.
23. Abu-Mahfouz I. Drilling wear detection and classifica-tion using vibration signals and artificial neural network.Int J Mach Tools Manuf 2003; 43: 707–720.
24. Zhang Z and Friedrich K. Artificial neural networks
applied to polymer composites: a review. Compos SciTechnol 2003; 63: 2029–2044.
25. Hayajneh MT, Hassan AM and Mayyas AT. Artificial
neural network modeling of the drilling process of self-lubricated aluminum/alumina/graphite hybrid compos-ites synthesized by powder metallurgy technique.
J Alloys Compd 2009; 478: 559–565.
204 Journal of Composite Materials 47(2)

26. Khashaba UA. Fracture behavior of woven compositescontaining various cracks geometry. J Compos Mater2003; 37(1): 5–21.
27. Khashaba UA. Delamination in drilling GFR-thermosetcomposites. Compos Struct 2004; 63: 313–327.
28. Khashaba UA, Seif MA and Elhamid MA. Drilling anal-ysis of chopped composites. Composites Part A 2007; 38:
61–70.29. Khashaba UA, El-Sonbaty I, Selmy AI, et al.
Machinability analysis in drilling woven GFR/epoxy
composites: part I - effect of machining parameters.Composites Part A 2010; 41: 391–400.
30. Durao LMP, Goncalves DJS, Tavares JMRS, et al.
Drilling tool geometry evaluation for reinforced compos-ite laminates. Compos Struct 2010; 92: 1545–1550.
31. Wang HS, Hung CL and Chang FK. Bearing failure ofbolted composite joints. Part I: experimental characteri-zation. J Compos Mater 1996; 30: 1284–1315.
32. Capello E. Workpiece damping and its effect on delami-nation damage in drilling thin composite laminates.J Mater Process Technol 2004; 148: 186–195.
33. Haykin SS. Neural networks: a comprehensive foundation,
2nd edn. Prentice-Hall, 1999.34. Krishnaraj V, Zitoune RV and Collombet F.
Investigations on drilling of multimaterial and analysis
by ANN. Advanced in Materials processing IX. KeyEng Mater 2010; 443: 347–352.
Khashaba et al. 205
