journal of cleaner production - university of east anglia · journal of cleaner production 168...
TRANSCRIPT
lable at ScienceDirect
Journal of Cleaner Production 168 (2017) 655e667
Contents lists avai
Journal of Cleaner Production
journal homepage: www.elsevier .com/locate/ jc lepro
Flood footprint of the 2007 floods in the UK: The case of the Yorkshireand The Humber region
David Mendoza-Tinoco a, Dabo Guan a, *, Zhao Zeng a, Yang Xia a, Ana Serrano b
a Water Security Research Centre, School of International Development, University of East Anglia, Norwich, NR4 7TJ, UKb Faculty of Economics and Business Studies, Universidad de Zaragoza, Zaragoza, Spain
a r t i c l e i n f o
Article history:Received 8 February 2017Received in revised form21 July 2017Accepted 2 September 2017Available online 8 September 2017
Handling Editor: Yutao Wang
Keywords:Input-output (IO) modelFlood footprintDirect costsIndirect costsFlood risk management
* Corresponding author.E-mail address: [email protected] (D. Guan).
http://dx.doi.org/10.1016/j.jclepro.2017.09.0160959-6526/© 2017 The Author(s). Published by Elsev
a b s t r a c t
International headlines over the last few years have been dominated by extreme weather events, andfloods have been amongst the most frequent and devastating. These disasters represent high costs andfunctional disruptions to societies and economies. The consequent breakdown of the economicequilibrium exacerbates the losses of the initial physical damages and generates indirect costs thatlargely amplify the burden of the total damage. Neglecting indirect damages results in misleadingresults regarding the real dimensions of the costs and prevents accurate decision-making in flood riskmanagement. To obtain an accurate assessment of total flooding costs, this paper introduces the floodfootprint concept, as a novel accounting framework that measures the total economic impact that isdirectly and indirectly caused to the productive system, triggered by the flooding damages to theproductive factors, infrastructure and residential capital. The assessment framework account for thedamages in the flooded region as well as in wider economic systems and social networks. The floodfootprint builds on previous research on disaster impact analysis based on Input-Output methodology,which considers inter-industry flows of goods and services for economic output. The framework wasapplied to the 2007 summer floods in the UK to determine the total economic impact in the region ofYorkshire and The Humber. The results suggest that the total economic burden of the floods wasapproximately 4% of the region's GVA (£2.7 billion), from which over half comes from knock-on effectsduring the 14 months that the economy of Yorkshire and The Humber last to recover. This paper is thefirst to apply the conceptual framework of flood footprint to a real past event, by which it highlights theeconomic interdependence among industrial sectors. Through such interrelationships, the economicimpacts of a flooding event spill over into the entire economic system, and some of the most affectedsectors can be those that are not directly damaged. Neglecting the impact of indirect damages wouldunderestimate the total social costs of flooding events, and mislead the correspondent actions for riskmanagement and adaptation.© 2017 The Author(s). Published by Elsevier Ltd. This is an open access article under the CC BY license
(http://creativecommons.org/licenses/by/4.0/).
1. Introduction
In recent decades, the frequency and intensity of climate-relatednatural hazards have both increased. Extreme flooding and flood-related events are leading this trend, and the United Kingdom hasbeen particularly affected by these phenomena (Committee ofClimate Change, 2016).
ier Ltd. This is an open access artic
Theseeventshave resulted in severe social andeconomic costs allover the world. Damages to labour and capital productivity after adisaster create knock-on effects that exacerbate the initial losses ofthe flooded assets, disturbing not only the impacted economic sec-tors but also other sectors that are indirectly affected through eco-nomic mechanisms. This sequence of events can be observed in the2007summerfloods that occurred in England,which caused amajorcivil emergency nationwide. Thirteen people were killed andapproximately 7000 had to be rescued from flooded areas; 55,000properties were flooded and over half a million people experiencedshortages of water and electricity (Pitt, 2008). The most affectedregion was Yorkshire and the Humber (Y&H) which accounted for
le under the CC BY license (http://creativecommons.org/licenses/by/4.0/).
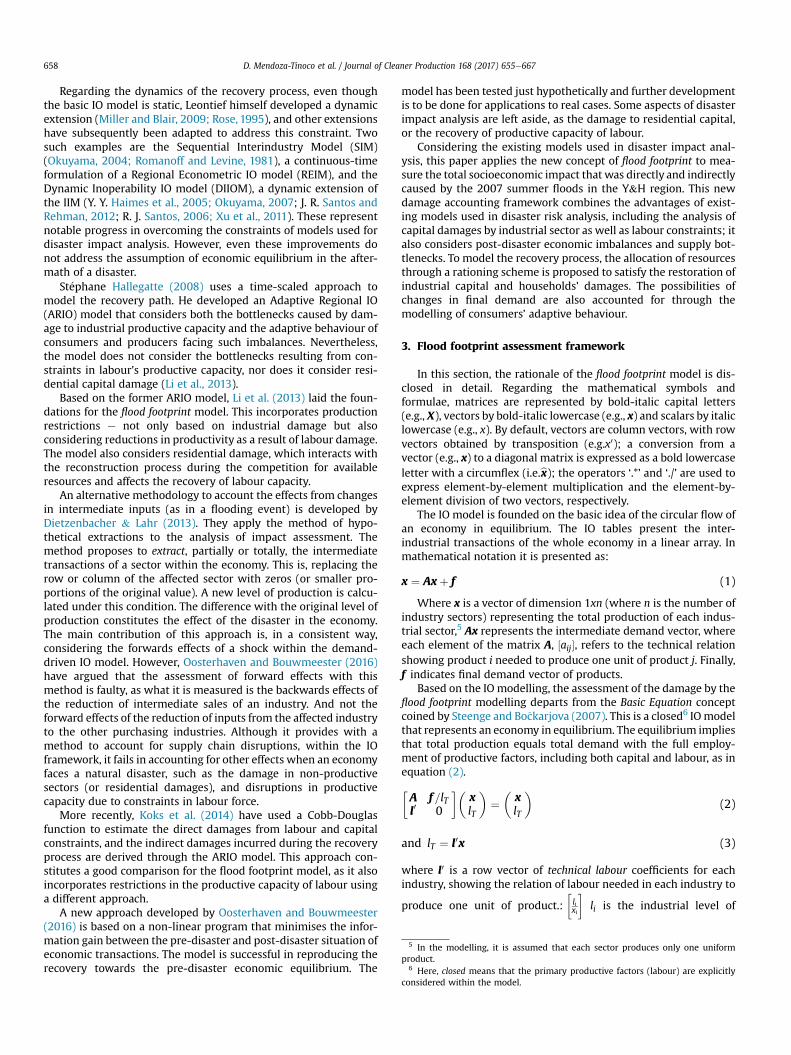
Fig. 1. Yorkshire and The Humber region within the UK.Source: Wikimedia Commons.1
2 ‘[Flood risk management] focuses on reducing the potential adverse conse-quences of flooding with regard to human health, the environment, cultural heri-
D. Mendoza-Tinoco et al. / Journal of Cleaner Production 168 (2017) 655e667656
65.5% of total national direct damage (region in red in Fig. 1).Approximately 1800 homes were flooded and more than 4000peoplewere affected. Additionally,more than64businesses, schoolsand public buildings were flooded, and infrastructure services suchas roads and electricity substations suffered significant disruptionsas well (Ash et al., 2008).
Traditional assessments of economic losses resulting from di-sasters of this type consider only direct damages to the physicalinfrastructure (Veen, 2004; Cole, 2003; Steenge and Bo�ckarjova,2007). Nevertheless, it has been well documented that knock-oneffects are triggered by these direct damages and that theyconstitute a considerable share of the total socioeconomic burdenof the disaster (Cochrane, 1997; Hallegatte and Przyluski, 2010;Veen, 2004). Therefore, accurate flood risk management requiresmore than proper assessments of losses from capital and labourproductivity disruptions; it must also consider the ripple effects ofthe recovery process, which are dispersed through sectoral andregional interdependencies.
Knock-on effects can arise in two main ways. On the one hand,damages to capital such as roads and offices will interrupt trans-portation and further disrupt economic activities, while damages tolabour e including injuries and death e can be perceived as lossesof labour productivity that ultimately prevent economic func-tioning. During an economic recovery, both capital and labourshould be restored. On the other hand, production loss in a singlesector, as a result of either capital or labour productivity losses,affects both customer and supplier industries, namely the ‘down-stream’ and ‘upstream’ sectors. This indicates that an initial eco-nomic loss in a single sector can eventually spill over into the entireeconomic system and even into other previously unaffected regions
1 Wikimedia Commons (Yorkshire and The Humber region) https://commons.wikimedia.org/wiki/File:Yorkshire_and_the_Humber_in_England.svg.
through sectoral and regional interdependencies.Flood risk management2 requires, first, accurate estimates of
losses from both capital and labour productive constraints after aflooding. Second, to estimate a flood's indirect effects on theeconomy, it is essential to consider the ripple effects resulting fromsectoral and regional interdependencies. Flood risk managementcan also reduce vulnerability and increase the resilience3 of affectedregions in the future. (Okuyama, 2009; Rose, 2004; Veen &Logtmeijer, 2003). Third, all accumulated production losses thatoccur prior to the full recovery of the economy, as well as the costsof capital and labour restoration during the flood's aftermath,should be taken into consideration.
This paper introduces the new concept of flood footprint todescribe an accounting framework that measures the total eco-nomic impact that is directly and indirectly caused to the produc-tive system, triggered by the flooding damages to the productivefactors, infrastructure and residential capital; on the flooded regionand on wider economic systems and social networks. This frame-work can not only capture the economic costs derived from capitaland labour productivity losses but also account for the post-disasterrecovery process. Here, we define the productivity loss, from capitalor labour, as the reduction in the production level of equilibrium atpre-disaster conditions due to constraints in the availability of anyof the productive factors, which in the case of the Leontief pro-duction functions are capital and labour. This type of productionfunctions is a particular case of constant elasticity of substitutionproduction functions, where the level of production is determinedas a function of the productive factors.
In the case of the Leontief production functions (used within theIO modelling), or perfect complements, it is assumed that theproportion of productive factors is fixed, or in other words, thetechnology is fixed and there is no possibility of substitution be-tween de productive factors (Miller and Blair, 2009). Owing to theabove, a constraint in the availability of any of the productive fac-tors will have a proportional effect in the level of production. Forinstance, the reduction of 10% in the availability of labour force, dueto transport disruptions, illness, displacements or other factors af-ter a flooding, would represent a decrease of 10% in the level ofproduction.
Additionally, as the flood footprint framework is developedbased on an Input-Output (IO) model, it is also able to measure theknock-on effects resulting from sectoral and regional in-terdependencies. The concept of flood footprint will thereforeimprove upon existing flood risk assessment and better assistprofessionals working on disaster risk assessment, preparation andadaptation.
This paper constitutes the first empirical application of the floodfootprint framework to a real past event. It is evaluated the totaleconomic cost (or flood footprint) in the region of Yorkshire and TheHumber, caused by the 2007 summer floods in the UK. While, asensitivity analysis is carried out to provide robustness in theresults.
This paper is structured as follows. The next section reviewsselected literature on disaster impact analysis. Section 3 describesthemethodology and rationale of the flood footprint model. Section4 presents the data gathering and codification methods used toanalyse total economic losses in Y&H resulting from the floods in
tage and economic activity’ (Vanneuvill et al., 2011).3 The Intergovernmental Panel on Climate Change (IPCC) defines vulnerability as
the ‘degree to which a system is susceptible to injury, damage, or harm’ andresilience as the ‘degree to which a system rebounds, recoups, or recovers from astimulus’ (Burton et al., 2001).

4 The rationale of the EAM is disclosed in vector form for this paper, the eventaccount vector (EAV).
D. Mendoza-Tinoco et al. / Journal of Cleaner Production 168 (2017) 655e667 657
2007. Section 5 presents the main results of the flood footprintassessment. Finally, conclusions are discussed in section 6.
2. Selected literature on the impact assessment of naturaldisasters
The impact assessment of natural disasters has been a vibrantresearch area in recent years, many kinds of methodologies areused to do risk analysis based on different theory systems (Chenet al., 2011, 2015; Okuyama, 2007). For example, from the ecolog-ical perspective, Chen et al. (2011) developed an information-basedmodel that on the basis of system methodology to assess theecological risk by eco-environmental hazard. But our researchmainly focus on the economic perspective and only consider theeconomic impact resulted from natural hazard.
2.1. Economic-based methodologies
Based on economic theory, a range of applicable methodologiesis applied into natural disaster risk analysis (Okuyama, 2007).However, the pre-eminence of one approach over the others hasnot yet been decisively determined, and differences in results areinfluenced by different approaches, assumptions, data, and refer-ence theories (Greenberg et al., 2007). Several methodological ad-aptations and extensions have arisen, each attempting to overcomethe analytical limitations of existing models. The most widely usedhave been those based on econometrics, Input-Output (IO) analysis,and the Computable General Equilibrium (CGE) model.
Econometric models possess rigorous statistical foundations,which enables forecasting estimations. However, long data series ewhich are normally at the national level e rarely contain similarpast events, which prevents a subnational regional analysis. Addi-tionally, the data hardly distinguish between direct and higher-order e or indirect e losses. These problems hamper the perfor-mance of disaster impact analyses (Cochrane, 2004; Greenberget al., 2007; Hallegatte and Przyluski, 2010; Li et al., 2013;Okuyama, 2007, 2009).
Input-Output based models are founded on the basic idea of thecircular flow of the economy in equilibrium. The IO tables presentthe inter-industrial transactions of the whole economy in a trans-parent and linear array, which enables the assessment of knock-oneffects along the value chain. The analysis remains objective, as thenecessary calibration of parameters is usually much lower than inother methodologies. Regionalization of the IO national tables isalso possible, thus enabling regional analysis. These characteristicsallow the estimation of higher-order losses. Nonetheless, theoriginal IOmodel presents some limitations: The basic IOmodel is astatic model, the production functions are based on the fixed-proportion approach, the prices are fixed and the substitutions ofinputs and imports are not considered. (Cole, 2003; Greenberget al., 2007; Okuyama, 2007, 2009; Rose, 2004). It is essentially ademand-driven model, and risk uncertainties are not considered inthe original version (Cochrane, 2004; Li et al., 2013).
The CGE-based models rely on certain characteristics in over-coming some of the IO rigidities, while retaining the inter-industrial and regional analyses of the IO model. The rigidities aremainly related to the manageability of supply constraints, pricechanges, non-linearity, and flexibility in input and import sub-stitutions. However, the modelling refinement of CGE models relieson a high number of parameters that are exogenously calibrated.This introduces additional uncertainty and bias into the analysis. Inthe case of impact analysis, the model assumes that the economy isalways in equilibrium, which is one of the main features that theanalysis is intended to capture: the economic imbalances andconsequences that arise after a disaster.
2.2. Input-Output methodology
Next, we trace the development of IO-based models for impactanalysis, as the characteristics of the IO model make it particularlywell suited to an economy's situation in the aftermath of a disaster(Cochrane, 2004; Greenberg et al., 2007; Okuyama, 2007, 2009;Rose, 1995, 2004; Veen, 2004).
The first version of the IO model, developed by Wassily Leontiefin the 1930s, is a static and demand-driven model. However, thedamages caused by a natural disaster impose imbalances in theeconomy that usually affect the supply side of the productive chain.These imbalances then lead to bottlenecks in production, anddamages spill over because of a series of knock-on effects, whichripple through the economic interconnections among industrialsectors and coupled economies. To cope with this, ad hoc exten-sions have been developed to overcome the original rigidities of theIO model and to manage the complexity of natural disaster impactassessment (Cole, 2003; Li et al., 2013; Okuyama, 2007; Rose,2004).
Initially, to assess the damage to productivity in the industrialsectors, some authors (Y. Haimes and Jiang, 2001; Y. Y. Haimes et al.,2005; J. R. Santos and Haimes, 2004; R. J. Santos, 2006) developed ameasure of expected inoperability to address the risk inherent innatural disasters. This is a concept based on the system risk orprobability of limitations on performing the planned natural orengineered functions. Based on this concept, the Inoperability Input-Output model (IIM) assumes a direct relation between the level oftransactions and the interdependency amongeconomic sectors. TheIIM has beenwidely used to assess the impact of disasters and has aspecial focus on disaggregated analysis by economic sector. Never-theless, some rigidities from the original IO model remain, such asthedemand-drivenapproach, the static analysis and theassumptionof economic equilibrium after the disaster, as the IIM is itself astylized application of the standard IO model (Dietzenbacher andMiller, 2015). In this regard, Oosterhaven (2017) states that the IIMfails to account all the negative impacts from natural disasters anddoes not consider those positive effects that may arise from addi-tional demand in those sectors/regions substituting the inputs thatcannot be supplied by the hit industries.
Leung et al. (2007) and Xu et al. (2011) developed a supply-driven extension for the IIM. These are price models that onlycapture changes in the prices of the value added factors (labour,taxes, etc.). These models have been useful in the analysis of re-covery dynamics after a disaster. Nevertheless, the relation be-tween changes in primary factors’ prices and output quantities isnot clear. Additionally, Xu et al. (2011)modelled recovery time as anexogenous variable when it is expected to be a result of the impactanalysis. Subsequently, J. R. Santos and Rehman (2012) extendedthe model to estimate the recovery time for the affected sectorsbased on survey data. One limitation in this model is, however, theabsence of institutional allocation options for the remainingresources.
Focusing on post-disaster economic imbalances, Steenge andBo�ckarjova (2007) introduce the Event Account Matrix (EAM)concept within IO modelling. This is a mathematical component (adiagonal matrix) whose diagonal-elements express the damagedproportion of each sector's productive capacity.4 The imbalancesand possible bottlenecks after a shock are derived from the infor-mation in the EAM, and the recovery path is traced from this point.The model also allows substitutions of importable goods and ser-vices (Bockarjova et al., 2004; Steenge and Bo�ckarjova, 2007).
5 In the modelling, it is assumed that each sector produces only one uniformproduct.
6 Here, closed means that the primary productive factors (labour) are explicitly
D. Mendoza-Tinoco et al. / Journal of Cleaner Production 168 (2017) 655e667658
Regarding the dynamics of the recovery process, even thoughthe basic IO model is static, Leontief himself developed a dynamicextension (Miller and Blair, 2009; Rose, 1995), and other extensionshave subsequently been adapted to address this constraint. Twosuch examples are the Sequential Interindustry Model (SIM)(Okuyama, 2004; Romanoff and Levine, 1981), a continuous-timeformulation of a Regional Econometric IO model (REIM), and theDynamic Inoperability IO model (DIIOM), a dynamic extension ofthe IIM (Y. Y. Haimes et al., 2005; Okuyama, 2007; J. R. Santos andRehman, 2012; R. J. Santos, 2006; Xu et al., 2011). These representnotable progress in overcoming the constraints of models used fordisaster impact analysis. However, even these improvements donot address the assumption of economic equilibrium in the after-math of a disaster.
St�ephane Hallegatte (2008) uses a time-scaled approach tomodel the recovery path. He developed an Adaptive Regional IO(ARIO) model that considers both the bottlenecks caused by dam-age to industrial productive capacity and the adaptive behaviour ofconsumers and producers facing such imbalances. Nevertheless,the model does not consider the bottlenecks resulting from con-straints in labour's productive capacity, nor does it consider resi-dential capital damage (Li et al., 2013).
Based on the former ARIO model, Li et al. (2013) laid the foun-dations for the flood footprint model. This incorporates productionrestrictions e not only based on industrial damage but alsoconsidering reductions in productivity as a result of labour damage.The model also considers residential damage, which interacts withthe reconstruction process during the competition for availableresources and affects the recovery of labour capacity.
An alternative methodology to account the effects from changesin intermediate inputs (as in a flooding event) is developed byDietzenbacher & Lahr (2013). They apply the method of hypo-thetical extractions to the analysis of impact assessment. Themethod proposes to extract, partially or totally, the intermediatetransactions of a sector within the economy. This is, replacing therow or column of the affected sector with zeros (or smaller pro-portions of the original value). A new level of production is calcu-lated under this condition. The difference with the original level ofproduction constitutes the effect of the disaster in the economy.The main contribution of this approach is, in a consistent way,considering the forwards effects of a shock within the demand-driven IO model. However, Oosterhaven and Bouwmeester (2016)have argued that the assessment of forward effects with thismethod is faulty, as what it is measured is the backwards effects ofthe reduction of intermediate sales of an industry. And not theforward effects of the reduction of inputs from the affected industryto the other purchasing industries. Although it provides with amethod to account for supply chain disruptions, within the IOframework, it fails in accounting for other effects when an economyfaces a natural disaster, such as the damage in non-productivesectors (or residential damages), and disruptions in productivecapacity due to constraints in labour force.
More recently, Koks et al. (2014) have used a Cobb-Douglasfunction to estimate the direct damages from labour and capitalconstraints, and the indirect damages incurred during the recoveryprocess are derived through the ARIO model. This approach con-stitutes a good comparison for the flood footprint model, as it alsoincorporates restrictions in the productive capacity of labour usinga different approach.
A new approach developed by Oosterhaven and Bouwmeester(2016) is based on a non-linear program that minimises the infor-mation gain between the pre-disaster and post-disaster situation ofeconomic transactions. The model is successful in reproducing therecovery towards the pre-disaster economic equilibrium. The
model has been tested just hypothetically and further developmentis to be done for applications to real cases. Some aspects of disasterimpact analysis are left aside, as the damage to residential capital,or the recovery of productive capacity of labour.
Considering the existing models used in disaster impact anal-ysis, this paper applies the new concept of flood footprint to mea-sure the total socioeconomic impact that was directly and indirectlycaused by the 2007 summer floods in the Y&H region. This newdamage accounting framework combines the advantages of exist-ing models used in disaster risk analysis, including the analysis ofcapital damages by industrial sector as well as labour constraints; italso considers post-disaster economic imbalances and supply bot-tlenecks. To model the recovery process, the allocation of resourcesthrough a rationing scheme is proposed to satisfy the restoration ofindustrial capital and households' damages. The possibilities ofchanges in final demand are also accounted for through themodelling of consumers’ adaptive behaviour.
3. Flood footprint assessment framework
In this section, the rationale of the flood footprint model is dis-closed in detail. Regarding the mathematical symbols andformulae, matrices are represented by bold-italic capital letters(e.g., X), vectors by bold-italic lowercase (e.g., x) and scalars by italiclowercase (e.g., x). By default, vectors are column vectors, with rowvectors obtained by transposition (e.g.x0); a conversion from avector (e.g., x) to a diagonal matrix is expressed as a bold lowercaseletter with a circumflex (i.e.bx); the operators ‘.*’ and ‘./’ are used toexpress element-by-element multiplication and the element-by-element division of two vectors, respectively.
The IO model is founded on the basic idea of the circular flow ofan economy in equilibrium. The IO tables present the inter-industrial transactions of the whole economy in a linear array. Inmathematical notation it is presented as:
x ¼ Axþ f (1)
Where x is a vector of dimension 1xn (where n is the number ofindustry sectors) representing the total production of each indus-trial sector,5 Ax represents the intermediate demand vector, whereeach element of the matrix A, ½aij�, refers to the technical relationshowing product i needed to produce one unit of product j. Finally,f indicates final demand vector of products.
Based on the IO modelling, the assessment of the damage by theflood footprint modelling departs from the Basic Equation conceptcoined by Steenge and Bo�ckarjova (2007). This is a closed6 IOmodelthat represents an economy in equilibrium. The equilibrium impliesthat total production equals total demand with the full employ-ment of productive factors, including both capital and labour, as inequation (2).�A f =lTl0 0
��xlT
�¼�
xlT
�(2)
and lT ¼ l0x (3)
where l0 is a row vector of technical labour coefficients for eachindustry, showing the relation of labour needed in each industry to
produce one unit of product.:�lixi
�li is the industrial level of
considered within the model.
D. Mendoza-Tinoco et al. / Journal of Cleaner Production 168 (2017) 655e667 659
employment. The scalar lT is the total level of employment in theeconomy.
All inter-industrial flows of products as well as industrialemployment are considered as the necessary inputs involved in theproduction of each unit of output. A linear relation between theproductive factors (labour and capital) and the output in eachsector is assumed in IO analysis, suggesting that inputs should beinvested in fixed proportions for proportional expansion in output.
However, this equilibrium is broken after a disaster, and in-equalities arise between productive capacity and demand. In thenext section, we introduce the possible sources of theseinequalities.
3.1. Sources of post-disaster inequalities
After a disaster, market forces become imbalanced, leading togaps between supply and demand in different markets. The causesof these imbalances may be varied, and they constitute the origin ofthe ripple effects that permeate the economy of the flooded region.
3.1.1. Labour productivity constraintsThe production functions in the IO model assume a
complements-type technology where the productive factors e la-bour and capital e maintain a fixed relationship in the productionprocess. Constraints in any of the productive factors will produce,therefore, a proportional decline in productive capacity, evenwhenother factors remain fully available. Therefore, labour constraintsafter a disaster may impose severe knock-on effects on the rest ofthe economy. This makes labour constraints a key factor to considerin disaster impact analysis. In the flood footprint model, theseconstraints can arise from employees’ inability towork as a result ofillness or death, or from commuting delays due to damaged ormalfunctioning transport infrastructure. In the model, the propor-tion of surviving production capacity from the constrained labourproductive capacity (xtl ) after the shock is:
x tl ¼ �i� gt
l�:�x0 (4)
and gtl ¼
�l0 � lt
:.l0 (5)
where gtl is a vector where each element contains the proportion of
labour that is unavailable at each time t after the flooding event.The vector i is a vector of ones of the same dimension as gt
l , so that
the vector ði� gtl Þ contains the surviving proportion of employ-
ment at time t. x0 is the pre-disaster level of production.The proportion of the surviving productive capacity of labour is
thus a function of the loss from the sectoral labour force and its pre-disaster employment level. Following the fixed proportionassumption of the production functions, the productive capacity oflabour after the disaster (xtl ) will be a linear proportion of thesurviving labour capacity at each time step.
3.1.2. Capital productivity constraintsSimilar to labour constraints, productive capacity from indus-
trial capital during the flooding aftermath (xtcap) will be constrainedby the surviving capacity of the industrial capital. The share ofdamage to each sector are disclosed in the event account vector(EAV), following Steenge and Bockarjova (2007) Then, theremaining production capacity of industrial capital at each time-step, is:
xtcap ¼�I � gt
cap
�x0 (6)
and gtcap ¼
�k0 � kt
.k0 (7)
where, x0 is the pre-disaster level of production, gtcap is the EAV, a
column vector showing the share of damages of productive capitalin each industry. k0 is the vector of capital stock in each industry in
the pre-disaster situation, kt is the surviving capital stock in eachindustry at time t during the recovery process.
During the recovery, the productive capacity of industrial capitalis restored gradually through both local production/reconstructionand imports.
3.1.3. Post disaster final demandOn the other side of the economic system, final demand may
vary for diverse reasons. On the one hand, the recovery processinvolves the reconstruction and replacement of damaged physicalcapital, which increases the final demand for those sectors involvedin the reconstruction process, namely, the reconstruction demand,f rec. On the other hand, final demand may also decrease after adisaster. Based on Li et al. (2013), it has been noted that after adisaster, strategic adaptive behaviour would lead people to ensuretheir continued consumption of basic commodities, such as foodand medical services, while reducing consumption of other non-basic products.
In the model, we consider the adaptive consumption behaviourof households. Here, the demand for non-basic goods is assumed todecline immediately after the disaster, while consumption in in-dustries providing food, energy, clothing and medical services re-mains at pre-disaster levels.
Recovery in household consumption is driven by two comple-mentary processes. For consumption adaptation, we consider a
short-run tendency parameter (dt1), which is modelled as the rate
of recovery in consumption at each time step. The rationale here isthat consumers restore their consumption according to marketsignals about the recovery process. Likewise, a long-run tendency
parameter (dt2) is calculated as a recovery gap, i.e., the total demand
minus the total production capacity compared against the totaldemand at each time step. These two parameters are calculated foreach sector. So, the expression for dynamic household consumptionrecovery is:
f thh ¼�m0 þ dt1 þ dt2
:*c0 (8)
where the parameter m0 is a scalar which expresses the reducedproportion of household demand (a parameter similar to the EAV)over time, and the vector c0 represents the pre-disaster level ofhousehold expenditure on products by industrial sector.
The rest of the final demand categories recover proportionally tothe economy, based on the share of each category regarding pre-disaster final demand. It should be noted the trade-off of re-sources allocation between final demand and the reconstruction
process. The adapted total final demand (f t), then, is modelled asfollows:
f t ¼Xk
f tk þ f trec (9)
where ft is the adapted total final demand at each time step t,including the reconstruction demand for damaged industrial and
residential capital (f trec ¼ f tcap þ f thh). It also includes the final
D. Mendoza-Tinoco et al. / Journal of Cleaner Production 168 (2017) 655e667660
demand for all final consumption categories, indicated by the
summationPkf tk, where the subscript k refers to the vector of each
category of final consumption: k ¼ 1 is for the adapted household
consumption ( f thh), k ¼ 2 is for government expenditure, k ¼ 3 isfor investment in capital formation, and k ¼ 4 is for external con-sumption or exports.
The adapted total demand for each sector, (xttdðiÞ), can thus be
calculated as follows:
xttdðiÞ ¼Xnj¼1
aijxttdðiÞ þ f ti (10)
Equations (4)e(10) describe the changes on both sides of theeconomy's flow e production and consumption e where imbal-ances in the economy after a disaster arise from the differences inthe productive capacity of labour, the productive capacity of in-dustrial capital, and changes in final demand. From this point, therestoration process starts to return the economy to its pre-disasterequilibrium production level.
3.2. Post-disaster recovery process
The following section describes the process of recovery. Here, aneconomy can be considered as recovered once labour and industrialproduction capacities are in equilibrium with total demand andproduction is restored to the pre-disaster level. How to use theremaining resources to achieve pre-disaster conditions is modelledbased on a selected rationing scheme.
The first step is to determine the available production capacityin each period after the disaster. Within the context of Leontiefproduction functions, the productive capacity is determined for theminimum of either productive factor, capital and labour, as shownbelow:
xttp ¼ minnxtcap; x
tl
o(11)
Secondly, the level of the constrained production capacity iscompared with the total demand to determine the allocationstrategy for the remaining resources and for reconstruction plan-ning. The rules of this process constitute what it is called the ra-tioning scheme, described below.
3.2.1. Rationing schemeThe recovery process requires allocating the remaining re-
sources to satisfy society's needs during the disaster's aftermath.Thus, the question of how to distribute and prioritize the availableproduction based on the remaining capacity of industry or finalcustomer demand becomes essential, as recovery time and indirectcosts can vary widely under different rationing schemes.
This case study used a proportional-prioritization rationingscheme that first allocates the remaining production among theinter-industrial demand (Axttp) and then attends to the categories offinal demand.7 This assumption is built on the rationale thatbusiness-to-business transactions are prioritised, based on theobservation that these relations are stronger than business-to-client relationships (St�ephane Hallegatte, 2008; Li et al., 2013).
Thus, when calculating the productive possibilities of the next
7 We assume here that the productivity of any of the productive factors does notchange during the recovery process, as is the case with Leontief production func-tions. We also assume that the disaster happens just after time t ¼ 0 and that therecovery process starts at time t ¼ 1.
period, actual production is first compared with inter-industrialdemand. Defining oti ¼
PjAijxttpðjÞ as the production required in in-
dustry i to satisfy the intermediate demand of the other industries,two possible scenarios may arise after the disaster (Hallegatte,2008):
The first scenario occurs if xttpðiÞ < oti , in which case the pro-
duction from industry i at time t in the post-disaster situation(xttpðiÞ) cannot satisfy the intermediate demands of other industries.
This situation constitutes a bottleneck in the production chain,
where production in industry j is then constrained byxttpðiÞoti
xttpðjÞ,
wherexttpðiÞoti
is the proportion restricting the production in industry j,
xttpðjÞ.This process proceeds for each industry, after which there must
be consideration of the fact that industries producing less will alsodemand less, in turn affecting and reducing the production of otherindustries. The iteration of this process continues until productioncapacity can satisfy this adapted intermediate demand and someremaining production is liberated to satisfy part of the final andreconstruction demand and increase the productive capacity thenext period. This situation leads to a partial equilibrium, where
level of the adapted intermediate demand is defined as Axt*
tp, where
the asterisk in xt*
tp represents the adapted production capacity thatprovides the partial equilibrium, and is smaller than the actualproduction capacity (xttp) from equation (11).
This process continues until the total production available ateach time, xttpðiÞ, can satisfy the intermediate demand at time t, oti .
The second scenario occurs when xttpðiÞ > oti . Then, the inter-
mediate demand can be satisfied without affecting the productionof other industries.
In both cases, the remaining production after satisfying the in-termediate demand is proportionally allocated to the recoverydemand and to other final demand categories in accordance withthe following expressions:
�xt*tp � A*xttp
$* f 0k $
, Xk
f 0k þ f trec
!(12)
�xt*tp � A*xttp
$* f trec $
Xk
f 0k þ f trec
!(13)
Equation (12) refers to the distribution of product to the k cat-egories of final demand, while equation (13) refers to the propor-tion of available product that is designated to reconstruction.
The expression ðxttp � A*xttpÞ refers to the production left after
satisfying the intermediate demand, andPkf 0k refers to the total
final demand in the pre-disaster period, so that the production leftafter satisfying intermediate demand is allocated among the cate-gories of final demand following the proportions of pre-disastercondition, plus the consideration of the reconstruction needs for
recovery (f trec). Note that for the first scenario, the expression A�xttpbecomes A�xt�tp and represents the adapted intermediate demand,
where xt*
tp is smaller than the actual production capacity, xttp.Additionally, we assume that part of the unsatisfied final de-
mand is covered by imports, some of which contribute to the re-covery when allocated to reconstruction demand.
D. Mendoza-Tinoco et al. / Journal of Cleaner Production 168 (2017) 655e667 661
3.2.2. ImportsIn the flood footprint model, imports help in the reconstruction
process by supplying some of the inputs that are not internallyavailable to meet reconstruction demand. Additionally, if thedamaged production capacity is not able to satisfy the demand offinal consumers, they will rely on imports until internal productionis restored and they can return to their previous suppliers.
There are some assumptions underlying imports. First, importswill be allocated proportionally among final demand categories andreconstruction demand. Second, commodities from other regionsare assumed to be always available for provision at the maximumrate of imports under the pre-disaster condition. Third, there aresome types of goods and services that, by nature, are usually sup-plied locally (such as utilities and transport services), making itinfeasible to make large scale adjustments over the time scale ofdisaster recovery. Finally, imports are assumed to be constrained bythe total importability capacity,which here is defined as the survivalproductive capacity of the transport sectors (see equation (14)). Theassumption is that the capacity of transporting goods is propor-tional to the productive capacity of the sectors related with trans-port, so that if the production value of sectors related withtransport services is contracted by x% in time t, the imports willcontract by the same proportion, in reference to the pre-disasterlevel of imports, mt .
mt ¼ x*ðtÞtran
x0tran*m0
!(14)
wherem0 is thevectorof pre-disaster imports, andx0tran andx*ðtÞtran are
the scalars denoting the pre-disaster and post-disaster productioncapacities of the sectors related with transport. The subscript tranrefers to aggregated transport sectors by land, water and air. If sec-tors relatedwith transport are 2 ormore, then x0tran is the sum of the
product of those sectors at pre-disaster level, and x*ðtÞtran is the productof those sectors at time t during recovery, obtained from the vectorsof productive capacity, x0 and x�ðtÞ, respectively.
3.2.3. RecoveryDecisions to return to pre-disaster conditions can be complex
and varied. Here, we have assumed away of adapting to a conditionof balanced production and demand. That is, we pursue a partialequilibrium for productive capacities at each time period� throughthe rationing scheme � and then follow a long-term growth ten-dency towards the pre-disaster level of production � through thereconstruction efforts.
It should be remembered that the recovery process implicatesthe repair and/or replacement of the damaged capital stock andhouseholds. During this process, production capacity increasesboth through local production and through imports allocated toreconstruction demand.
Then, the productive capacity of each industry for the nextperiod incorporates the rebuilt capacity of the last period:
xtþ1capðiÞ ¼ xtcapðiÞ þ DxtcapðiÞ (15)
where: DxtcapðiÞ ¼ gi
8<:24mt
i þ0@xttpðjÞ �
Xnj¼1
aijxttpðjÞ
1A35*
"f tcapðiÞ
Xk
f 0kðiÞ þ f trecðiÞ
!#9=;where gi encloses the functional relation (or ratio) between capital
and production to each sector, and the argument of the functionrepresent the amount of resources invested in capital reconstruc-tion by sector. And where mt
i þ ðxttpðjÞ �Pn
j¼1aijxttpðjÞÞ is the total
product (regional and imported) allocated to final consumption,while the expression f tcapðiÞ = ð
Pkf 0kðiÞ þ f trecðiÞÞ refers to howmuch of
that product is allocated to capital reconstruction each time period.Note that the proportion of affected capital �the EAV� changes
for each sector by the amount:
gti � gtþ1i
¼hmt
i þ�xttpðiÞ �
Pnj¼1aijx
ttpðjÞi
*hf tcapðiÞ
. �Pk f
0kðiÞ þ f trecðiÞ
if 0recðiÞ
(16)
The new level of production is compared with the level of labourcapacity at the next time-step. Then, the process described above isrepeated until an equilibrated economy of the pre-disaster pro-duction level is reached.
The driving forces of recovery are constituted, then, by theprogressive restoration of the productive capacity of industrialcapital by means of internal production and imports allocated toreconstruction demand, by the restoration of the labour force, andby the recovery of final demand.
3.3. Flood footprint modelling outcomes
The flood footprint model provides us with the outcomes ofdiverse economic variables over the course of the recovery process.All results are provided at each time-step during restoration and ata disaggregation level of 46 industrial sectors. The time that eachvariable and sector requires to achieve its pre-disaster level is,likewise, provided by the model.
Results of the direct and indirect damages constitute the prin-cipal outcomes of the model.
The direct damages account for the value and the proportion ofthe damages to the physical infrastructure, both to industrial andresidential capital. To determine these, we construct the EAV withthe proportion of damage to the capital stock as the cost ofreconstruction. The model, in turn, translates the damage from thisstock variable into damages to productivity, a flow variable.
The indirect damages account, period by period, for non-realisedproduction owing to constraints in both productivity and demand,i.e., the cascading effects from the direct damages.
The model delivers the dynamics of recovery for other variables,including industrial productive capacity as rebuilt capital; labourproductive capacity, which is linked to the restoration of residentialcapital and transportation facilities; the contribution of imports tothe economy during the recovery process (as the proportion of finaldemand satisfied by external suppliers and of production allocatedto reconstruction, both of which are processes also linked to theprocess of transport restoration); and final demand, as the resto-ration of levels of consumption in each category, which is influ-enced by adaptive behavioural modelling for the case of householdconsumption.
It should be considered that the trajectories of the variables’recoveries are influenced by the assumptions and decisionsconsidered for reconstruction, such as the establishment of therationing scheme. On the other hand, a sensitivity analysis of theparameters is performed to obtain robust results and to determinehow the results are influenced by changes in the parameters.
D. Mendoza-Tinoco et al. / Journal of Cleaner Production 168 (2017) 655e667662
4. Data gathering and codification
The Flood Footprint model requires two sets of data: economicdata about the affected region and information about the disaster.All of the values are for 2007, and when they are monetary they arein millions of pounds (£million) at 2009 prices. A monthly timescale is used for the temporal analysis, and the sectoral disaggre-gation uses 46 economic sectors (see sectors disaggregation in theEAV provided in the appendix).
4.1. Economic data
The economic data include information on capital stock, finaldemand, employment, and inter-industrial transactions. All the in-formation is at the regional level, andwhen available itwas obtainedfrom official data; otherwise, a regionalization was carried out.
Capital stock data are only available at the national level. Theregionalization consisted of obtaining the productivity of eachsector at the national level and then adjusting by regional output,assuming the same productivity as the national average. Theregional dwelling capital is the proportion of housing in the regionmultiplied by the national dwelling capital. For the region of Y&H,this accounts for 8%.
The categories for final demand, i.e., households, government,capital, imports and exports, were obtained from the UK-Multisectoral Dynamic Model (MDM) by Cambridge EconometricsLtd,8 a macro-econometric model used to analyse and forecastenvironmental, energy and economic data for twelve regions in theUK. The data used for the analysis were for the region of Y&H and46 industry sectors.
Employment data are usually available at a very detailedregional scale; thus, these data were obtained directly from officialdata. However, the sectoral disaggregation was not consistent withthe rest of the data. To match the data with the 46-sector disag-gregation, a weighted distribution was followed based on bothnational employment and the value-added data from the MDM.
For inter-industrial transactions data, a regionalised matrix oftechnical coefficients had to be derived from the national IO tablesfollowing themethodology developed by Flegg andWebber (2000),owing to the lack of regional tables (see supporting information forthe regionalization technique). The transactions’ values are ob-tained later by multiplying the regional matrix of technical co-efficients by the regional output.
4.2. Disaster data
Ideally, the disaster data comprise information of damages toindustrial capital, residential capital, and infrastructure; reductionsin labour capacity; and changes in final demand.
The main source for the disaster data is the UK EnvironmentalAgency, and the information for the analysed event is disclosed inthe report ‘Economic Impacts of Flood Risk on Yorkshire andHumber. Cost of 2007 Floods’ (Ash et al., 2008).
For damages to industrial capital, the report states a total cost of£380 million for business premises, stock, equipment, etc. Addi-tionally, the £470 million of damages to infrastructure are allocatedto infrastructure sectors, namely Transport, IT services, Electricity &Gas, Water & Sewerage & Waste, PAD, and Education and Healthsectors. As the sectoral disaggregation was for 15 categories, anallocation of damage to each sector was made through a weighteddistribution based on the share of the sector in the regional econ-omy. These data were compared with stocks of industrial capital to
8 http://www.camecon.com/how/mdm-e3-model/.
determine the proportion of affected productive capacity, i.e., thevalues of the EAV (see Appendix for the values of the EAV for eachindustry).
Regarding residential damage, 10,759 houses were reportedflooded, representing 0.6% of total housing in the region. Totalhousehold damages were estimated at £340 million by the UKEnvironmental Agency.
Labour constraints, about which hard data are unavailable, werederived from the number of flooded houses multiplied by theaverage number of working people per household. Additionally,commuting delays were proportionally related to damage in thetransport sectors. This resulted in one tenth of the proportionaleffect in transport, as a proportion of affected labour, and a delay of1 h in commuting for 1.5% of the regional population.
Finally, as information on changes in final demand is very scarce,we follow a sensitivity analysis over different levels of reduction innon-basic products. The values for the analysis show a decrease of0.25% in households’ demand for non-basic industries and a re-covery time of 6 months with positive and marginally decreasinggrowth, i.e., a higher recovery rate for the first periods, which slowsdown at the end of the recovery.
5. Results
5.1. Total economic loss for Yorkshire and The Humber region
The Y&H region is located in the north-western region of the UK.The annual GVA in 2007 was over £88 billion (at 2009 prices),which represents around 7% of total UK's value added for that year.Likewise, there are around 2.6 million employees in the region,which constitute over 8% of the total UK's labour force.
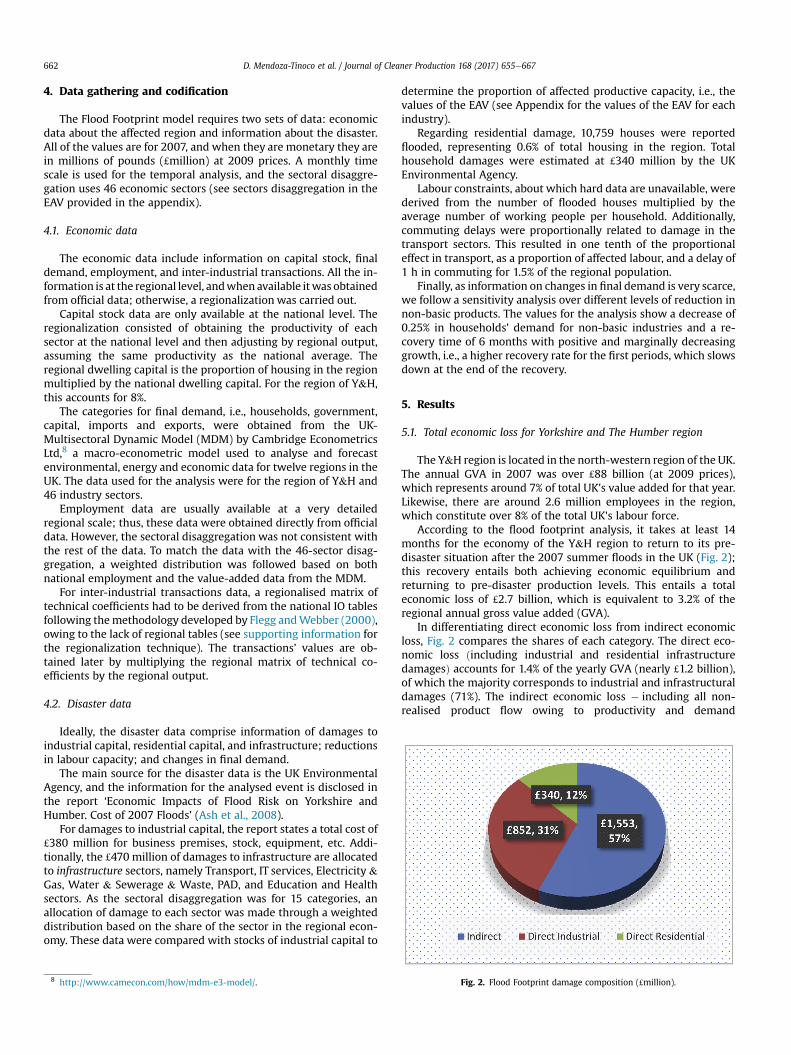
According to the flood footprint analysis, it takes at least 14months for the economy of the Y&H region to return to its pre-disaster situation after the 2007 summer floods in the UK (Fig. 2);this recovery entails both achieving economic equilibrium andreturning to pre-disaster production levels. This entails a totaleconomic loss of £2.7 billion, which is equivalent to 3.2% of theregional annual gross value added (GVA).
In differentiating direct economic loss from indirect economicloss, Fig. 2 compares the shares of each category. The direct eco-nomic loss ðincluding industrial and residential infrastructuredamagesÞ accounts for 1.4% of the yearly GVA (nearly £1.2 billion),of which the majority corresponds to industrial and infrastructuraldamages (71%). The indirect economic loss � including all non-realised product flow owing to productivity and demand
Fig. 2. Flood Footprint damage composition (£million).

Fig. 4. Sectoral distribution of damage.
D. Mendoza-Tinoco et al. / Journal of Cleaner Production 168 (2017) 655e667 663
shortages � accounts for an additional 1.8% of the city's GVA, ataround £1.5 billion. This represents 57% of the total flood footprint.
5.2. Economic recovery
The present section describes the progress of the economicvariables involved in the recovery process.
Figure 3a) depicts the accounting of the cumulative damageduring the recovery process. The area in purple, which indicates thedistance between the final demandmet by the available productionat each time step and the pre-disaster level, represents the totalindirect damage over the course of the recovery process. It can benoted that the initial shock represents a decrease of 0.4% of theproductive capacity. The shape of the curve shows a fast recovery inthe beginning, especially in the first 4e5 months, at which time theeconomy has recovered approximately 90% of its damaged pro-ductive capacity. It must be noted, however, that the recovery-curve shape is influenced by the rationing scheme chosen for themodelling, where the inter-industrial and recovery demand isprioritised over other final demand.
Figure 3b) displays the recovery process of productive capacity,including both labour and industrial capital capacities. The figureindicates that industrial capital constraints constitute the mainsource of production disruptions in the first period after thedisaster, being responsible for the 0.4% fall in productivity. How-ever, this recovers rapidly, and labour disruptions happen to be themain constraint on productive capacity.
Fig. 3 c depicts the dynamics of final demand in the aftermath ofthe disaster. The green line indicates the adaptation and recovery
Fig. 3. Recover
process of the final demand. This variable includes the adaptedbehaviour of final consumers and the reconstruction demand. Onthe other hand, the red line shows how much of that adapted de-mand can be supplied by the actual constrained capacity of pro-duction. Part of the demand that cannot be satisfied by internalproduction is supplied through imports, as the black line illustrates.
Finally, Fig. 3 d indicates the inequalities that remain betweenthe level of production required by the final demand during therecovery process and the product supply from the surviving pro-duction capacity during the aftermath.
y process.
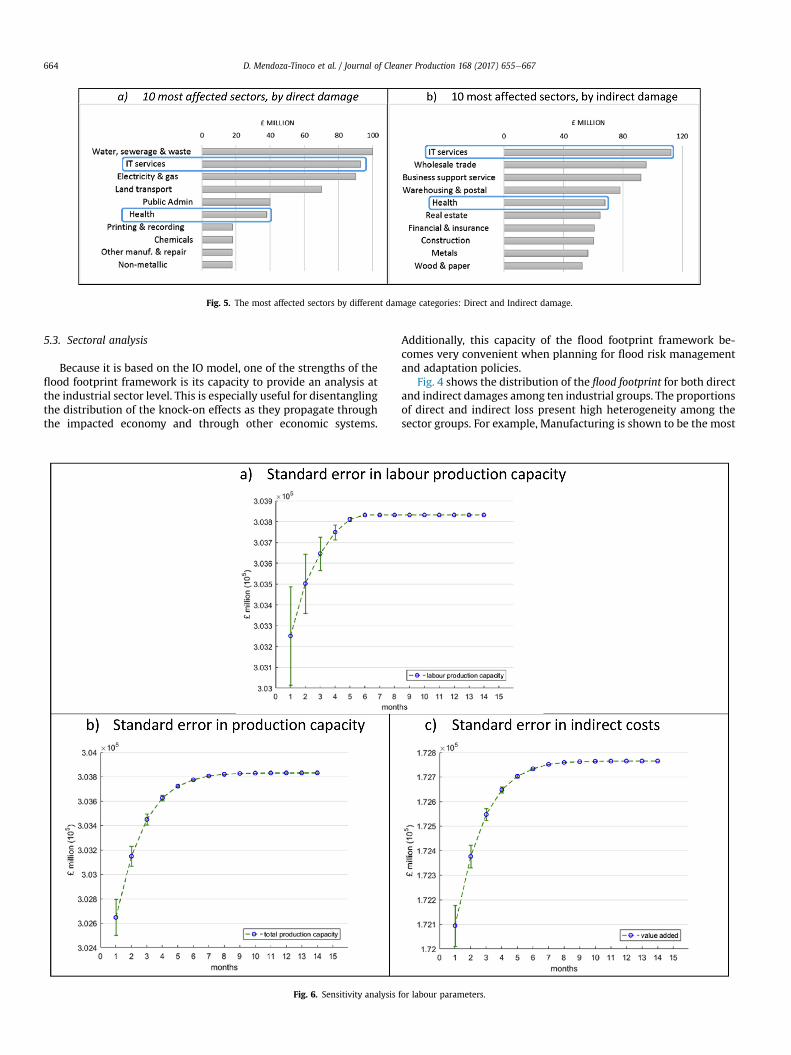
Fig. 5. The most affected sectors by different damage categories: Direct and Indirect damage.
D. Mendoza-Tinoco et al. / Journal of Cleaner Production 168 (2017) 655e667664
5.3. Sectoral analysis
Because it is based on the IO model, one of the strengths of theflood footprint framework is its capacity to provide an analysis atthe industrial sector level. This is especially useful for disentanglingthe distribution of the knock-on effects as they propagate throughthe impacted economy and through other economic systems.
Fig. 6. Sensitivity analysis
Additionally, this capacity of the flood footprint framework be-comes very convenient when planning for flood risk managementand adaptation policies.
Fig. 4 shows the distribution of the flood footprint for both directand indirect damages among ten industrial groups. The proportionsof direct and indirect loss present high heterogeneity among thesector groups. For example, Manufacturing is shown to be the most
for labour parameters.
D. Mendoza-Tinoco et al. / Journal of Cleaner Production 168 (2017) 655e667 665
affected sector, with a share of indirect loss 60% higher than directloss, and the total damages in this group account for 23% of the totalflood footprint. The utilities sector suffers major direct damages(£190 million), as infrastructure damages are allocated among thissector. The Financial & Professional sector is the most indirectlyaffected, with 21% of total indirect damages, while just 9% of totaldirect damages are concentrated in this group (see Fig. 5).
At a more disaggregated level (46 sectors), Fig. 4 depicts the tenmost affected sectors for direct (a) and indirect (b) economic losses,respectively. The major direct damage is concentrated in thosesectors forming the Utilities Sector group. The most affected sectoris Water, Sewerage &Waste, accounting for 35% of direct economicloss in the Utilities Sector group and 12% of the total direct damage.Regarding indirect damages, the IT services sector, from the Infor-mation & Communication group sector, was the most damaged,accounting for 86% of this group's losses and 11% of the total indi-rect damages.
Finally, it is noteworthy that two sectors appear in both cate-gories: the IT Services and Health sectors. This indicates they areamong the most vulnerable sectors in the region. The flood foot-print in these sectors accounts for 13% of the total flood footprint.
Fig. 7. Sensitivity analysis for
5.4. Sensitivity analysis
Uncertainty in the model mainly comes from the lack of data inlabour and final demand variables, and some assumptions appliedto calibrate the correspondent parameters. To prove the robustnessof the results, a sensitivity analysis is performed on labour and finaldemand parameters.
The sensitivity analysis comprises the upwards and downwardsvariation of 30% of the parameters in intervals of 5%.
5.4.1. Changes in labour parametersThe variation of parameters comprises the proportion of labour
not available for traveling, and the proportion and time of labourdelayed by transport constraints.
The results of the sensitivity analysis, as presented in Fig. 6,show that variations in labour parameters have a less-than-proportional effect in indirect costs and the total production ca-pacity, and these are decreasing over time. Other variables are notaffected by variations in labour parameters.
The standard deviation of the total variation of labour produc-tive capacity is about £483 million, which causes a standard
final demand parameters.
D. Mendoza-Tinoco et al. / Journal of Cleaner Production 168 (2017) 655e667666
deviation of £297 million in total production capacity, and a stan-dard deviation of $168 million in indirect damages.
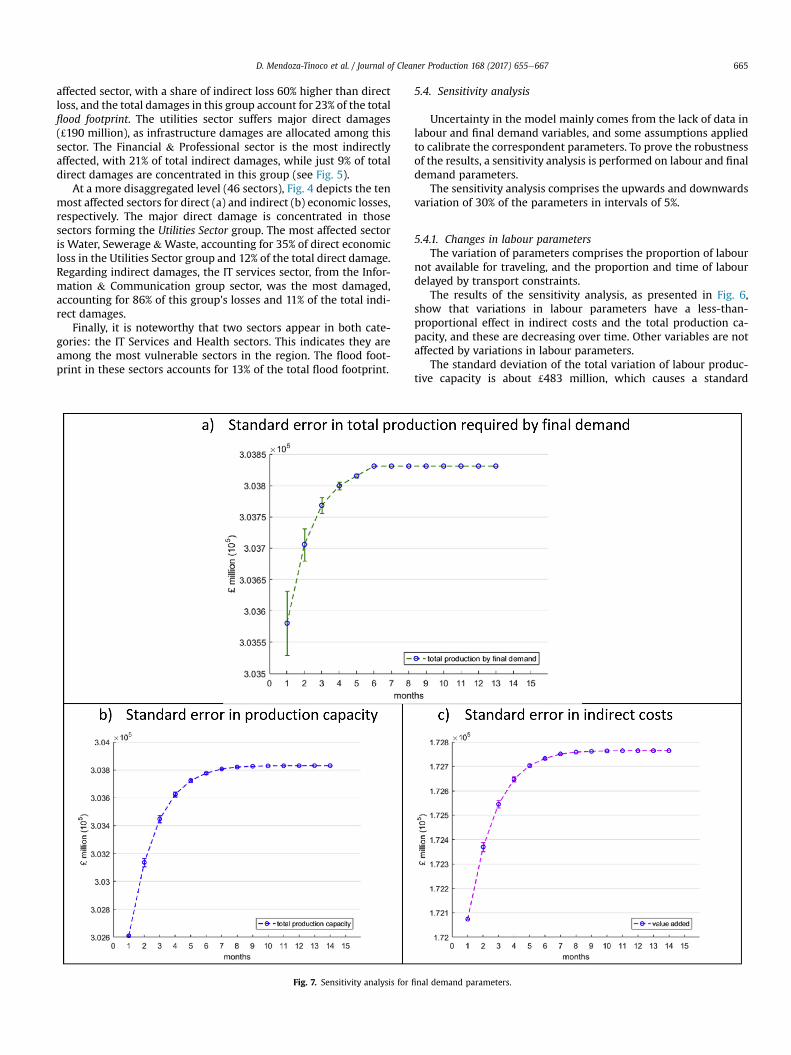
5.4.2. Changes in final demandThe variation of parameters comprises the decreased proportion
of consumption in non-basic products.The results of the sensitivity analysis, as presented in Fig. 7,
show that variations in final demand parameters have a less-than-proportional effect in indirect costs and the total production ca-pacity, and these are decreasing over time. Other variables are notaffected by variations in labour parameters.
The standard deviation of the total variation of total productionrequired by final demand is about £96 million, which causes astandard deviation of £93million in total production capacity, and astandard deviation of $54 million in indirect damages.
6. Conclusions
The increasing frequency and intensity of weather-related di-sasters require more accurate and comprehensive information ondamages. This will support better risk management and adaptationpolicies to achieve economic sustainability in the affected cities inthe upcoming years. For instance, the 2007 summer floods caused anational emergency in England, and Yorkshire and the Humber wasthe most affected region.
This paper is the first study to apply the flood footprint frame-work to a real past event, the 2007 summer floods in the Yorkshireand The Humber region. This analysis supports the importantlesson that losses from a disaster are exacerbated by economicmechanisms, and that knock-on effects (or indirect damage)constitute a substantial proportion of total costs and that some ofthe most affected sectors can be those that are not directlydamaged. For this case study, the proportion of indirect damagesaccounts for over half of the total flood footprint. The sensitivityanalysis proves the stability of the model and the robustness ofresults.
This research provides a quantitative evidence for policystakeholders that any direct damage may incur significant indirectimpact along the economic supply chain. The climate changeadaptation policy should start to consider minimising indirectimpact, especially those sectors hidden in the supply chain whichare vulnerable to labour loss, such as the services sectors. Notconsidering the indirect effects would mislead for actions in floodrisk management and would lead to an inefficient use of resources.
There are, however, some caveats that must be noted. The cur-rent study is subject to some degree of uncertainty. First, datascarcity is the main source of uncertainty, making the use of strongassumptions unavoidable in certain cases. Engineering floodmodelling and GIS techniques have been rapidly evolving in recentyears, providing new sources of information with great precisionand constructing the so-called damage functions,9 although thisprogress has demanded substantial computing, time and monetaryresources. The implementation of these techniques in futureresearch would considerably improve the accuracy of the analysis.Second, although the model effectively accounts for knock-on ef-fects in the affected regional economy, global economic intercon-nectedness requires us to move the analysis towards a multi-regional approach if we are to make an exhaustive impact assess-ment. Finally, additional research on labour and consumption re-covery would greatly improve the analysis, as these are areas thathave attracted less attention from researchers.
9 ‘Damage functions show the susceptibility of assets at risk to certain inundationcharacteristics, currently mostly against inundation depth’ (Messner et al., 2007).
Appendix A. Supplementary data
Supplementary data related to this article can be found at http://dx.doi.org/10.1016/j.jclepro.2017.09.016.
References
Ash, J., Fenn, T., Daly, E., Wels, N., 2008. Economic Impacts of Flood Risk on Yorkshireand Humber: Cost of 2007 Floods (Retrieved from).
Bockarjova, M., Steenge, A., van der Veen, A., 2004. On direct estimation of initialdamage in the case of a major catastrophe: derivation of the “basic equation”.Disaster Prev. Manag. 13 (4), 330e336.
Burton, I., Challenger, B., Huq, S., Kein, R.J.T., Yohe, G., 2001. Adaptation to climatechange in the context of sustainable development and equity. In:Change, I.P.o.C. (Ed.), Climate Change 2001: Impacts, Adaptation and Vulnera-bility. Cambridge University Press.
Chen, S.Q., Fath, B.D., Chen, B., 2011. Information-based Network Environ Analysis: asystem perspective for ecological risk assessment. Ecol. Indic. 11, 1664e1672.
Chen, S.Q., Chen, B., Fath, B.D., 2015. Assessing the cumulative environmentalimpact of hydropower construction on river systems based on energy networkmodel. Renew. Sustain. Energy Rev. 42, 78e92.
Cochrane, H., 1997. Economic impact of a midwest earthquake. NCEER Bull. 11 (1),1e15.
Cochrane, H., 2004. Economic loss: myth and measurement. Disaster Prev. Manag.13 (4), 290.
Cole, S., 2003. Protection, risk, and disaster in economic network. In: van derVeen, A., Arellano, A.L.V., Nordvik, J.P. (Eds.), In Search of a Common Method-ology for Damage Estimation. Workshop Proceedings. Office for Official Publi-cations of the European Communities: Joint NEDIES and University of Twente,Delft, the Netherlands.
Committee of Climate Change, 2016. UK Climate Change Risk Assessment 2017 (2)(Retrieved from London, UK). www.theccc.org.uk/uk-climate-change-risk-assessment-2017.
Dietzenbacher, E., Lahr, M.L., 2013. Expanding extractions. Econ. Syst. Res. 25 (3),341e360. http://dx.doi.org/10.1080/09535314.2013.774266.
Dietzenbacher, E., Miller, R.E., 2015. Reflections on the inoperability input-outputmodel. Econ. Syst. Res. 27 (4), 478e486. http://dx.doi.org/10.1080/09535314.2015.105375.
Flegg, A.T., Webber, C.D., 2000. Regional size, regional specialization and the FLQ.Formula. Reg. Stud. 34 (6), 563e569.
Greenberg, M.R., Lahr, M., Mantell, N., 2007. Understanding the economic costs andbenefits of catastrophes and their aftermath: a review and suggestions for theU.S. federal government. Risk Anal. 27 (1).
Haimes, Y., Jiang, P., 2001. Leontief-based model of risk in complex interconnectedinfrastructures. J. Infrastruct. Syst. 7, 1e12.
Haimes, Y.Y., ASCE, F., Horowitz, B.M., Lambert, J.H., ASCE, M., Santos, J.R., …,Crowther, K.G., 2005. Inoperability input-output model (IIM) for interdepen-dent infrastructure sectors: theory and methodology. J. Infrastruct. Syst. 11 (2),67e79.
Hallegatte, S., 2008. An adaptive regional input-output model and its application tothe assessment of the economic cost of Katrina. Risk Anal. 28 (3), 779e799.
Hallegatte, S., Przyluski, V., 2010. The Economics of Natural Disasters. Concepts andMethods. Policy Research Working Paper(5507).
Koks, E.E., Bockarjova, M., de Moel, H., Aerts, J.C.J.H., 2014. Integrated direct andindirect flood risk modeling: development and sensitivity analysis. Risk Anal.35 (5), 882e900. http://dx.doi.org/10.1111/risa.12300.
Leung, M., Haimes, Y.Y., Santos, J.R., 2007. Supply- and output-side extensions to theinoperability input-output model for interdependent infrastructures.J. Infrastruct. Syst. 13, 299e310.
Li, J., Crawford-Brown, D., Syddall, M., Guan, D., 2013. Modeling imbalanced eco-nomic recovery following a natural disaster using input-output analysis. RiskAnal. 16.
Messner, F., Penning-Rowsell, E., Green, C., Meyer, V., Tunstall, S., van der Veen, A.,2007. Evaluating Flood Damages: Guidance and Recommendations on Princi-ples and Methods.
Miller, R.E., Blair, P.D., 2009. Input Output Analysis: Foundations and Extensions, 2ed. Prentice-Hall, Englewood Cliffs, US.
Okuyama, Y., 2004. Modelling spatial economic impacts of an earthquake: input-output approaches. Disaster Prev. Manag. 13 (4), 297e306.
Okuyama, Y., 2007. Economic modeling for disaster impact analysis: past, present,and future. Econ. Syst. Res. 19 (2), 115e124.
Okuyama, Y., 2009. Critical Review of Methodologies on Disaster Impact Estimation.Background Paper to the Joint World Bank-UN Assessment on the Economics ofDisaster Risk Reduction.
Oosterhaven, J., 2017. On the limited usability of the inoperability IO model. Econ.Syst. Res. http://dx.doi.org/10.1080/09535314.2017.1301395.
Oosterhaven, J., Bouwmeester, M.C., 2016. A new approach to modeling the impactof disruptive events. J. Reg. Sci. 56 (4), 583e595.
Pitt, M., 2008. The Pitt Review (Retrieved from).Romanoff, E., Levine, S., 1981. Anticipatory and responsive sequential Interindustry
models. IEEE Trans. Syst. Man, Cybern. 1 (3), 181e186.Rose, A.Z., 1995. Input-output economics and computable general equilibrium
models. Struct. Change Econ. Dyn. 6 (3), 295e304.

D. Mendoza-Tinoco et al. / Journal of Cleaner Production 168 (2017) 655e667 667
Rose, A.Z., 2004. Economic principles, issues, and research priorities in hazard lossestimation. In: Okuyama, Y., Chang, S.E. (Eds.), Modelling Spatial and EconomicImpacts of Disasters. Springer-Verlag, Berlin Heidelberg New York.
Santos, J.R., Haimes, Y.Y., 2004. Modeling the demand reduction input-output (I-O)inoperability due to terrorism of interconnected infrastructures. Risk Anal. 24(6), 1437e1451.
Santos, J.R., Rehman, A., 2012. Risk-based input-output analysis of hurricane im-pacts on interdependent regional workforce systems. Nat. Hazards 65 (1),391e405.
Santos, R.J., 2006. Inoperability input-output modeling of disruptions to interde-pendent economic systems, 9 (1), 20e34.
Steenge, A.E., Bo�ckarjova, M., 2007. Thinking about rigidities and imbalances inpost-catastrophe economies: an input-output based proposition. Econ. Syst.
Res. 19 (2), 2005e2223.Vanneuvill, W., Kellns, W., Maeye, P.D., Reiners, G., Witlox, F., 2011. Flood risk
management vs flood disaster management. Earthzine 8.Veen, A.V.d, 2004. Disasters and economic damage: macro, meso and micro ap-
proaches. Disaster Prev. Manag. 13 (4), 274e279.Veen, A.V.d, Logtmeijer, C., 2003. How Vulnerable are We for Flooding? A GIS
Approach. In: van der Veen, A., Arellano, A.L.V., Nordvik, J.P. (Eds.), In Search of aCommon Methodology for Damage Estimation. Workshop. Office for OfficialPublications of the European Communities: Joint NEDIES and University ofTwente, Delft.
Xu, W., Hong, L., He, L., Wang, S., Chen, X., 2011. Supply-driven dynamic inoper-ability input -output price model for interdependent infrastructure systems.J. Infrastruct. Syst. 17, 151e162.