journal of cleaner production - corrim · inputs and outputs associated with the production of...
TRANSCRIPT

lable at ScienceDirect
Journal of Cleaner Production xxx (xxxx) xxx
Contents lists avai
Journal of Cleaner Production
journal homepage: www.elsevier .com/locate/ jc lepro
Life cycle assessment of biochar produced from forest residues usingportable systems
Maureen Puettmann a, Kamalakanta Sahoo b, c, *, Kelpie Wilson d, Elaine Oneil e
a WoodLife Environmental Consultants & Consortium for Research on Renewable Industrial Materials (CORRIM), United Statesb Forest Products Laboratory, United States Forest Service, Madison, WI, 53726, United Statesc Department of Biological Systems Engineering, University of Wisconsin-Madison, Madison, WI, 53706, United Statesd Wilson Biochar Associates, United Statese University of Washington & CORRIM, United States
a r t i c l e i n f o
Article history:Received 28 June 2019Received in revised form22 November 2019Accepted 3 December 2019Available online xxx
Handling Editor: Panos Seferlis
Keywords:Forest residuesBiocharLife-cycle assessmentPortable systems
* Corresponding author. Forest Products LaboratoryMadison, WI, 53726, United States.
E-mail address: [email protected] (K.
https://doi.org/10.1016/j.jclepro.2019.1195640959-6526/© 2019 Elsevier Ltd. All rights reserved.
Please cite this article as: Puettmann, M et alCleaner Production, https://doi.org/10.1016/
a b s t r a c t
Forest fires are getting extreme and more frequent because of increased fuel loads in the forest andextended dry conditions. Fuel treatment (i.e., thinning) methods to mitigate forest fires will generatelarge volumes of forest residues together with available logging residues that can be used to producebiochar. It has been proposed that portable biochar systems are economical means to utilize forestresidues as an alternative to slash burning. In this study, the environmental impacts of biochar producedfrom forest residues using three portable systems [1. Biochar Solutions Incorporated (BSI), 2. Oregon Kiln,and 3. Air-curtain Burner] were evaluated using a cradle-to-gate life-cycle assessment approach. Envi-ronmental impacts were analyzed considering the various quality of feedstock, biomass collectionmethods, different production sites, and various sources of power used in the production of biochar. Theresults illustrate that the global warming potential (GWP) of biochar production from forest residuesthrough BSI, Oregon Kiln, and Air-Curtain Burner were 0.25e0.31, 0.11, and 0.16 tonne CO2eq./tonne offixed carbon in biochar respectively. Compared to pile burn, biochar production from forest residues witha portable system at the landing, reduced global warming potential (GWP) by 1.92e2.83, 2.7, and 1.9tonnes CO2eq./tonne of biochar through BSI, Oregon Kiln, and Air-Curtain Burner respectively. The Air-Curtain Burner and Oregon Kiln have minimal feedstock preparation, thus have lower environmentalimpacts than the BSI system. The BSI system requires feedstock preparation and power to operate thesystem. The use of the biomass-gasifier generator improved the environmental performance substan-tially (16e280%) compared with a diesel generator in biochar production. Overall, the net GWP in biocharproduced (0.10e1.63 tonne CO2eq./tonne of residues) from forest residues can reduce environmentalimpacts (2e40 times lower net CO2eq. emissions) compared to slash burning.
© 2019 Elsevier Ltd. All rights reserved.
1. Introduction
The most extensive forest management challenges in westernforests today revolve around fire and watersheds. Forest fires aregetting extreme and more frequent because of increased fuel loadsin the forest and longer dry climatic conditions (Cook and Becker,2017; Sahoo et al., 2019). Large-scale logging and fire suppressionhave resulted in overstocked stands of small-diameter trees thatare vulnerable to extreme fire (Noss et al., 2006). The acreage of
, United States Forest Service,
Sahoo).
., Life cycle assessment of bioj.jclepro.2019.119564
forestland that could be treated is extensive and disposal of thewaste wood (tops, limbs, and un-merchantable pulpwood) can beexpensive (Sahoo et al., 2019). In the United States (US), forest firescost lives and huge economic impacts. Forest residues left in theforest may increase the risk of wildfire and those need to bedisposed of for the replanting of the harvested forest. Usually, forestresidues are pile burned but it incurs a cost, creates air pollution,and large pile burning may alter soil thereby lowering site pro-ductivity for the residual trees for decades (Oneil et al., 2017; Page-Dumroese et al., 2010) and uncontrolled burning may lead to largewildfires. A study on the economic impact of wildfire reported thatthe direct cost for fire suppression, excluding property damage,reported costing $1.84 billion (Cook and Becker, 2017; Dale, 2009)]
char produced from forest residues using portable systems, Journal of
M. Puettmann et al. / Journal of Cleaner Production xxx (xxxx) xxx2
and the indirect cost, such as adverse health impacts, can cost from$76 - $130 billion/year in the US(Fann et al., 2018)].
The main economic obstacle to use forest residues is the highlogistics cost of collection and machinery (Mirkouei et al., 2017;Sahoo, 2017; Sahoo et al., 2016). Forest residues are spread acrosslarge areas, and thus incur high collection costs (Wright et al., 2008;Yazan et al., 2016). Furthermore, biomass transport and handlingcosts are high due to low bulk density, low energy density, and highmoisture content (Parkhurst et al., 2016; Sahoo et al., 2018). Forestresidues generated during commercial logging operations alsopresent a fire risk that must be treated or removed (Page-Dumroeseet al., 2017). Moreover, controlled burning forest residues also causeair pollution and other adverse human health impacts (Berrill andHan, 2017; Oneil et al., 2017). These residues are potentially avail-able for bioenergy and bio-based products, including biochar.
Other than chipping for biomass energy, themain alternative forforest residue disposal is the current practice of incinerating resi-dues onsite (i.e., burn piles), which can alter soil productivity, in-crease CO2 emissions, and produce particulates (Oneil et al., 2017;Page-Dumroese et al., 2010). Slash pile burning may alter soil mi-crobial populations, destroy seeds, and result in bare soil, which isvulnerable to colonization by invasive species (Korb et al., 2004).Smoke and particulate production from slash pile burning limitsthe burning window especially in air-quality limited watersheds,making it more difficult to accomplish thework (Cowie et al., 2012).in a review of biochar sustainability, concluded that the mostconsistent major contribution to climate mitigation arises fromcarbon storage in the biochar. The categories of avoided emissionsfrom fossil energy, soil, or alternative biomass waste disposalmethods were highly variable and dependent on specific scenarios.
Large scale biochar production using slow pyrolysis had beenproposed as a viable option. Mobile systems have been proposed tolower the cost of transporting forest residues to industrial facilities(Berry and Sessions, 2018; Rosas et al., 2015; Sahoo et al., 2019).However, these studies mostly focused on the economics of biocharproduction and its supply chain and did not address the environ-mental impacts differences between large scale centralized oper-ations and mobile units.
Using life cycle assessment (LCA), to illustrate the benefits ofbiochar production and use to mitigate carbon emissions andrestore forest health, can be useful to the several stakeholders suchas forest owners, policymakers, and the public when the direct andindirect cost of forest fires are considered.
There have been many studies reporting the LCA of biocharproduction. Most are difficult to compare based on the functionalunit or based on the scope or system boundaries of the LCA.Regarding the choice of a functional unit for analysis (Hammondet al., 2011), found that carbon abatement per unit of energydelivered is not an appropriate unit for comparing different biocharsystems because energy delivered is not the primary product of abiochar system. Additionally, they concluded that while the CO2 eq.per oven dry ton (odt) of biomass feedstock was an appropriatefunctional unit for comparing different bioenergy systems. Thefunctional unit, CO2 eq. per odt of biochar product was best forcomparing different biochar systems. Their results found that astarting estimate for the climate mitigation potential of a biocharsystem was equal to one metric ton of CO2eq. per oven dry ton ofbiomass. Roberts et al. (2010) chose one metric ton of dry biomassas the functional unit for their biochar-pyrolysis system, whichcompared corn stover, yard waste, and switchgrass feedstocks usedin a bioenergy facility. The net climate change impact was calcu-lated as the sum of the net GHG reductions (biochar sequesteredcarbon and avoided emissions) and the net GHG emissions. Leeet al. (2010) examined many alternative fates for a unit ofbiomass in different energy and soil amendment uses. Based on air
Please cite this article as: Puettmann, M et al., Life cycle assessment of bioCleaner Production, https://doi.org/10.1016/j.jclepro.2019.119564
emissions and soil application impacts, they found that a biocharenergy system produced less GHG emissions than composting,combustion for energy, or conversion to cellulosic ethanol.
There is a handful of research on portable systems and most ofthem are related to producing bio-oil from biomass and bio-oilneeds upgradation to produce transportable biofuels (Badgeret al., 2010; Chen et al., 2018; Mirkouei et al., 2016; Polagye et al.,2007). Rosas et al. (2015) performed the LCA of a portable systemthat produces biochar from ripped vines wood and illustrated thesignificant reduction of emissions due to the transportation ofbiomass compared to a centralized system. Forest Service re-searchers (Bergman and Gu, 2014; Gu and Bergman, 2016) per-formed a gate-to-gate LCI on an advanced biomass pyrolysis gasifierusing wood chips to produce syngas for electricity generation andbiochar. Biochar, in this case, made a significant reduction in theglobal warming impact of the generated electricity as compared toeither coal or natural gas electricity generation. The biochar effectwas attributed to carbon sequestration value only, withoutanalyzing further effects of applying biochar in soil.
Many other biochar LCA studies have taken a similar approach,essentially looking at the biochar product as a GHG offset to theclimate impact of a biomass energy generation platform (Homagainet al., 2015; Hudiburg et al., 2011; Ramachandran et al., 2017).Various other biochar LCAs have looked beyond the direct carbonsequestration values of biochar to analyze the impact on avoidedsoil emissions of GHG, reduced fertilizer use, agronomic yield in-creases, and transportation sensitivities for applying biochar closerto where it is produced (Mu~noz et al., 2017; Pereira et al., 2016;Peters et al., 2015; Rosas et al., 2015; Wang et al., 2014).
Transportation sensitivities are often significant in both thefeedstock logistics phase and the biochar distribution and appli-cation phase. Forest residues’ quality such asmoisture, ash, size andtype of residues (i.e., main stem, tops, branches) has a significantimpact on biochar quality and productivity in biochar productionwhich had not been addressed by the previous studies (Inoue et al.,2011; Severy et al., 2016).
As part of the Waste to Wisdom (Bergman et al., 2018) study,this paper presents a cradle-to-gate life cycle assessment approachused to estimate the environmental impacts of producing biocharfrom forest residues using three portable systems [e.g., 1. BiocharSolutions, Inc. (BSI), 2. Oregon Kiln, and 3. Air-Curtain Burner)considering different production scenarios. For example, (i) biocharproduced through the BSI system either near a forest or an in-townlocation (either 2 or 4 h of transport distance for feedstocks), (ii)biochar produced through the BSI system using different quality offeedstocks (chipped pulp-quality forest residues and ground forestresidues), and (iii) biochar produced through the BSI system usingdifferent sources of power (grid connection for in-town locationsand diesel or gasifier-based generator for near-forest locations).Oregon Kiln and Air-Curtain Burner were tested only at the near-forest locations. Impacts of biochar return to the soil on NPP (NetPrimary Productivity) and the dynamics of soil carbon sequestra-tion have been excluded from this analysis. However, given thatbiochar recalcitrance (fixed carbon) is a function of biochar pro-duction temperature and feedstock quality, biochar quality hasbeen included as a focus for sensitivity analysis.
2. Methods
2.1. Goal and scope
The goal of this work was to determine energy and materialinputs and outputs associated with the production of biochar. Theoriginal scope of this study was to develop a cradle-to-gate LCA ofBSI portable biochar production system and associated upstream
char produced from forest residues using portable systems, Journal of

M. Puettmann et al. / Journal of Cleaner Production xxx (xxxx) xxx 3
processes (e.g. harvesting of biomass and feedstock preparation).Early in the analysis, the scope was expanded to include twoadditional biochar production systems, the Oregon Kiln, and theAir-Curtain Burner. The LCA covers the impacts of both the inputmaterials of fuels and electricity, and the outputs, including themarketable biochar, wastes, and emissions. Feedstock collectionand comminution were obtained from Oneil et al. (2017); biocharproduction data for the BSI unit were provided by Schatz EnergyResearch Center, Humboldt State University (2016); and fromWilson Biochar Associates for the Oregon Kiln and Air-CurtainBurner. Data for other fuels and materials were obtained frompublic databases (NREL, 2017). ISO 14040 and ISO 14044 standardswere followed to conduct the life cycle assessments (ISO, 2006a, b).The SimaPro 8.5 software was used to develop the LCI models, andproduce results and analysis.
The functional unit for biochar LCA for the three productionsystems is one metric ton (1000 kg) of marketable biochar. Forcomparison between feedstock inputs and biochar systems, thefunctional unit percent of fixed carbon in the biochar was used topresent results. A third functional unit was for comparison withslash pile burning, this unit was 1 metric ton of forest residue(oven-dry basis).
2.2. System boundaries
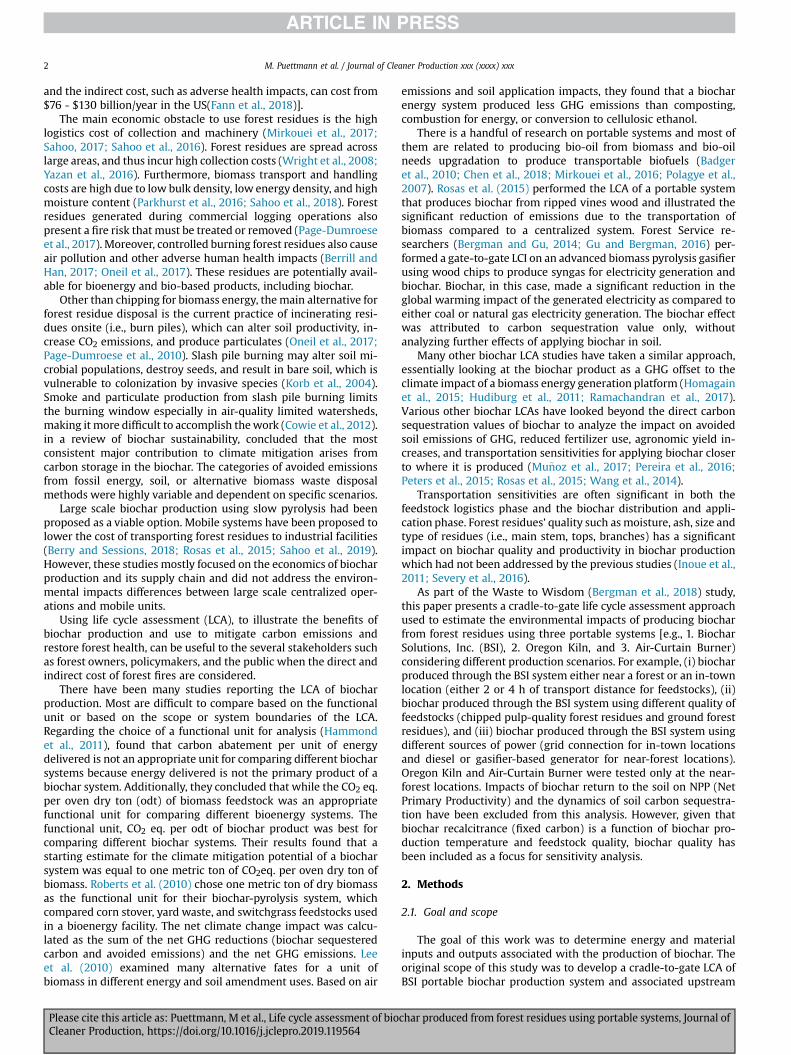
The system boundary for the LCA of biochar begins with theharvesting of biomass and ends with marketable biochar (Figs. 1and 2). The production flow can differ slightly depending on thebiochar production system used, the feedstock used, the site/loca-tions of conversion, and the fuel used for energy. Fig. 1 shows thesystem boundaries of the BSI biochar production of biochar system.Where the Oregon Kiln and Air-Curtain Burner’s system boundaryand flow diagram is shown in Fig. 2. All three system boundariesincluded forest operations that include felling, yarding, loading, andsome hauling of forest residues. Oregon Kiln and Air-Curtain Burnerare assumed in this study to be used at near-forest site locations.The Oregon Kiln requires no comminution and can use tops,branches, and smaller pulpwood if less than 1.2 m in length andsmaller diameter stems, preferably less than 15 cm. Air-Curtain
Fig. 1. System boundary for the production of biochar using the BSI system at either aremote or in town sites.
Please cite this article as: Puettmann, M et al., Life cycle assessment of bioCleaner Production, https://doi.org/10.1016/j.jclepro.2019.119564
Burners can handle larger length and stem diameter biomass anddo not require any preprocessing.
2.3. Description of biochar production systems
Biochar is produced from forest residues located at a remote sitenear the forest and at an in-town location using a maximum of 2and 4 h of travel time from the forest (Fig. 3). For the BSI unit, forestresidues are either ground in the forest transported by trucks ortransported as whole logs and chipped at the in-town sites. Theoperation of the BSI biochar production system requires powerwhich was supplied from either gasifier-based power pallet (woodchips to produce power), diesel generator or grid if available.
The Oregon Kiln and Air-Curtain Burner use uncomminutedforest residues but require reduction of length using chain saws orforest processors (Oneil et al., 2017; Wilson, 2017). Both of theseproduction systems are used at the remote near forest location.They both require a small amount of fuel (i.e., propane) for the dailystarting up the systems.
2.3.1. BSI (biochar systems incorporated) systemThe BSI machine (Biochar Solutions, Inc.) is a mobile down-draft
gasifier that uses chipped or ground feedstock, loaded into the topof the reactor (Fig. 4).
A blower draws air and exhaust gas through the reactor to a flareand thermal oxidizer, while char is removed from the bottom of thereactor with an auger, in a continuous process. It is rated to process0.23 metric ton (or tonne) per hour (tonne/hr) or dry biomass(0.227 dry tonne/hr) and produce 0.045 tonnes/hr of biochar. Theoperation begins with the biomass feedstock loaded into the hop-per (14). The feedstock is manually transferred from the hopper(14) onto the conveyor (15) which transports the feedstock into thereactor (1). The reactor consists of two concentric cylinders with a15.2 cm gap between them. The feedstock is loaded into the innercylinder maintaining a bed depth between 46 and 122 cm. Thereactor blower (5) pulls air into the reactor (1) through the dropbox(2) and forces gas through the exit to the flare (3). Feedstock loadedinto the top of the reactor is heated by partial combustion as itmoves downward through the reactor. As the oxygen levels aredepleted near the bottom of the bed, biomass is converted intobiochar by gasification. After biochar is formed, the reactor blowerpulls it through the gap between inner and outer reactor cylindersand into the dropbox (2). The biochar enters an auger that is cooledby an external water jacket and exits through an airlock (10) whichmaintains negative pressure in the system while allowing solidbiochar to exit and is collected into metal drums (11). The system isequipped with a biomass drying system, but this did not operateeffectively for this study. For more details on the production ofbiochar using the BSI unit please refer to the Biochar Testing andResults Report (Severy et al., 2016).
The BSI system requires about 20 kW of power to operate. Gridconnectivity for remote biochar production locations is rare.Therefore, a diesel generator or a biomass gasifier (Power Pallet) togenerate the required energy to produce biochar at the remotebiochar production locations. When the biochar production loca-tion is in town, comparisons for production were made betweenthe diesel generator, the biomass gasifier, and the use of gridelectricity.
2.3.2. Oregon KilnThe Oregon Kiln consists of a simple truncated pyramid con-
structed of 14-gauge mild steel container with a solid bottom and afive-foot square top base known as a flame cap kiln (1.2 m2 bottombase and a height of 0.6 m). The total capacity is 40 cubic feet(1.1 m3). It is optimized for low-cost manufacturing and uses in
char produced from forest residues using portable systems, Journal of
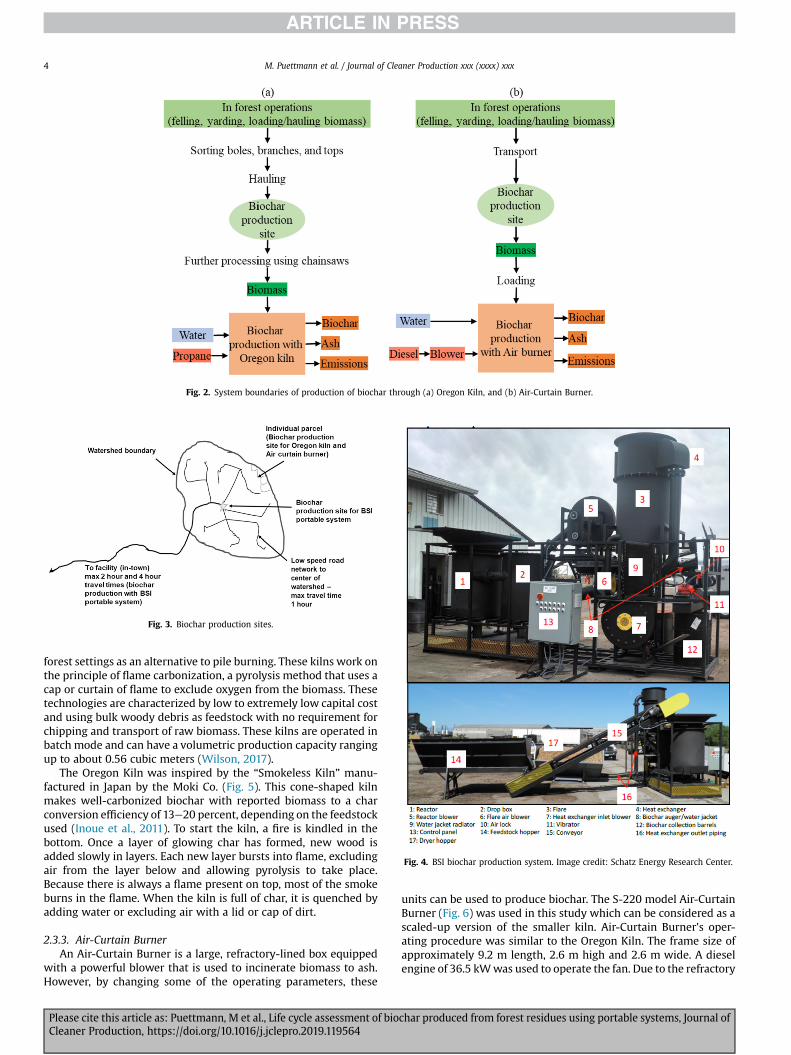
Fig. 2. System boundaries of production of biochar through (a) Oregon Kiln, and (b) Air-Curtain Burner.
Fig. 3. Biochar production sites.
Fig. 4. BSI biochar production system. Image credit: Schatz Energy Research Center.
M. Puettmann et al. / Journal of Cleaner Production xxx (xxxx) xxx4
forest settings as an alternative to pile burning. These kilns work onthe principle of flame carbonization, a pyrolysis method that uses acap or curtain of flame to exclude oxygen from the biomass. Thesetechnologies are characterized by low to extremely low capital costand using bulk woody debris as feedstock with no requirement forchipping and transport of raw biomass. These kilns are operated inbatch mode and can have a volumetric production capacity rangingup to about 0.56 cubic meters (Wilson, 2017).
The Oregon Kiln was inspired by the “Smokeless Kiln” manu-factured in Japan by the Moki Co. (Fig. 5). This cone-shaped kilnmakes well-carbonized biochar with reported biomass to a charconversion efficiency of 13e20 percent, depending on the feedstockused (Inoue et al., 2011). To start the kiln, a fire is kindled in thebottom. Once a layer of glowing char has formed, new wood isadded slowly in layers. Each new layer bursts into flame, excludingair from the layer below and allowing pyrolysis to take place.Because there is always a flame present on top, most of the smokeburns in the flame. When the kiln is full of char, it is quenched byadding water or excluding air with a lid or cap of dirt.
2.3.3. Air-Curtain BurnerAn Air-Curtain Burner is a large, refractory-lined box equipped
with a powerful blower that is used to incinerate biomass to ash.However, by changing some of the operating parameters, these
Please cite this article as: Puettmann, M et al., Life cycle assessment of bioCleaner Production, https://doi.org/10.1016/j.jclepro.2019.119564
units can be used to produce biochar. The S-220 model Air-CurtainBurner (Fig. 6) was used in this study which can be considered as ascaled-up version of the smaller kiln. Air-Curtain Burner’s oper-ating procedure was similar to the Oregon Kiln. The frame size ofapproximately 9.2 m length, 2.6 m high and 2.6 m wide. A dieselengine of 36.5 kWwas used to operate the fan. Due to the refractory
char produced from forest residues using portable systems, Journal of

Fig. 5. Oregon Kiln operating in a forest setting. Images credit: Wilson Biochar Asso-ciates (wilsonbiochar.com).
Fig. 6. Air-Curtain Burner (1. Air manifold; 2. Air curtain; 3. Firebox refractory wall; 4.Wood waste or fuel; 5. Smoke and particulates. Image from www.airburners.com).
M. Puettmann et al. / Journal of Cleaner Production xxx (xxxx) xxx 5
insulation in the Air-Curtain Burner, it operates at a higher tem-perature than the Oregon Kiln. We would expect that the biocharproduced would have a higher percentage of fixed carbon since itwas made at a higher temperature. Laboratory analysis of a biocharsample from the Air-Curtain Burner showed that it had higher fixedcarbon, as compared to the Oregon Kiln.
The Air-Curtain Burner is loaded with an excavator. To avoidequipment idle time, one excavator can service more than one Air-Curtain Burner, depending on how far the machine must travel toreach the feedstock and how much feedstock sorting is needed (inthe test run on the Siskiyou NF, the feedstock had a large amount ofdirt contamination and the excavator was used to pick up thematerial and shake the dirt out of it). Our model uses only one Air-Curtain Burner. Normally, in incineration mode, the Air-CurtainBurner uses a diesel-powered blower continuously throughout itsoperation. The Air-Curtain Burner, like the Oregon Kiln, is a batchprocess, and at the end of the batch, the unit must be unloaded andquenched. It is not possible to flood water into the unit because thesudden temperature change would crack the refractory materialused to insulate it. Instead, the box must be lifted with the exca-vator and dragged forward to allow the biochar to fall out of theopen bottom. At that point, it is quenched using water while thebiochar is spread out to cool using a skid steer loader.
2.3.4. Biomass harvesting and logistics and feedstocks preparationThis study used the forest residues generated from timberland
during commercial logging operations based on the weightedaverage volume available from five regions in the state of California(Oneil et al., 2017). Forest residue collection and processing servedas an input into the BSI, Oregon Kiln, and Air-Curtain Burner bio-char production systems. All harvesting sites considered produced
Please cite this article as: Puettmann, M et al., Life cycle assessment of bioCleaner Production, https://doi.org/10.1016/j.jclepro.2019.119564
more than 22.4 odmt (oven-dry metric ton) biomass/ha, and ofthose sites, only 50 percent of the biomass is technologicallyaccessible due to terrain, turnout limitations, and other biomassrecovery limitations. Forest residues were segregated into pulplogs, and branches and tops. Hauling operations were separatedinto two distinct operationse one for pulp quality material and onefor tops and branches. For the remote biochar production site (near-forest), haul time is limited to a maximum of 1 h from harvest sites.But for the in-town site, the hauling time is limited to a maximumof 2 and 4 h from harvesting sites to biochar production sites. Forthe 2- and 4-h haul distances to an in-town biochar production site,a truckþ trailer was used for efficient use of the travel time. At eachlocation (remote or in-town) the pulp logs were chipped using amedium chipper or a micro chipper, screened, and loaded into theBSI unit, whereas tops and branches were ground, screened, andloaded into the BSI unit.
According to the Schatz Energy Research Center report (Severyet al., 2016), the biochar machine successfully processed all feed-stock types (Table 1) but operation became more difficult and thequality of the biochar decreased when the ash content of thefeedstock was greater than 15 percent or the moisture content ofthe feedstock was above 25 percent on a wet basis. Biochar qualityis based on the percent fixed carbon. Both ash and moisture werefound to decrease the percent or yield of fixed carbon in the biochar(Severy et al., 2016, 2018). Following these guidelines, the LCImodel limited the analysis to those feedstocks that contained lessthan 15 percent ash content and lower than 25 percent moisturecontent (34%, dry basis) (Table 1). The average moisture content forthe medium chip was 31 percent, higher than the 25 percent rec-ommended in the BSI report (Severy et al., 2016). The medium chipfeedstock was included in the BSI LCI model by excluding the testwith the moisture content of 37 percent and only using one runwith the chip moisture content of 25 percent. In addition, thefeedstock dryer system was not functioning properly resulting inthe feedstocks needing to be air-dried. It is assumed that withsufficient time, for example allowing the feedstocks to air dry forone season, moisture contents lower than 25 percent wet basis(34% dry basis) could be achieved. In the end, five types of forestresidues (species/contaminant/comminution method) were usedin the LCA of biochar for the BSI machine (Table 1). Depending onthe forest residue used, the BSI system required different quantitiesof input material.
Logistics operations with unit operations to produce feedstocksfor Oregon Kiln, and Air-Curtain Burner systems are shown in Fig. 2.For Oregon Kiln, forest residues are cut to a maximum 1.2-m lengthusing chain saws and piled to dry. Care must be taken not tocompact the feedstock or push dirt into piles since they must betaken apart by hand for handloading into kilns. An excavator with agrapple loader is good for this purpose since it can lift and dropfeedstock without having to push it over the ground where it cancollect dirt.
2.4. Life cycle inventory
Data for the LCA of biochar was collected from a variety ofsources and contained both primary and secondary data (Table 2).Operations inputs for biochar production including energy con-sumption, resource inputs, and biochar outputs were collectedfrom actual operations for the BSI, Oregon Kiln, and Air-CurtainBurner units. Data for the LCA of biochar was collected from a va-riety of sources and contained both primary and secondary data(Table 2). It begins with the collection of the biomass using tradi-tional harvesting mechanisms, transporting the biomass to alanding, processing the biomass, transporting to a biochar pro-duction site, further processing of biomass if needed, and ending
char produced from forest residues using portable systems, Journal of
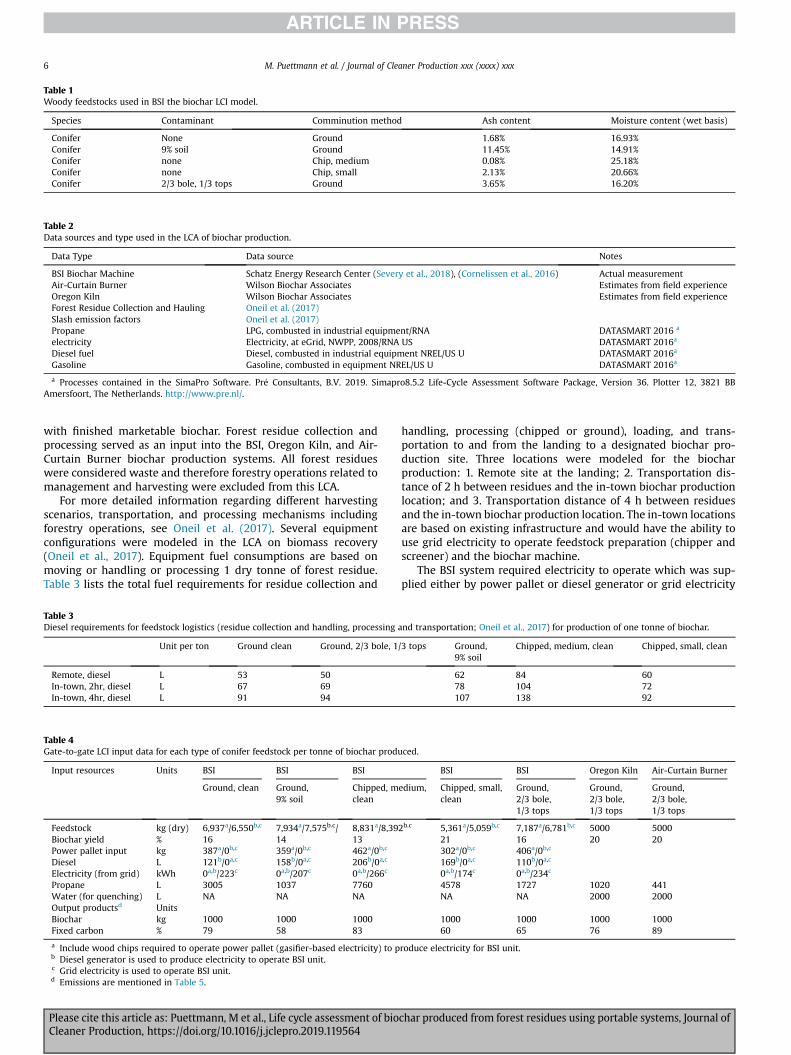
Table 1Woody feedstocks used in BSI the biochar LCI model.
Species Contaminant Comminution method Ash content Moisture content (wet basis)
Conifer None Ground 1.68% 16.93%Conifer 9% soil Ground 11.45% 14.91%Conifer none Chip, medium 0.08% 25.18%Conifer none Chip, small 2.13% 20.66%Conifer 2/3 bole, 1/3 tops Ground 3.65% 16.20%
Table 2Data sources and type used in the LCA of biochar production.
Data Type Data source Notes
BSI Biochar Machine Schatz Energy Research Center (Severy et al., 2018), (Cornelissen et al., 2016) Actual measurementAir-Curtain Burner Wilson Biochar Associates Estimates from field experienceOregon Kiln Wilson Biochar Associates Estimates from field experienceForest Residue Collection and Hauling Oneil et al. (2017)Slash emission factors Oneil et al. (2017)Propane LPG, combusted in industrial equipment/RNA DATASMART 2016 a
electricity Electricity, at eGrid, NWPP, 2008/RNA US DATASMART 2016a
Diesel fuel Diesel, combusted in industrial equipment NREL/US U DATASMART 2016a
Gasoline Gasoline, combusted in equipment NREL/US U DATASMART 2016a
a Processes contained in the SimaPro Software. Pr�e Consultants, B.V. 2019. Simapro8.5.2 Life-Cycle Assessment Software Package, Version 36. Plotter 12, 3821 BBAmersfoort, The Netherlands. http://www.pre.nl/.
M. Puettmann et al. / Journal of Cleaner Production xxx (xxxx) xxx6
with finished marketable biochar. Forest residue collection andprocessing served as an input into the BSI, Oregon Kiln, and Air-Curtain Burner biochar production systems. All forest residueswere considered waste and therefore forestry operations related tomanagement and harvesting were excluded from this LCA.
For more detailed information regarding different harvestingscenarios, transportation, and processing mechanisms includingforestry operations, see Oneil et al. (2017). Several equipmentconfigurations were modeled in the LCA on biomass recovery(Oneil et al., 2017). Equipment fuel consumptions are based onmoving or handling or processing 1 dry tonne of forest residue.Table 3 lists the total fuel requirements for residue collection and
Table 3Diesel requirements for feedstock logistics (residue collection and handling, processing
Unit per ton Ground clean Ground, 2/3 bole, 1
Remote, diesel L 53 50In-town, 2hr, diesel L 67 69In-town, 4hr, diesel L 91 94
Table 4Gate-to-gate LCI input data for each type of conifer feedstock per tonne of biochar produ
Input resources Units BSI BSI BSI
Ground, clean Ground,9% soil
Chipped, mclean
Feedstock kg (dry) 6,937a/6,550b,c 7,934a/7,575b.c/ 8,831a/8,39Biochar yield % 16 14 13Power pallet input kg 387a/0b,c 359a/0b,c 462a/0b,c
Diesel L 121b/0a,c 158b/0a,c 206b/0a,c
Electricity (from grid) kWh 0a,b/223c 0a,b/207c 0a,b/266c
Propane L 3005 1037 7760Water (for quenching) L NA NA NAOutput productsd UnitsBiochar kg 1000 1000 1000Fixed carbon % 79 58 83
a Include wood chips required to operate power pallet (gasifier-based electricity) to pb Diesel generator is used to produce electricity to operate BSI unit.c Grid electricity is used to operate BSI unit.d Emissions are mentioned in Table 5.
Please cite this article as: Puettmann, M et al., Life cycle assessment of bioCleaner Production, https://doi.org/10.1016/j.jclepro.2019.119564
handling, processing (chipped or ground), loading, and trans-portation to and from the landing to a designated biochar pro-duction site. Three locations were modeled for the biocharproduction: 1. Remote site at the landing; 2. Transportation dis-tance of 2 h between residues and the in-town biochar productionlocation; and 3. Transportation distance of 4 h between residuesand the in-town biochar production location. The in-town locationsare based on existing infrastructure and would have the ability touse grid electricity to operate feedstock preparation (chipper andscreener) and the biochar machine.
The BSI system required electricity to operate which was sup-plied either by power pallet or diesel generator or grid electricity
and transportation; Oneil et al., 2017) for production of one tonne of biochar.
/3 tops Ground,9% soil
Chipped, medium, clean Chipped, small, clean
62 84 6078 104 72107 138 92
ced.
BSI BSI Oregon Kiln Air-Curtain Burner
edium, Chipped, small,clean
Ground,2/3 bole,1/3 tops
Ground,2/3 bole,1/3 tops
Ground,2/3 bole,1/3 tops
2b.c 5,361a/5,059b,c 7,187a/6,781b,c 5000 500021 16 20 20302a/0b,c 406a/0b,c
169b/0a,c 110b/0a,c
0a,b/174c 0a,b/234c
4578 1727 1020 441NA NA 2000 2000
1000 1000 1000 100060 65 76 89
roduce electricity for BSI unit.
char produced from forest residues using portable systems, Journal of

Table
5Em
ission
factorsusedin
theLC
A.F
actors
arereportedin
kgper
kgof
forest
residue(ove
n-dry
basis)
used.
Com
minution
method
sSlashPile
Burn
Air-CurtainBurn
erOrego
nKiln
Power
Palle
tBSI
NA
NA
NA
Chipped
Med
ium
Ground
Chipped
small
Chipped
med
ium
Typeof
forest
residue
Topsþ
pulpwoo
dTo
psþ
pulpwoo
dTo
psþ
pulpwoo
dPu
lpwoo
d,clean
BSI
Ave
Pulpwoo
d,9
%co
ntaminan
t1/3rdtopsþ2
/3rd
pulpwoo
dPu
lpwoo
d,c
lean
Pulpwoo
d,clean
Pulpwoo
d,clean
Ammon
ia4.80
E-04
ee
ee
ee
ee
e
Carbo
ndioxide,
biog
enic
1.69
Eþ00
7.80
E-01
7.80
E-01
1.75
Eþ00
2.19
Eþ00
2.61
Eþ00
1.90
Eþ00
1.60
Eþ00
3.25
Eþ00
1.57
Eþ00
Carbo
nmon
oxide,
biog
enic
6.53
E-02
2.60
E-03
2.60
E-03
2.56
E-02
6.98
E-04
7.24
E-04
5.25
E-04
5.84
E-04
9.64
E-04
6.92
E-04
Form
aldeh
yde
1.04
E-03
ee
ee
ee
ee
e
Hyd
rocarbon
s,unsp
ecified
4.08
E-03
ee
ee
ee
ee
e
Methan
e,biog
enic
4.54
E-03
2.60
E-03
2.60
E-03
1.52
E-04
1.58
E-04
1.15
E-04
1.27
E-04
2.10
E-04
1.51
E-04
Methan
ol6.50
E-04
ee
ee
ee
ee
e
Nitroge
nmon
oxides
0.00
Eþ00
1.40
E-04
1.40
E-04
6.45
E-04
ee
ee
ee
Nitroge
nox
ides
2.50
E-03
1.44
E-04
1.44
E-04
1.56
E-05
1.96
E-03
2.04
E-03
1.48
E-03
1.64
E-03
2.71
E-03
1.95
E-03
NMVOC,n
on-m
ethan
evo
latile
orga
nic
compou
nds
5.55
E-03
ee
ee
ee
ee
e
Particulates,<10
um
4.40
E-03
1.28
E-03
1.28
E-03
e1.38
E-03
1.43
E-03
1.04
E-03
1.15
E-03
1.90
E-03
1.37
E-03
Particulates,<2.5um
3.90
E-03
ee
e1.22
E-05
1.27
E-05
9.19
E-06
1.02
E-05
1.69
E-05
1.21
E-05
Particulates
ee
e1.15
E-03
1.19
E-03
8.66
E-04
9.63
E-04
1.59
E-03
1.14
E-03
Prop
ane
ee
2.62
E-04
4.19
E-04
4.34
E-04
3.15
E-04
3.50
E-04
5.78
E-04
4.15
E-04
Soot
2.80
E-04
ee
Sulfurdioxide
8.30
E-04
ee
1.07
E-04
3.49
E-05
3.62
E-05
2.62
E-05
2.92
E-05
4.82
E-05
3.46
E-05
TOC,T
otal
Organ
icCarbo
n2.11
E-03
ee
ee
ee
ee
e
M. Puettmann et al. / Journal of Cleaner Production xxx (xxxx) xxx 7
(Table 4). Small amounts of propanewere needed for start-up for allbiochar production systems (Table 4). Biochar quality (fixed carbon)produced can vary according to feedstock species, moisture and ashcontent (Severy et al., 2016). However, the degree of carbonizationand percentage of fixed carbon is usually high in Oregon Kiln andAir-Curtain Burner. This occurs because of the high temperaturebelow the flame where pyrolysis takes place e about 680e750 �C(Cornelissen et al., 2016) and the long residence time of feedstock inthe kiln due to the nature of the production process.
The emissions generated from the slash pile burning and bio-char production through the BSI system, Oregon Kiln, and Air-Curtain Burner are reported in Table 5. These emissions valueswere used in the LCI for each biochar production system and areincluded in the life cycle impact assessment results. Slash pile andburn is included for comparison of different scenarios for forestresidue disposal.
2.5. Life cycle impact assessment
The life cycle impact assessment (LCIA) phase establishes linksbetween the life cycle inventory results and potential environ-mental impacts. The LCIA calculates impact indicators, such asglobal warming potential and smog. These impact indicators pro-vide general, but quantifiable, indications of potential environ-mental impacts. The target impact indicator, the impact category,and means of characterizing the impacts are summarized below.Environmental impacts are determined using the TRACI method(Bare, 2011). Each impact indicator is a measure of an aspect of apotential impact. This LCIA does not make value judgments aboutthe impact indicators, meaning comparison indicator values are notvalid. Additionally, each impact indicator value is stated in unitsthat are not comparable to others. For the same reasons, indicatorsshould not be combined or added. Additionally, the LCIA results arerelative expressions and do not predict impacts on category end-points, the exceeding of thresholds, safety margins or risks.
For the purpose of this paper, only the global warming potential(GWP) impact category is presented. Unless otherwise noted, car-bon neutrality was assumed; biogenic carbon emissions releasedduring biochar production are assumed to be equal to the CO2absorbed during tree growth. Net carbon emissions are reported bytaking the carbon released during production (fossil-based) and thecarbon stored in the biochar.
In the case of comparisons with slash and burn, carbonneutrality was not assumed. In this case, all carbon emissionreleased during production is considered a positive, and carbonuptake during tree growth and carbon content of biochar arenegative to the system.
3. Results
3.1. Biochar produced with the BSI system at remote sites
Based on the source of power (either diesel generator or powerpallet), Fig. 7 shows the GWP of biochar production with the BSIunit at the near-forest site (remote) using different feedstocks asmentioned in Table 1.
The utilization of the power pallet provides a significantimprovement in net GWP over the diesel generator over all residuecomminution methods and contaminate levels, despite the extrafeedstock processing necessary for generating electricity from thepower pallet. Medium chipped pulpwood had a higher GWP pro-duction emission compared with ground residues. Biochar pro-duced from medium chipped pulpwood stores the most fixedcarbon and subsequently has a net carbon emission of �2832 kgCO2 eq./tonne of biochar � storing nearly 14 times what is emitted
Please cite this article as: Puettmann, M et al., Life cycle assessment of biochar produced from forest residues using portable systems, Journal ofCleaner Production, https://doi.org/10.1016/j.jclepro.2019.119564

-3,200
-2,800
-2,400
-2,000
-1,600
-1,200
-800
-400
0
400
800
1,200
Diesel power Power Pallet Diesel power Power pallet
Net
GW
P (k
g C
O2
eq. /
1,0
00 k
g of
bio
char
)N
e t G
WP
(kg
CO
2eq
. / 1
,000
kg
of b
ioch
ar)
kg CO eq. emission, production kg CO eq. stored in biocharkg CO eq emission, net GWP
Ground - 1/3rd tops and 2/3rd pulpwood Medium chipped-pulpwood
Fig. 7. GWP of biochar production using the BSI system at a remote biochar production site.
M. Puettmann et al. / Journal of Cleaner Production xxx (xxxx) xxx8
to produce biochar when using the power pallet.
3.2. Biochar produced with BSI system at the in-town sites
Transporting the residues to an in-town conversion site resultedin higher GWP values over the remote conversion site. For pulp-wood transported and then chipped in-town resulted in 8e92%increase in GWP and for transporting ground (1/3rd tops and 2/3rdpulpwood) feedstock we saw a 9e81% increase in GWP (Table 6).
The in-town production of biochar did provide the opportunityto use grid electricity. Using grid electricity to operate the BSImachine produced a 53 percent decrease in GWP from the dieselgenerator used at a remote biochar production site but had an 88percent increase over a remote biochar production site with PowerPallet. Again, GWP increased for the production of biochar whenthe material was transported 4 h from the landing compared to a 2-h transport. These were most pronounced when the Power Palletwas used, 43 and 40 percent for medium chips, and ground 1/3tops:2/3 pulpwood, respectively. When the diesel-poweredgenerator was used for biochar production, the difference be-tween a 2- and 4-h haul distance, produced differences of 13 and 15percent for medium chips and ground 1/3 tops:2/3 pulpwood,respectively. It appears that the availability of using grid electricityhad a little benefit over the Power Pallet when a town biocharproduction site was used. In-town grid electricity used for biocharproduction resulted in a 46 percent increase in GWP over the PowerPallet for ground 1/3 tops:2/3 pulpwood and 40 percent with
Table 6Production emissions (kg of CO2 eq./1000 kg of biochar) in biochar production atremote and in-town locations (residue haul distances of 2 and 4 h from forest tobiochar production sites).
Pulpwood-ChippedMedium
(1/3rd Tops and 2/3rdPulpwood)- Ground
Remote 2-h 4-h Remote 2-h 4-h
Electricity NA 397 513 NA 336 422Diesel 852 921 1037 518 566 652Power Pallet 211 283 406 178 230 322
Please cite this article as: Puettmann, M et al., Life cycle assessment of bioCleaner Production, https://doi.org/10.1016/j.jclepro.2019.119564
medium chips at a 2-h haul distance. Grid electricity did have asignificant improvement in carbon emissions over the use of adiesel generator for both a 2- or 4-h haul distance.
Fig. 8 shows the GWP of biochar produced with BSI unit fromdifferent types of forest residues at the 2-h haul distance in-townlocations. The net GWPs of biochar produced from medium chip-ped pulpwood are higher than ground feedstock independent ofpower sources. Biochar productionwith the power pallet to operatethe BSI system has the lowest GWP value and hence the highestnegative net-GWP. With the increase in transportation distance ofthe feedstocks, the net reduction in GWP of biochar was reduced.
3.3. Biochar produced with BSI, Oregon Kiln, and Air-CurtainBurner at remote sites
Fig. 9 shows the GWP of three types of biochar productionsystems with respect to 1000 kg of fixed carbon in the biochar. TheGWP emissions in Fig. 9 do not include emissions from biogeniccarbon dioxide. In the case of BSI systems, about 80% of total GWPemissions are from feedstocks preparation and forest residuescollection.While approximately 40% of total GWP emissions are theresult of feedstocks preparation in both Oregon Kiln and Air-CurtainBurner systems. Both the Oregon Kiln and the Air-Curtain Burnerhave the lowest carbon emissions as these system does not requiremuch feedstock preparation such as grinding or chipping and en-ergy to run the systems. On the other hand, for these systems, theimpact allocated to biochar production emissions is proportionallyhigher due to lower impact for feedstock preparation. Overall, GWPemissions decrease as the percent of fixed carbon in the biocharincreases.
3.4. Biochar production vs. slash burn
Comparisons were made between the remote production ofbiochar using two residue types to a typical pile and burn operationof forest residues. In this case carbon neutrality was not assumed.On the other hand, we did include the carbon dioxide that wouldhave been absorbed during tree growth for the residues (a part ofthis carbon dioxide absorbed was stored in the biochar).
char produced from forest residues using portable systems, Journal of

-3,200
-2,800
-2,400
-2,000
-1,600
-1,200
-800
-400
0
400
800
1,200
Grid power Diesel power Power pallet Grid power Diesel power Power pallet
Net
GW
P(k
gC
O2
eq./
100
0 kg
of b
ioch
ar)
Net
GW
P(k
gC
O2
eq./
100
0 kg
of b
ioch
ar)
kg CO eq. emission, production kg CO eq. stored in biocharkg CO eq emission, net GWP
Ground - 1/3rd tops and 2/3rd pulpwood Medium chipped-pulpwood
Fig. 8. In-town production of biochar using the BSI system (feedstocks were transported a maximum of 2 h from the landing).
0
50
100
150
200
250
300
350
58% 60% 65% 76% 79% 83% 89%
GW
P(k
gC
O2
eq./1
000
kgof
fixe
dca
rbon
)
% fixed carbon in biocharFeedstock preparation Biochar production Electricity-Power pallet
Pulp
woo
d,9%
Con
tam
inat
in,g
roun
d
Pulp
woo
d,ch
ippe
dsm
all,
clea
n
(1/3
rdt o
p +
2/3rd
pul p
woo
d)gr
ound
P uul
pwoo
dcl
ean,
grou
nd
Pulp
woo
d,ch
ippe
dm
ediu
m, c
lean
Air-Curtain Burner
Oregon kiln
BSI system
Fig. 9. Global warming potential, kg of CO2 eq., for a metric ton of fixed carbon for various forest residues types and biochar production systems.
M. Puettmann et al. / Journal of Cleaner Production xxx (xxxx) xxx 9
To further understand the environmental impact of producingbiochar at a remote biochar production site, comparisons weremade to the “business as usual” (BAU) practice of “pile and burn” ofthe residues after commercial harvest. Included in these compari-sons, only the Power Pallet was used to supply electricity to operatethe BSI machine in biochar production. Additional comparisonswere made with Oregon Kiln and Air-Curtain Burner. Net GWP CO2eq. emissions for 1 metric ton of feedstock are 0.08,�0.25, 0.10, and0.10 for biochar produced with ground tops and pulpwood, biocharproduced with medium chips, burning tops and pulpwood, andburning pulpwood, respectively (Fig. 10). The pile and burn options
Please cite this article as: Puettmann, M et al., Life cycle assessment of bioCleaner Production, https://doi.org/10.1016/j.jclepro.2019.119564
are carbon positive. The use of an Oregon Kiln and Air-CurtainBurner produced less carbon emission and stored more carbon inthe biochar they produced than the BSI machine scenarios. Exceptfor BSI systemwith ground-feedstocks, biochar production systemshad a net negative carbon emission, while the slash and burnscenarios were having net positive GWP (0.1 metric ton of CO2 eq.).When a diesel generator is used, there is a 66 percent decrease innet carbon storage for the tops/pulpwood biochar system and 14percent decrease in the biochar system that used chipped pulp-wood (Table 6).
char produced from forest residues using portable systems, Journal of
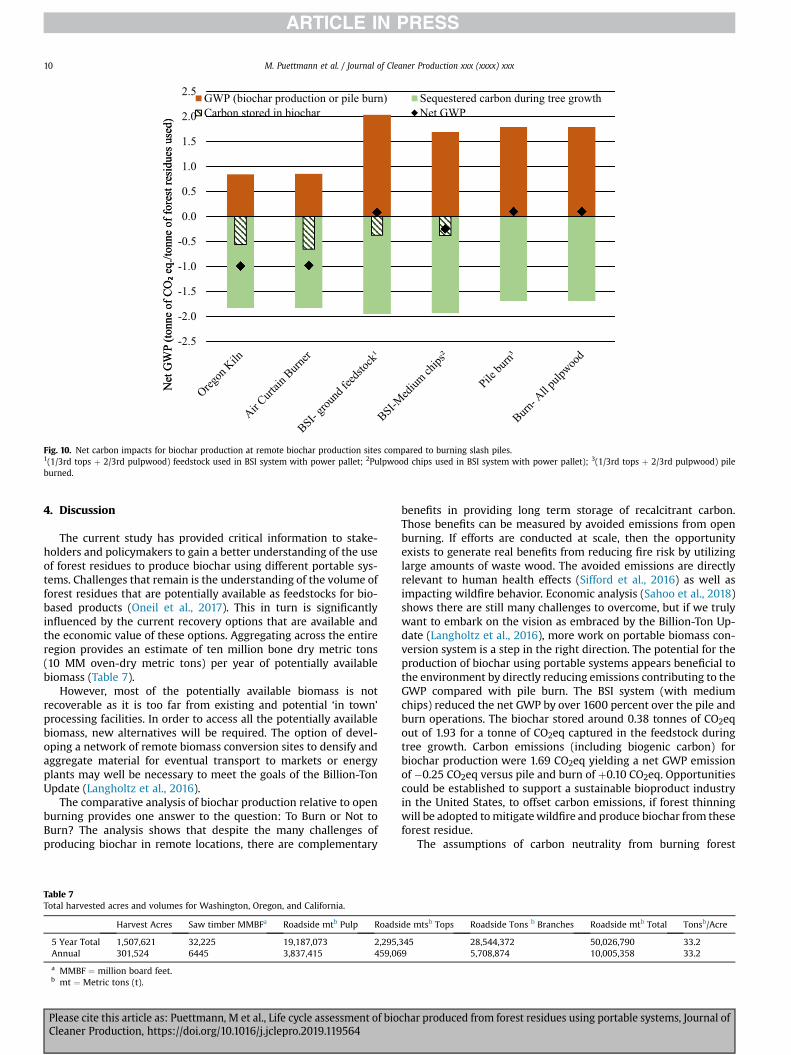
Fig. 10. Net carbon impacts for biochar production at remote biochar production sites compared to burning slash piles.1(1/3rd tops þ 2/3rd pulpwood) feedstock used in BSI system with power pallet; 2Pulpwood chips used in BSI system with power pallet); 3(1/3rd tops þ 2/3rd pulpwood) pileburned.
M. Puettmann et al. / Journal of Cleaner Production xxx (xxxx) xxx10
4. Discussion
The current study has provided critical information to stake-holders and policymakers to gain a better understanding of the useof forest residues to produce biochar using different portable sys-tems. Challenges that remain is the understanding of the volume offorest residues that are potentially available as feedstocks for bio-based products (Oneil et al., 2017). This in turn is significantlyinfluenced by the current recovery options that are available andthe economic value of these options. Aggregating across the entireregion provides an estimate of ten million bone dry metric tons(10 MM oven-dry metric tons) per year of potentially availablebiomass (Table 7).
However, most of the potentially available biomass is notrecoverable as it is too far from existing and potential ‘in town’processing facilities. In order to access all the potentially availablebiomass, new alternatives will be required. The option of devel-oping a network of remote biomass conversion sites to densify andaggregate material for eventual transport to markets or energyplants may well be necessary to meet the goals of the Billion-TonUpdate (Langholtz et al., 2016).
The comparative analysis of biochar production relative to openburning provides one answer to the question: To Burn or Not toBurn? The analysis shows that despite the many challenges ofproducing biochar in remote locations, there are complementary
Table 7Total harvested acres and volumes for Washington, Oregon, and California.
Harvest Acres Saw timber MMBFa Roadside mtb Pulp Roads
5 Year Total 1,507,621 32,225 19,187,073 2,295,Annual 301,524 6445 3,837,415 459,06
a MMBF ¼ million board feet.b mt ¼ Metric tons (t).
Please cite this article as: Puettmann, M et al., Life cycle assessment of bioCleaner Production, https://doi.org/10.1016/j.jclepro.2019.119564
benefits in providing long term storage of recalcitrant carbon.Those benefits can be measured by avoided emissions from openburning. If efforts are conducted at scale, then the opportunityexists to generate real benefits from reducing fire risk by utilizinglarge amounts of waste wood. The avoided emissions are directlyrelevant to human health effects (Sifford et al., 2016) as well asimpacting wildfire behavior. Economic analysis (Sahoo et al., 2018)shows there are still many challenges to overcome, but if we trulywant to embark on the vision as embraced by the Billion-Ton Up-date (Langholtz et al., 2016), more work on portable biomass con-version system is a step in the right direction. The potential for theproduction of biochar using portable systems appears beneficial tothe environment by directly reducing emissions contributing to theGWP compared with pile burn. The BSI system (with mediumchips) reduced the net GWP by over 1600 percent over the pile andburn operations. The biochar stored around 0.38 tonnes of CO2eqout of 1.93 for a tonne of CO2eq captured in the feedstock duringtree growth. Carbon emissions (including biogenic carbon) forbiochar production were 1.69 CO2eq yielding a net GWP emissionof �0.25 CO2eq versus pile and burn of þ0.10 CO2eq. Opportunitiescould be established to support a sustainable bioproduct industryin the United States, to offset carbon emissions, if forest thinningwill be adopted tomitigatewildfire and produce biochar from theseforest residue.
The assumptions of carbon neutrality from burning forest
ide mtsb Tops Roadside Tons b Branches Roadside mtb Total Tonsb/Acre
345 28,544,372 50,026,790 33.29 5,708,874 10,005,358 33.2
char produced from forest residues using portable systems, Journal of
M. Puettmann et al. / Journal of Cleaner Production xxx (xxxx) xxx 11
biomass had been debated especially when the forest is harvestedfor bioenergy/fuel production (Zanchi et al., 2012) and the con-flicting results were due to methodological assumptions (Bentsen,2017). The debate is mostly for harvesting forest (especially un-sustainable harvesting of the forest leads to deforestation andenvironmentally sensitive forest region, etc.) for the production ofbioenergy and fuel. Forest residues left in the forest decomposeslowly and all carbon released to the atmosphere along with otherpotent GHG emissions such as methane and nitrous oxide based onclimate and residues management practices. Burning forest resi-dues onsite/offsite or making bioenergy/fuel suddenly release allcarbon along with other potent GHG emissions. In biochar makingprocess (i.e., pyrolysis), a part of the carbon in the biomass developsa calcitrant character which remains inactive to weathering fordecades or hundreds of years e carbon sequestration. Moreover,biochar has many environmental benefits including increased soilproductivity, soil water holding capacity, nutrient holding capacity,etc. However, the high logistics cost of biomass is one of the majorhurdles for the utilization of forest residues and portable systems tomake biochar can be the most efficient option for the economicalutilization of forest residues.
5. Limitations, sensitivity, and uncertainty
This LCA was created using collected data for biochar produc-tion. Some assumptions were made for the various biochar pro-duction systems. Details of these assumptions can be found in themain report (Puettmann et al., 2017).
This LCA does not report all the environmental impacts due tothe manufacturing of the product, but rather reports the environ-mental impacts for those categories with established LCA-basedmethods to track and report. Unreported environmental impactsinclude (but are not limited to) factors attributable to humanhealth, land-use change, and habitat destruction. In order to assessthe local impacts of product manufacturing, additional analysis isrequired.
Some degree of uncertainty is present in the results due to thevariation amongst different data providers. Haul distance of resi-dues to in-town locations proved to show that an increase of 2 h indistance resulted in a 29, 13, and 43 percent increase in GWP forelectricity, diesel, and powerplant energy use. When hauling resi-dues 2 h versus processing at a remote location GWPwas increasedby 8 and 34 percent for diesel and power pallet use, respectively.
6. Conclusions
In this study a cradle-to-gate life cycle assessment approachused to estimate the environmental impacts of producing biocharfrom forest residues using three portable systems (BSI, Oregon Kilnand Air-Curtain Burner) considering different productionsites � processing locations either near a forest or an in-townlocation (either 2 or 4 h of transport distance for feedstocks)]�,quality of feedstocks (chipped pulp-quality forest residues andground forest residues), and different sources of power (gridconnection for in-town locations and diesel or gasifier-basedgenerator for near-forest locations).
Overall, the production of biochar from forest residues reducedGHG emissions (�0.3 to �1.83 tonnes of CO2eq./dry tonne of forestresidues) compared to pile burn. Among all three portable biocharproduction systems, both Air-Curtain Burner and Oregon Kiln havehigher potential to mitigate GHG emissions compared with the BSIsystem that used comminuted biomass for the operations anddedicated feedstocks logistics. The Oregon Kiln system offers aviable alternative for sites where feedstocks are widely scattered,and greater mobility is required to bring biochar conversion
Please cite this article as: Puettmann, M et al., Life cycle assessment of bioCleaner Production, https://doi.org/10.1016/j.jclepro.2019.119564
platforms closer to feedstocks. The Oregon Kiln and related systemsmay find their greatest utility with smaller forestry operations suchas those undertaken by small woodland owners clearing for fuelreduction or restoration projects. The GHG reduction in makingbiochar at the near-forest location is higher than in-town sites dueto requirement feedstock transportation from forest to in-townsites. However, there could be an advantage in locating the oper-ation in town where grid power is available. For the BSI system,using a portable biomass gasifier for power generation loweredcarbon emissions over the use of a diesel generator at the remoteand in-town sites. Grid electricity provided no carbon benefits overthe biomass gasifier but did lower carbon emissions over the dieselgenerator. If the biomass gasifier is used to provide electricity forthe unit then there is little advantage in moving the operation totown. Feedstock variability has a large impact on both biocharquality and biochar production efficiency. Moisture, contaminationsuch as dirt, and ash content all reduce both quality and efficiencyof the biochar. Using these biochar systems for “disposal” of forestresidues reduces fuel stocks in forests. It is important to note thateach of these biochar production systems also produces a fire risk.Extreme care must be taken to operate these portable systemsduring safe burning windows, as well as where best to place them.The in-town, options could possibly offer less risk.
In summary, the potential for the production of biochar usingportable systems appears beneficial to the environment byreducing GHG emissions compared with pile burn. The currentstudy has provided critical information to all stakeholders andpolicymakers for a better understanding of the use of forest resi-dues to produce biochar using different portable systems. Oppor-tunities exist to establish a sustainable bioproduct industry in theUnited States, if forest thinning will be adopted to mitigate wildfireand produce biochar from forest residues.
Authors contribution
Maureen Puettmann: Conceived and designed the analysis,Collected the data, Contributed data or analysis tools, Performedthe analysis, Wrote the paper. Kamalakanta Sahoo: Conceived anddesigned the analysis, Contributed data or analysis tools, Performedthe analysis, Wrote the paper. Kelpie Wilson: Collected the data,Contributed data or analysis tools, Wrote the paper. Elaine Oneil:Conceived and designed the analysis, Performed the analysis,Wrote the paper.
Acknowledgment
This material is based upon work supported by a grant from theU.S. Department of Energy under the Biomass Research andDevelopment Initiative program: Award Number DE-EE0006297.
References
Wilson, K., 2017. Converting Shelterbelt Biomass to Biochar. https://greenyourhead.typepad.com/files/wba-converting-shelterbelt-to-biochar.pdf. (Accessed 25March 2019).
Badger, P., Badger, S., Puettmann, M., Steele, P., Cooper, J., 2010. Techno-economicanalysis: preliminary assessment of pyrolysis oil production costs and materialenergy balance associated with a transportable fast pyrolysis system. Bio-Resources 6 (1).
Bare, J., 2011. TRACI 2.0: the tool for the reduction and assessment of chemical andother environmental impacts 2.0. Clean Technol. Environ. Policy 13 (5),687e696.
Bentsen, N.S., 2017. Carbon debt and payback time e lost in the forest? Renew.Sustain. Energy Rev. 73, 1211e1217.
Bergman, R., Gu, H., 2014. Life-cycle inventory analysis of bio-products from amodular advanced biomass pyrolysis system. In: Proceedings, Society of WoodScience and Technology 57th International Convention. Citeseer, Zvolen,Slovakia, pp. 405e415.
Bergman, R., Berry, M., Bilek, E.M.T., Bower, T., Eastin, I., Ganguly, I., Han, H.-S.,
char produced from forest residues using portable systems, Journal of

M. Puettmann et al. / Journal of Cleaner Production xxx (xxxx) xxx12
Hirth, K., Jacobson, A., Karp, S., Oneil, E., Page-Dumroese, D.S., Pierobon, F.,Puettmann, M., Rawlings, C., Rosenbaum, S.A., Sahoo, K., Sasatani, D., Sessions, J.,Sifford, C., Waddell, T., 2018. Waste to Wisdom: utilizing forest residues for theproduction of bioenergy and biobased products. In: Final Report: BiomassResearch and Development Initiative Program Award Number DE-EE0006297.U.S. Department of Energy, Washington, DC, p. 65.
Berrill, J.-P., Han, H.-S., 2017. Carbon, harvest yields, and residues from restoration ina mixed forest on California’s coast range. For. Sci. 63 (1), 128e135.
Berry, M., Sessions, J., 2018. The economics of biomass logistics and conversionfacility mobility: an Oregon case study. Appl. Eng. Agric. 34 (1), 57e72.
Chen, X., Zhang, H., Xiao, R., 2018. Mobile autothermal pyrolysis system for localbiomass conversion: process simulation and techno-economic analysis. EnergyFuel. 32 (4), 4178e4188.
Cook, P.S., Becker, D.R., 2017. State Funding for Wildfire Suppression in the WesternUS. College of Natural Science, University of Idaho, Moscow, Idaho, UnitedStates.
Cornelissen, G., Pandit, N.R., Taylor, P., Pandit, B.H., Sparrevik, M., Schmidt, H.P.,2016. Emissions and char quality of flame-curtain “kon tiki” kilns for farmer-scale charcoal/biochar production. PLoS One 11 (5) e0154617.
Cowie, A.L., Downie, A.E., George, B.H., Singh, B.-P., Van Zwieten, L., O’Connell, D.,2012. Is sustainability certification for biochar the answer to environmentalrisks? Pesqui. Agropecu. Bras. 47, 637e648.
Dale, L., 2009. The True Cost of Wildfire in the Western US. Western ForestryLeadership Coalition, Lakewood, Colorado, United States.
Fann, N., Alman, B., Broome, R.A., Morgan, G.G., Johnston, F.H., Pouliot, G.,Rappold, A.G., 2018. The health impacts and economic value of wildland fireepisodes in the U.S.: 2008e2012. Sci. Total Environ. 610e611, 802e809.
Gu, H., Bergman, R., 2016. Life-cycle assessment of a distributed-scale thermo-chemical bioenergy conversion system. Wood Fiber Sci. 48 (2), 129e141.
Hammond, J., Shackley, S., Sohi, S., Brownsort, P., 2011. Prospective life cycle carbonabatement for pyrolysis biochar systems in the UK. Energy Policy 39 (5),2646e2655.
Homagain, K., Shahi, C., Luckai, N., Sharma, M., 2015. Life cycle environmentalimpact assessment of biochar-based bioenergy production and utilization inNorthwestern Ontario, Canada. J. For. Res. 26 (4), 799e809.
Hudiburg, T.W., Law, B.E., Wirth, C., Luyssaert, S., 2011. Regional carbon dioxideimplications of forest bioenergy production. Nat. Clim. Chang. 1, 419.
Inoue, Y., Mogi, K., Yoshizawa, S.J.A.K., 2011. Properties of Cinders from Red Pine,Black Locust and Henon Bamboo. https://biochar.jp/pdf/6Properthttps://biochar.jp/pdf/6PropertiesOfCinders.pdf iesOfCinders.pdf. (Accessed 15 March2019).
ISO, 2006a. ISO 14040: Environmental ManagementdLife-Cycle AssessmentedPrinciples and Framework. International Organization for Standardization,Geneva, Switzerland.
ISO, 2006b. ISO 14044: Environmental ManagementdLife-Cycle Assessmented Re-quirements and Guidelines. International Organization for Standardization,Geneva, Switzerland.
Korb, J.E., Johnson, N.C., Covington, W.W., 2004. Slash pile burning effects on soilbiotic and chemical properties and plant establishment: recommendations foramelioration. Restor. Ecol. 12 (1), 52e62.
Langholtz, M., Stokes, B., Eaton, L., 2016. 2016 Billion-Ton Report: Advancing Do-mestic Resources for a Thriving Bioeconomy, vol. 1. Oak Ridge National Labo-ratory, Oak Ridge, TN, p. 448p. Economic availability of feedstock.
Lee, C., Erickson, P., Lazarus, M., Smith, G., 2010. Greenhouse Gas and Air PollutantEmissions of Alternatives for Woody Biomass Residues. Stockholm EnvironmentInstitute.
Mirkouei, A., Mirzaie, P., Haapala, K.R., Sessions, J., Murthy, G.S., 2016. Reducing thecost and environmental impact of integrated fixed and mobile bio-oil refinerysupply chains. J. Clean. Prod. 113, 495e507.
Mirkouei, A., Haapala, K.R., Sessions, J., Murthy, G.S., 2017. A mixed biomass-basedenergy supply chain for enhancing economic and environmental sustainabilitybenefits: a multi-criteria decision making framework. Appl. Energy 206,1088e1101.
Mu~noz, E., Curaqueo, G., Cea, M., Vera, L., Navia, R., 2017. Environmental hotspots inthe life cycle of a biochar-soil system. J. Clean. Prod. 158, 1e7.
Noss, R.F., Franklin, J.F., Baker, W.L., Schoennagel, T., Moyle, P.B., 2006. Managingfire-prone forests in the western United States. Front. Ecol. Environ. 4 (9),481e487.
Please cite this article as: Puettmann, M et al., Life cycle assessment of bioCleaner Production, https://doi.org/10.1016/j.jclepro.2019.119564
NREL (National Renewable Energy Laboratory), 2017. U.S. Life Cycle Inventory (LCI)Database. https://www.nrel.gov/lci/about.html. (Accessed 25 March 2017).
Oneil, E.E., Comnick, J.M., Rogers, L.W., Puettmann, M.E., 2017. Waste to Wisdom:Integrating Feedstock Supply, Fire Risk and Life Cycle Assessment into a Woodto Energy Framework. Final Report on Task 4.2, 4.7 and 4.8.
Page-Dumroese, D.S., Jurgensen, M., Terry, T., 2010. Maintaining soil productivityduring forest or biomass-to-energy thinning harvests in the western UnitedStates. West. J. Appl. Financ. 25 (1), 5e11.
Page-Dumroese, D.S., Busse, M.D., Archuleta, J.G., McAvoy, D., Roussel, E., 2017.Methods to reduce forest residue volume after timber harvesting and produceblack carbon. Sci. Tech. Rep. 8, 2017.
Parkhurst, K.M., Saffron, C.M., Miller, R.O., 2016. An energy analysis comparingbiomass torrefaction in depots to wind with natural gas combustion for elec-tricity generation. Appl. Energy 179, 171e181.
Pereira, P.E.I., Suddick, E.C., Six, J., 2016. Carbon abatement and emissions associatedwith the gasification of walnut shells for bioenergy and biochar production.PLoS One 11 (3) e0150837.
Peters, J.F., Iribarren, D., Dufour, J., 2015. Biomass pyrolysis for biochar or energyapplications? A life cycle assessment. Environ. Sci. Technol. 49 (8), 5195e5202.
Polagye, B.L., Hodgson, K.T., Malte, P.C., 2007. An economic analysis of bio-energyoptions using thinnings from overstocked forests. Biomass Bioenergy 31 (2),105e125.
Puettmann, M., Wilson, K., Oneil, E., 2017. Waste to Wisdom: Integrating FeedstockSupply, Fire Risk and Life Cycle Assessment into a Wood to Energy Framework.
Ramachandran, S., Yao, Z., You, S., Massier, T., Stimming, U., Wang, C.-H., 2017. Lifecycle assessment of a sewage sludge and woody biomass co-gasification sys-tem. Energy 137, 369e376.
Roberts, K.G., Gloy, B.A., Joseph, S., Scott, N.R., Lehmann, J., 2010. Life cycle assess-ment of biochar systems: estimating the energetic, economic, and climatechange potential. Environ. Sci. Technol. 44 (2), 827e833.
Rosas, J.G., G�omez, N., Cara, J., Ubalde, J., Sort, X., S�anchez, M.E., 2015. Assessment ofsustainable biochar production for carbon abatement from vineyard residues.J. Anal. Appl. Pyrolysis 113, 239e247.
Sahoo, K., 2017. Sustainable Design and Simulation of Multi-Feedstock BioenergySupply Chain. Doctoral Thesis. University of Georgia, Athens, Georgia, UnitedStates. College of Engineering.
Sahoo, K., Hawkins, G.L., Yao, X.A., Samples, K., Mani, S., 2016. GIS-based biomassassessment and supply logistics system for a sustainable biorefinery: a casestudy with cotton stalks in the Southeastern US. Appl. Energy 182, 260e273.
Sahoo, K., Bilek, E., Bergman, R., Kizha, A.R., Mani, S., 2018. Economic analysis offorest residues supply chain options to produce enhanced-quality feedstocks.Biofuel Bioprod. Biorefining 13, 514e534.
Sahoo, K., Bilek, E., Bergman, R., Mani, S., 2019. Techno-economic analysis of pro-ducing solid biofuels and biochar from forest residues using portable systems.Appl. Energy 235, 578e590.
Severy, M., Carter, D., Chamberlin, C., Jacobson, A., 2016. Biochar Testing ResultsReport. Schatz Energy Research Center (SERC), Humboldt State University.
Severy, M.A., David, J.C., Kyle, D.P., Anthony, J.E., Arne, E.J., 2018. Performance andemissions control of commercial-scale biochar production unit. Appl. Eng.Agric. 34 (1), 73e84.
Sifford, C.N., Pierobon, F., Ganguly, I., Eastin, I., Alvorado, E., Rogers, L., 2016.Developing an Impact Assessment of Local Air Quality as a Result of BiomassBurns. University of Washington, Seattle, p. 65. http://wastetowisdom.com/wp-content/uploads/2018/08/4.4.1-W2W-Report-Impact-assessment-of-local-air-quality-FINAL.pdf. (Accessed 25 March 2017).
Wang, Z., Dunn, J.B., Han, J., Wang, M.Q., 2014. Effects of co-produced biochar on lifecycle greenhouse gas emissions of pyrolysis-derived renewable fuels. BiofuelBioprod. Biorefining 8 (2), 189e204.
Wright, M.M., Brown, R.C., Boateng, A.A., 2008. Distributed processing of biomass tobio-oil for subsequent production of Fischer-Tropsch liquids. Biofuel Bioprod.Biorefining 2 (3), 229e238.
Yazan, D.M., van Duren, I., Mes, M., Kersten, S., Clancy, J., Zijm, H., 2016. Design ofsustainable second-generation biomass supply chains. Biomass Bioenergy 94,173e186.
Zanchi, G., Pena, N., Bird, N., 2012. Is woody bioenergy carbon neutral? a compar-ative assessment of emissions from consumption of woody bioenergy and fossilfuel, 4 (6), 761e772.
char produced from forest residues using portable systems, Journal of