journal of chromatography a - instituto português do mar ... · b. huerta et al. / j. chromatogr....
TRANSCRIPT
Aus
Ba
b
c
a
ARRAA
KPU
1
pwttpt1Pss1hmcecbt
0h
Journal of Chromatography A, 1288 (2013) 63– 72
Contents lists available at SciVerse ScienceDirect
Journal of Chromatography A
jou rn al h om epage: www.elsev ier .com/ locat e/chroma
nalysis of multi-class pharmaceuticals in fish tissues byltra-high-performance liquid chromatography tandem masspectrometry
. Huertaa, A. Jakimskab, M. Grosa, S. Rodríguez-Mozaza,∗, D. Barcelóa,c
Catalan Institute for Water Research (ICRA), Emili Grahit 101, 17003 Girona, SpainDepartment of Analytical Chemistry, Chemical Faculty, Gdansk University of Technology (GUT), 11/12 G. Narutowicza Street, 80-233 Gdansk, PolandDepartment of Environmental Chemistry, IDAEA-CSIC, Jordi Girona 18-26, 08034 Barcelona, Spain
r t i c l e i n f o
rticle history:eceived 4 December 2012eceived in revised form 28 February 2013ccepted 1 March 2013vailable online 13 March 2013
a b s t r a c t
A new sensitive method based on pressurized liquid extraction (PLE) and purification by gel permeationchromatography (GPC) prior to ultra-high-performance liquid chromatography coupled to tandem massspectrometry (UHPLC–MS/MS) was developed for the determination in fish homogenate, liver and muscleof twenty pharmaceuticals compounds and metabolites from seven commonly used therapeutic families.An extensive matrix effect evaluation was performed in order to select the best approach when analyz-
eywords:harmaceuticals, Fish, Matrix effects,HPLC–MS/MS
ing such complex matrices. Limits of detection (MDLs) for the target compounds were in the range of0.03–0.50 ng/g for fish homogenate, 0.01–0.42 ng/g for fish muscle, and 0.08–0.98 ng/g for fish liver. Themethod was applied to fish tissues of eleven fish species from four heavily impacted Mediterranean rivers.Nine compounds from five therapeutic families were measured at concentrations higher than MDLs.Highest levels were found in trout liver, with a maximum concentration of 18 ng/g for carbamazepine,whereas the most ubiquitous compound was diclofenac.
. Introduction
In recent years, the occurrence, fate, and adverse effects ofharmaceutical residues in aquatic organisms have become a note-orthy issue. In Europe, the legislative proposal for amending
he list of priority substances that represent a significant risko or via the aquatic environment was presented by the Euro-ean Commission on 31 January 2012, and included for the firstime the pharmaceutical substances 17-�-ethinylestradiol (EE2),7-ß-estradiol (E2) and diclofenac [1]. The U.S. Environmentalrotection Agency (EPA) has also included some pharmaceuticalubstances in the Drinking Water Contaminant Candidate List,uch as the antibiotic erythromycin and the estrogenic hormones7-�-estradiol, estriol and estrone [2]. In addition, many reportsave highlighted the potential of pharmaceuticals and/or theiretabolites to accumulate in tissues of aquatic organisms, such as
rustaceans, molluscs and fish, as a consequence of their chronicxposure in aquatic ecosystems [3–5]. In general, pharmaceuti-
ally active compounds (PhACs) are highly hydrophilic, and theirioaccumulation potential might be considered irrelevant, par-icularly when compared to other pollutants, such as pesticides∗ Corresponding author. Tel.: +34 972183380; fax: +34 972183248.E-mail address: [email protected] (S. Rodríguez-Mozaz).
021-9673/$ – see front matter © 2013 Elsevier B.V. All rights reserved.ttp://dx.doi.org/10.1016/j.chroma.2013.03.001
© 2013 Elsevier B.V. All rights reserved.
and persistent organic compounds (POPs). These conventionalpollutants have been reported in a vast number of studies to bioac-cumulate in different organisms because of their lipophilicity andtendency to bind to organic matter [6–10] and are considered inmany priority pollutants lists [11,12]. However, some studies haveindicated that the bioaccumulation of PhACs is not only determinedby chemical lipophilicity, and other processes should also be con-sidered, such as active transport through biological membranes oruptake and depuration kinetics [13–15].
Analytical techniques used for the detection of PhACs presenceat (ultra)trace quantities in environmental matrices have advancedsignificantly in the last few years and have been summarized inrecent reviews [16–24]. Even though an increasing number ofanalytical procedures have been reported for several therapeuticfamilies in biota in the last years, they are still sparse, probably dueto the challenges associated with the complexity of the biologicalmatrices [25]. Groups of PhACs analyzed in biota so far include psy-chiatric drugs [5,26–29], synthetic hormones [30], and antibiotics[3,29,31,32]. Exhaustive sample preparation followed by sensitivedetection techniques is required in these cases, due to the very lowconcentration of analytes in biological matrices [33]. Both, ultra-
sonication and pressurized liquid extraction (PLE) have been oftenused for the extraction of PhACs in aquatic organisms, such ascrustaceans, mussels, algae, and fish [27,28,30,34–37]. Regardingthe crucial purification step of the sample extract, different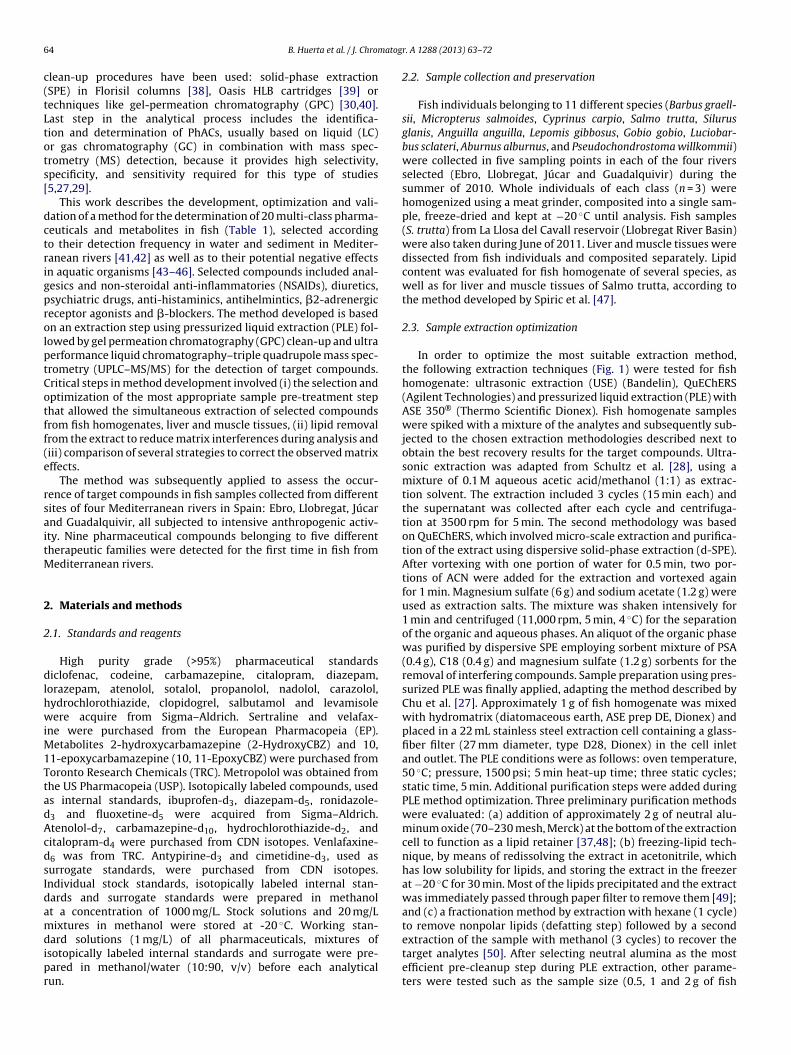
6 atog
c(tLtots[
dctrigprolptCotff(e
rsaitM
2
2
dlhwiM1TtadAcdsIdamdipr
4 B. Huerta et al. / J. Chrom
lean-up procedures have been used: solid-phase extractionSPE) in Florisil columns [38], Oasis HLB cartridges [39] orechniques like gel-permeation chromatography (GPC) [30,40].ast step in the analytical process includes the identifica-ion and determination of PhACs, usually based on liquid (LC)r gas chromatography (GC) in combination with mass spec-rometry (MS) detection, because it provides high selectivity,pecificity, and sensitivity required for this type of studies5,27,29].
This work describes the development, optimization and vali-ation of a method for the determination of 20 multi-class pharma-euticals and metabolites in fish (Table 1), selected accordingo their detection frequency in water and sediment in Mediter-anean rivers [41,42] as well as to their potential negative effectsn aquatic organisms [43–46]. Selected compounds included anal-esics and non-steroidal anti-inflammatories (NSAIDs), diuretics,sychiatric drugs, anti-histaminics, antihelmintics, �2-adrenergiceceptor agonists and �-blockers. The method developed is basedn an extraction step using pressurized liquid extraction (PLE) fol-owed by gel permeation chromatography (GPC) clean-up and ultraerformance liquid chromatography–triple quadrupole mass spec-rometry (UPLC–MS/MS) for the detection of target compounds.ritical steps in method development involved (i) the selection andptimization of the most appropriate sample pre-treatment stephat allowed the simultaneous extraction of selected compoundsrom fish homogenates, liver and muscle tissues, (ii) lipid removalrom the extract to reduce matrix interferences during analysis andiii) comparison of several strategies to correct the observed matrixffects.
The method was subsequently applied to assess the occur-ence of target compounds in fish samples collected from differentites of four Mediterranean rivers in Spain: Ebro, Llobregat, Júcarnd Guadalquivir, all subjected to intensive anthropogenic activ-ty. Nine pharmaceutical compounds belonging to five differentherapeutic families were detected for the first time in fish from
editerranean rivers.
. Materials and methods
.1. Standards and reagents
High purity grade (>95%) pharmaceutical standardsiclofenac, codeine, carbamazepine, citalopram, diazepam,
orazepam, atenolol, sotalol, propanolol, nadolol, carazolol,ydrochlorothiazide, clopidogrel, salbutamol and levamisoleere acquire from Sigma–Aldrich. Sertraline and velafax-
ne were purchased from the European Pharmacopeia (EP).etabolites 2-hydroxycarbamazepine (2-HydroxyCBZ) and 10,
1-epoxycarbamazepine (10, 11-EpoxyCBZ) were purchased fromoronto Research Chemicals (TRC). Metropolol was obtained fromhe US Pharmacopeia (USP). Isotopically labeled compounds, useds internal standards, ibuprofen-d3, diazepam-d5, ronidazole-3 and fluoxetine-d5 were acquired from Sigma–Aldrich.tenolol-d7, carbamazepine-d10, hydrochlorothiazide-d2, anditalopram-d4 were purchased from CDN isotopes. Venlafaxine-6 was from TRC. Antypirine-d3 and cimetidine-d3, used asurrogate standards, were purchased from CDN isotopes.ndividual stock standards, isotopically labeled internal stan-ards and surrogate standards were prepared in methanolt a concentration of 1000 mg/L. Stock solutions and 20 mg/Lixtures in methanol were stored at -20 ◦C. Working stan-
ard solutions (1 mg/L) of all pharmaceuticals, mixtures ofsotopically labeled internal standards and surrogate were pre-ared in methanol/water (10:90, v/v) before each analyticalun.
r. A 1288 (2013) 63– 72
2.2. Sample collection and preservation
Fish individuals belonging to 11 different species (Barbus graell-sii, Micropterus salmoides, Cyprinus carpio, Salmo trutta, Silurusglanis, Anguilla anguilla, Lepomis gibbosus, Gobio gobio, Luciobar-bus sclateri, Aburnus alburnus, and Pseudochondrostoma willkommii)were collected in five sampling points in each of the four riversselected (Ebro, Llobregat, Júcar and Guadalquivir) during thesummer of 2010. Whole individuals of each class (n = 3) werehomogenized using a meat grinder, composited into a single sam-ple, freeze-dried and kept at −20 ◦C until analysis. Fish samples(S. trutta) from La Llosa del Cavall reservoir (Llobregat River Basin)were also taken during June of 2011. Liver and muscle tissues weredissected from fish individuals and composited separately. Lipidcontent was evaluated for fish homogenate of several species, aswell as for liver and muscle tissues of Salmo trutta, according tothe method developed by Spiric et al. [47].
2.3. Sample extraction optimization
In order to optimize the most suitable extraction method,the following extraction techniques (Fig. 1) were tested for fishhomogenate: ultrasonic extraction (USE) (Bandelin), QuEChERS(Agilent Technologies) and pressurized liquid extraction (PLE) withASE 350® (Thermo Scientific Dionex). Fish homogenate sampleswere spiked with a mixture of the analytes and subsequently sub-jected to the chosen extraction methodologies described next toobtain the best recovery results for the target compounds. Ultra-sonic extraction was adapted from Schultz et al. [28], using amixture of 0.1 M aqueous acetic acid/methanol (1:1) as extrac-tion solvent. The extraction included 3 cycles (15 min each) andthe supernatant was collected after each cycle and centrifuga-tion at 3500 rpm for 5 min. The second methodology was basedon QuEChERS, which involved micro-scale extraction and purifica-tion of the extract using dispersive solid-phase extraction (d-SPE).After vortexing with one portion of water for 0.5 min, two por-tions of ACN were added for the extraction and vortexed againfor 1 min. Magnesium sulfate (6 g) and sodium acetate (1.2 g) wereused as extraction salts. The mixture was shaken intensively for1 min and centrifuged (11,000 rpm, 5 min, 4 ◦C) for the separationof the organic and aqueous phases. An aliquot of the organic phasewas purified by dispersive SPE employing sorbent mixture of PSA(0.4 g), C18 (0.4 g) and magnesium sulfate (1.2 g) sorbents for theremoval of interfering compounds. Sample preparation using pres-surized PLE was finally applied, adapting the method described byChu et al. [27]. Approximately 1 g of fish homogenate was mixedwith hydromatrix (diatomaceous earth, ASE prep DE, Dionex) andplaced in a 22 mL stainless steel extraction cell containing a glass-fiber filter (27 mm diameter, type D28, Dionex) in the cell inletand outlet. The PLE conditions were as follows: oven temperature,50 ◦C; pressure, 1500 psi; 5 min heat-up time; three static cycles;static time, 5 min. Additional purification steps were added duringPLE method optimization. Three preliminary purification methodswere evaluated: (a) addition of approximately 2 g of neutral alu-minum oxide (70–230 mesh, Merck) at the bottom of the extractioncell to function as a lipid retainer [37,48]; (b) freezing-lipid tech-nique, by means of redissolving the extract in acetonitrile, whichhas low solubility for lipids, and storing the extract in the freezerat −20 ◦C for 30 min. Most of the lipids precipitated and the extractwas immediately passed through paper filter to remove them [49];and (c) a fractionation method by extraction with hexane (1 cycle)to remove nonpolar lipids (defatting step) followed by a second
extraction of the sample with methanol (3 cycles) to recover thetarget analytes [50]. After selecting neutral alumina as the mostefficient pre-cleanup step during PLE extraction, other parame-ters were tested such as the sample size (0.5, 1 and 2 g of fish
B. Huerta et al. / J. Chromatogr. A 1288 (2013) 63– 72 65
Table 1Chemical structures and precursor ions of selected pharmaceuticals (calculated with MarvinSketch software).
Compound Therapeutic family Molecular structure Precursor ion Internal standard pKa log P
Atenolol �-Blockers 267 [M+H]+ Atenolol-d7 pKa1: 9.67 0.43pKa2: 14.08pKa3: 15.95
Carazolol �-Blockers 299 [M+H]+ Atenolol-d7 pKa1: 9.67 2.71
pKa2: 14.03pKa3: 15.00
Metropolol �-Blockers 268 [M+H]+ Atenolol-d7 pKa1: 9.67 1.76pKa2: 14.09
Nadolol �-Blockers 310 [M+H]+ Atenolol-d7 pKa1: 9.76 0.87pKa2: 13.59pKa3: 14.22
Propanolol �-Blockers 260 [M+H]+ Atenolol-d7 pKa1: 9.67 2.58pKa2: 14.09
Sotalol �-Blockers 273 [M+H]+ Atenolol-d7 pKa1: 9.43 0.05pKa2: 10.07pKa3: 14.10
Carbamazepine Psychiatric drugs 237 [M+H]+ Carbamazepine-d10 pKa: 13.94 2.77
Citalopram Psychiatric drugs 325 [M+H]+ Citalopram-d4 pKa: 9.78 3.76
Diazepam Psychiatric drugs 285 [M+H]+ Diazepam-d5 pKa: 2.92 3.08
10,11-EpoxyCBZ Psychiatric drugs 253 [M+H]+ Carbamazepine-d10 pKa: 19.65 2.31
2-HydroxyCBZ Psychiatric drugs 253 [M+H]+ Carbamazepine-d10 pKa1: 9.15 2.46pKa2: 15.96
Lorazepam Psychiatric drugs 321 [M+H]+ Diazepam-d5 pKa1: 10.61 2.53pKa2: 12.46
Sertraline Psychiatric drugs 307 [M+H]+ Fluoxetine-d5 pKa: 9.85 5.15
66 B. Huerta et al. / J. Chromatogr. A 1288 (2013) 63– 72
Table 1 (Continued)
Compound Therapeutic family Molecular structure Precursor ion Internal standard pKa log P
Venlafaxine Psychiatric drugs 278 [M+H]+ Venlafaxine-d6 pKa1: 8.91 2.74pKa2: 14.42
Clopidrogel Antiplatelet agent 322 [M+H]+ Diazepam-d5 pKa: 5.14 4.03
Codeine Analgesics/anti-inflammatories 300 [M+H]+ Carbamazepine-d10 pKa1: 9.19 1.34pKa2: 13.78
Diclofenac Analgesics/anti-inflammatories 294 [M-H]− Ibuprofen-d3 pKa1: 4.00 4.26pKa2: 16.40
Hydrochlorothiazide Diuretic 296 [M−H]− Hydrochlorothiazide-d2 pKa1: 9.09 −0.58pKa2: 9.83pKa3: 11.31
Levamisole Antihelmintics 205 [M+H]+ Ronidazole-d3 pKa: 6.98 2.36
+
hnttietsoss
2
tn6AtOcsi5tF13Gf2
Salbutamol To treat asthma
omogenate), extraction solvent (methanol, acetonitrile, water),umber of extraction cycles (3 or 4 extraction cycles), and extrac-ion temperature (50, 70, 80 and 90 ◦C), with the aim to obtainhe maximum extraction efficiency with the minimum presence ofnterfering compounds. Presented results led to the selection of anxtraction protocol method based on PLE, with methanol as extrac-ion solvent, 4 extraction cycles of five minutes each at 50 ◦C for aample size of 1 g of fish homogenate, 1 g of muscle tissue and 0.5 gf liver tissue. Final extracts were evaporated to dryness under atream of nitrogen and redissolved in the corresponding organicolvent for the purification step.
.4. Sample purification optimization
Fish homogenate extracts were spiked with a mixture of thearget analytes and a comparison between three purification tech-iques (Fig. 1) was performed: (a) SPE Florisil cartridges (1 g,
ml cartridges); (b) Gel permeation chromatography (GPC) in angilent 1260 Infinity high pressure liquid chromatography sys-
em in tandem with a diode array detector (HPLC-DAD); (c) SPEasis HLB (200 mg, 6 ml cartridges) followed by GPC. For thelean-up method based on SPE Florisil, fish extracts were redis-olved in 10 ml of acetonitrile prior SPE, which was performedn a J.T.Baker® system. Florisil cartridges were conditioned with
ml hexane followed by 5 ml acetonitrile. Extract was passedhrough the cartridge and collected for evaporation to dryness.or the purification method based on the use of GPC, 250 �L of
ml extracts in methanol were passed through an EnviroPrep,
00 mm × 21.2 mm (10 �m pore size) column coupled to a PLgeluard column (50 mm × 7.5 mm) (Agilent Technologies). Purifiedractions containing target compounds (between minute 13.5 to6.5) were collected and evaporated to dryness. Finally, for the third
240 [M+H] Atenolol-d7 pKa1: 9.40 0.88pKa2: 10.12pKa3: 14.18
clean-up protocol tested fish extracts were redissolved in 250 ml ofHPLC-grade water and loaded in Oasis HLB cartridges for SPE. OasisHLB cartridges were previously conditioned with 6 ml methanolfollowed by 6 ml HPLC-grade water. After the sample was loaded at2 mL/min, analytes were eluted with 6 ml of methanol. Eluates wereevaporated to final volume of 1 mL of methanol and then injectedin GPC for further purification. Final extracts were evaporated todryness and reconstituted with 1 ml methanol/water (10:90, v/v),and 50 �L of a 1 mg/L mixture containing the internal standardswere added.
2.5. Liquid chromatography and mass spectrometry analysis
The chromatographic tandem mass spectrometry methodapplied for the analysis of fish extracts was adapted from Groset al. [51]. Briefly, chromatographic separations were carried outwith a Waters Acquity Ultra-PerformanceTM liquid chromatog-raphy system, using an Acquity HSS T3 colum (50 mm × 2.1 mmi.d., 1.8 �m particle size) for the compounds analyzed in positiveelectrospray ionization (PI) mode and an Acquity BEH C18 column(50 mm × 2.1 mm i.d., 1.7 �m particle size) for the ones analyzedunder negative electrospray ionization (NI) mode. For the anal-ysis in PI mode, separation conditions were as follows: solvent(A) methanol, solvent (B) 10 mM formic acid/ammonium formate(pH 3.2) at a flow rate of 0.5 mL/min. The analysis in NI modewas performed by using acetonitrile (A) and (B) 5 mM ammoniumacetate/ammonia (pH = 8) at a flow rate of 0.6 mL/min. The sam-ple volume injected was 5 �L in both cases. The UPLC instrument
was coupled to a 5500 QTRAP hybrid triple quadrupole-linear iontrap mass spectrometer (Applied Biosystems). Source-dependentparameters for compounds analyzed under PI were: curtaingas (CUR), 30 psi; nitrogen collision gas (CAD) medium; source
B. Huerta et al. / J. Chromatogr. A 1288 (2013) 63– 72 67
tsc(agbiutiSsw
3
3
nPtwatwomrtccvopiew
Fig. 2. Comparison of extraction efficiencies (%) between QuEChERS and PLE for the
Fig. 1. Sample pretreatment scheme tested during method optimization.
emperature (TEM) was 650 ◦C; ion spray voltage was 5500 V; ionource gases GS1 and GS2 were set 60 and 50 psi, respectively. Forompounds analyzed under NI, such parameters were: curtain gasCUR), 30 psi; nitrogen collision gas (CAD) medium; source temper-ture (TEM) was 650 ◦C; ion spray voltage was −3500 V; ion sourceases GS1 and GS2 were set 60 and 70 psi. Two SRM transitionsetween the precursor ion and the two most abundant fragment
ons were monitored for each compound. The first transition wassed for quantification purposes, whereas the second one was usedo confirm the identity of the target compounds. Besides the mon-toring of the SRM transitions, the relative abundance of the twoRM transitions in the sample were compared with those in thetandards, and the relative abundances in the samples must beithin ±20% of the two SRM ratios in the analytical standards [51].
. Results and discussion
.1. Extraction and purification of the analytes from fish tissues
After the comparison of the three preliminary extraction tech-iques described in the previous section (USE, QuEChERS andLE), USE was discarded as a viable option, as only five out ofwenty compounds were efficiently recovered. Results obtainedith QuEChERS, which had before been successfully applied to the
nalysis of polar compounds in biological matrices, such as pes-icides in food matrices [52] and antibiotics in bovine liver [53],ere quite satisfactory, with recoveries surpassing 40% for most
f compounds (Fig. 2). However, PLE was finally selected as theost appropriate extraction technique, due to the overall better
ecoveries (Fig. 2) of relevant compounds (diclofenac, propanolol),he lower relative standard deviation (RSD) (%), and the signifi-antly lesser matrix interferences observed during analysis whenompared to QuEChERS. PLE allows the use of conventional sol-ents at high temperature and pressure to improve the extractionf pollutants from solid samples, but it may still co-extract a high
roportion of matrix interferences [33,54]. Therefore, the possibil-ty of a simultaneous purification step (pre clean-up) during PLExtraction to reduce the coextraction of other matrix componentsas assessed. An intra-cell clean-up with neutral alumina (2 g)
target analytes (n = 3).
was selected among the tested methods as the best sorbent, sincethe extraction efficiency for target compounds did not decreasewhile the lipid content in the extracts was reduced (results notshown). Further refinement of the PLE procedure was accomplishedby optimizing several critical parameters, such as extraction sol-vent and its volume, cycle time and number of extraction cycles,extraction temperature and amount of biomass. Among all theseparameters, extraction solvent appeared to be the most relevant.At 50 ◦C, methanol provided the highest recoveries when comparedto other solvents (acetonitrile), solvent mixtures (methanol/water,1:1; methanol/acetonitrile, 1:1) or solvent with additive (acidifiedmethanol) (Fig. S1). The rest of the parameters did not signifi-cantly improve the recoveries. Sample size was set at 1 g for fishhomogenate and muscle tissues, whereas 0.5 g was selected in thecase of liver tissue to minimize the lipid content in the extract andthus the potential interferences during analysis. Temperature wasset at 50 ◦C to avoid analyte degradation, as pharmaceuticals areoften thermolabile [20]. Four cycles of 5 min each was establishedas extraction time and 100% flush volume and 90 s of nitrogen purgewere the final parameters selected.
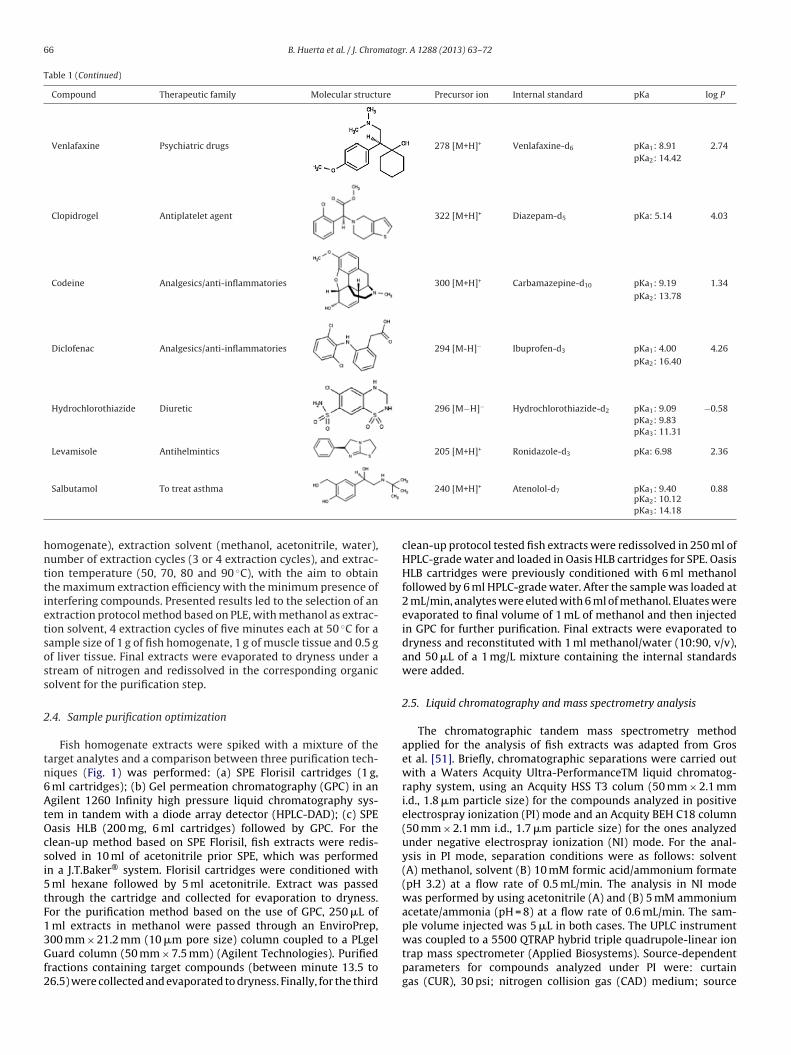
Regarding clean-up procedures, Fig. 3 presents the recoveriesfor the target analytes obtained with the three purification tech-niques tested. Florisil cartridges showed generally low recoveries,and thus it was discarded. SPE with Oasis HLB followed by GPCcaused decrease of overall recoveries, particularly in the case of �-blocker compounds and, in consequence, a single GPC purificationstep was selected as clean-up method, as it provided satisfactoryresults for most of the target compounds. Several parameters wereadditionally optimized: mobile phase (dichloromethane (DCM),DCM/MeOH mixtures), flow rate (3, 4 and 5 ml/min) and injec-tion volume (100, 250, 500, 750 �L). The final selected parameters
were the following: DCM/MeOH (90:10, v/v) as mobile phase, at5 mL/min flow rate, injection volume of 250 �L for homogenatesamples, 500 �L for liver samples and 750 �L for muscle samples.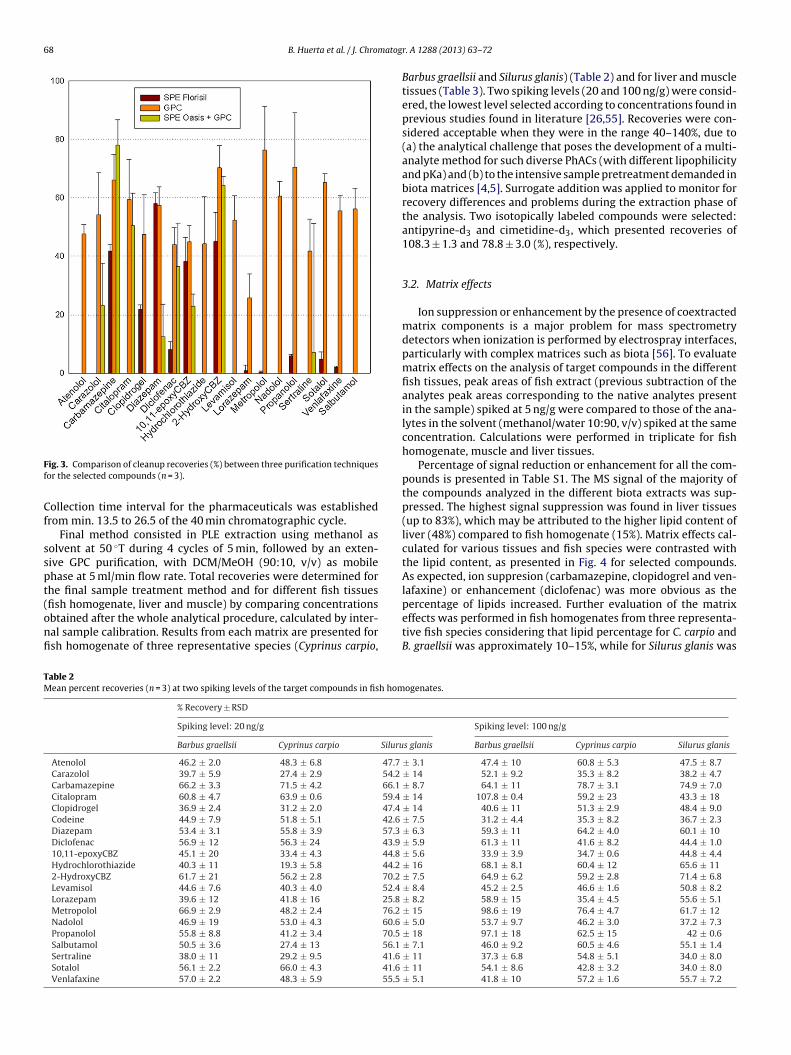
68 B. Huerta et al. / J. Chromatog
Ff
Cf
sspt(onfi
TM
ig. 3. Comparison of cleanup recoveries (%) between three purification techniquesor the selected compounds (n = 3).
ollection time interval for the pharmaceuticals was establishedrom min. 13.5 to 26.5 of the 40 min chromatographic cycle.
Final method consisted in PLE extraction using methanol asolvent at 50 ◦T during 4 cycles of 5 min, followed by an exten-ive GPC purification, with DCM/MeOH (90:10, v/v) as mobilehase at 5 ml/min flow rate. Total recoveries were determined forhe final sample treatment method and for different fish tissues
fish homogenate, liver and muscle) by comparing concentrationsbtained after the whole analytical procedure, calculated by inter-al sample calibration. Results from each matrix are presented forsh homogenate of three representative species (Cyprinus carpio,able 2ean percent recoveries (n = 3) at two spiking levels of the target compounds in fish hom
% Recovery ± RSD
Spiking level: 20 ng/g
Barbus graellsii Cyprinus carpio Siluru
Atenolol 46.2 ± 2.0 48.3 ± 6.8 47.7
Carazolol 39.7 ± 5.9 27.4 ± 2.9 54.2
Carbamazepine 66.2 ± 3.3 71.5 ± 4.2 66.1
Citalopram 60.8 ± 4.7 63.9 ± 0.6 59.4
Clopidrogel 36.9 ± 2.4 31.2 ± 2.0 47.4
Codeine 44.9 ± 7.9 51.8 ± 5.1 42.6
Diazepam 53.4 ± 3.1 55.8 ± 3.9 57.3
Diclofenac 56.9 ± 12 56.3 ± 24 43.9
10,11-epoxyCBZ 45.1 ± 20 33.4 ± 4.3 44.8
Hydrochlorothiazide 40.3 ± 11 19.3 ± 5.8 44.2
2-HydroxyCBZ 61.7 ± 21 56.2 ± 2.8 70.2
Levamisol 44.6 ± 7.6 40.3 ± 4.0 52.4
Lorazepam 39.6 ± 12 41.8 ± 16 25.8
Metropolol 66.9 ± 2.9 48.2 ± 2.4 76.2
Nadolol 46.9 ± 19 53.0 ± 4.3 60.6
Propanolol 55.8 ± 8.8 41.2 ± 3.4 70.5
Salbutamol 50.5 ± 3.6 27.4 ± 13 56.1
Sertraline 38.0 ± 11 29.2 ± 9.5 41.6
Sotalol 56.1 ± 2.2 66.0 ± 4.3 41.6
Venlafaxine 57.0 ± 2.2 48.3 ± 5.9 55.5
r. A 1288 (2013) 63– 72
Barbus graellsii and Silurus glanis) (Table 2) and for liver and muscletissues (Table 3). Two spiking levels (20 and 100 ng/g) were consid-ered, the lowest level selected according to concentrations found inprevious studies found in literature [26,55]. Recoveries were con-sidered acceptable when they were in the range 40–140%, due to(a) the analytical challenge that poses the development of a multi-analyte method for such diverse PhACs (with different lipophilicityand pKa) and (b) to the intensive sample pretreatment demanded inbiota matrices [4,5]. Surrogate addition was applied to monitor forrecovery differences and problems during the extraction phase ofthe analysis. Two isotopically labeled compounds were selected:antipyrine-d3 and cimetidine-d3, which presented recoveries of108.3 ± 1.3 and 78.8 ± 3.0 (%), respectively.
3.2. Matrix effects
Ion suppression or enhancement by the presence of coextractedmatrix components is a major problem for mass spectrometrydetectors when ionization is performed by electrospray interfaces,particularly with complex matrices such as biota [56]. To evaluatematrix effects on the analysis of target compounds in the differentfish tissues, peak areas of fish extract (previous subtraction of theanalytes peak areas corresponding to the native analytes presentin the sample) spiked at 5 ng/g were compared to those of the ana-lytes in the solvent (methanol/water 10:90, v/v) spiked at the sameconcentration. Calculations were performed in triplicate for fishhomogenate, muscle and liver tissues.
Percentage of signal reduction or enhancement for all the com-pounds is presented in Table S1. The MS signal of the majority ofthe compounds analyzed in the different biota extracts was sup-pressed. The highest signal suppression was found in liver tissues(up to 83%), which may be attributed to the higher lipid content ofliver (48%) compared to fish homogenate (15%). Matrix effects cal-culated for various tissues and fish species were contrasted withthe lipid content, as presented in Fig. 4 for selected compounds.As expected, ion suppresion (carbamazepine, clopidogrel and ven-lafaxine) or enhancement (diclofenac) was more obvious as the
percentage of lipids increased. Further evaluation of the matrixeffects was performed in fish homogenates from three representa-tive fish species considering that lipid percentage for C. carpio andB. graellsii was approximately 10–15%, while for Silurus glanis wasogenates.
Spiking level: 100 ng/g
s glanis Barbus graellsii Cyprinus carpio Silurus glanis
± 3.1 47.4 ± 10 60.8 ± 5.3 47.5 ± 8.7± 14 52.1 ± 9.2 35.3 ± 8.2 38.2 ± 4.7± 8.7 64.1 ± 11 78.7 ± 3.1 74.9 ± 7.0± 14 107.8 ± 0.4 59.2 ± 23 43.3 ± 18± 14 40.6 ± 11 51.3 ± 2.9 48.4 ± 9.0± 7.5 31.2 ± 4.4 35.3 ± 8.2 36.7 ± 2.3± 6.3 59.3 ± 11 64.2 ± 4.0 60.1 ± 10± 5.9 61.3 ± 11 41.6 ± 8.2 44.4 ± 1.0± 5.6 33.9 ± 3.9 34.7 ± 0.6 44.8 ± 4.4± 16 68.1 ± 8.1 60.4 ± 12 65.6 ± 11± 7.5 64.9 ± 6.2 59.2 ± 2.8 71.4 ± 6.8± 8.4 45.2 ± 2.5 46.6 ± 1.6 50.8 ± 8.2± 8.2 58.9 ± 15 35.4 ± 4.5 55.6 ± 5.1± 15 98.6 ± 19 76.4 ± 4.7 61.7 ± 12± 5.0 53.7 ± 9.7 46.2 ± 3.0 37.2 ± 7.3± 18 97.1 ± 18 62.5 ± 15 42 ± 0.6± 7.1 46.0 ± 9.2 60.5 ± 4.6 55.1 ± 1.4± 11 37.3 ± 6.8 54.8 ± 5.1 34.0 ± 8.0± 11 54.1 ± 8.6 42.8 ± 3.2 34.0 ± 8.0± 5.1 41.8 ± 10 57.2 ± 1.6 55.7 ± 7.2

B. Huerta et al. / J. Chromatogr. A 1288 (2013) 63– 72 69
Table 3Mean percent recoveries (n = 3) in fish liver and muscle tissues (spiking level: 20 & 100 ng/g).
% Recovery ± RSD
Spiking level: 20 ng/g Spiking level: 100 ng/g
Liver Muscle Liver Muscle
Atenolol 47.4 ± 0.6 59.9 ± 2.7 68.4 ± 12 46.9 ± 7.2Carazolol 57.9 ± 2.7 67.9 ± 8.3 74.8 ± 3.1 85.3 ± 15Carbamazepine 85.5 ± 3.3 61.2 ± 8.8 102.3 ± 8.7 74.8 ± 4.8Citalopram 52.3 ± 0.3 33.5 ± 0.6 125.7 ± 12 59.5 ± 13Clopidrogel 44.0 ± 11 60.3 ± 2.3 45.0 ± 9.5 51.3 ± 9.2Codeine 38.7 ± 0.3 53.0 ± 0.7 62.3 ± 3.2 50.1 ± 5.3Diazepam 31.5 ± 3.1 44.2 ± 5.5 110.0 ± 10 88.7 ± 6.6Diclofenac 38.0 ± 2.8 66.8 ± 5.9 43.9 ± 3.4 63.7 ± 1210,11-epoxyCBZ 27.5 ± 4.5 27.5 ± 7.3 49.3 ± 3.6 45.2 ± 7.9Hydrochlorothiazide 68.2 ± 0.9 79.7 ± 7.4 91.9 ± 16 67.2 ± 192-HydroxyCBZ 45.1 ± 0.2 49.9 ± 2.6 95.5 ± 4.4 79.3 ± 13Levamisol 35.0 ± 2.3 84.1 ± 4.1 28.1 ± 13 48.5 ± 15Lorazepam 54.8 ± 1.8 86.2 ± 8.1 21.3 ± 8.0 42.8 ± 2.2Metropolol 45.1 ± 0.3 79.7 ± 7.4 91.9 ± 7.9 64.1 ± 5.6Nadolol 55.8 ± 1.2 60.3 ± 2.3 79.3 ± 5.8 47.3 ± 10Propanolol 60.8 ± 9.8 84.6 ± 2.1 92.8 ± 5.7 74.3 ± 17Sertraline 85.0 ± 0.6 92.0 ± 5.7 150.6 ± 8.2 88.1 ± 11Sotalol 50.0 ± 7.7 87.7
Venlafaxine 63.1 ± 0.1 68.8
Salbutamol 47.1 ± 4.2 49.1
FR
uitgoloic
osewttMtw
ig. 4. Matrix effects vs lipid content represented for carbamazepine (fit curve2 = 0.74), clopidogrel (R2 = 0.92), diclofenac (R2 = 0.95), and venlafaxine (R2 = 0.77).
p to 25%. The results presented in Table S1 show a great similar-ty in the response in (a) C. carpio and (b) B. graellsii, and oppositeo (c) S. glanis, where the majority of the compounds presentedreater ion suppression and a very low deviation compared to thether species, which could be a direct consequence of the higheripid content of S. glanis. These results highlighted the relevancef using a suitable approach to compensate for matrix effects dur-ng analysis of the same biota matrix, considering the variability inomposition that different species might have.
An evaluation of the best approach to compensate for thebserved matrix effects was therefore performed. In the first place,tandard addition was considered, as it is, by definition, the mostffective approach for compensating matrix effects. However, itas difficult and time-consuming due to the great of samples
o processes. Other approaches include matrix-matched calibra-
ion and internal calibration with isotopically labeled standards.atrix-matched calibration requires a control matrix similar tohe real sample and that does not contain the target analytes,hich was not available in this case. Internal standard calibration
± 2.1 86.3 ± 13 48.5 ± 12± 2.7 124.4 ± 6.6 126.4 ± 11.± 3.2 52.9 ± 4.4 38.0 ± 1.2
entails the addition to the extract of isotopically labeled standardsthat are structurally similar to the target analytes to compare theinstrument response during the analysis. Since only ten (out of 20target compounds) isotopically labeled standards were availableto use as internal standard during method optimization, an alter-native strategy for the correction of matrix effect were explored,namely internal sample calibration [57,58]. Two calibration curvesin the range of 0.1–25 ng/mL were prepared in both, a solvent mix-ture and fish extract, and internal standards were added to thetwo of them at the same concentration. Fig. 5 presents the inter-nal standard calibration (solvent curve) and the internal samplecalibration (curve prepared in fish extract) for two compounds, car-bamazepine and clopidogrel. In the case of carbamazepine (Fig. 5a),whose quantification was corrected with its analogue labeled com-pound (carbamazapine-d10), both calibration curves were verysimilar, which indicates that the internal standard was compensat-ing the observed matrix effects. In the case of clopidogrel (Fig. 5b)whose corresponding analogue labeled compound was not avail-able, calibration curves were noticeably different, as the internalstandard (diazepam-d5) used during quantification with the sol-vent curve was not correcting completely the ion suppressionobserved in the real sample. Consequently, the most advanta-geous approach for an accurate determination of target compoundsseemed to be the quantification using a calibration curve preparedwith spiked fish extracts and internal standard addition (internalsample calibration), which was able to correct the matrix effectsfor all the compounds. Internal sample calibration is thus rec-ommended especially in those cases when the analogue internalstandard is not available.
Due to the differences observed in lipid content between fishspecies, it was important to assess if quantification of analytes wasaffected by the use of the different fish matrices to build the cali-bration curves. The accuracy of the measurements when preparingthe internal sample calibration in three representative species (C.carpio, B. graellsii and S. glanis) was evaluated. An extract of C. carpiowas spiked (25 ng/g) with a mixture of the analytes and quantifiedusing internal standard calibration and internal sample calibrationprepared in extracts of the three fish species. As expected, the most
accurate measurement corresponds to the internal sample calibra-tion with C. carpio extracts, since the same fish sample was usedfor building the internal sample calibration curve. Internal samplecalibration curve built in B. graellsii extracts, with similar amount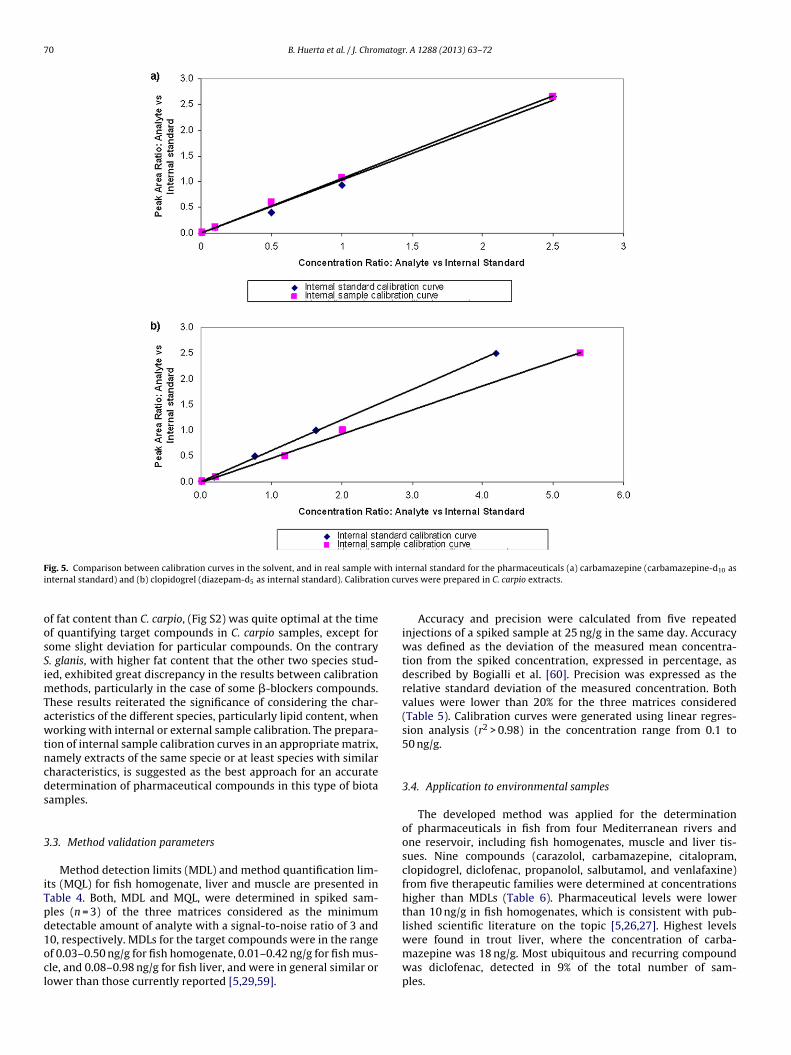
70 B. Huerta et al. / J. Chromatogr. A 1288 (2013) 63– 72
F ith ini on cur
oosSimTawtncds
3
iTpd1ocl
lished scientific literature on the topic [5,26,27]. Highest levels
ig. 5. Comparison between calibration curves in the solvent, and in real sample wnternal standard) and (b) clopidogrel (diazepam-d5 as internal standard). Calibrati
f fat content than C. carpio, (Fig S2) was quite optimal at the timef quantifying target compounds in C. carpio samples, except forome slight deviation for particular compounds. On the contrary. glanis, with higher fat content that the other two species stud-ed, exhibited great discrepancy in the results between calibration
ethods, particularly in the case of some �-blockers compounds.hese results reiterated the significance of considering the char-cteristics of the different species, particularly lipid content, whenorking with internal or external sample calibration. The prepara-
ion of internal sample calibration curves in an appropriate matrix,amely extracts of the same specie or at least species with similarharacteristics, is suggested as the best approach for an accurateetermination of pharmaceutical compounds in this type of biotaamples.
.3. Method validation parameters
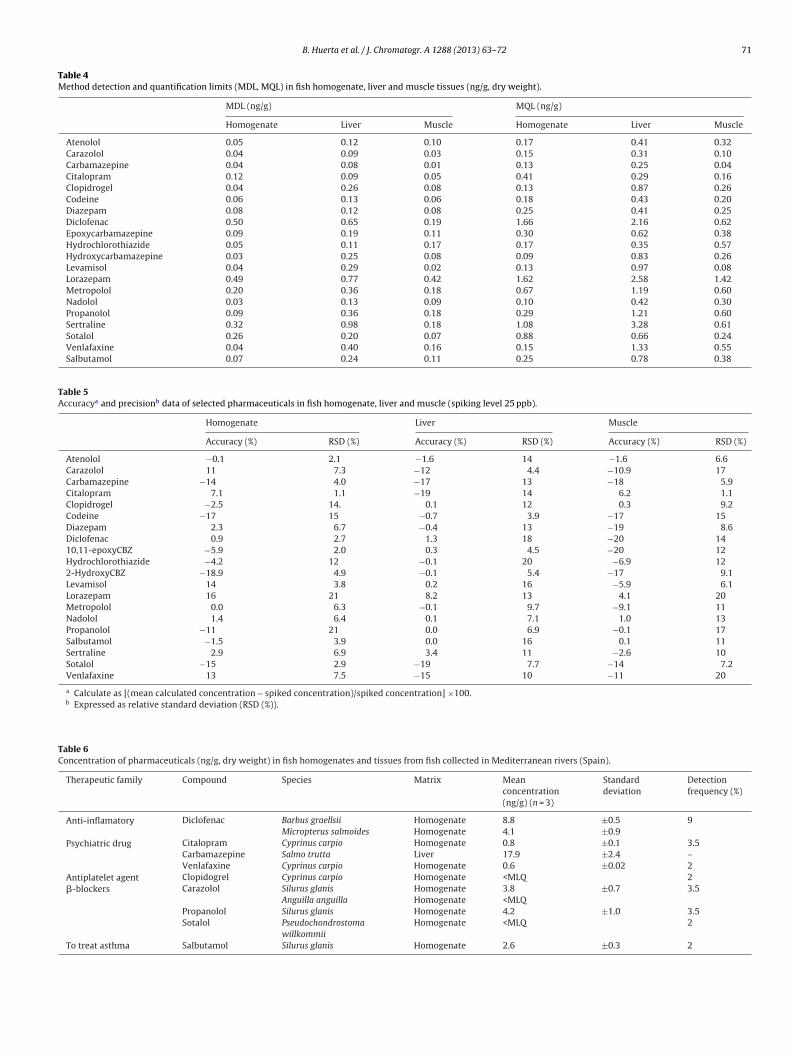
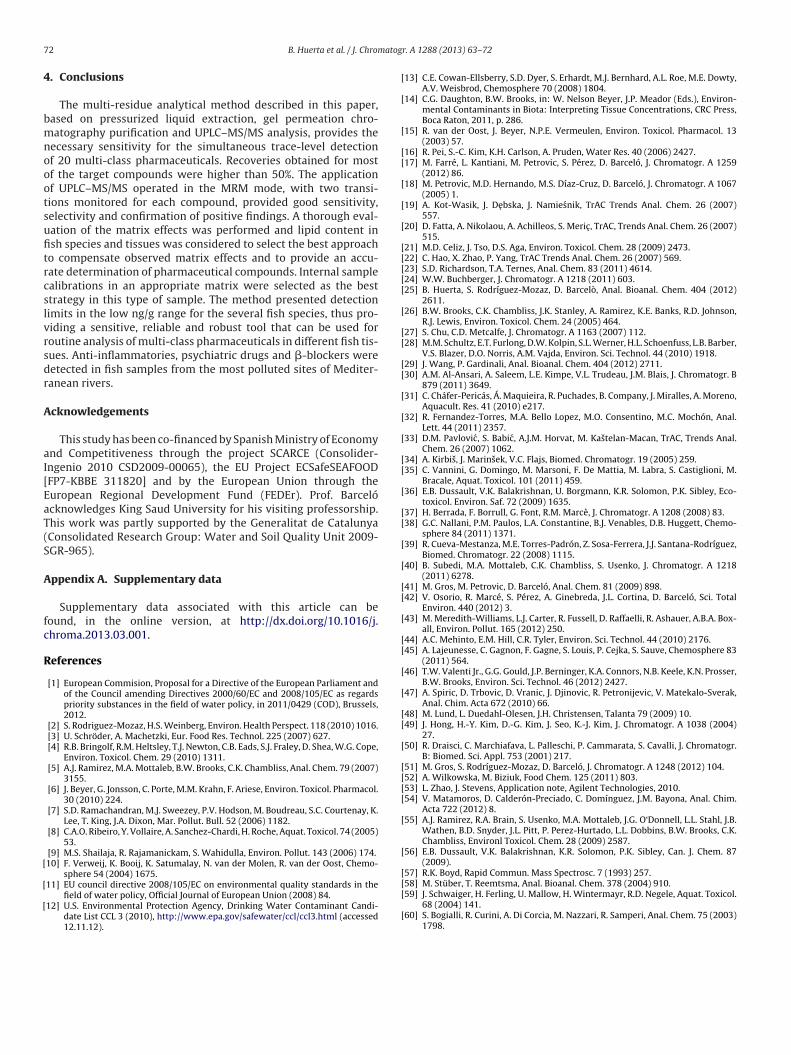
Method detection limits (MDL) and method quantification lim-ts (MQL) for fish homogenate, liver and muscle are presented inable 4. Both, MDL and MQL, were determined in spiked sam-les (n = 3) of the three matrices considered as the minimumetectable amount of analyte with a signal-to-noise ratio of 3 and
0, respectively. MDLs for the target compounds were in the rangef 0.03–0.50 ng/g for fish homogenate, 0.01–0.42 ng/g for fish mus-le, and 0.08–0.98 ng/g for fish liver, and were in general similar orower than those currently reported [5,29,59].ternal standard for the pharmaceuticals (a) carbamazepine (carbamazepine-d10 asves were prepared in C. carpio extracts.
Accuracy and precision were calculated from five repeatedinjections of a spiked sample at 25 ng/g in the same day. Accuracywas defined as the deviation of the measured mean concentra-tion from the spiked concentration, expressed in percentage, asdescribed by Bogialli et al. [60]. Precision was expressed as therelative standard deviation of the measured concentration. Bothvalues were lower than 20% for the three matrices considered(Table 5). Calibration curves were generated using linear regres-sion analysis (r2 > 0.98) in the concentration range from 0.1 to50 ng/g.
3.4. Application to environmental samples
The developed method was applied for the determinationof pharmaceuticals in fish from four Mediterranean rivers andone reservoir, including fish homogenates, muscle and liver tis-sues. Nine compounds (carazolol, carbamazepine, citalopram,clopidogrel, diclofenac, propanolol, salbutamol, and venlafaxine)from five therapeutic families were determined at concentrationshigher than MDLs (Table 6). Pharmaceutical levels were lowerthan 10 ng/g in fish homogenates, which is consistent with pub-
were found in trout liver, where the concentration of carba-mazepine was 18 ng/g. Most ubiquitous and recurring compoundwas diclofenac, detected in 9% of the total number of sam-ples.
B. Huerta et al. / J. Chromatogr. A 1288 (2013) 63– 72 71
Table 4Method detection and quantification limits (MDL, MQL) in fish homogenate, liver and muscle tissues (ng/g, dry weight).
MDL (ng/g) MQL (ng/g)
Homogenate Liver Muscle Homogenate Liver Muscle
Atenolol 0.05 0.12 0.10 0.17 0.41 0.32Carazolol 0.04 0.09 0.03 0.15 0.31 0.10Carbamazepine 0.04 0.08 0.01 0.13 0.25 0.04Citalopram 0.12 0.09 0.05 0.41 0.29 0.16Clopidrogel 0.04 0.26 0.08 0.13 0.87 0.26Codeine 0.06 0.13 0.06 0.18 0.43 0.20Diazepam 0.08 0.12 0.08 0.25 0.41 0.25Diclofenac 0.50 0.65 0.19 1.66 2.16 0.62Epoxycarbamazepine 0.09 0.19 0.11 0.30 0.62 0.38Hydrochlorothiazide 0.05 0.11 0.17 0.17 0.35 0.57Hydroxycarbamazepine 0.03 0.25 0.08 0.09 0.83 0.26Levamisol 0.04 0.29 0.02 0.13 0.97 0.08Lorazepam 0.49 0.77 0.42 1.62 2.58 1.42Metropolol 0.20 0.36 0.18 0.67 1.19 0.60Nadolol 0.03 0.13 0.09 0.10 0.42 0.30Propanolol 0.09 0.36 0.18 0.29 1.21 0.60Sertraline 0.32 0.98 0.18 1.08 3.28 0.61Sotalol 0.26 0.20 0.07 0.88 0.66 0.24Venlafaxine 0.04 0.40 0.16 0.15 1.33 0.55Salbutamol 0.07 0.24 0.11 0.25 0.78 0.38
Table 5Accuracya and precisionb data of selected pharmaceuticals in fish homogenate, liver and muscle (spiking level 25 ppb).
Homogenate Liver Muscle
Accuracy (%) RSD (%) Accuracy (%) RSD (%) Accuracy (%) RSD (%)
Atenolol −0.1 2.1 −1.6 14 −1.6 6.6Carazolol 11 7.3 −12 4.4 −10.9 17Carbamazepine −14 4.0 −17 13 −18 5.9Citalopram 7.1 1.1 −19 14 6.2 1.1Clopidrogel −2.5 14. 0.1 12 0.3 9.2Codeine −17 15 −0.7 3.9 −17 15Diazepam 2.3 6.7 −0.4 13 −19 8.6Diclofenac 0.9 2.7 1.3 18 −20 1410,11-epoxyCBZ −5.9 2.0 0.3 4.5 −20 12Hydrochlorothiazide −4.2 12 −0.1 20 −6.9 122-HydroxyCBZ −18.9 4.9 −0.1 5.4 −17 9.1Levamisol 14 3.8 0.2 16 −5.9 6.1Lorazepam 16 21 8.2 13 4.1 20Metropolol 0.0 6.3 −0.1 9.7 −9.1 11Nadolol 1.4 6.4 0.1 7.1 1.0 13Propanolol −11 21 0.0 6.9 −0.1 17Salbutamol −1.5 3.9 0.0 16 0.1 11Sertraline 2.9 6.9 3.4 11 −2.6 10Sotalol −15 2.9 −19 7.7 −14 7.2Venlafaxine 13 7.5 −15 10 −11 20
a Calculate as [(mean calculated concentration − spiked concentration)/spiked concentration] ×100.b Expressed as relative standard deviation (RSD (%)).
Table 6Concentration of pharmaceuticals (ng/g, dry weight) in fish homogenates and tissues from fish collected in Mediterranean rivers (Spain).
Therapeutic family Compound Species Matrix Meanconcentration(ng/g) (n = 3)
Standarddeviation
Detectionfrequency (%)
Anti-inflamatory Diclofenac Barbus graellsii Homogenate 8.8 ±0.5 9Micropterus salmoides Homogenate 4.1 ±0.9
Psychiatric drug Citalopram Cyprinus carpio Homogenate 0.8 ±0.1 3.5Carbamazepine Salmo trutta Liver 17.9 ±2.4 –Venlafaxine Cyprinus carpio Homogenate 0.6 ±0.02 2
Antiplatelet agent�-blockers
Clopidogrel Cyprinus carpio Homogenate <MLQ 2Carazolol Silurus glanis Homogenate 3.8 ±0.7 3.5
Anguilla anguilla Homogenate <MLQPropanolol Silurus glanis Homogenate 4.2 ±1.0 3.5Sotalol Pseudochondrostoma
willkommiiHomogenate <MLQ 2
To treat asthma Salbutamol Silurus glanis Homogenate 2.6 ±0.3 2
7 atog
4
bmnoootsufitrcslvrsdr
A
aI[EaT(S
A
fc
R
[
[
[
[
[
[
[[
[
[
[
[[[[[
[
[[
[[
[
[
[
[[
[
[[
[
[
[[
[
[[
[
[
[[
[
[[[[
[
[
[
2 B. Huerta et al. / J. Chrom
. Conclusions
The multi-residue analytical method described in this paper,ased on pressurized liquid extraction, gel permeation chro-atography purification and UPLC–MS/MS analysis, provides the
ecessary sensitivity for the simultaneous trace-level detectionf 20 multi-class pharmaceuticals. Recoveries obtained for mostf the target compounds were higher than 50%. The applicationf UPLC–MS/MS operated in the MRM mode, with two transi-ions monitored for each compound, provided good sensitivity,electivity and confirmation of positive findings. A thorough eval-ation of the matrix effects was performed and lipid content insh species and tissues was considered to select the best approacho compensate observed matrix effects and to provide an accu-ate determination of pharmaceutical compounds. Internal samplealibrations in an appropriate matrix were selected as the besttrategy in this type of sample. The method presented detectionimits in the low ng/g range for the several fish species, thus pro-iding a sensitive, reliable and robust tool that can be used foroutine analysis of multi-class pharmaceuticals in different fish tis-ues. Anti-inflammatories, psychiatric drugs and �-blockers wereetected in fish samples from the most polluted sites of Mediter-anean rivers.
cknowledgements
This study has been co-financed by Spanish Ministry of Economynd Competitiveness through the project SCARCE (Consolider-ngenio 2010 CSD2009-00065), the EU Project ECSafeSEAFOODFP7-KBBE 311820] and by the European Union through theuropean Regional Development Fund (FEDEr). Prof. Barcelócknowledges King Saud University for his visiting professorship.his work was partly supported by the Generalitat de CatalunyaConsolidated Research Group: Water and Soil Quality Unit 2009-GR-965).
ppendix A. Supplementary data
Supplementary data associated with this article can beound, in the online version, at http://dx.doi.org/10.1016/j.hroma.2013.03.001.
eferences
[1] European Commision, Proposal for a Directive of the European Parliament andof the Council amending Directives 2000/60/EC and 2008/105/EC as regardspriority substances in the field of water policy, in 2011/0429 (COD), Brussels,2012.
[2] S. Rodriguez-Mozaz, H.S. Weinberg, Environ. Health Perspect. 118 (2010) 1016.[3] U. Schröder, A. Machetzki, Eur. Food Res. Technol. 225 (2007) 627.[4] R.B. Bringolf, R.M. Heltsley, T.J. Newton, C.B. Eads, S.J. Fraley, D. Shea, W.G. Cope,
Environ. Toxicol. Chem. 29 (2010) 1311.[5] A.J. Ramirez, M.A. Mottaleb, B.W. Brooks, C.K. Chambliss, Anal. Chem. 79 (2007)
3155.[6] J. Beyer, G. Jonsson, C. Porte, M.M. Krahn, F. Ariese, Environ. Toxicol. Pharmacol.
30 (2010) 224.[7] S.D. Ramachandran, M.J. Sweezey, P.V. Hodson, M. Boudreau, S.C. Courtenay, K.
Lee, T. King, J.A. Dixon, Mar. Pollut. Bull. 52 (2006) 1182.[8] C.A.O. Ribeiro, Y. Vollaire, A. Sanchez-Chardi, H. Roche, Aquat. Toxicol. 74 (2005)
53.[9] M.S. Shailaja, R. Rajamanickam, S. Wahidulla, Environ. Pollut. 143 (2006) 174.10] F. Verweij, K. Booij, K. Satumalay, N. van der Molen, R. van der Oost, Chemo-
sphere 54 (2004) 1675.
11] EU council directive 2008/105/EC on environmental quality standards in thefield of water policy, Official Journal of European Union (2008) 84.12] U.S. Environmental Protection Agency, Drinking Water Contaminant Candi-
date List CCL 3 (2010), http://www.epa.gov/safewater/ccl/ccl3.html (accessed12.11.12).
[[
[
r. A 1288 (2013) 63– 72
13] C.E. Cowan-Ellsberry, S.D. Dyer, S. Erhardt, M.J. Bernhard, A.L. Roe, M.E. Dowty,A.V. Weisbrod, Chemosphere 70 (2008) 1804.
14] C.G. Daughton, B.W. Brooks, in: W. Nelson Beyer, J.P. Meador (Eds.), Environ-mental Contaminants in Biota: Interpreting Tissue Concentrations, CRC Press,Boca Raton, 2011, p. 286.
15] R. van der Oost, J. Beyer, N.P.E. Vermeulen, Environ. Toxicol. Pharmacol. 13(2003) 57.
16] R. Pei, S.-C. Kim, K.H. Carlson, A. Pruden, Water Res. 40 (2006) 2427.17] M. Farré, L. Kantiani, M. Petrovic, S. Pérez, D. Barceló, J. Chromatogr. A 1259
(2012) 86.18] M. Petrovic, M.D. Hernando, M.S. Díaz-Cruz, D. Barceló, J. Chromatogr. A 1067
(2005) 1.19] A. Kot-Wasik, J. Debska, J. Namiesnik, TrAC Trends Anal. Chem. 26 (2007)
557.20] D. Fatta, A. Nikolaou, A. Achilleos, S. Meric , TrAC, Trends Anal. Chem. 26 (2007)
515.21] M.D. Celiz, J. Tso, D.S. Aga, Environ. Toxicol. Chem. 28 (2009) 2473.22] C. Hao, X. Zhao, P. Yang, TrAC Trends Anal. Chem. 26 (2007) 569.23] S.D. Richardson, T.A. Ternes, Anal. Chem. 83 (2011) 4614.24] W.W. Buchberger, J. Chromatogr. A 1218 (2011) 603.25] B. Huerta, S. Rodríguez-Mozaz, D. Barcelò, Anal. Bioanal. Chem. 404 (2012)
2611.26] B.W. Brooks, C.K. Chambliss, J.K. Stanley, A. Ramirez, K.E. Banks, R.D. Johnson,
R.J. Lewis, Environ. Toxicol. Chem. 24 (2005) 464.27] S. Chu, C.D. Metcalfe, J. Chromatogr. A 1163 (2007) 112.28] M.M. Schultz, E.T. Furlong, D.W. Kolpin, S.L. Werner, H.L. Schoenfuss, L.B. Barber,
V.S. Blazer, D.O. Norris, A.M. Vajda, Environ. Sci. Technol. 44 (2010) 1918.29] J. Wang, P. Gardinali, Anal. Bioanal. Chem. 404 (2012) 2711.30] A.M. Al-Ansari, A. Saleem, L.E. Kimpe, V.L. Trudeau, J.M. Blais, J. Chromatogr. B
879 (2011) 3649.31] C. Cháfer-Pericás, Á. Maquieira, R. Puchades, B. Company, J. Miralles, A. Moreno,
Aquacult. Res. 41 (2010) e217.32] R. Fernandez-Torres, M.A. Bello Lopez, M.O. Consentino, M.C. Mochón, Anal.
Lett. 44 (2011) 2357.33] D.M. Pavlovic, S. Babic, A.J.M. Horvat, M. Kastelan-Macan, TrAC, Trends Anal.
Chem. 26 (2007) 1062.34] A. Kirbis, J. Marinsek, V.C. Flajs, Biomed. Chromatogr. 19 (2005) 259.35] C. Vannini, G. Domingo, M. Marsoni, F. De Mattia, M. Labra, S. Castiglioni, M.
Bracale, Aquat. Toxicol. 101 (2011) 459.36] E.B. Dussault, V.K. Balakrishnan, U. Borgmann, K.R. Solomon, P.K. Sibley, Eco-
toxicol. Environ. Saf. 72 (2009) 1635.37] H. Berrada, F. Borrull, G. Font, R.M. Marcè, J. Chromatogr. A 1208 (2008) 83.38] G.C. Nallani, P.M. Paulos, L.A. Constantine, B.J. Venables, D.B. Huggett, Chemo-
sphere 84 (2011) 1371.39] R. Cueva-Mestanza, M.E. Torres-Padrón, Z. Sosa-Ferrera, J.J. Santana-Rodríguez,
Biomed. Chromatogr. 22 (2008) 1115.40] B. Subedi, M.A. Mottaleb, C.K. Chambliss, S. Usenko, J. Chromatogr. A 1218
(2011) 6278.41] M. Gros, M. Petrovic, D. Barceló, Anal. Chem. 81 (2009) 898.42] V. Osorio, R. Marcé, S. Pérez, A. Ginebreda, J.L. Cortina, D. Barceló, Sci. Total
Environ. 440 (2012) 3.43] M. Meredith-Williams, L.J. Carter, R. Fussell, D. Raffaelli, R. Ashauer, A.B.A. Box-
all, Environ. Pollut. 165 (2012) 250.44] A.C. Mehinto, E.M. Hill, C.R. Tyler, Environ. Sci. Technol. 44 (2010) 2176.45] A. Lajeunesse, C. Gagnon, F. Gagne, S. Louis, P. Cejka, S. Sauve, Chemosphere 83
(2011) 564.46] T.W. Valenti Jr., G.G. Gould, J.P. Berninger, K.A. Connors, N.B. Keele, K.N. Prosser,
B.W. Brooks, Environ. Sci. Technol. 46 (2012) 2427.47] A. Spiric, D. Trbovic, D. Vranic, J. Djinovic, R. Petronijevic, V. Matekalo-Sverak,
Anal. Chim. Acta 672 (2010) 66.48] M. Lund, L. Duedahl-Olesen, J.H. Christensen, Talanta 79 (2009) 10.49] J. Hong, H.-Y. Kim, D.-G. Kim, J. Seo, K.-J. Kim, J. Chromatogr. A 1038 (2004)
27.50] R. Draisci, C. Marchiafava, L. Palleschi, P. Cammarata, S. Cavalli, J. Chromatogr.
B: Biomed. Sci. Appl. 753 (2001) 217.51] M. Gros, S. Rodríguez-Mozaz, D. Barceló, J. Chromatogr. A 1248 (2012) 104.52] A. Wilkowska, M. Biziuk, Food Chem. 125 (2011) 803.53] L. Zhao, J. Stevens, Application note, Agilent Technologies, 2010.54] V. Matamoros, D. Calderón-Preciado, C. Domínguez, J.M. Bayona, Anal. Chim.
Acta 722 (2012) 8.55] A.J. Ramirez, R.A. Brain, S. Usenko, M.A. Mottaleb, J.G. O‘Donnell, L.L. Stahl, J.B.
Wathen, B.D. Snyder, J.L. Pitt, P. Perez-Hurtado, L.L. Dobbins, B.W. Brooks, C.K.Chambliss, Environl Toxicol. Chem. 28 (2009) 2587.
56] E.B. Dussault, V.K. Balakrishnan, K.R. Solomon, P.K. Sibley, Can. J. Chem. 87(2009).
57] R.K. Boyd, Rapid Commun. Mass Spectrosc. 7 (1993) 257.
58] M. Stüber, T. Reemtsma, Anal. Bioanal. Chem. 378 (2004) 910.59] J. Schwaiger, H. Ferling, U. Mallow, H. Wintermayr, R.D. Negele, Aquat. Toxicol.68 (2004) 141.60] S. Bogialli, R. Curini, A. Di Corcia, M. Nazzari, R. Samperi, Anal. Chem. 75 (2003)
1798.