journal of alloys and compounds - snuengineering.snu.ac.kr/pdf/2017/2017_hss_investigation of the...
TRANSCRIPT

lable at ScienceDirect
Journal of Alloys and Compounds 723 (2017) 146e156
Contents lists avai
Journal of Alloys and Compounds
journal homepage: http: / /www.elsevier .com/locate/ ja lcom
Investigation of the aging behavior and orientation relationships inFee31.4Mne11.4Ale0.89C low-density steel
Keunho Lee a, Seong-Jun Park b, *, Jun-Yun Kang b, Siwook Park a, Sang Sub Han a,Jun Young Park b, Kyu Hwan Oh a, Sukbin Lee c, Anthony D. Rollett d, Heung Nam Han a, **
a Department of Materials Science and Engineering and Research Institute of Advanced Materials, Seoul National University, Seoul, 08826, Republic of Koreab Ferrous Alloy Department, Korea Institute of Materials Science, 797 Changwondaero, Changwon, 51508, Republic of Koreac School of Materials Science and Engineering, Ulsan National Institute of Science and Technology (UNIST), Ulsan, 44919, Republic of Koread Department of Materials Science and Engineering, Carnegie Mellon University, Pittsburgh, PA 15213, USA
a r t i c l e i n f o
Article history:Received 17 January 2017Received in revised form5 May 2017Accepted 22 June 2017Available online 24 June 2017
Keywords:Low-density steelAgingBeta-manganeseOrientation relationshipEBSD
* Corresponding author.** Corresponding author.
E-mail addresses: [email protected] (S.-J. Park), hn
http://dx.doi.org/10.1016/j.jallcom.2017.06.2500925-8388/© 2017 Elsevier B.V. All rights reserved.
a b s t r a c t
The aging behavior and orientation relationships in Fee31.4Mne11.4Ale0.89C low-density steel wereinvestigated with respect to constituent phases and precipitates, including g-austenite matrix, b-Mn, anda-precipitate. After aging treatment at 550 �C for various periods of time, the microstructural changesand corresponding mechanical response were characterized by Vickers hardness measurement com-bined with EBSD and TEM observations. The precipitation sequence during the aging treatment showedthat nano-sized k-carbides firstly precipitated within the g-austenite matrix at the incipient stage ofaging, and induced the primary age hardening. After aging for 300 min, the lath-type b-Mn phase wasformed, leading to the dramatic secondary hardening response. The a-precipitates with partial D03 orderwere subsequently produced at the b-Mn interior, grain/phase boundary region, and the g-austeniteinterior after further aging over 10,000 min. The misorientation-angle distribution, RodrigueseFrankvector space, and orientation relationship stereogram (OR stereogram) from EBSD measurements wereemployed for analyzing g-matrix/b-Mn and b-Mn/a-precipitate interphase boundaries, respectively. TheOR stereograms showed that the preferred orientation relationships were represented asð111Þg==ð221Þb�Mn , ð011Þg==ð012Þb�Mn , ð211Þg==ð542Þb�Mn for g-matrix/b-Mn interface, and
ð012Þb�Mn==ð001Þa, ð021Þb�Mn==ð010Þa , ð100Þb�Mn==ð100Þa for b-Mn/a-precipitate interface, respec-tively. The orientation relationships obtained from the OR stereograms were clarified by checking thedeviation angle distributions of interface segments from the ideal orientation relationships, as well as theTEM diffraction patterns at the interface boundaries. In addition, the misorientation distribution betweeng-matrix and a-precipitate was examined and compared to conventional fcc/bcc orientationrelationships.
© 2017 Elsevier B.V. All rights reserved.
1. Introduction
There are known several crystallographic orientation relation-ships among constituent phases in steels during phase trans-formation and precipitation due to thermomechanical processes.Many crystallographic studies on the transformation of steels,where face-centered-cubic (fcc) austenite grains transform tobody-centered-cubic (bcc) ferrite, bainite, or martensite phases,
[email protected] (H.N. Han).
have been reported with respect to the KurdjumoveSachs (KS) orNishiyamaeWassermann (NW) relationship [1e6]. In high carbonsteels, the Pitsch orientation relationship between cementite pre-cipitate and austenite matrix [7] and the Bagaryatski orientationrelationship between cementite precipitate and ferrite matrix [8]were observed at low transformation temperatures. Dyson et al.[9] reported the orientation relationship between molybdenumcarbide (Mo2C) precipitate and ferrite matrix, as well as the growthdirection of the Mo2C in tempered molybdenum steels usingtransmission electron microscopy. Since these orientation re-lationships take a crucial part in the microtexture analysis andmorphology prediction of the product phases, the study on suchcrystallographic relationships is necessary to design the

K. Lee et al. / Journal of Alloys and Compounds 723 (2017) 146e156 147
microstructure with optimum mechanical properties of advancedhigh-strength steels.
Recently, low-density steels with outstanding strength andductility have been developed in which aluminum or silicon isalloyed as a substitutional light element [10e24]. Among those,austenite-based high-Mn steels containing manganese over15 wt.% and aluminum up to 12 wt.% have attracted increasingattention due to excellent mechanical properties and densityreduction rates [15e24]. After aging treatment at appropriatetemperature and time, these steels feature micro/nano-scale pre-cipitates, such as k-carbide [15e19], b-Mn [18,19,21e23], and or-dered bcc phases (B2 or D03) [19,20,25] inside austenite matrix orferrite grains. Because these precipitates have a strong impact onthe mechanical behavior of the low-density steels, many studieshave been performed in order to investigate their precipitationphenomena and its correlationwith themechanical properties. Theb-Mn phase which has a simple-cubic-based A13 structure can befound in several Fe-based alloy systems containing Mn contentsnormally exceeding 15 wt.% (Fe-Mn, Fe-Mn-Al, Fe-Mn-Al-Cr sys-tems) [19,26,27]. The intrinsic mechanical property of the b-Mn isquite hard, as the nano-hardness was measured as more than12 GPa in a previous study [18]. However, the b-Mn phase is knownto cause severe ductility loss and brittle fracture in the high-Mnlow-density steels, leading to decrease of impact energy [19,21].On the formation of the b-Mn during aging treatment of austenite-based high-Mn low-density steels containing 11.4 wt.% Al, K. Leeet al. [18] showed that the lath-shaped b-Mn phase were nucleatedand extensively grew into austenite matrix, by using X-raydiffractometry and electron backscatter diffraction (EBSD). Also bya TEM study on the aged ferrite-based high-Mn low-density steels,b-Mn grains were formed inside a-ferrite, having a specific crys-tallographic orientation relationship with a-ferrite matrix [27].However, it was not reported whether the b-Mn phases have apreferred orientation relationship with the austenite matrix in thehigh-Mn low-density steels, or not.
In many previous studies where the orientation relationshipsbetween two phases were examined, diffraction patterns at inter-face boundaries from TEM observations were used. Although theTEM analysis offers a closer look on the region of interest at atomic/nano-scale, it lacks statistical verification due to the significantlimit of observation area. Meanwhile, as EBSD technique has beenimproved on both hardware and software systems for nearly twodecades, it is now much more reliable in quantitative measure-ments of local orientations, large numbers of interfaces, andmicrostructural evolution [28]. With local orientation informationfrom EBSD measurements, local interface orientation relationshipsbetween two phases can be analyzed using the orientation rela-tionship stereogram (OR stereogram) [29]. The OR stereogram be-tween two phases is constructed by plotting simultaneouslyselected low index poles on a stereographic projection using theorientation information across the interfaces between two phases.Then, one can examine the preferred orientation relationship be-tween two phases by analyzing the overlapping set of poles.
In the present research, we investigate the aging behavior andorientation relationships among constitutional phases and pre-cipitates in high Mn low-density steel containing 11.4 wt.% Al. Themicrostructure evolution and mechanical response during agingtreatment are characterized by Vickers hardness measurementcombined with microstructural observations from EBSD and TEM.The misorientation-angle distribution, RodrigueseFrank vectorspace, and OR stereogram are used to elucidate the orientationrelationships across g-matrix/b-Mn and b-Mn/a-precipitate inter-phase boundaries. The orientation relationships obtained from theOR stereogram analysis are verified by checking the distribution ofdeviation angle from the predicted ideal orientation relationships,
as well as the TEM diffraction patterns at the interface boundaries.In addition, from both orientation relationships for g-matrix/b-Mnand b-Mn/a-precipitate interfaces, the misorientation distributionbetween g-matrix and a-precipitate is examined and compared toconventional fcc/bcc orientation relationships.
2. Materials and methods
2.1. Specimen preparation
An alloy with a chemical composition ofFee31.4Mne11.4Ale0.89C (wt.%) was fabricated in a vacuum in-duction furnace. The ingot was soaked at 1200 �C for 2 h and hot-rolled to a thickness of 8 mm (~90% reduction), with a final roll-ing temperature higher than 900 �C. The hot-rolled plate was thencooled to room temperature by water spraying. After hot rollingand cooling, the plate was solution-treated at 1050 �C for 2 h andquenched in water. The test specimens obtained from the solution-treated plate were aged at 550 �C for various periods of time (300,1,000, 10,000 and the maximum aging time of 100,000 min). Fromnow on, the specimen solution-treated at 1050 �C before aging isreferred to as ST, and the specimens aged at 550 �C for 1000 min,10,000 min, 30,000 min, and 100,000 min are referred to as A1K,A10K, A30K, and A100K, respectively.
2.2. Microstructure observation and misorientation distribution ofthe interphase boundaries
For each specimen, Vickers microhardness was measured on atleast 7 points using a 1 kgf load applied for 10 s. Longitudinal plane(i.e, the plane containing rolling and normal directions) of eachspecimen was prepared for EBSD and energy dispersive X-rayspectroscopy (EDS) measurements by mechanical grinding, fol-lowed by electropolishing using a solution of 20% perchloric acid,10% ethylene glycol monobutyl ether, and 70% ethanol.
Segmentation, smoothing and extraction of the interphaseboundaries from the cleaned EBSD maps were accomplished using2D boundary segmentation code based on both the marchingsquare algorithm and the feature preserving smoothing algorithm,which was originally developed to analyze the heterophase inter-face character of Cu-Nb multilayer composites [5]. In the marchingsquare algorithm, four neighboring vertices in a pixel can form asingle marching square among 16 possible different combinations.The individual nodes of the interfaces were identified based on themarching square algorithm, and then the feature preservingsmoothing method was applied to approximate the interfaces assmooth lines while maintaining local curvature [5]. From theapproximated boundary geometry together with neighboringphase and orientation data, the misorientation-angle distribution,and RodrigueseFrank vector space [30,31] were calculated for g-matrix/b-Mn, b-Mn/a-precipitate, and g-matrix/a-precipitateinterphase boundaries, respectively. To investigate the local inter-face orientation relationships of g-matrix/b-Mn and b-Mn/a-pre-cipitate boundaries, the OR stereogram was constructed for twophases by plotting low index poles such as 100, 110, 111, 112, 012and 122 families on a stereographic projection. We selected fivepairs of two points, which are adjacent across the interphaseboundary, having strong peaks in the misorientation-angle distri-bution and RodrigueseFrank vector space.
TEM characterizations were carried out to analyze the orderingof matrix phase and orientation relationships in the A30K spec-imen. In particular, in order to confirm the orientation relationshipsobtained from the OR stereogram practice, the FIB milling wasconducted on the g-matrix/b-Mn and b-Mn/a-precipitate phaseboundary regions to be examined under TEM.

Fig. 1. The equilibrium phase fractions as a function of temperature ofFee30Mne12Ale0.9C alloy, calculated with CALPHAD method.
K. Lee et al. / Journal of Alloys and Compounds 723 (2017) 146e156148
2.3. Calculation of the deviation angle from the ideal orientationrelationship
In order to verify statistically the orientation relationships ob-tained from the OR stereograms, the distributions of deviationangle from the ideal orientation relationship were calculated fromthe interface segmentation data. The deviation angle is calculatedas follows. The orientation matrices of the parent and daughterphases (gp and gd, respectively) across the interface segments aredetermined from the Euler angles. Given gp and gd, the measuredmisorientation matrix (Mmeas) between the parent and daughterphases is calculated as
Mmeas ¼ gd$g�1p (1)
Likewise, the ideal misorientation matrix (Mideal) is definedbased on theoretical orientation relationship obtained from the ORstereograms. Then, the deviation matrix (D) between the ideal andmeasured misorientation matrix is derived as:
Di;j ¼ Mideal$Oi$M�1meas$Oj (2)
Here, Oi and Oj are the symmetry operator for cubic crystals,which is taken from the set of 24 elements (i, j ¼ 1,…, 24). Thedeviation angle for each deviation matrix is calculated, and thesmallest is chosen as the deviation angle from the ideal orientationrelationships.
q ¼ min
(cos�1
"S�Di;j
�� 12
#)(3)
SðDÞ ¼ D11 þ D22 þ D33 (4)
Then, the distributions of deviation angle were computed fromthe segmentation data of the interphase boundaries.
In addition, the distributions of deviation angle for randomlyoriented pairs were calculated for comparison with the measuredinterface segments. The randomly oriented pairs were generated bypartitioning the Euler space of misorientation matrix into a finitenumber of elements of equal volume, based on following equation[32,33]:
dg ¼ 18p2 sin Fdf1dFdf2 (5)
where dg is the misorientation elements in the Euler space, 18p2 is
the normalization factor, and sin F is an invariant measure whichremains the volume of each element unchanged after an arbitrarytransformation. Considering the symmetry of cubic structure, themisorientation parameters represented by the Euler angles rangefrom zero to 90� for 41, F, and 42, respectively. With a resolution of2�, 91,125 random pairs were obtained for calculation.
3. Results and discussion
3.1. Microstructural evolution and aging behavior
To identify equilibrium phases of the investigated alloy as afunction of temperature, the equilibrium phase fractions werecalculated using phase diagram (CALPHAD) method [34]. Thethermodynamic database for high Mn-high Al steels based onFeeMneAleC quaternary systemwas used for calculation [35]. Thecomposition range of the database is 0e40 wt.% Mn, 0 to 10 wt.% Al,and 0 to 1 wt.% C. Fig. 1 shows the volume fractions of equilibriumphases in Fee30Mne12Ale0.9C alloy. The alloy presents two-phase
region consisting of austenite and ferrite at 1200 �C. As the tem-perature goes down from about 1050 �C, the fraction of austenitedecreases abruptly, while the amount of ferrite increases rapidlyand k-carbide starts to precipitate. At 800 �C, the b-Mn phase be-gins to precipitate and its fraction increases monotonically up toabout 46.5% at 500 �C, while ferrite phase starts to disappear. Sincethe solution-treated plate at 1050 �C was directly quenched intowater and then the aging treatment was conducted at 550 �C, it isestimated from the equilibrium phase diagram that k-carbide andb-Mn are formed directly from the solution-treated state duringaging process.
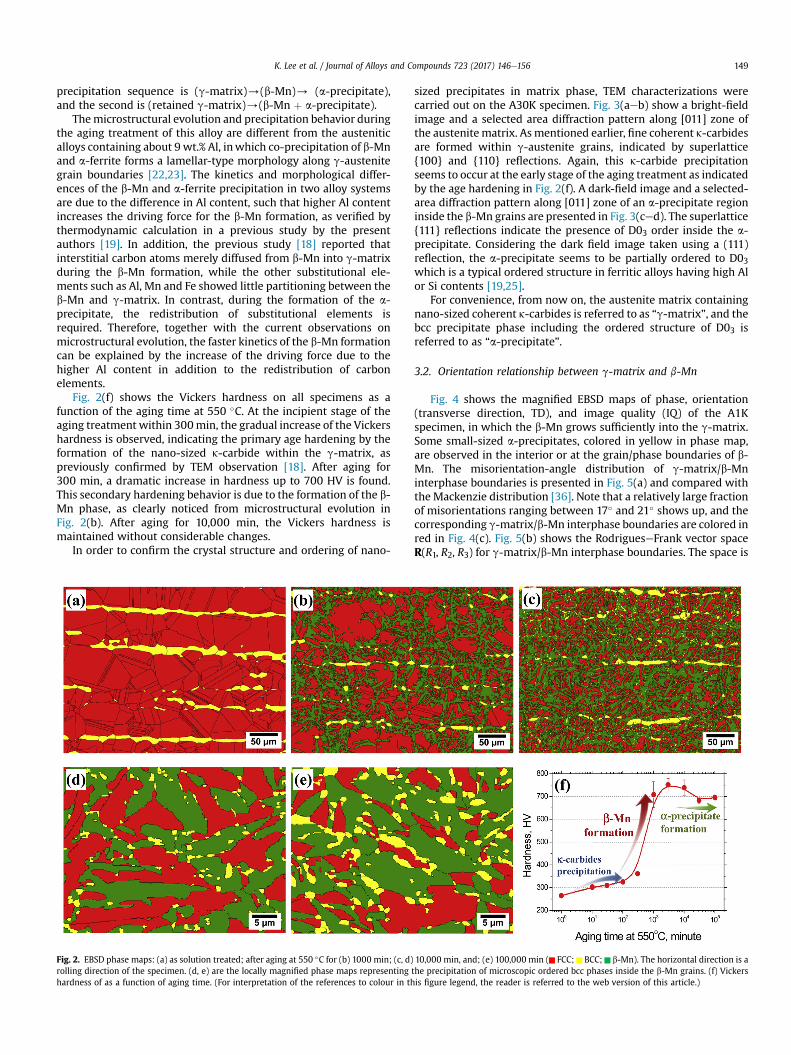
EBSD phase maps of the ST, A1K, A10K, and A100K specimensare shown in Fig. 2(aee), respectively. The ST specimen consists of ag-austenite matrix with some a-ferrite grains elongated along therolling direction. The phase fraction of these a-ferrite bands is10.0%, measured from EBSD. The amount of the a-ferrite bandsfrom the EBSD measurement is much lower than the calculatedfraction (~42.8%) at around 1050 �C in Fig. 1. The discrepancy of thephase fraction might originate from the nominal Al contents(11.4 wt.%) which is slightly out of the composition range of thedatabase. To investigate the influence of segregation, EDS analysison the ST specimenwas carried out with respect to g-austenite anda-ferrite phases. It is confirmed that the g-austenite has higher Mncontent than the a-ferrite, while Al and Fe are concentrated in thea-ferrite phase. In contrast to the significant difference of the Mncontent between the phases, the Mn content shows negligiblevariation in the g-austenite phase.
The b-Mn phase, colored in green in Fig. 2(bee), has grownextensively into the g-matrix with a lath- or plate-typemorphologyafter aging for 1000 min. The g-austenite region adjacent to the a-ferrite decomposes much faster in the b-Mn rather than the g-austenite interior, as shown in Fig. 2(b). It can be attributed tonumerous nucleation sites such as g/a phase boundary and g-austenite grain boundary near the g/a phase boundary region. Afterb-Mnphase forms, a newmicroscopic bcc phasewas precipitated atthe b-Mn interior, grain/phase boundary region, and the g-austenite interior by further aging treatment, as shown in themagnified EBSD phase maps in Fig. 2(d and e). These small-sizedprecipitates are considered to be the ordered bcc phase (B2 orD03) due to high Al content in the investigated alloy [19,20,25].Considering the nucleation sites of the a-precipitate, two mecha-nisms of the a-precipitate formation are possible: one of the
K. Lee et al. / Journal of Alloys and Compounds 723 (2017) 146e156 149
precipitation sequence is (g-matrix)/(b-Mn)/ (a-precipitate),and the second is (retained g-matrix)/(b-Mn þ a-precipitate).
Themicrostructural evolution and precipitation behavior duringthe aging treatment of this alloy are different from the austeniticalloys containing about 9 wt.% Al, inwhich co-precipitation of b-Mnand a-ferrite forms a lamellar-type morphology along g-austenitegrain boundaries [22,23]. The kinetics and morphological differ-ences of the b-Mn and a-ferrite precipitation in two alloy systemsare due to the difference in Al content, such that higher Al contentincreases the driving force for the b-Mn formation, as verified bythermodynamic calculation in a previous study by the presentauthors [19]. In addition, the previous study [18] reported thatinterstitial carbon atoms merely diffused from b-Mn into g-matrixduring the b-Mn formation, while the other substitutional ele-ments such as Al, Mn and Fe showed little partitioning between theb-Mn and g-matrix. In contrast, during the formation of the a-precipitate, the redistribution of substitutional elements isrequired. Therefore, together with the current observations onmicrostructural evolution, the faster kinetics of the b-Mn formationcan be explained by the increase of the driving force due to thehigher Al content in addition to the redistribution of carbonelements.
Fig. 2(f) shows the Vickers hardness on all specimens as afunction of the aging time at 550 �C. At the incipient stage of theaging treatment within 300min, the gradual increase of the Vickershardness is observed, indicating the primary age hardening by theformation of the nano-sized k-carbide within the g-matrix, aspreviously confirmed by TEM observation [18]. After aging for300 min, a dramatic increase in hardness up to 700 HV is found.This secondary hardening behavior is due to the formation of the b-Mn phase, as clearly noticed from microstructural evolution inFig. 2(b). After aging for 10,000 min, the Vickers hardness ismaintained without considerable changes.
In order to confirm the crystal structure and ordering of nano-
Fig. 2. EBSD phase maps: (a) as solution treated; after aging at 550 �C for (b) 1000 min; (c, d)rolling direction of the specimen. (d, e) are the locally magnified phase maps representinghardness of as a function of aging time. (For interpretation of the references to colour in th
sized precipitates in matrix phase, TEM characterizations werecarried out on the A30K specimen. Fig. 3(aeb) show a bright-fieldimage and a selected area diffraction pattern along [011] zone ofthe austenitematrix. Asmentioned earlier, fine coherent k-carbidesare formed within g-austenite grains, indicated by superlattice{100} and {110} reflections. Again, this k-carbide precipitationseems to occur at the early stage of the aging treatment as indicatedby the age hardening in Fig. 2(f). A dark-field image and a selected-area diffraction pattern along [011] zone of an a-precipitate regioninside the b-Mn grains are presented in Fig. 3(ced). The superlattice{111} reflections indicate the presence of D03 order inside the a-precipitate. Considering the dark field image taken using a (111)reflection, the a-precipitate seems to be partially ordered to D03which is a typical ordered structure in ferritic alloys having high Alor Si contents [19,25].
For convenience, from now on, the austenite matrix containingnano-sized coherent k-carbides is referred to as “g-matrix”, and thebcc precipitate phase including the ordered structure of D03 isreferred to as “a-precipitate”.
3.2. Orientation relationship between g-matrix and b-Mn
Fig. 4 shows the magnified EBSD maps of phase, orientation(transverse direction, TD), and image quality (IQ) of the A1Kspecimen, in which the b-Mn grows sufficiently into the g-matrix.Some small-sized a-precipitates, colored in yellow in phase map,are observed in the interior or at the grain/phase boundaries of b-Mn. The misorientation-angle distribution of g-matrix/b-Mninterphase boundaries is presented in Fig. 5(a) and compared withthe Mackenzie distribution [36]. Note that a relatively large fractionof misorientations ranging between 17� and 21� shows up, and thecorresponding g-matrix/b-Mn interphase boundaries are colored inred in Fig. 4(c). Fig. 5(b) shows the RodrigueseFrank vector spaceR(R1, R2, R3) for g-matrix/b-Mn interphase boundaries. The space is
10,000 min, and; (e) 100,000 min ( FCC; BCC; b-Mn). The horizontal direction is athe precipitation of microscopic ordered bcc phases inside the b-Mn grains. (f) Vickersis figure legend, the reader is referred to the web version of this article.)

Fig. 3. TEM micrographs and diffraction patterns after aging at 550 �C for 30,000 min. (a) Bright-field image and (b) selected area diffraction pattern showing [011] zone of the g-austenite and k-carbide. (c) A dark-field image taken using a (111) reflection and (d) a selected area diffraction pattern showing [011] zone of the a-precipitate including D03 order.
Fig. 4. Microstructure after aging at 550 �C for 1000 min: (a) EBSD phase map ( FCC; BCC; b-Mn), (b) Orientation (TD) map, (c) IQ map highlighting misorientation angles forg-matrix/b-Mn interphase boundaries in the range 17� < red < 21�, which corresponds to the dominant orientation relationship (see next figure). The horizontal direction is anormal direction of the specimen. (For interpretation of the references to colour in this figure legend, the reader is referred to the web version of this article.)
K. Lee et al. / Journal of Alloys and Compounds 723 (2017) 146e156150
represented as a series of R1 � R2 sections at different R3 (from thebottom “section an at R3 ¼ 0.000” to the top “section g atR3 ¼ 0.315”) of two different phases having cubic crystal structures[31]. It is found that the g-matrix/b-Mn interphase boundaries have
strong peaks at around R ¼ (0.157, 0.033, 0.033) and R ¼ (0.033,0.157, 0.033), as indicated by white arrows in Fig. 5(b). These areequivalent to the strong peaks found in the misorientation-angledistribution, signifying that a stable preferred orientation
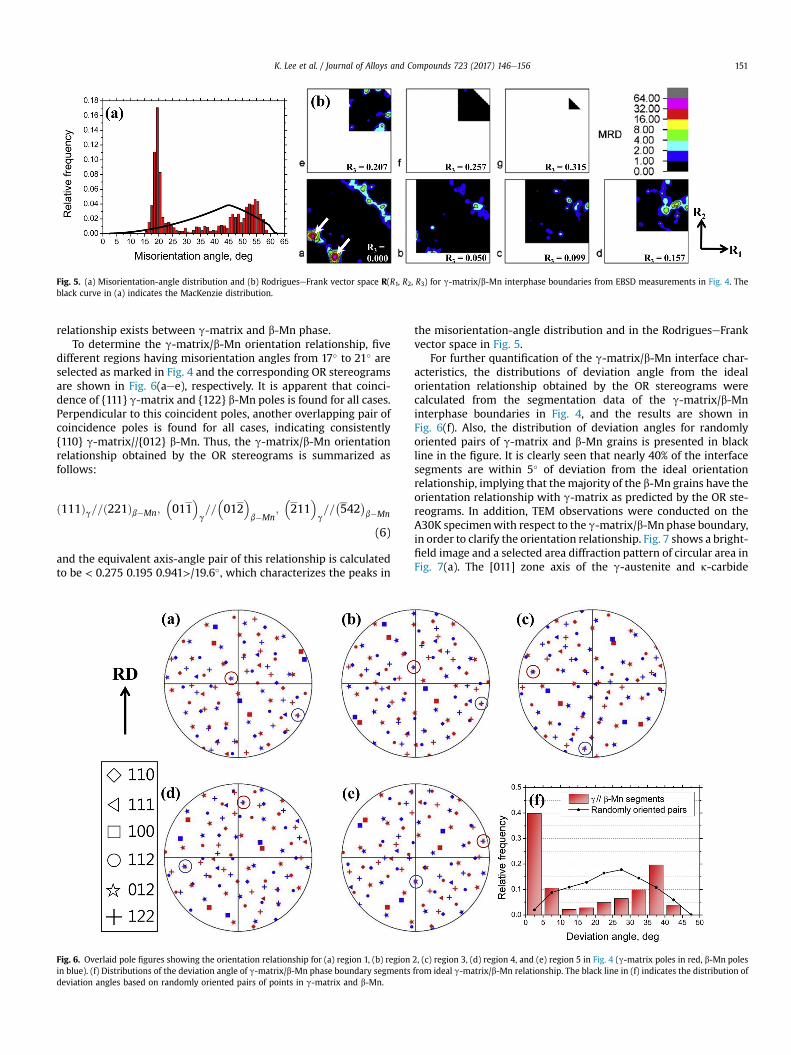
Fig. 5. (a) Misorientation-angle distribution and (b) RodrigueseFrank vector space R(R1, R2, R3) for g-matrix/b-Mn interphase boundaries from EBSD measurements in Fig. 4. Theblack curve in (a) indicates the MacKenzie distribution.
K. Lee et al. / Journal of Alloys and Compounds 723 (2017) 146e156 151
relationship exists between g-matrix and b-Mn phase.To determine the g-matrix/b-Mn orientation relationship, five
different regions having misorientation angles from 17� to 21� areselected as marked in Fig. 4 and the corresponding OR stereogramsare shown in Fig. 6(aee), respectively. It is apparent that coinci-dence of {111} g-matrix and {122} b-Mn poles is found for all cases.Perpendicular to this coincident poles, another overlapping pair ofcoincidence poles is found for all cases, indicating consistently{110} g-matrix//{012} b-Mn. Thus, the g-matrix/b-Mn orientationrelationship obtained by the OR stereograms is summarized asfollows:
ð111Þg==ð221Þb�Mn;�011
�g==
�012
�b�Mn
;�211
�g==
�542
�b�Mn
(6)
and the equivalent axis-angle pair of this relationship is calculatedto be < 0.275 0.195 0.941>/19.6�, which characterizes the peaks in
Fig. 6. Overlaid pole figures showing the orientation relationship for (a) region 1, (b) regionin blue). (f) Distributions of the deviation angle of g-matrix/b-Mn phase boundary segmentsdeviation angles based on randomly oriented pairs of points in g-matrix and b-Mn.
the misorientation-angle distribution and in the RodrigueseFrankvector space in Fig. 5.
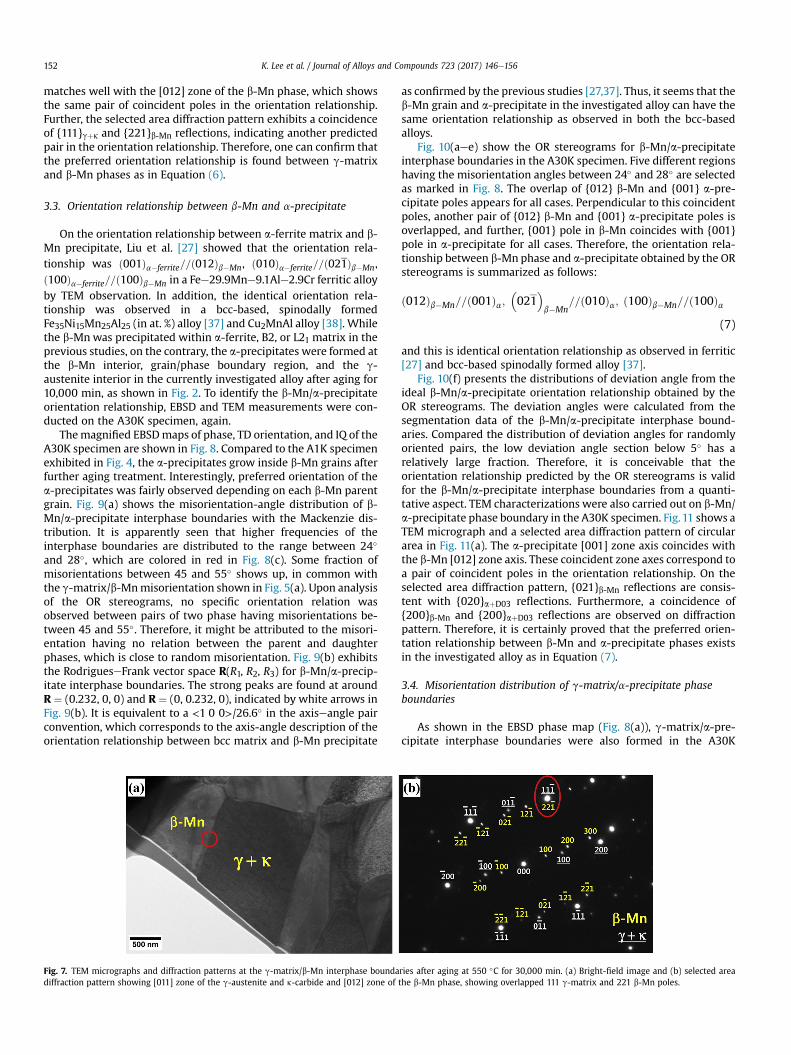
For further quantification of the g-matrix/b-Mn interface char-acteristics, the distributions of deviation angle from the idealorientation relationship obtained by the OR stereograms werecalculated from the segmentation data of the g-matrix/b-Mninterphase boundaries in Fig. 4, and the results are shown inFig. 6(f). Also, the distribution of deviation angles for randomlyoriented pairs of g-matrix and b-Mn grains is presented in blackline in the figure. It is clearly seen that nearly 40% of the interfacesegments are within 5� of deviation from the ideal orientationrelationship, implying that themajority of the b-Mn grains have theorientation relationship with g-matrix as predicted by the OR ste-reograms. In addition, TEM observations were conducted on theA30K specimenwith respect to the g-matrix/b-Mnphase boundary,in order to clarify the orientation relationship. Fig. 7 shows a bright-field image and a selected area diffraction pattern of circular area inFig. 7(a). The [011] zone axis of the g-austenite and k-carbide
2, (c) region 3, (d) region 4, and (e) region 5 in Fig. 4 (g-matrix poles in red, b-Mn polesfrom ideal g-matrix/b-Mn relationship. The black line in (f) indicates the distribution of
K. Lee et al. / Journal of Alloys and Compounds 723 (2017) 146e156152
matches well with the [012] zone of the b-Mn phase, which showsthe same pair of coincident poles in the orientation relationship.Further, the selected area diffraction pattern exhibits a coincidenceof {111}gþk and {221}b-Mn reflections, indicating another predictedpair in the orientation relationship. Therefore, one can confirm thatthe preferred orientation relationship is found between g-matrixand b-Mn phases as in Equation (6).
3.3. Orientation relationship between b-Mn and a-precipitate
On the orientation relationship between a-ferrite matrix and b-Mn precipitate, Liu et al. [27] showed that the orientation rela-tionship was ð001Þa�ferrite==ð012Þb�Mn, ð010Þa�ferrite==ð021Þb�Mn,ð100Þa�ferrite==ð100Þb�Mn in a Fee29.9Mne9.1Ale2.9Cr ferritic alloyby TEM observation. In addition, the identical orientation rela-tionship was observed in a bcc-based, spinodally formedFe35Ni15Mn25Al25 (in at. %) alloy [37] and Cu2MnAl alloy [38]. Whilethe b-Mn was precipitated within a-ferrite, B2, or L21 matrix in theprevious studies, on the contrary, the a-precipitates were formed atthe b-Mn interior, grain/phase boundary region, and the g-austenite interior in the currently investigated alloy after aging for10,000 min, as shown in Fig. 2. To identify the b-Mn/a-precipitateorientation relationship, EBSD and TEM measurements were con-ducted on the A30K specimen, again.
Themagnified EBSDmaps of phase, TD orientation, and IQ of theA30K specimen are shown in Fig. 8. Compared to the A1K specimenexhibited in Fig. 4, the a-precipitates grow inside b-Mn grains afterfurther aging treatment. Interestingly, preferred orientation of thea-precipitates was fairly observed depending on each b-Mn parentgrain. Fig. 9(a) shows the misorientation-angle distribution of b-Mn/a-precipitate interphase boundaries with the Mackenzie dis-tribution. It is apparently seen that higher frequencies of theinterphase boundaries are distributed to the range between 24�
and 28�, which are colored in red in Fig. 8(c). Some fraction ofmisorientations between 45 and 55� shows up, in common withthe g-matrix/b-Mnmisorientation shown in Fig. 5(a). Upon analysisof the OR stereograms, no specific orientation relation wasobserved between pairs of two phase having misorientations be-tween 45 and 55�. Therefore, it might be attributed to the misori-entation having no relation between the parent and daughterphases, which is close to random misorientation. Fig. 9(b) exhibitsthe RodrigueseFrank vector space R(R1, R2, R3) for b-Mn/a-precip-itate interphase boundaries. The strong peaks are found at aroundR ¼ (0.232, 0, 0) and R ¼ (0, 0.232, 0), indicated by white arrows inFig. 9(b). It is equivalent to a <1 0 0>/26.6� in the axiseangle pairconvention, which corresponds to the axis-angle description of theorientation relationship between bcc matrix and b-Mn precipitate
Fig. 7. TEM micrographs and diffraction patterns at the g-matrix/b-Mn interphase boundadiffraction pattern showing [011] zone of the g-austenite and k-carbide and [012] zone of
as confirmed by the previous studies [27,37]. Thus, it seems that theb-Mn grain and a-precipitate in the investigated alloy can have thesame orientation relationship as observed in both the bcc-basedalloys.
Fig. 10(aee) show the OR stereograms for b-Mn/a-precipitateinterphase boundaries in the A30K specimen. Five different regionshaving the misorientation angles between 24� and 28� are selectedas marked in Fig. 8. The overlap of {012} b-Mn and {001} a-pre-cipitate poles appears for all cases. Perpendicular to this coincidentpoles, another pair of {012} b-Mn and {001} a-precipitate poles isoverlapped, and further, {001} pole in b-Mn coincides with {001}pole in a-precipitate for all cases. Therefore, the orientation rela-tionship between b-Mn phase and a-precipitate obtained by the ORstereograms is summarized as follows:
ð012Þb�Mn==ð001Þa;�021
�b�Mn
==ð010Þa; ð100Þb�Mn==ð100Þa(7)
and this is identical orientation relationship as observed in ferritic[27] and bcc-based spinodally formed alloy [37].
Fig. 10(f) presents the distributions of deviation angle from theideal b-Mn/a-precipitate orientation relationship obtained by theOR stereograms. The deviation angles were calculated from thesegmentation data of the b-Mn/a-precipitate interphase bound-aries. Compared the distribution of deviation angles for randomlyoriented pairs, the low deviation angle section below 5� has arelatively large fraction. Therefore, it is conceivable that theorientation relationship predicted by the OR stereograms is validfor the b-Mn/a-precipitate interphase boundaries from a quanti-tative aspect. TEM characterizations were also carried out on b-Mn/a-precipitate phase boundary in the A30K specimen. Fig.11 shows aTEM micrograph and a selected area diffraction pattern of circulararea in Fig. 11(a). The a-precipitate [001] zone axis coincides withthe b-Mn [012] zone axis. These coincident zone axes correspond toa pair of coincident poles in the orientation relationship. On theselected area diffraction pattern, {021}b-Mn reflections are consis-tent with {020}aþD03 reflections. Furthermore, a coincidence of{200}b-Mn and {200}aþD03 reflections are observed on diffractionpattern. Therefore, it is certainly proved that the preferred orien-tation relationship between b-Mn and a-precipitate phases existsin the investigated alloy as in Equation (7).
3.4. Misorientation distribution of g-matrix/a-precipitate phaseboundaries
As shown in the EBSD phase map (Fig. 8(a)), g-matrix/a-pre-cipitate interphase boundaries were also formed in the A30K
ries after aging at 550 �C for 30,000 min. (a) Bright-field image and (b) selected areathe b-Mn phase, showing overlapped 111 g-matrix and 221 b-Mn poles.
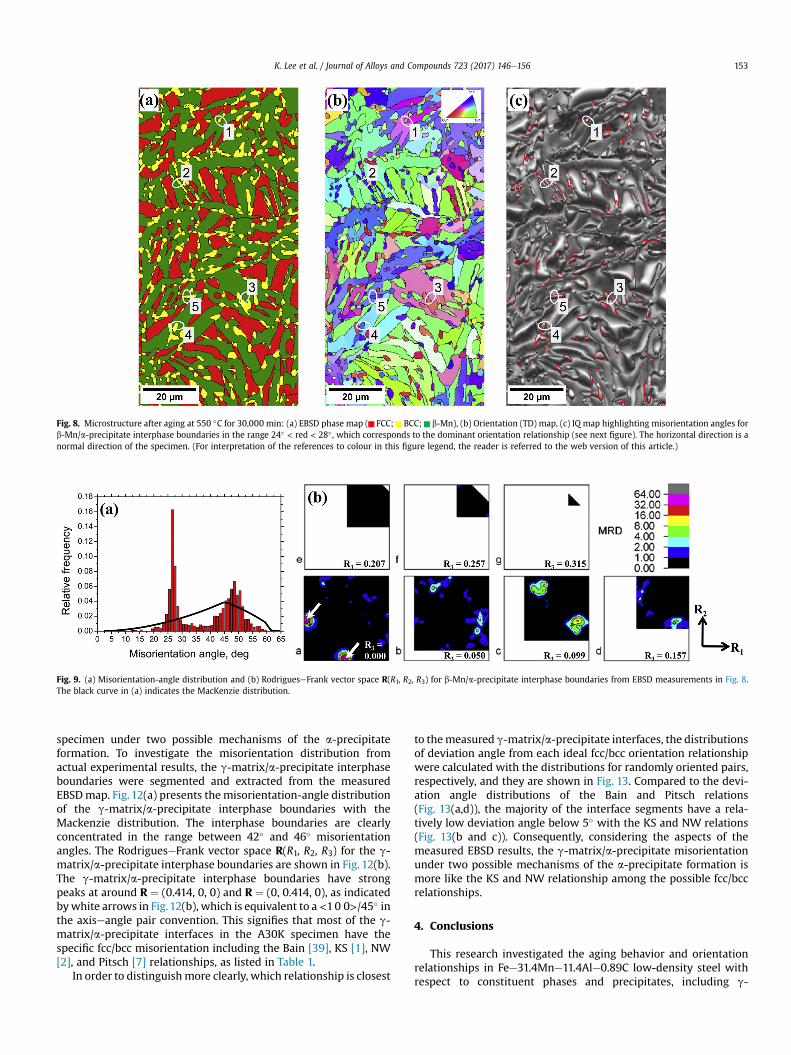
Fig. 8. Microstructure after aging at 550 �C for 30,000 min: (a) EBSD phase map ( FCC; BCC; b-Mn), (b) Orientation (TD) map, (c) IQ map highlighting misorientation angles forb-Mn/a-precipitate interphase boundaries in the range 24� < red < 28� , which corresponds to the dominant orientation relationship (see next figure). The horizontal direction is anormal direction of the specimen. (For interpretation of the references to colour in this figure legend, the reader is referred to the web version of this article.)
Fig. 9. (a) Misorientation-angle distribution and (b) RodrigueseFrank vector space R(R1, R2, R3) for b-Mn/a-precipitate interphase boundaries from EBSD measurements in Fig. 8.The black curve in (a) indicates the MacKenzie distribution.
K. Lee et al. / Journal of Alloys and Compounds 723 (2017) 146e156 153
specimen under two possible mechanisms of the a-precipitateformation. To investigate the misorientation distribution fromactual experimental results, the g-matrix/a-precipitate interphaseboundaries were segmented and extracted from the measuredEBSDmap. Fig. 12(a) presents the misorientation-angle distributionof the g-matrix/a-precipitate interphase boundaries with theMackenzie distribution. The interphase boundaries are clearlyconcentrated in the range between 42� and 46� misorientationangles. The RodrigueseFrank vector space R(R1, R2, R3) for the g-matrix/a-precipitate interphase boundaries are shown in Fig. 12(b).The g-matrix/a-precipitate interphase boundaries have strongpeaks at around R ¼ (0.414, 0, 0) and R ¼ (0, 0.414, 0), as indicatedbywhite arrows in Fig.12(b), which is equivalent to a<10 0>/45� inthe axiseangle pair convention. This signifies that most of the g-matrix/a-precipitate interfaces in the A30K specimen have thespecific fcc/bcc misorientation including the Bain [39], KS [1], NW[2], and Pitsch [7] relationships, as listed in Table 1.
In order to distinguishmore clearly, which relationship is closest
to themeasured g-matrix/a-precipitate interfaces, the distributionsof deviation angle from each ideal fcc/bcc orientation relationshipwere calculated with the distributions for randomly oriented pairs,respectively, and they are shown in Fig. 13. Compared to the devi-ation angle distributions of the Bain and Pitsch relations(Fig. 13(a,d)), the majority of the interface segments have a rela-tively low deviation angle below 5� with the KS and NW relations(Fig. 13(b and c)). Consequently, considering the aspects of themeasured EBSD results, the g-matrix/a-precipitate misorientationunder two possible mechanisms of the a-precipitate formation ismore like the KS and NW relationship among the possible fcc/bccrelationships.
4. Conclusions
This research investigated the aging behavior and orientationrelationships in Fee31.4Mne11.4Ale0.89C low-density steel withrespect to constituent phases and precipitates, including g-
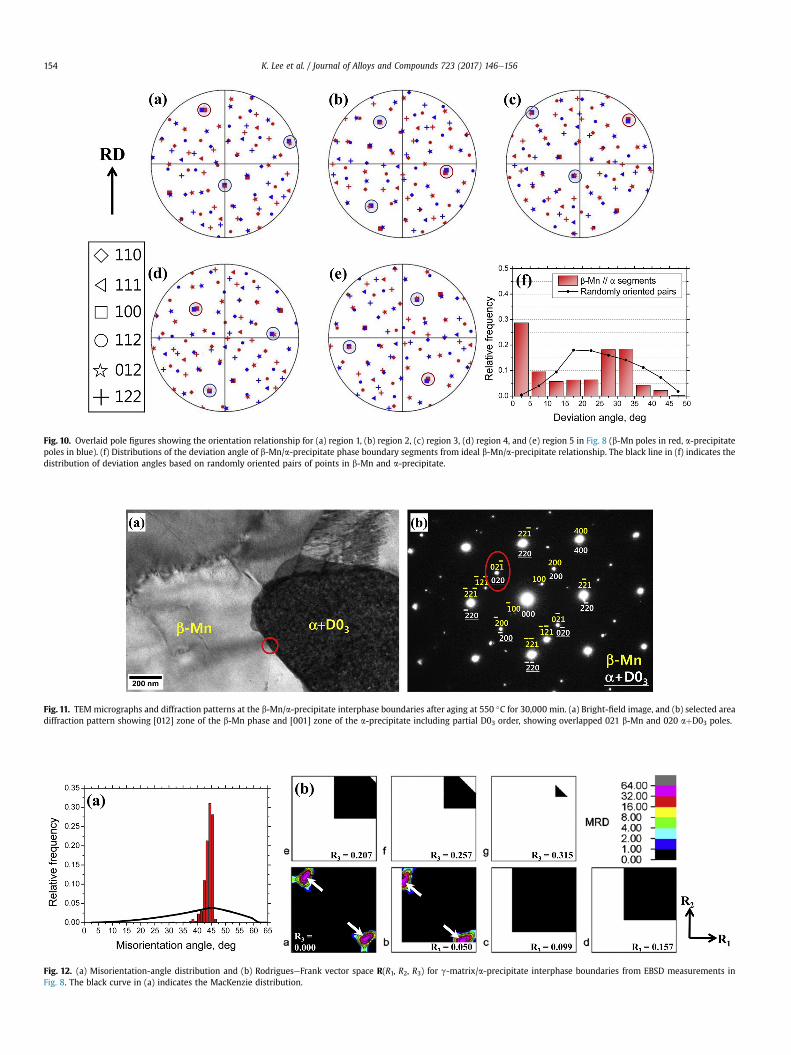
Fig. 10. Overlaid pole figures showing the orientation relationship for (a) region 1, (b) region 2, (c) region 3, (d) region 4, and (e) region 5 in Fig. 8 (b-Mn poles in red, a-precipitatepoles in blue). (f) Distributions of the deviation angle of b-Mn/a-precipitate phase boundary segments from ideal b-Mn/a-precipitate relationship. The black line in (f) indicates thedistribution of deviation angles based on randomly oriented pairs of points in b-Mn and a-precipitate.
Fig. 11. TEM micrographs and diffraction patterns at the b-Mn/a-precipitate interphase boundaries after aging at 550 �C for 30,000 min. (a) Bright-field image, and (b) selected areadiffraction pattern showing [012] zone of the b-Mn phase and [001] zone of the a-precipitate including partial D03 order, showing overlapped 021 b-Mn and 020 aþD03 poles.
Fig. 12. (a) Misorientation-angle distribution and (b) RodrigueseFrank vector space R(R1, R2, R3) for g-matrix/a-precipitate interphase boundaries from EBSD measurements inFig. 8. The black curve in (a) indicates the MacKenzie distribution.
K. Lee et al. / Journal of Alloys and Compounds 723 (2017) 146e156154
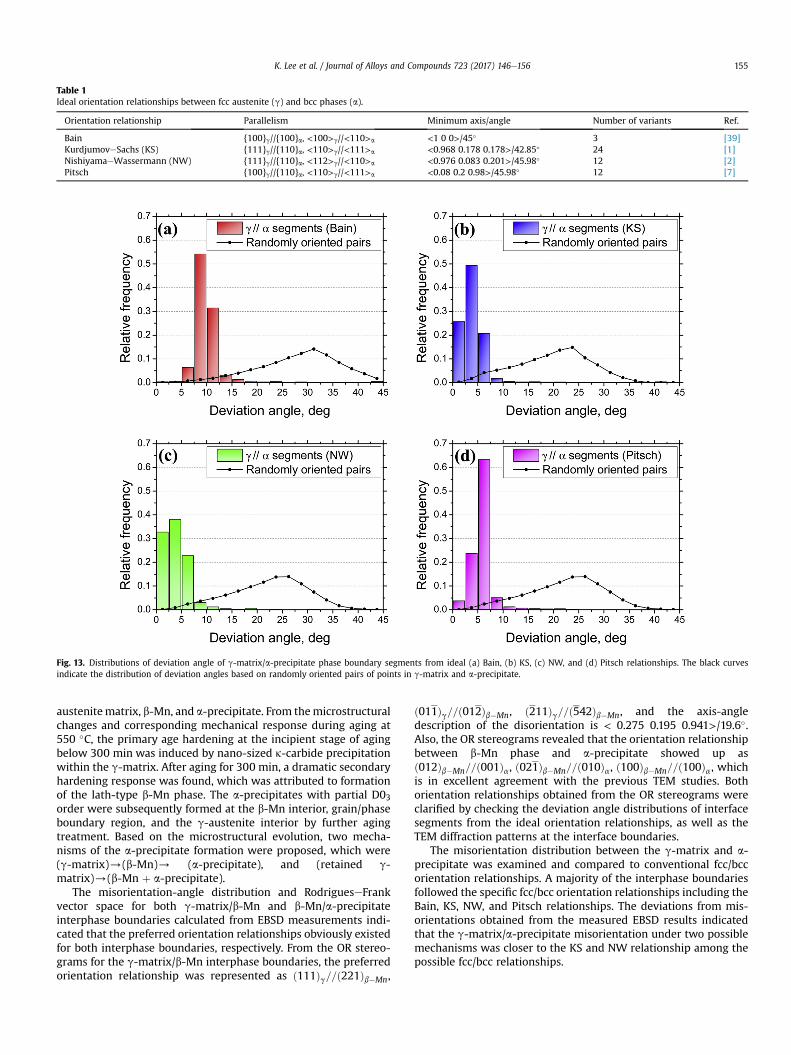
Table 1Ideal orientation relationships between fcc austenite (g) and bcc phases (a).
Orientation relationship Parallelism Minimum axis/angle Number of variants Ref.
Bain {100}g//{100}a, <100>g//<110>a <1 0 0>/45� 3 [39]KurdjumoveSachs (KS) {111}g//{110}a, <110>g//<111>a <0.968 0.178 0.178>/42.85� 24 [1]NishiyamaeWassermann (NW) {111}g//{110}a, <112>g//<110>a <0.976 0.083 0.201>/45.98� 12 [2]Pitsch {100}g//{110}a, <110>g//<111>a <0.08 0.2 0.98>/45.98� 12 [7]
Fig. 13. Distributions of deviation angle of g-matrix/a-precipitate phase boundary segments from ideal (a) Bain, (b) KS, (c) NW, and (d) Pitsch relationships. The black curvesindicate the distribution of deviation angles based on randomly oriented pairs of points in g-matrix and a-precipitate.
K. Lee et al. / Journal of Alloys and Compounds 723 (2017) 146e156 155
austenitematrix, b-Mn, and a-precipitate. From themicrostructuralchanges and corresponding mechanical response during aging at550 �C, the primary age hardening at the incipient stage of agingbelow 300 min was induced by nano-sized k-carbide precipitationwithin the g-matrix. After aging for 300 min, a dramatic secondaryhardening response was found, which was attributed to formationof the lath-type b-Mn phase. The a-precipitates with partial D03order were subsequently formed at the b-Mn interior, grain/phaseboundary region, and the g-austenite interior by further agingtreatment. Based on the microstructural evolution, two mecha-nisms of the a-precipitate formation were proposed, which were(g-matrix)/(b-Mn)/ (a-precipitate), and (retained g-matrix)/(b-Mn þ a-precipitate).
The misorientation-angle distribution and RodrigueseFrankvector space for both g-matrix/b-Mn and b-Mn/a-precipitateinterphase boundaries calculated from EBSD measurements indi-cated that the preferred orientation relationships obviously existedfor both interphase boundaries, respectively. From the OR stereo-grams for the g-matrix/b-Mn interphase boundaries, the preferredorientation relationship was represented as ð111Þg==ð221Þb�Mn,
ð011Þg==ð012Þb�Mn, ð211Þg==ð542Þb�Mn, and the axis-angledescription of the disorientation is < 0.275 0.195 0.941>/19.6�.Also, the OR stereograms revealed that the orientation relationshipbetween b-Mn phase and a-precipitate showed up asð012Þb�Mn==ð001Þa, ð021Þb�Mn==ð010Þa, ð100Þb�Mn==ð100Þa, whichis in excellent agreement with the previous TEM studies. Bothorientation relationships obtained from the OR stereograms wereclarified by checking the deviation angle distributions of interfacesegments from the ideal orientation relationships, as well as theTEM diffraction patterns at the interface boundaries.
The misorientation distribution between the g-matrix and a-precipitate was examined and compared to conventional fcc/bccorientation relationships. A majority of the interphase boundariesfollowed the specific fcc/bcc orientation relationships including theBain, KS, NW, and Pitsch relationships. The deviations from mis-orientations obtained from the measured EBSD results indicatedthat the g-matrix/a-precipitate misorientation under two possiblemechanisms was closer to the KS and NW relationship among thepossible fcc/bcc relationships.

K. Lee et al. / Journal of Alloys and Compounds 723 (2017) 146e156156
Acknowledgements
This work was supported by the Materials & ComponentsTechnology Development Program (10048157) funded by theMinistry of Trade, industry & Energy (MOTIE, Korea), and the En-gineering Research Center (ERC) program the National ResearchFoundation of Korea funded by the Ministry of Education, Scienceand Technology (2015R1A5A1037627). ADR acknowledges supportfrom the DMREF program of the National Science Foundation undergrant number DMR-1435544. The present authors thank to Prof.Gregory S. Rohrer, Prof. Paul Wynblatt, and Dr. Vahid Tari at CMU,USA, Prof. Youn-Bae Kang at GIFT, POSTECH, Republic of Korea forvaluable conversations on the orientation relationships and CAL-PHAD analysis.
References
[1] G. Kurdjumow, G. Sachs, About the mechanism of hardening steel, Z. Phys. 64(1930) 325e343.
[2] Z. Nishiyama, X-ray investigation of the mechanism of the transformationfrom face centered cubic lattice to body centered cubic, Sci. Rep. Inst., 23(1934/1935) 638.
[3] H.N. Han, C.G. Lee, C.S. Oh, T.H. Lee, S.J. Kim, A model for deformation behaviorand mechanically induced martensitic transformation of metastable austeniticsteel, Acta Mater. 52 (2004) 5203e5214.
[4] K. Verbeken, L. Barbe, D. Raabe, Evaluation of the crystallographic orientationrelationships between fcc and bcc phases in TRIP steels, ISIJ Int. 49 (2009)1601e1609.
[5] S.B. Lee, J.E. LeDonne, S.C.V. Lim, I.J. Beyerlein, A.D. Rollett, The heterophaseinterface character distribution of physical vapor-deposited and accumulativeroll-bonded Cu-Nb multilayer composites, Acta Mater. 60 (2012) 1747e1761.
[6] V. Tari, A.D. Rollett, H. Beladi, Back calculation of parent austenite orientationusing a clustering approach, J. Appl. Crystallogr. 46 (2013) 210e215.
[7] W. Pitsch, Der orientierungszusammenhang zwischen zementit und austenit,Acta Metall. 10 (1962) 897.
[8] H.K.D.H. Bhadeshia, R.W.K. Honeycombe, Steels: Microstructure and Proper-ties, third ed., Elsevier, Butterworth-Heinemann, Amsterdam and Boston,2006.
[9] D.J. Dyson, S.R. Keown, D. Raynor, J.A. Whiteman, Orientation relationship andgrowth direction of Mo2c in ferrite, Acta Metall. 14 (1966) 867.
[10] A. Zargaran, H.S. Kim, J.H. Kwak, N.J. Kim, Effect of C Content on the micro-structure and tensile properties of lightweight ferritic Fe-8Al-5Mn-0.1Nballoy, Met. Mater. Int. 21 (2015) 79e84.
[11] S.J. Park, B. Hwang, K.H. Lee, T.H. Lee, D.W. Suh, H.N. Han, Microstructure andtensile behavior of duplex low-density steel containing 5 mass% aluminum,Scr. Mater. 68 (2013) 365e369.
[12] K. Lee, S.J. Park, Y.S. Choi, S.J. Kim, T.H. Lee, K.H. Oh, H.N. Han, Dual-scalecorrelation of mechanical behavior in duplex low-density steel, Scr. Mater. 69(2013) 618e621.
[13] R. Rana, C. Liu, R.K. Ray, Evolution of microstructure and mechanical prop-erties during thermomechanical processing of a low-density multiphase steelfor automotive application, Acta Mater. 75 (2014) 227e245.
[14] S. Lee, J. Jeong, Y.K. Lee, Precipitation and dissolution behavior of kappa-carbide during continuous heating in Fe-9.3Mn-5.6Al-0.16C lightweightsteel, J. Alloy. Compd. 648 (2015) 149e153.
[15] G. Frommeyer, U. Brux, Microstructures and mechanical properties of high-
strength Fe-Mn-Al-C light-weight TRIPLEX steels, Steel Res. Int. 77 (2006)627e633.
[16] R.A. Howell, D.C. Van Aken, A literature review of age hardening Fe-Mn-Al-Calloys, Iron Steel Technol. 6 (2009) 193e212.
[17] L. Bartlett, D. Van Aken, High manganese and aluminum steels for the militaryand transportation industry, JOM 66 (2014) 1770e1784.
[18] K. Lee, S.J. Park, J. Lee, J. Moon, J.Y. Kang, D.I. Kim, J.Y. Suh, H.N. Han, Effect ofaging treatment on microstructure and intrinsic mechanical behavior of Fe-31.4Mn-11.4Al-0.89C lightweight steel, J. Alloy. Compd. 656 (2016) 805e811.
[19] K. Lee, S.J. Park, J. Moon, J.Y. Kang, T.H. Lee, H.N. Han, beta-Mn formation andaging effect on the fracture behavior of high-Mn low-density steels, Scr.Mater. 124 (2016) 193e197.
[20] S.H. Kim, H. Kim, N.J. Kim, Brittle intermetallic compound makes ultrastronglow-density steel with large ductility, Nature 518 (2015) 77e79.
[21] S.C. Tjong, Electron-Microscope observations of phase decompositions in anaustenitic Fe-8.7al-29.7mn-1.04c alloy, Mater. Charact. 24 (1990) 275e292.
[22] K.H. Han, W.K. Choo, Phase-decomposition of rapidly solidified Fe-Mn-Al-Caustenitic alloys, Metall. Trans. A 20 (1989) 205e214.
[23] K. Sato, K. Tagawa, Y. Inoue, Modulated structure and magnetic-properties ofage-hardenable Fe-Mn-Al-C alloys, Metall. Trans. A 21 (1990) 5e11.
[24] A. Mohamadizadeh, A. Zarei-Hanzaki, H.R. Abedi, S. Mehtonen, D. Porter, Hotdeformation characterization of duplex low-density steel through 3D pro-cessing map development, Mater. Charact. 107 (2015) 293e301.
[25] D.G. Morris, S. Gunther, Order-disorder changes in Fe3Al based alloys and thedevelopment of an iron-base alpha-alpha' superalloy, Acta Mater. 44 (1996)2847e2859.
[26] I.S. Kalashnikov, O. Acselrad, A. Shalkevich, L.D. Chumakova, L.C. Pereira, Heattreatment and thermal stability of FeMnAlC alloys, J. Mater Process Tech. 136(2003) 72e79.
[27] T.F. Liu, C.C. Wu, The orientation relationship between A13 Beta-Mn andferrite, Scr. Metall. 23 (1989) 1243e1248.
[28] B.L. Adams, S.I. Wright, K. Kunze, Orientation imaging - the emergence of anew microscopy, Metall. Trans. A 24 (1993) 819e831.
[29] X. Liu, N.T. Nuhfer, A.D. Rollett, S. Sinha, S.B. Lee, J.S. Carpenter, J.E. LeDonne,A. Darbal, K. Barmak, Interfacial orientation and misorientation relationshipsin nanolamellar Cu/Nb composites using transmission-electron-microscope-based orientation and phase mapping, Acta Mater. 64 (2014) 333e344.
[30] F.C. Frank, Orientation mapping, Metall. Trans. A 19 (1988) 403e408.[31] A. Morawiec, Orientations and Rotations: Computations in Crystallographic
Textures, Springer, Berlin and New York, 2004.[32] H.J. Bunge, Texture Analysis in Materials Science: Mathematical Methods,
English, Butterworths, London; Boston, 1982.[33] G.S. Rohrer, V. Randle, Measurement of the five-parameter grain boundary
distribution from planar sections, in: A.J. Schwartz, M. Kumar, B.L. Adams,D.P. Field (Eds.), Electron Backscatter Diffraction in Materials Science, SpringerUS, Boston, MA, 2009, pp. 215e229.
[34] B. Sundman, B. Jansson, J.O. Andersson, The thermo-calc databank system,Calphad 9 (1985) 153e190.
[35] M.S. Kim, Y.B. Kang, Development of thermodynamic database for high Mn-high Al steels: phase equilibria in the Fe-Mn-Al-C system by experimentand thermodynamic modeling, Calphad 51 (2015) 89e103.
[36] J.K. Mackenzie, 2nd paper on statistics associated with the random disorien-tation of cubes, Biometrika 45 (1958) 229e240.
[37] I. Baker, R.K. Zheng, D.W. Saxey, S. Kuwano, M.W. Wittmann, J.A. Loudis,K.S. Prasad, Z.W. Liu, R. Marceau, P.R. Munroe, S.P. Ringer, Microstructuralevolution of spinodally formed Fe35Ni15Mn25Al25, Intermetallics 17 (2009)886e893.
[38] K.C. Chu, T.F. Liu, Orientation relationship between beta-Mn and L2(1) matrixin a Cu2MnAl alloy, Metall. Mater Trans. A 30 (1999) 1705e1716.
[39] E.C. Bain, The nature of martensite, Trans. Ame. Ins. Min. Met. Eng. 70 (1924)25e46.