journal of aerosol scienceaerosolsoftware.web.psi.ch/internet/publications/tröstl_2015... ·...
TRANSCRIPT
Contents lists available at ScienceDirect
Journal of Aerosol Science
Journal of Aerosol Science 87 (2015) 75–87
http://d0021-85
n CorrE-m
journal homepage: www.elsevier.com/locate/jaerosci
Fast and precise measurement in the sub-20 nm size rangeusing a Scanning Mobility Particle Sizer
Jasmin Tröstl a, Torsten Tritscher b, Oliver F. Bischof b, Hans-Georg Horn b,Thomas Krinke b, Urs Baltensperger a, Martin Gysel a,n
a Laboratory of Atmospheric Chemistry, Paul Scherrer Institute, Villigen, Switzerlandb TSI GmbH, Particle Instruments, Aachen, Germany
a r t i c l e i n f o
Article history:Received 1 December 2014Received in revised form31 March 2015Accepted 2 April 2015Available online 15 April 2015
Keywords:NanoparticlesFast scanningNano Scanning Mobility Particle Sizer(Nano-SMPS)Proteins
x.doi.org/10.1016/j.jaerosci.2015.04.00102/& 2015 Elsevier Ltd. All rights reserved.
espondence to: Paul Scherrer Institute, 5232ail address: [email protected] (M. Gysel).
a b s t r a c t
An increasing number of studies are focusing on the detection and investigation ofnanometer-sized particles. One important tool is the Scanning Mobility Particle Sizer(SMPS). In the case of dynamic processes like nucleation events, the lower detectionthreshold as well as the measurement time are important system parameters. Highaccuracy of the applied voltage as a function of time during fast scanning is required. Shortscan times additionally yield a broadening and smearing of the measured size distribu-tion. Here, the performance of the Nano-SMPS using the new TSI classifier (TSI 3082) incombination with either the nano water condensation particle counter (TSI 3788) or theultrafine condensation particle counter (TSI 3776) was investigated. The focus of this workis the performance of the system at the lower detection limit as a function of the scantime. Fast scan times as short as 3 s were tested. The reproducibility of the aerosol sizedistribution and number concentration for different distributions and materials wasinvestigated. The tested substances included different proteins, sucrose and polystyrenelatex reference particles. The sizing reproducibility and accuracy for all tested scan timeswas within 3%. The measured total number concentration was captured with a precisionof 73% for all tested scan times.
& 2015 Elsevier Ltd. All rights reserved.
1. Introduction
Atmospheric aerosols impact the global radiation balance and, therefore, play an important role in climate change(Stocker et al., 2013). They also cause adverse health effects (Hoet et al., 2004), particularly ultrafine particles (o100 nm)which can penetrate deeply within the lungs, and even cross the cell membrane to enter blood and lymph circulationsystems, eventually reaching sensitive areas such as heart and bone marrow (Peters et al., 1997). Atmospheric new particleformation events – so-called nucleation events – produce ultrafine particles which grow to Cloud Condensation Nuclei(CCN) and account for up to 45% of the global CCN in low level clouds (Merikanto et al., 2009). These important effects havestimulated an increasing number of studies that focus on the detection and properties of nanometer-sized particleschallenging available characterization methods and techniques to lower limits of detection, to the lowest particle size.Mobility particle size spectrometers are the most common instruments used to size airborne nanoparticles. They consist of aDifferential Mobility Analyzer (DMA) (Knutson & Whitby, 1975) which selects aerosol particles of a certain size according to
Villigen PSI, Switzerland. Tel.: þ41 56 310 4168.

J. Tröstl et al. / Journal of Aerosol Science 87 (2015) 75–8776
their electrical mobility; the selected particles are then measured by a Condensation Particle Counter (CPC) (Quant et al.,1992). Originally, different particle sizes were selected by stepping the voltage of the DMA, a process that took severalminutes.
The concept of scanning the voltage was first introduced by Wang & Flagan (1990). Since then, the scanning mobilityparticle sizing or SMPS technique has been established as the method of choice due to its rapid measurement principlewhich speeds up measurements without loss of accuracy and resolution. Nano Scanning Mobility Particle Sizers (Nano-SMPS) extend these measurements to the 3–50 nm size range (Nano-DMA design by Chen et al., 1998). In spite of theaccelerated measurement, the SMPS still has limitations for the measurement of rapidly varying number size distributions,e.g. fast growing nanoparticles during nucleation experiments. With single scans typically lasting 60 s or more, transientaerosol size distributions remain difficult to capture, limiting our ability to understand aerosol nucleation and early particlegrowth processes. Accurate size determination with a high size and time resolution and high counting efficiency with adetection limit down to a few nanometers is, therefore, crucial for field and laboratory experiments focusing on nucleationand growth (Kulmala et al., 2012; Riccobono et al., 2014). In addition, direct emission measurements from transient aerosolssuch as combustion processes and vehicles can benefit from improved time resolution (Zhu et al., 2002). Another potentialapplication is the characterization of engineered nanoparticles, which become more and more important in industry and theenvironment (Tiede et al., 2008).
Two experimental factors limit the speed with which size distributions can be measured: (1) the ability of the highvoltage power supply to accurately apply and rapidly scan the full voltage range; and (2) the response of the CPC detector.For long scan times, the latter effect is minor, but during fast scanning the number size distribution can be broadened andalso skewed compared to the true distribution (Russell et al., 1995). Thus, one approach would be to improve the inversionby accounting for the finite width and asymmetry of the CPC response function to correct for the smearing (Collins et al.,2002; Mamakos et al., 2008). However, the inversion of smeared data is limited by uncertainties in the kernel function andrandom noise in the measurement. Thus, an improvement of the CPC response function is preferred.
Several studies have tried to decrease the scan time of different measurement systems by improving the instrumentation.For instance, Shah & Cocker (2005) presented a fast-SMPS with scan times down to 2.5 s (scan range 5–98 nm). They used amixing-type state CPC (Wang et al., 2002) to optimize the CPC response time. However, fast scanning tests for the sub-20 nmrange (such as monodisperse particles or an intercomparison with a reference scan) were not shown. Alternatively severalinstruments with very high time resolution (a few seconds or less) are currently available, e.g. the Fast Integrated MobilitySpectrometer (FIMS) (Olfert et al., 2008) or the Engine Exhaust Particle Sizer (EEPS) (Johnson et al., 2004). These instrumentsalso classify the particles according to their electrical mobility. The FIMS uses a Charge-Coupled Device (CCD) camera to detectthe particles, however to allow for good counting statistics, not more than 10 size channels are recommended. For the EEPS,the particles are detected as electrical current using a number of electrometers that do detect particles in parallel in definedsize channels. Thus, it is possible to monitor several size channels simultaneously instead of scanning through a certaindiameter range. Due to the finite number of detectors, these instruments have a limited size resolution. Thus, combining lowerdetection limits, fast scanning, and high size resolution still remains difficult in the sub-20 nm size range.
In this work we show that fast and precise scanning is possible without the need to apply complex inversion algorithmsby combining recently developed state-of-the-art instrumentation. We characterize the new Nano Scanning MobilityParticle Sizer (Nano-SMPS, TSI 3938). The Nano-SMPS consists of a novel electrostatic classifier (EC, TSI model 3082)combined with a Nano-DMA (TSI model 3085A) using either the Nano Water-based Condensation Particle Counter(N-WCPC, TSI model 3788) or the butanol based Ultrafine Condensation Particle Counter (UCPC, TSI 3776). The N-WCPC hasa very short rise time (o100 ms) and, thus, a very narrow response function. In addition the high voltage supply of the EChas been improved so that it can accurately control the voltage during fast scanning, and can also operate reliably to lowervoltages than was possible in earlier instruments. These improvements allow accurate size determination and reduce thescan time without smearing. This paper presents the performance and limitations of the new Nano-SMPS for scan timesdown to 3 s.
2. Experimental methods and sample preparation
2.1. New Nano Scanning Mobility Particle Sizer
We used the new Nano Scanning Mobility Particle Sizer (Nano-SMPS, TSI 3938), which is based on a novel ElectrostaticClassifier (EC, TSI 3082). The calibration of this classifier fully complies with ISO standard 15900, which provides themethodology for quality control of differential electrical mobility analysis. The EC features several essential improvementsover previous designs including: (1) a higher maximum sheath flow rate of 30 L min�1 for increased size resolution and lessdiffusion losses, (2) a precision dynamic high voltage supply with a response time of less than 50 ms which enables accurateand fast scanning and with improved settings at lower voltages and (3) the option of a dual polarity high voltage supply forthe Differential Mobility Analyzer (DMA), such that it can be switched to study oppositely charged particles. The EC uses astrong single sheath flow pump and a mass flow meter to precisely control the closed loop sheath flow. Relative humidity,temperature and absolute pressure are always measured within this sheath flow system. Either a Kr-85 or an X-rayneutralizer can be inserted into the EC. To achieve aerosol charge equilibrium a soft X-ray charger (TSI model 3088) wasinstalled in this study. The charge equilibrium of particles bigger than 20 nm can been determined very accurately, but the
Heat Exchanger
PolydisperseAerosol
Mass Flow MeterT,p,RH
High VoltageSuplly
Nano-D
MA
3085 A
FlowPump
FilterFilter
N-WCPC3788
UCPC3776
rezil
artue
N88
03
Electrostatic Classifier
3082
MonodisperseAerosol
Nano-SMPS
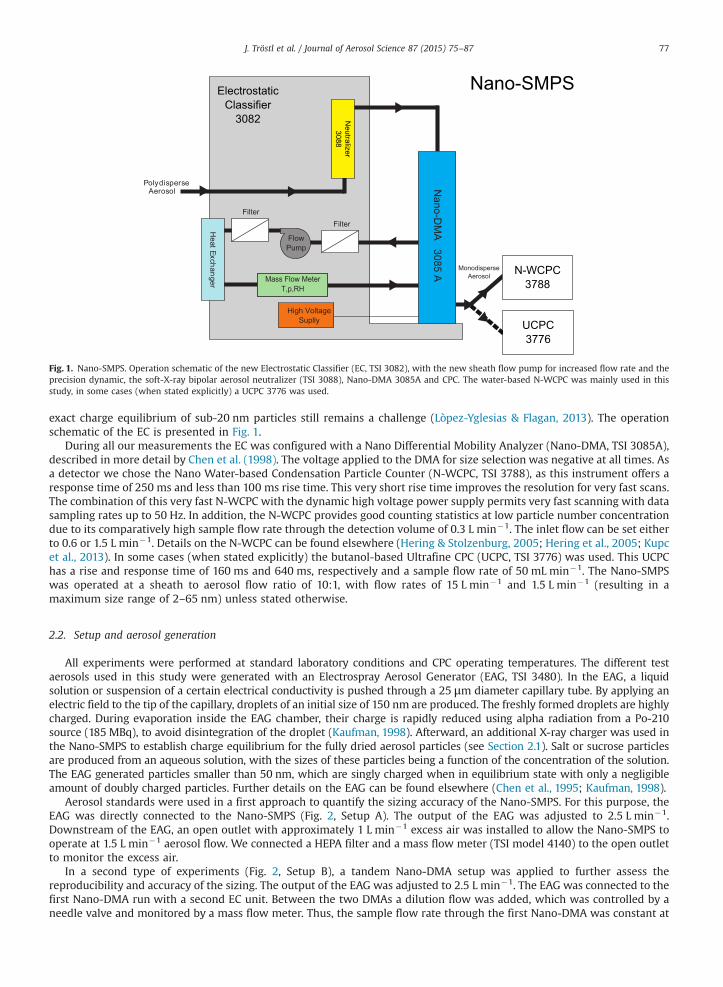
Fig. 1. Nano-SMPS. Operation schematic of the new Electrostatic Classifier (EC, TSI 3082), with the new sheath flow pump for increased flow rate and theprecision dynamic, the soft-X-ray bipolar aerosol neutralizer (TSI 3088), Nano-DMA 3085A and CPC. The water-based N-WCPC was mainly used in thisstudy, in some cases (when stated explicitly) a UCPC 3776 was used.
J. Tröstl et al. / Journal of Aerosol Science 87 (2015) 75–87 77
exact charge equilibrium of sub-20 nm particles still remains a challenge (Lòpez-Yglesias & Flagan, 2013). The operationschematic of the EC is presented in Fig. 1.
During all our measurements the EC was configured with a Nano Differential Mobility Analyzer (Nano-DMA, TSI 3085A),described in more detail by Chen et al. (1998). The voltage applied to the DMA for size selection was negative at all times. Asa detector we chose the Nano Water-based Condensation Particle Counter (N-WCPC, TSI 3788), as this instrument offers aresponse time of 250 ms and less than 100 ms rise time. This very short rise time improves the resolution for very fast scans.The combination of this very fast N-WCPC with the dynamic high voltage power supply permits very fast scanning with datasampling rates up to 50 Hz. In addition, the N-WCPC provides good counting statistics at low particle number concentrationdue to its comparatively high sample flow rate through the detection volume of 0.3 L min�1. The inlet flow can be set eitherto 0.6 or 1.5 L min�1. Details on the N-WCPC can be found elsewhere (Hering & Stolzenburg, 2005; Hering et al., 2005; Kupcet al., 2013). In some cases (when stated explicitly) the butanol-based Ultrafine CPC (UCPC, TSI 3776) was used. This UCPChas a rise and response time of 160 ms and 640 ms, respectively and a sample flow rate of 50 mL min�1. The Nano-SMPSwas operated at a sheath to aerosol flow ratio of 10:1, with flow rates of 15 L min�1 and 1.5 L min�1 (resulting in amaximum size range of 2–65 nm) unless stated otherwise.
2.2. Setup and aerosol generation
All experiments were performed at standard laboratory conditions and CPC operating temperatures. The different testaerosols used in this study were generated with an Electrospray Aerosol Generator (EAG, TSI 3480). In the EAG, a liquidsolution or suspension of a certain electrical conductivity is pushed through a 25 μm diameter capillary tube. By applying anelectric field to the tip of the capillary, droplets of an initial size of 150 nm are produced. The freshly formed droplets are highlycharged. During evaporation inside the EAG chamber, their charge is rapidly reduced using alpha radiation from a Po-210source (185 MBq), to avoid disintegration of the droplet (Kaufman, 1998). Afterward, an additional X-ray charger was used inthe Nano-SMPS to establish charge equilibrium for the fully dried aerosol particles (see Section 2.1). Salt or sucrose particlesare produced from an aqueous solution, with the sizes of these particles being a function of the concentration of the solution.The EAG generated particles smaller than 50 nm, which are singly charged when in equilibrium state with only a negligibleamount of doubly charged particles. Further details on the EAG can be found elsewhere (Chen et al., 1995; Kaufman, 1998).
Aerosol standards were used in a first approach to quantify the sizing accuracy of the Nano-SMPS. For this purpose, theEAG was directly connected to the Nano-SMPS (Fig. 2, Setup A). The output of the EAG was adjusted to 2.5 L min�1.Downstream of the EAG, an open outlet with approximately 1 L min�1 excess air was installed to allow the Nano-SMPS tooperate at 1.5 L min�1 aerosol flow. We connected a HEPA filter and a mass flow meter (TSI model 4140) to the open outletto monitor the excess air.
In a second type of experiments (Fig. 2, Setup B), a tandem Nano-DMA setup was applied to further assess thereproducibility and accuracy of the sizing. The output of the EAG was adjusted to 2.5 L min�1. The EAG was connected to thefirst Nano-DMA run with a second EC unit. Between the two DMAs a dilution flow was added, which was controlled by aneedle valve and monitored by a mass flow meter. Thus, the sample flow rate through the first Nano-DMA was constant at

Fig. 2. Schematic of the characterization experiment showing two different testing setups. Setup A was used to acquire size distributions of differentelectrosprayed solutions. Setup B was used to generate monodisperse distribution which were then subsequently measured with the Nano-SMPS. For this asecond DMA was needed to select particles of a certain size beforehand.
J. Tröstl et al. / Journal of Aerosol Science 87 (2015) 75–8778
all times. We used the Nano-DMA to select particles of a defined mobility diameter by choosing the corresponding voltagefor 30 L min�1 sheath flow rate. To keep the sheath to aerosol flow ratio of 10:1 and to dilute the monodisperse aerosol,4.5 L min�1 of dilution air were added after the first Nano-DMA. A mixing orifice was installed to still provide a uniformlymixed aerosol flow. Afterwards we used a flow splitter to provide the sample flow for the CPC and additional instrumentsand/or simply a vent for excess air. No data from the additional instruments are included in this study. We used conductivesampling lines which were kept as short as possible to minimize diffusion losses. Sheath, dilution and inlet flows werechecked and monitored with mass flow meters and a bubble flow meter (Gilian, Gilibrator-2).
We generated particles of six different compositions in the size range between 2 and 107 nm diameter using the EAG: (1)Polystyrene Latex (PSL) reference particles as size standard (Duke scientific micro particles), (2) sucrose (ACS, Alfa Aesar), andthe proteins (Sigma-Aldrich) (3) ferritin from equine spleen (F4503), (4) albumin from bovine serum (A7638), (5) myoglobinfrom equine skeletal muscle (M0630), and (6) ubiquitin from bovine erythrocytes (U6253). PSL, sucrose and protein solutionswere prepared in a 20 mM ammonium acetate buffer solution with a conductivity of 0.2 S m�1 (Chen et al., 1995).
The particle size from sucrose solutions depends on the dilution (Kaufman, 2000), thus, we prepared different ones withconcentrations ranging from 1 to 1500 ppm (parts per million). Albumin, myoglobin, ubiquitin and ferritin solutions withapproximately 0.26 mg ml�1 were prepared in a 20 mM ammonium acetate buffer solution. We used then this stock solutionto prepare several solutions by diluting them by a factor 10 and/or 100 for some experiments. Before installing the samples inthe EAG, we put the suspension for at least 2 min in an ultrasonic bath to ensure a good suspension of the proteins. The size ofthe protein peaks does not depend on the dilution, as they are only suspended and not dissolved. The ratio of mono- andmultimers, however, changes with concentration. With higher concentration a bigger fraction of the protein molecules clustersto di- or trimers due to an increased number of droplets containing more than one protein molecule. Thus, we tested differentdilutions to verify the protein sizing as described in Section 3.1.
2.3. Data analysis
Aerosol number size distributions (for brevity from hereon referred to as size distribution) were retrieved from the rawdata using the Aerosol Instrument Manager (AIM), Version 10.1. The inversion of the raw data is based on the detaileddescription by Wang & Flagan (1990). The standard SMPS inversion algorithm that was applied contains the followingcommon assumptions: The size distribution dN=d log Dp is assumed to be constant across the width of the transfer functionfor all sizes. This directly implies that only the area of the DMA transfer function has an influence on the inverted sizedistribution, while its width and shape do not. Thus, the idealized triangular DMA transfer function without accounting fordiffusion broadening was used to calculate the area, as diffusion broadening does not alter its area. The simplified inversionis virtually exact for broad and smooth size distributions. Quasi-monodisperse size distributions, which do not fulfill theabove assumption, were investigated in several experiments of this study. The simplified inversion still provides theintegrated number concentration correctly, while the width of the size distribution will be slightly overestimated. However,this is irrelevant for the purpose of this study, as only the precision of the measured width in dependence of scan time is ofinterest. Using a full inversion scheme with accounting for diffusion broadening would only be needed if the absolute widthof measured narrow size distributions was of interest.
The SMPS inversion algorithm also corrects for the size dependent single charge probability, the effects of multiplycharged particles (Knobel et al., 2013) and the CPCs counting efficiency across the range of its lower size cut-off. Weexcluded data points at diameters below the CPCs 50% counting efficiency cut-off. Specific CPC calibrations would be needed

J. Tröstl et al. / Journal of Aerosol Science 87 (2015) 75–87 79
in that range, as uncertainties associated with the exact shape of the cut-off curve in dependence of particle chemicalcomposition become increasingly large. This is outside the scope of this study. For more information on the N-WCPC cut-offcurve see Kupc et al. (2013). Diffusion losses within the Nano-SMPS were corrected using the widely accepted effectivelength approach (Wiedensohler et al., 2012). To obtain accurate size distribution measurements, it is necessary tocharacterize the diffusion losses in the complete sampling manifold and DMA unit. We applied the literature value forthe effective length for the Nano-SMPS, which was already derived from previous studies (Birmili et al., 1997; Chen et al.,1998; Reineking & Porstendörfer, 1986; Wiedensohler et al., 2012) and experimentally validated by TSI. Uncertaintiesassociated with charging probability, CPC cut-off curve and diffusion losses limit the accuracy of measured particle sizedistributions, particularly in the sub-20 nm size range. However, this does not impair the sizing accuracy nor the precision ofnumber concentrations obtained from repeated measurements with different scan times of the same sample, which werethe subjects of this study.
To investigate the performance of the Nano-SMPS for fast scanning measurements, we considered the scan velocity inaddition to the scan time, which is the time needed to perform one scan over a predefined size range. The scan time itselfdoes not provide all relevant information as the scanned diameter range can vary and, thus, influence the instrumentperformance at fixed scan time. The scan velocity vs was determined according to Weingartner et al. (2002):
vs ¼d log10 Dp
� �
dtð1Þ
which corresponds to the change in diameter Dp per time on a logarithmic scale. A scan velocity of vs ¼ 1 s�1 corresponds toone size decade per second. High scanning velocities cannot only lead to smearing effects but can also introduce additionalsizing uncertainties corresponding to errors in the delay time, which is the time between DMA monodisperse exit anddetection by the CPC. The corresponding error is the following according to Weingartner et al. (2002):
ΔDD
¼ 10vsΔtd �1 ð2Þ
whereas td is the delay time and ΔD=D the relative error. For fast scanning, e.g. 0:2 s�1, a deviation of 0.1 s from the correctdelay time yields a 5% error in the sizing. Thus, for fast scans the determination of the delay time is crucial for correct sizing.The delay time was empirically determined and optimized so that the measured particle size became independent of thescan time.
The geometric mean diameter (Dg) was chosen as a representative size of the measured mode. We used two approachesto determine Dg. For isolated modes, the integral over the mode according to the statistical definition was calculated. Foroverlapping modes, we fitted a multi-modal lognormal distribution. The width of the mode is expressed as the geometricstandard deviation (σg). It is used to quantify potential smearing effects at fast scan times. σg was determined in the samemanner as Dg, either by integrating over the mode for isolated modes, or by fitting multi-modal lognormal distributions.
3. Results
3.1. Sizing accuracy
3.1.1. Quasi-stationary testsWith stationary size distribution measurements, i.e., stepping the voltage, the potential bias from transient effects and
finite response times can be avoided. However, such transient effects can also be avoided with very slow, quasi-stationaryscans. In order to investigate the sizing accuracy, we tested the Nano-SMPS with substances of a known diameter using thefirst experimental setup (Fig. 2A, Section 2.2). Comparing size distributions measured with scan times of 50 s with thosemeasured with scan times 4100 s, we did not see a detectable difference.
Therefore, 50 s scans already provide equal results to a stepping approach measurement and are chosen as a referencescan. To investigate diameters below 20 nm, the proteins listed in Table 1 were used. Each protein was tested in twodifferent concentrations, directly using the stock suspension (see Section 2.2) and a 10-fold dilution (10 and 100-folddilution in case of ferritin). Figure 3 shows the measured (single scan) protein size distributions for a scan range from 2 to65 nm. Measurements of the (relatively) concentrated and dilute suspensions are indicated with solid and dashed lines,respectively. To guide the eye, the vertical lines indicate the mobility diameter of the mono-, di- and trimers (if applicable)reported by Bacher et al. (2001). The size of the protein peak was independent of the solution concentration. In addition tothe protein, the solution in which the proteins are stored also contains buffers and surfactants which are added to improvethe shelf life among other things. This can be seen in Fig. 3D, where an additional peak is visible. This peak shifts to lowersizes with dilution, indicating soluble residuals in the protein suspension. These additive contamination coat the proteinincreasing the measured diameter relative to that observed in more dilute suspension. This slight shift of the protein peakposition is apparent in Fig. 3D for the more dilute suspension.
The relative number concentration of di- and trimers decreased when diluted as expected for all samples except forubiquitin (A), a protein that was poorly suspended in the solution, leading to a higher multimer concentration. This may becaused by an extended waiting time between dispersion in the ultrasonic bath and measurement, or alternatively, too highprotein concentration in the suspension might explain this size distribution. In addition to soluble residuals, non-soluble

J. Tröstl et al. / Journal of Aerosol Science 87 (2015) 75–8780
residuals, e.g. protein fragments, might agglomerate and yield additional peaks. To only see the monomer peak of a protein,a higher dilution is recommended. However, in this case we intended to see as many multimers as possible to be able tocompare them to literature results, deliberately accepting additional artifact peaks such as contamination peaks or proteinagglomerates.
In order to test the sizing accuracy in the diameter range above 20 nm, we used polystyrene latex (PSL) particle sizestandards (with diameters of 73 nm and 107 nm). These sizes are above the upper sizing limit of the Nano-DMA at15 L min�1 sheath flow. Therefore, for testing the 73 nm PSL, the sheath and aerosol flow rates were reduced to 4 and0.4 L min�1, respectively, yielding a measurable diameter range of 4 nm to 138 nm. For the 107 nm PSL the sheath andaerosol flow were further reduced to 2.5 L min-1 and 0.25 L min�1, respectively, yielding a measurable size range from 5 nmto 178 nm.
Table 1Summary of the determined geometric mean diameter Dg and their standard deviation (determined from 5 subsequent measurements), the correspondingliterature or manufacturer reference value and the deviation from these. The trimer peaks of ubiquitin and myoglobin were clearly visible (as indicated inFig. 3) but due to the background peak of the solution it was not possible to determine the geometric mean diameter.
Substance Dg (nm) Standard deviation (nm) Literature values (nm) Deviation (%)
Ubiquitin (monomer) 3.54 70.004 3.6a 1.6Ubiquitin (dimer) 4.52 70.008 4.5a 0.4Ubiquitin (trimer) – – 5.2a
Myoglobin (monomer) 4.53 70.02 4.6a 1.5Myoglobin (dimer) 5.84 70.07 5.7a 2.4Myoglobin (trimer) – – 6.45a
Albumin (monomer) 7.08 70.01 7.1a 0.28Albumin (dimer) 9.07 70.02 9.0a 0.7Ferritin 13.57 70.05 14.3 5.1PSL 73 nm 73.6 70.17 73 0.8PSL 107 nm 109.2 70.13 107 2.0
a Bacher et al. (2001).
Fig. 3. Observed protein peaks. Two different solutions with varying concentration of (A) ubiquitin, (B) myoglobin, (C) albumin and (D) ferritin aredisplayed. The dashed lines correspond to the diluted distributions which were multiplied with the dilution factor to simplify the comparison. The solidlines correspond to the stock solutions or a weaker solution in case of ferritin. The positions of the protein peaks according to Bacher et al. (2001) areindicated with the vertical lines.
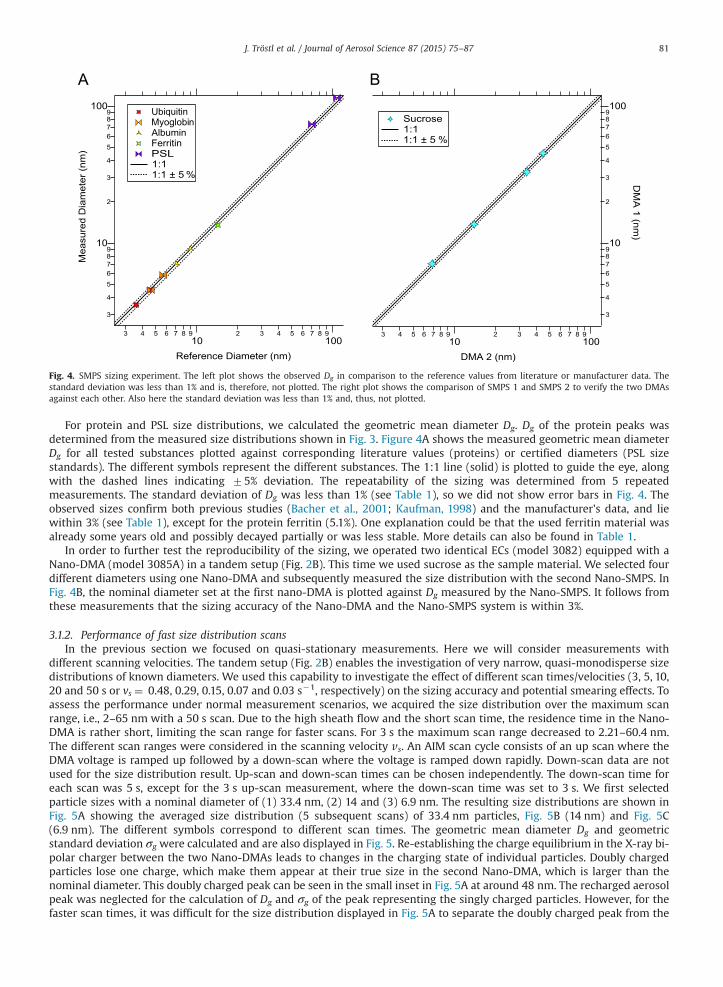
Fig. 4. SMPS sizing experiment. The left plot shows the observed Dg in comparison to the reference values from literature or manufacturer data. Thestandard deviation was less than 1% and is, therefore, not plotted. The right plot shows the comparison of SMPS 1 and SMPS 2 to verify the two DMAsagainst each other. Also here the standard deviation was less than 1% and, thus, not plotted.
J. Tröstl et al. / Journal of Aerosol Science 87 (2015) 75–87 81
For protein and PSL size distributions, we calculated the geometric mean diameter Dg. Dg of the protein peaks wasdetermined from the measured size distributions shown in Fig. 3. Figure 4A shows the measured geometric mean diameterDg for all tested substances plotted against corresponding literature values (proteins) or certified diameters (PSL sizestandards). The different symbols represent the different substances. The 1:1 line (solid) is plotted to guide the eye, alongwith the dashed lines indicating 75% deviation. The repeatability of the sizing was determined from 5 repeatedmeasurements. The standard deviation of Dg was less than 1% (see Table 1), so we did not show error bars in Fig. 4. Theobserved sizes confirm both previous studies (Bacher et al., 2001; Kaufman, 1998) and the manufacturer's data, and liewithin 3% (see Table 1), except for the protein ferritin (5.1%). One explanation could be that the used ferritin material wasalready some years old and possibly decayed partially or was less stable. More details can also be found in Table 1.
In order to further test the reproducibility of the sizing, we operated two identical ECs (model 3082) equipped with aNano-DMA (model 3085A) in a tandem setup (Fig. 2B). This time we used sucrose as the sample material. We selected fourdifferent diameters using one Nano-DMA and subsequently measured the size distribution with the second Nano-SMPS. InFig. 4B, the nominal diameter set at the first nano-DMA is plotted against Dg measured by the Nano-SMPS. It follows fromthese measurements that the sizing accuracy of the Nano-DMA and the Nano-SMPS system is within 3%.
3.1.2. Performance of fast size distribution scansIn the previous section we focused on quasi-stationary measurements. Here we will consider measurements with
different scanning velocities. The tandem setup (Fig. 2B) enables the investigation of very narrow, quasi-monodisperse sizedistributions of known diameters. We used this capability to investigate the effect of different scan times/velocities (3, 5, 10,20 and 50 s or vs ¼ 0.48, 0.29, 0.15, 0.07 and 0.03 s�1, respectively) on the sizing accuracy and potential smearing effects. Toassess the performance under normal measurement scenarios, we acquired the size distribution over the maximum scanrange, i.e., 2–65 nm with a 50 s scan. Due to the high sheath flow and the short scan time, the residence time in the Nano-DMA is rather short, limiting the scan range for faster scans. For 3 s the maximum scan range decreased to 2.21–60.4 nm.The different scan ranges were considered in the scanning velocity vs. An AIM scan cycle consists of an up scan where theDMA voltage is ramped up followed by a down-scan where the voltage is ramped down rapidly. Down-scan data are notused for the size distribution result. Up-scan and down-scan times can be chosen independently. The down-scan time foreach scan was 5 s, except for the 3 s up-scan measurement, where the down-scan time was set to 3 s. We first selectedparticle sizes with a nominal diameter of (1) 33.4 nm, (2) 14 and (3) 6.9 nm. The resulting size distributions are shown inFig. 5A showing the averaged size distribution (5 subsequent scans) of 33.4 nm particles, Fig. 5B (14 nm) and Fig. 5C(6.9 nm). The different symbols correspond to different scan times. The geometric mean diameter Dg and geometricstandard deviation σg were calculated and are also displayed in Fig. 5. Re-establishing the charge equilibrium in the X-ray bi-polar charger between the two Nano-DMAs leads to changes in the charging state of individual particles. Doubly chargedparticles lose one charge, which make them appear at their true size in the second Nano-DMA, which is larger than thenominal diameter. This doubly charged peak can be seen in the small inset in Fig. 5A at around 48 nm. The recharged aerosolpeak was neglected for the calculation of Dg and σg of the peak representing the singly charged particles. However, for thefaster scan times, it was difficult for the size distribution displayed in Fig. 5A to separate the doubly charged peak from the
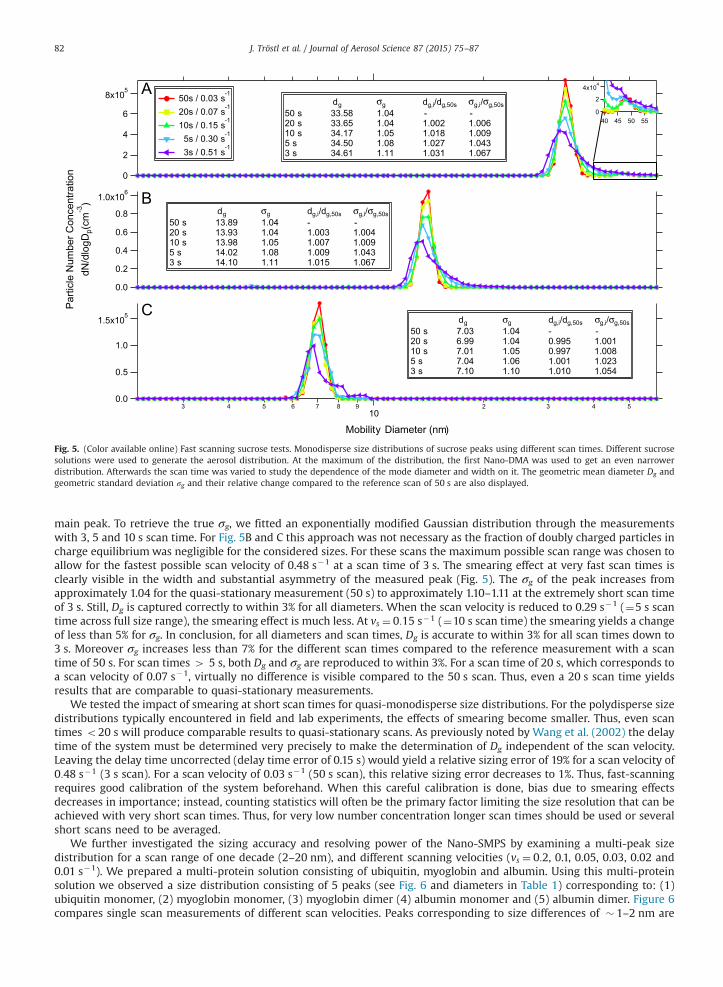
Fig. 5. (Color available online) Fast scanning sucrose tests. Monodisperse size distributions of sucrose peaks using different scan times. Different sucrosesolutions were used to generate the aerosol distribution. At the maximum of the distribution, the first Nano-DMA was used to get an even narrowerdistribution. Afterwards the scan time was varied to study the dependence of the mode diameter and width on it. The geometric mean diameter Dg andgeometric standard deviation σg and their relative change compared to the reference scan of 50 s are also displayed.
J. Tröstl et al. / Journal of Aerosol Science 87 (2015) 75–8782
main peak. To retrieve the true σg, we fitted an exponentially modified Gaussian distribution through the measurementswith 3, 5 and 10 s scan time. For Fig. 5B and C this approach was not necessary as the fraction of doubly charged particles incharge equilibrium was negligible for the considered sizes. For these scans the maximum possible scan range was chosen toallow for the fastest possible scan velocity of 0.48 s�1 at a scan time of 3 s. The smearing effect at very fast scan times isclearly visible in the width and substantial asymmetry of the measured peak (Fig. 5). The σg of the peak increases fromapproximately 1.04 for the quasi-stationary measurement (50 s) to approximately 1.10–1.11 at the extremely short scan timeof 3 s. Still, Dg is captured correctly to within 3% for all diameters. When the scan velocity is reduced to 0.29 s�1 (¼5 s scantime across full size range), the smearing effect is much less. At vs ¼ 0:15 s�1 (¼10 s scan time) the smearing yields a changeof less than 5% for σg. In conclusion, for all diameters and scan times, Dg is accurate to within 3% for all scan times down to3 s. Moreover σg increases less than 7% for the different scan times compared to the reference measurement with a scantime of 50 s. For scan times 4 5 s, both Dg and σg are reproduced to within 3%. For a scan time of 20 s, which corresponds toa scan velocity of 0.07 s�1, virtually no difference is visible compared to the 50 s scan. Thus, even a 20 s scan time yieldsresults that are comparable to quasi-stationary measurements.
We tested the impact of smearing at short scan times for quasi-monodisperse size distributions. For the polydisperse sizedistributions typically encountered in field and lab experiments, the effects of smearing become smaller. Thus, even scantimes o20 s will produce comparable results to quasi-stationary scans. As previously noted by Wang et al. (2002) the delaytime of the system must be determined very precisely to make the determination of Dg independent of the scan velocity.Leaving the delay time uncorrected (delay time error of 0.15 s) would yield a relative sizing error of 19% for a scan velocity of0:48 s�1 (3 s scan). For a scan velocity of 0.03 s�1 (50 s scan), this relative sizing error decreases to 1%. Thus, fast-scanningrequires good calibration of the system beforehand. When this careful calibration is done, bias due to smearing effectsdecreases in importance; instead, counting statistics will often be the primary factor limiting the size resolution that can beachieved with very short scan times. Thus, for very low number concentration longer scan times should be used or severalshort scans need to be averaged.
We further investigated the sizing accuracy and resolving power of the Nano-SMPS by examining a multi-peak sizedistribution for a scan range of one decade (2–20 nm), and different scanning velocities (vs ¼ 0:2, 0.1, 0.05, 0.03, 0.02 and0.01 s�1). We prepared a multi-protein solution consisting of ubiquitin, myoglobin and albumin. Using this multi-proteinsolution we observed a size distribution consisting of 5 peaks (see Fig. 6 and diameters in Table 1) corresponding to: (1)ubiquitin monomer, (2) myoglobin monomer, (3) myoglobin dimer (4) albumin monomer and (5) albumin dimer. Figure 6compares single scan measurements of different scan velocities. Peaks corresponding to size differences of � 1–2 nm are

Fig. 6. Fast scanning multi-peak solution of the proteins ubiquitin, myoglobin and albumin. Different scan times were tested to investigate their influenceon sizing and resolution. The observed peaks correspond to: (1) ubiquitin monomer, (2) myoglobin monomer, (3) myoglobin dimer, (4) albumin monomerand (5) albumin dimer.
J. Tröstl et al. / Journal of Aerosol Science 87 (2015) 75–87 83
well resolved with a quasi-stationary measurement. Down to a scan velocity of 0.1 s�1, the size distributions can hardly bedistinguished from quasi-stationary measurements. Smearing becomes visible for a scan velocity of 0.2 s�1. For this andhigher scanning velocities, it becomes difficult to identify small peaks that sit in the tail of large peaks (e.g. peak 3).
The results obtained above can be directly compared to older SMPS systems. Collins et al. (2002) investigated thesmearing caused by the TSI CPC 3010. They ramped a DMA from 10 to 10 000 V, which is very similar to our applied voltagerange (10–9 800 V). Measurements of 300 s yielded quasi-stationary results. Already measurements with a 90 s scan timeshowed a significant smearing. For 30 s the peak concentration is only approximately 33% of the 300 s scan. In comparison,for the instrument tested here, the 3 s measurement still shows a peak concentration of approximately 50% compared to thereference scan.
3.2. Reproducibility of number concentration measurement
This section describes the precision with which the number concentration measurements can be made for fast sizedistribution scans. This is a second prerequisite, besides the sizing accuracy tested in the previous section, for precise sizedistribution measurements. For this purpose we used the size distribution measurements of quasi-monodisperse sucroseparticles acquired with the tandem setup (Fig. 2B). The first Nano-DMA was held at a fixed setpoint in order to select aquasi-monodisperse size-cut from a sucrose aerosol. The second Nano-SMPS scanned across the full size range withdifferent scan times. The integrated particle number concentrations (Nx s; where x is a placeholder for the scan duration) ofthe measured size distributions, such as those shown in Fig. 5, were compared with N50 s measured with the quasi-stationary reference scan of 50 s duration.
We tested the following scan times/velocities: 3, 5, 10, 20 and 50 s corresponding to vs ¼ 0:48, 0.29, 0.15, 0.07 and0.03 s�1, respectively. In Fig. 7A the ratio of Nx s=N50 s is plotted against the selected diameters, whereby the particle sizedistributionwas averaged over 5 measurements. The error bars correspond to the statistical uncertainty ð1=Cx sþ1=C50 sÞ1=2 �Nx s=N50 s with Cx s being the total raw counts from 5 measurements for the corresponding scan time x s. The total numberconcentration is captured correctly for all scan times. Only for 7 nm aerosol particles did the total concentration deviate fordifferent scan times (by 10%). This scatter can be explained by lower counting statistics. At equilibrium, less than 1% of 7 nmaerosols (Wiedensohler, 1988) are singly charged, yielding very low particle concentrations after the DMA. Decreasing thescan time further decreases the counting statistics. Thus, for low concentration of small particles, scan times of at least 10 sor an average over several measurements are recommended. For this reason it was not possible to test 3 nm with thetandem-DMA setup. Only a very small fraction of 3 nm particles is charged, so the fraction that penetrated through bothNano-DMAs was too low to be measured. Therefore, we directly connected the electrospray to the Nano-SMPS, yieldinghigher counts. Additionally, we decreased the scan range to 2–20 nm. This additional measurement with a different setup isindicated with (n) in Fig. 7A. The resulting distribution was slightly broader (true sucrose distribution with σg¼1.1) and thetotal counts increased. This again improved the counting statistics significantly, thus, reducing the relative uncertainty of theNx s values. This test for 3 nm particles revealed a reproducibility of 73% for all scan times down to 3 s.
We also tested the reproducibility of the total number concentration of a multiple quasi-monodisperse size distributionas a function of the scan time. Here we used the size distribution data from the protein mixture shown in Fig. 6. Figure 7B

Fig. 7. Reproducibility of integrated total number concentration for different diameters and scan times. (A) Setup B was used to investigate quasi-monodisperse size distributions (see Fig. 5). The integrated number concentration was then compared to the reference scan (which had a scan time of 50 s)plotting the ratio Nx s=N50 s against the measured diameter. For 3 nm (n) it was not possible to use setup B, thus, the setup was changed to setup A. In thiscase the distribution is slightly broader. (B) Setup A was used to investigate the multi-peak distribution in Fig. 6. The total number concentration wasdetermined using different scan times and compared to the reference measurement using a scan time of 50 s.
J. Tröstl et al. / Journal of Aerosol Science 87 (2015) 75–8784
shows the ratio of Nx s=N100 s in dependence on the scan time. Also here the error bars correspond to the statisticaluncertainty ð1=Cx sþ1=C100 sÞ1=2 � Nx s=N100 s.
The scans were performed in the following order: (1) 50 s (vs¼0.02 s�1), (2) 30 s (0.03 s�1), (3) 20 s (0.05 s�1), (4) 10 s(0.1 s�1), (5) 5 s (0.2 s�1), (6) 3 s (0.3 s�1) and (7) 100 s (0.01 s�1). Even down to a scan time of 3 s, the concentrations arecomparable to the reference scan of 100 s. The worse agreement of 50 s and 30 s compared to 3 s can be explained by aslight drift of the concentration of the generated aerosol from the electrospray. Thus, we added additional points to Fig. 7B,correcting Nx s=N100 s for the drift in the electrospray. This test revealed a reproducibility of 72% for all scan times.
We demonstrated the reproducibility of the measured total number concentration using different scan times through themeasurements described in this section, and have shown that fast scans can be just as precise as quasi-stationary scans. Wedid not test the accuracy of the measured total number concentration, as it is well known that uncertainties associated withthe corrections for charging probability, diffusion losses and CPC counting efficiency are considerable in the sub-20 nm sizerange (Wiedensohler et al., 2012).
3.3. Comparison UCPC versus N-WCPC
We tested the well-established UCPC within the Nano-SMPS setup in comparison to the N-WCPC at different scan times(see Fig. 1). Figure 8 shows the results: The measurement using the N-WCPC and a scan time of 100 s is the quasi-stationaryreference. The following scan velocities vs (scan times) were tested: (1) 0.3 s�1 (3 s), (2) 0.2 s�1 (5 s), (3) 0.1 s�1 (10 s) and(4) 0.02 s�1 (50 s). Both alternative setups were corrected for the system diffusion losses, single charge probability and theinterference of doubly charged particles.
For sucrose particles, the two detectors have a very similar detection threshold. The cut-off diameter D50, where 50% ofthe particles of a certain diameter are detected, is around 2.5 nm for both detectors. As the two detectors use differentworking liquids (water or butanol) their detection efficiency curves can depend on the chemical composition of the detectedparticles. Due to the proteins’ low water affinity, the UCPC has a better detection efficiency compared to theN-WCPC. The detection efficiency of ubiquitin is approximately three times higher for the UCPC compared to the N-WCPC (Kupc et al., 2013). To properly correct the measured multi-protein solution for the detection efficiency, it would benecessary to correct each peak separately. As we are only interested in the performance for fast scan times, we did notperform a CPC detection efficiency correction for this comparison. Thus, differences in the concentration directly reflect ahigher counting efficiency. For the larger protein sizes there is hardly any difference in concentration, as the detectionefficiency is not changed significantly.
The 100 s scan is shown as a quasi-stationary reference measurement that is not affected by smearing effects. For the 50 sscans, virtually no difference is visible compared to the reference scan (Fig. 8D). The 10 s scan (Fig. 8C) is virtually identicalto the 100 s reference scan. For the 5 s (Fig. 8B) and 3 s (Fig. 8A) scans, differences to the 100 s scan become obvious. Forthese rapid scans the N-WCPC shows a slightly better performance. Due to the short scan time the counting statisticsbecome poor, resulting in an increased noise. This is more pronounced for the UCPC due to the lower aerosol flow rate of

Fig. 8. (Color available online) Comparison of the N-WCPC and the UCPC as detectors in the Nano-SMPS. The performance using different scan times of theN-WCPC and UCPC are compared to a reference scan of 100 s performed by the N-WCPC. (A) corresponds to 3 s, (B) to 5 s, (C) to 10 s and (D) to 50 s.
J. Tröstl et al. / Journal of Aerosol Science 87 (2015) 75–87 85
only 50 mL min�1 compared to 300 mL min�1 in the N-WCPC. This is especially visible in Fig. 8A, where the area of theubiquitin peak is not captured correctly anymore. Often counting statistics are the limiting factor for size resolution ratherthan smearing. This is often pronounced in the sub-20 nm diameter range, due to the low charging probability. Thus, for lowaerosol concentrations and/or fast scanning the N-WCPC performs better.
4. Conclusions
During highly dynamic aerosol evolution like nucleation events, rapid growth rates of around 10 nm h�1 or more areobserved in field experiments (Kulmala et al., 2004, Venzac et al., 2008). Lab experiments even show higher growth rates(Riccobono et al., 2012). One common method to estimate aerosol growth rates is to study the temporal evolution of thenucleation mode diameter (Lehtinen & Kulmala, 2003). With scan times of 60 s or more, the measurement will show atransient size distribution. Being able to reduce the scan time can, therefore, significantly enhance the quality of the analysis.Another possible application is the measurement of fresh emissions, such as seen during road side monitoring or directemission measurements.
Here we present the results of the performance tests of the new TSI Nano-SMPS. Sizing accuracy and concentrationprecision have been investigated, as a function of the scan time and diameter. We showed that excellent results can beobtained at scan times down to 3 s. The sizing accuracy of the new Nano-SMPS is within 3% for several tested substances(proteins, sucrose and PSL reference particles) for all scan times. Due to the finite rise time of the CPC, decreasing the scantime causes a smearing of the size distribution. Some smearing effects are seen for scan velocities higher than 0.2 s�1 (thiscorresponds to approx. 7 s over the full size range), but the effect is small, resulting in a small reduction in the size resolvingpower. By decreasing the size range of the scan this smearing can be significantly decreased. In addition, the smearing willbe less pronounced for polydisperse distributions, which are commonly observed in field and lab experiments.
The precision of the measured number concentration was also investigated for different scan times and aerosoldistributions. The precision is within 73% for sufficient counting statistics. The variability can increase if the countingstatistics are not sufficient. In applying this instrument to nucleation and growth experiments, low counting statistics mightbe a problem, especially for low nucleation and growth rates. However, for lab experiments where the formation rates offreshly nucleated particles can be rather high, this problem is not likely to occur. Also for vehicle emission measurements,depending on engine type, high particle concentrations are expected. The accuracy of the measured total numberconcentration, especially in the sub-20 nm size range, is limited by the uncertainties of the charging probability, diffusion

J. Tröstl et al. / Journal of Aerosol Science 87 (2015) 75–8786
losses and CPC counting efficiency. It also requires a well calibrated condensation particle counter as a reference. For thesereasons, the determination of the accuracy in number remains a challenge for future studies.
The tested systems in general show neither sizing nor number concentration bias for fast scans. Very little smearing(corresponding to very little resolution loss) occurs for high scan velocities, i.e. short scan times without loss of accuracy orsize resolution can be used. If counting statistics are insufficient for single scans, an average over multiple repetitions is anoption. The delay time still needs to be determined properly to allow for accurate size determination. In addition decreasingthe down scan time avoids loss of counting statistics compared to fewer but longer scans.
Acknowledgments
This work was supported by the EC Seventh Framework Programme (Marie Curie Initial Training Network ”CLOUD-TRAIN” no. 316662) as well as the Swiss National Science Foundation. M.G. was funded by ERC-2013-CoG 615922-BLACARAT.
References
Bacher, G., Szymanski, W.W., Kaufman, S.L., Zöllner, P., Blaas, D., & Allmaier, G. (2001). Charge-reduced nano electrospray ionization combined withdifferential mobility analysis of peptides, proteins, glycoproteins, noncovalent protein complexes and viruses. Journal of Mass Spectrometry, 36(9),1038–1052.
Birmili, W., Stratmann, F., Wiedensohler, A., Covert, D., Russell, L.M., & Berg, O. (1997). Determination of differential mobility analyzer transfer functionsusing identical instruments in series. Aerosol Science and Technology, 27, 215–223.
Chen, D.-R., Pui, D.Y., Hummes, D., Fissan, H., Quant, F., & Sem, G. (1998). Design and evaluation of a nanometer aerosol differential mobility analyzer (Nano-DMA). Journal of Aerosol Science, 29(5), 497–509.
Chen, D.-R., Pui, D.Y., & Kaufman, S.L. (1995). Electrospraying of conducting liquids for monodisperse aerosol generation in the 4 nm to 1.8 μm diameterrange. Journal of Aerosol Science, 26(6), 963–977.
Collins, D.R., Flagan, R.C., & Seinfeld, J.H. (2002). Improved inversion of scanning DMA data. Aerosol Science & Technology, 36(1), 1–9.Hering, S.V., & Stolzenburg, M.R. (2005). A method for particle size amplification by water condensation in a laminar, thermally diffusive flow. Aerosol
Science & Technology, 39(5), 428–436.Hering, S.V., Stolzenburg, M.R., Quant, F.R., Oberreit, D.R., & Keady, P.B. (2005). A laminar-flow, water-based condensation particle counter (WCPC). Aerosol
Science & Technology, 39(7), 659–672.Hoet, P.H., Brüske-Hohlfeld, I., & Salata, O.V. (2004). Nanoparticles—Known and unknown health risks. Journal of Nanobiotechnology, 2(1), 12.Johnson, T., Caldow, R., Poecher, A., Mirme, A., & Kittelson, D. (2004). A new electrical mobility particle sizer spectrometer for engine exhaust particle
measurements. Technical report, SAE Technical Paper.Kaufman, S.L. (1998). Analysis of biomolecules using electrospray and nanoparticle methods: The gas-phase electrophoretic mobility molecular analyzer
(GEMMA). Journal of Aerosol Science, 29(5), 537–552.Kaufman, S.L. (2000). Electrospray diagnostics performed by using sucrose and proteins in the gas-phase electrophoretic mobility molecular analyzer
(GEMMA). Analytica Chimica Acta, 406(1), 3–10.Knobel, L., Weinhold, K., Gandhi, J., Wiedensohler, A., & Schmid, H.-J. (2013). Application of a X-ray charger for SMPS measurements. In: Proceedings to
European aerosol conference. Prague.Knutson, E., & Whitby, K. (1975). Aerosol classification by electric mobility: Apparatus, theory, and applications. Journal of Aerosol Science, 6(6), 443–451.Kulmala, M., Laakso, L., Lehtinen, K.E.J., Riipinen, I., Dal Maso, M., Anttila, T., Kerminen, V.M., Horrak, U., Vana, M., & Tammet, H. (2004). Initial steps of
aerosol growth. Atmospheric Chemistry and Physics, 4(11/12), 2553–2560.Kulmala, M., Petaja, T., Nieminen, T., Sipilä, M., Manninen, H.E., Lehtipalo, K., Dal Maso, M., Aalto, P.P., Junninen, H., Paasonen, P., Riipinen, I., Lehtinen, K.E.,
Laaksonen, A., & Kerminen, V.M. (2012). Measurement of the nucleation of atmospheric aerosol particles. Nature Protocols, 7(9), 1651–1667.Kupc, A., Bischof, O., Tritscher, T., Beeston, M., Krinke, T., & Wagner, P.E. (2013). Laboratory characterization of a new nano-water-based CPC 3788 and
performance comparison to an ultrafine butanol-based CPC 3776. Aerosol Science & Technology, 47(2), 183–191.Lehtinen, K., & Kulmala, M. (2003). A model for particle formation and growth in the atmosphere with molecular resolution in size. Atmospheric Chemistry
and Physics, 3(1), 251–257.Lòpez-Yglesias, X., & Flagan, R.C. (2013). Population balances of micron-sized aerosols in a bipolar ion environment. Aerosol Science & Technology, 47(6),
681–687.Mamakos, A., Ntziachristos, L., & Samaras, Z. (2008). Differential mobility analyser transfer functions in scanning mode. Journal of Aerosol Science, 39(3),
227–243.Merikanto, J., Spracklen, D., Mann, G., Pickering, S., & Carslaw, K. (2009). Impact of nucleation on global CCN. Atmospheric Chemistry and Physics, 9(21),
8601–8616.Olfert, J.S., Kulkarni, P., & Wang, J. (2008). Measuring aerosol size distributions with the fast integrated mobility spectrometer. Journal of Aerosol Science, 39
(11), 940–956.Peters, A., Wichmann, H.E., Tuch, T., Heinrich, J., & Heyder, J. (1997). Respiratory effects are associated with the number of ultrafine particles. American
Journal of Respiratory and Critical Care Medicine, 155(4), 1376–1383.Quant, F., Caldow, R., Sem, G., & Addison, T. (1992). Performance of condensation particle counters with three continuous-flow designs. Journal of Aerosol
Science, 23, 405–408.Reineking, A., & Porstendörfer, J. (1986). Measurements of particle loss functions in a differential mobility analyzer (TSI, model 3071) for different flow
rates. Aerosol Science and Technology, 5(4), 483–486.Riccobono, F., Rondo, L., Sipilä, M., Barmet, P., Curtius, J., Dommen, J., Ehn, M., Ehrhart, S., Kulmala, M., & Kürten, A., et al. (2012). Contribution of sulfuric acid
and oxidized organic compounds to particle formation and growth. Atmospheric Chemistry and Physics, 12(20), 9427–9439.Riccobono, F., Schobesberger, S., Scott, C.E., Dommen, J., Ortega, I.K., Rondo, L., Almeida, J., Amorim, A., Bianchi, F., & Breitenlechner, M., et al. (2014).
Oxidation products of biogenic emissions contribute to nucleation of atmospheric particles. Science, 344(6185), 717–721.Russell, L.M., Flagan, R.C., & Seinfeld, J.H. (1995). Asymmetric instrument response resulting from mixing effects in accelerated DMA-CPC measurements.
Aerosol Science & Technology, 23(4), 491–509.Shah, S.D., & Cocker, D.R. (2005). A fast scanning mobility particle spectrometer for monitoring transient particle size distributions. Aerosol Science &
Technology, 39(6), 519–526.Stocker, T.F., Dahe, Q., Plattner, G.-K., 2013. Climate change: 2013 the physical science basis. Working Group I Contribution to the Fifth Assessment Report of
the Intergovernmental Panel on Climate Change. Summary for Policymakers (IPCC, 2013).

J. Tröstl et al. / Journal of Aerosol Science 87 (2015) 75–87 87
Tiede, K., Boxall, A.B., Tear, S.P., Lewis, J., David, H., & Hassellöv, M. (2008). Detection and characterization of engineered nanoparticles in food and theenvironment. Food Additives and Contaminants, 25(7), 795–821.
Venzac, H., Sellegri, K., Laj, P., Villani, P., Bonasoni, P., Marinoni, A., Cristofanelli, P., Calzolari, F., Fuzzi, S., & Decesari, S., et al. (2008). High frequency newparticle formation in the Himalayas. Proceedings of the National Academy of Sciences, 105(41), 15666–15671.
Wang, J., McNeill, V.F., Collins, D.R., & Flagan, R.C. (2002). Fast mixing condensation nucleus counter: Application to rapid scanning differential mobilityanalyzer measurements. Aerosol Science & Technology, 36(6), 678–689.
Wang, S.C., & Flagan, R.C. (1990). Scanning electrical mobility spectrometer. Aerosol Science & Technology, 13(2), 230–240.Weingartner, E., Gysel, M., & Baltensperger, U. (2002). Hygroscopicity of aerosol particles at low temperatures. 1. New low-temperature H-TDMA
instrument: Setup and first applications. Environmental Science & Technology, 36(1), 55–62.Wiedensohler, A. (1988). An approximation of the bipolar charge distribution for particles in the submicron size range. Journal of Aerosol Science, 19(3),
387–389.Wiedensohler, A., Birmili, W., Nowak, A., Sonntag, A., Weinhold, K., Merkel, M., Wehner, B., Tuch, T., Pfeifer, S., & Fiebig, M., et al. (2012). Mobility particle
size spectrometers: Harmonization of technical standards and data structure to facilitate high quality long-term observations of atmospheric particlenumber size distributions. Atmospheric Measurement Techniques, 5, 657–685.
Zhu, Y., Hinds, W.C., Kim, S., Shen, S., & Sioutas, C. (2002). Study of ultrafine particles near a major highway with heavy-duty diesel traffic. AtmosphericEnvironment, 36(27), 4323–4335.