journal - eso.org
TRANSCRIPT

journal
Communicating Astronomy with the Public
www.capjournal.org
Issue 21 | December 2016
Do you want to keep receiving CAPjournal by post?If so, you must confirm your subscription.Details on page 35
Bringing the Universe to the WorldLessons Learned from a Massive Open Online Class in Astronomy
Selling a StoryHow to Write a Successful Press Release
Exploring New Engagement SpacesLearning from the Astronomy on Tap Project

New
s In August, astronomers found clear evidence of a planet orbiting the closest star to Earth, Proxima Centauri. As this was a topic with very wide public interest, the progress of the campaign between mid-January and April 2016 was shared publicly as it happened on the Pale Red Dot website and via social media. The reports were accompanied by numerous outreach articles written by specialists around the world. Credit: ESO/M. Kornmesser

Review
Column
Research & Applications
Best Practices
Announcement
Explained in 60 Seconds
NewsSubmit articles for one of the following journal sections:
Georgia BladonEditor-in-Chief of CAPjournal
Editorial
As 2016 draws to a close we celebrate another year of groundbreaking astronomy, followed every step of the way by an inspired and engaged public. We saw the first images from the public-led JunoCam, the world said a heartfelt goodbye to Rosetta, and the Pale Red Dot Project captured the imaginations of media and public around the globe.
In this issue of CAPjournal authors reflect on the successes and challenges of Massive Open Online Classes — a grow-ing forum for learning that is still in its infancy — and we hear from the professionals on how astronomy communicators can get their press release noticed in the busy news market-place. Plus detailed accounts from practitioners engaging publics with astronomy everywhere from remote villages in the Andean Mountains to bars across America.
Many thanks once again for your interest in CAPjournal, and I remind you that if you have an article to share with the com-munity, would like to comment on articles in this or previ-ous issues, or have a letter to the editor you would like us to publish you are welcome to get in touch.
I look forward to hearing from you and happy reading,
Cover: This incredible image of the planet Jupiter combines an image taken with Hubble Space Telescope in the optical (taken in spring 2014) and observations of its auroras in the ultraviolet, taken in 2016.Credit: NASA, ESA
Contents
Explained in 60 Seconds: Jupiter Descending 4
A Week-long Summer Programme in Astronomy for High-school Students 5
Selling a Story: How to Write a Successful Press Release 10
Astronomy on Tap: Public Outreach Events in Bars 13
Bringing the Universe to the World: Lessons Learned from a Massive Open Online Class on Astronomy 20
The Flying Telescope: How to Reach Remote Areas in the Colombian Andes for Astronomy Outreach 31
Astronomy for the Blind and Visually Impaired 36

4 CAPjournal, No. 21, December 2016
smaller than a hundred kilometres — the size of an average hurricane on Earth.
Unfortunately, JunoCam will only last as long as its circuits can stand the bombardment of Jupiter’s intense radiation, and there is no guarantee as to how long it will hold out. With only a few hours each orbit to capture the highest resolution images, target locations will be scheduled by public vote, commencing in early November 2016.
Handing over the controls of JunoCam to an interested public provides a whole new level of personal interaction with space missions. Anyone can join the online discussion about what locations they are keen to see captured, as well as uploading their own images to direct researchers towards features of interest. All of the raw mission data will be made publicly available after transmission, to be processed by the keen amateur community.
Known by the ancients, named after the King of the Gods, and more than twice as massive as the rest of the planets, gas and dust in the Solar System combined, Jupiter needs little introduction.
But despite being such a monster of the sky, there is still a great deal we do not know about Jupiter. Why is it red? How is its magnetic field generated? What lies beneath the clouds?
Four hundred years after Galileo first gazed upon Jupiter’s stormy surface NASA’s Juno spacecraft has begun its mission to answer some of these questions.
Juno and its entourage of scientific instruments will analyse the chemical composition of Jupiter’s colourful atmosphere, as well as probing its magnetic and gravitational fields to discover what lies at its core. Juno also promises to unearth clues
to Jupiter’s birth and the very origins of the Solar System during its thirtyseven orbits of the planet before deliberately descending through the clouds in February 2018 and succumbing to the planet’s crushing atmosphere.
One of the spacecraft’s instruments in particular has excited amateur astronomers. Not listed as a scien tific instrument but as an outreach tool, JunoCam is sending back the most detailed images ever captured of Jupiter’s broiling surface, and the public is in control of the shutter.
As Juno grazes Jupiter’s atmosphere, JunoCam will capture cloudtop features in unprecedented detail. A single pixel can cover as little as three kilometres during closest approach, smaller than a terrestrial thunderstorm. In comparison, the iconic imagery of Jupiter from the Hubble Space Telescope cannot typically resolve details
Sebastian [email protected] Science Communicator
Explained in 60 Seconds: Jupiter Descending
Exp
lain
ed in
6
0 se
con
ds
Figure 1. This artist’s illustration depicts NASA’s Juno spacecraft at Jupiter, with its solar arrays and main antenna pointed towards the distant Sun and Earth. Credit: NASA/JPL-Caltech

5CAPjournal, No. 21, December 2016
The last four years have seen a considerable reduction in the number of candidates for the only Portuguese university degree course in astronomy. As a consequence, a number of measures were taken in order to increase the awareness of astronomy among high school students and to increase the number of students who ultimately decide to apply for the astronomy degree. Here, we present a weeklong programme of experimental activities and lectures covering the major fields of astronomy, and an evaluation of its success.
in different fields of study. The older students, on the other hand, participate in the Summer Project subprogramme. This subprogramme consists of weeklong activities focused on a specific field of study with up to sixteen students in each activity. These students are usually fifteen to seventeen years old and in 2015 there were a total of 83 different activities for them to partake in.
With Junior University already in place, it was decided that a course in astronomy should be developed for interested students, taking advantage of the organisational effort already being invested by the University of Porto each year to run the larger programme.
Activity organisation
The astronomy course developed — entitled Astronomy: from concepts to practice — is intended to guide students through some of the main areas of astronomy. Students spend most of the time performing experiments and discussing the results, while an hour to an hour and a half is dedicated to lectures each day.
The first two days of the course serve a dual purpose as they deal with stars and exoplanets as well as the basic properties of light and how it is used in astronomy. The third day of the course is devoted to extragalactic astronomy, and the fourth to cosmology and the fundamental laws of physics. The theme of the last day of the course is astronomical instrumentation, with a focus on telescopes. The last day
Introduction
The University of Porto runs the only university astronomy degree course in Portugal and it has been accepting students since 1984. Although the intake of students per year has never been very high the lack of candidates has become a larger issue over the past few years. In 2012 there was a total of nine students enrolled in this degree and in 2013 the number reduced to just six. This has raised special concern since it could eventually result in a lack of qualified astronomers for Portuguese research institutions. A few other scientific degrees at the University of Porto, such as chemistry and engineering, are also experiencing lower enrolment numbers than usual but, notably, the same is not true of the physics degree course.
No significant population changes have been identified that could affect enrolment, leading us to believe that the decrease in the number of students enrolling is due to diminishing interest in this field among potential students. Alternatively, this could be due to a change in students’ expectations regarding future employment, biasing them towards other degrees they believe to have better employment prospects. Such an argument is reinforced by the fact that Portugal has undergone a period of economic recession, with high unemployment rates, which may have led students to prioritise employment prospects when choosing a degree.
In light of this decline in astronomy students Centro de Astrofísica da Universidade do Porto (CAUP), which, together with the
University of Porto, has the role of training new astronomers, has developed and joined several initiatives aiming to reverse the downward trend in student numbers. Some of these activities try to stimulate preuniversity students’ curiosity and interest in astronomy, whilst others debunk common myths about employability1, 2. This paper presents one such activity — a weeklong summer programme — its evolution over the last three years and an analysis of the evaluation data captured from the programme.
The University of Porto already has a programme which introduces eleven to seventeen year olds to the university environment. This programme, entitled Junior University, has been running since 2005, with the primary model being weeklong activities held in July, plus three sub programmes (Ferreira Gomes, 2007 and Marques, 2010). Around 5000 students participate in the programme every year, making it the largest such initiative in Portugal.
For the youngest students, the Try it in the Summer subprogramme includes daily activities exploring different fields of knowledge including science, arts, philosophy and history. Students rotate across these daily activities during their week in Junior University. In 2015, there were six groups of different activities. CAUP has been participating in this programme for several years with a daily activity dedicated to the Solar System.
Students in the thirteen to fourteen age bracket can enrol in the Summer Work shops which are also made up of activities
Bes
t P
ract
ices
KeywordsHands on activities, summer school, informal education
Pedro MondimPlanetário do Porto — Centro Ciência Viva, Instituto de Astrofísica e Ciências do Espaço (IA)[email protected]
A Week-long Summer Programme in Astronomy for High-school Students
6 CAPjournal, No. 21, December 2016
A Week-long Summer Programme in Astronomy for High-school Students
also provides students with information regarding the training opportunities in astronomy available at the University of Porto. The weekly schedule of this activity is summarised in Table 1 and presented in more detail below.
Each day starts with a theoretical lecture providing mathematical tools and basic physics knowledge which students will need during the week. As the students are spread across three different school years and so have different levels of knowledge of physics and mathematics these lectures are a vital way of ensuring all students have the knowledge needed to get the most out of the course and the experimental activities that follow the lectures each day. The lectures are presented by CAUP researchers who also teach undergraduate and graduate courses in astronomy at the University of Porto.
The last day also starts with a lecture followed by experimental activities but the afternoon is spent in a brief presentation of the training opportunities in astronomy at the University of Porto and watching two shows at Porto Planetarium.
The course also includes a night sky observation. The observation is always scheduled for the first night but this is subject to change according to weather conditions. If weather conditions do not allow the observation to take place on any of the nights — something that has only happened once in three years — the students can still enjoy a demonstration of the night sky inside Porto Planetarium.
Description of the lectures and experimental activities
There are currently twelve experimental activities performed over the course of the week. Some of the experiments were adapted and expanded from programmes already available as handson laboratories for schools at Porto Planetarium but most of them were developed specifically for the course, inspired by resources available online and from the author’s own work.
Some activities simply test physical and astronomical concepts and are then linked to work carried out by astronomers during discussion of the results, but wherever possible the experiments were developed
Monday Tuesday Wednesday Thursday Friday
Theme
Stars, planets and properties of light
Stars, planets and properties of light
Galaxies and large scale structures
The fundamental forces of Nature
Observations and technology
Morning
Properties of light
Formation, evolution and death of stars
The Miky Way and other galaxies
Cosmology
Telescopes and astronomical observations
The fingerprints of Stars
Comparing brightness
Colouring astronomicalpictures
Gravity in action with a torsion balance
Building a sundialand an astrolabeBlack holes’
properties
Afternoon
Parallax
Solar observation and rotation period
Building a Hubble sequence
Determining the speed of light
Presentation of astronomytraining at Univ. Porto
Searching for exoplanets
Light — our window on the Universe
Planetarium shows
NightNight sky observation
Alternative date fornight sky observation
Alternative date for night sky observation
Alternative date for night sky observation
Alternative date fornight sky observation
Table 1. The weekly schedule of the activities. The experimental activities are written in blue for clarity.
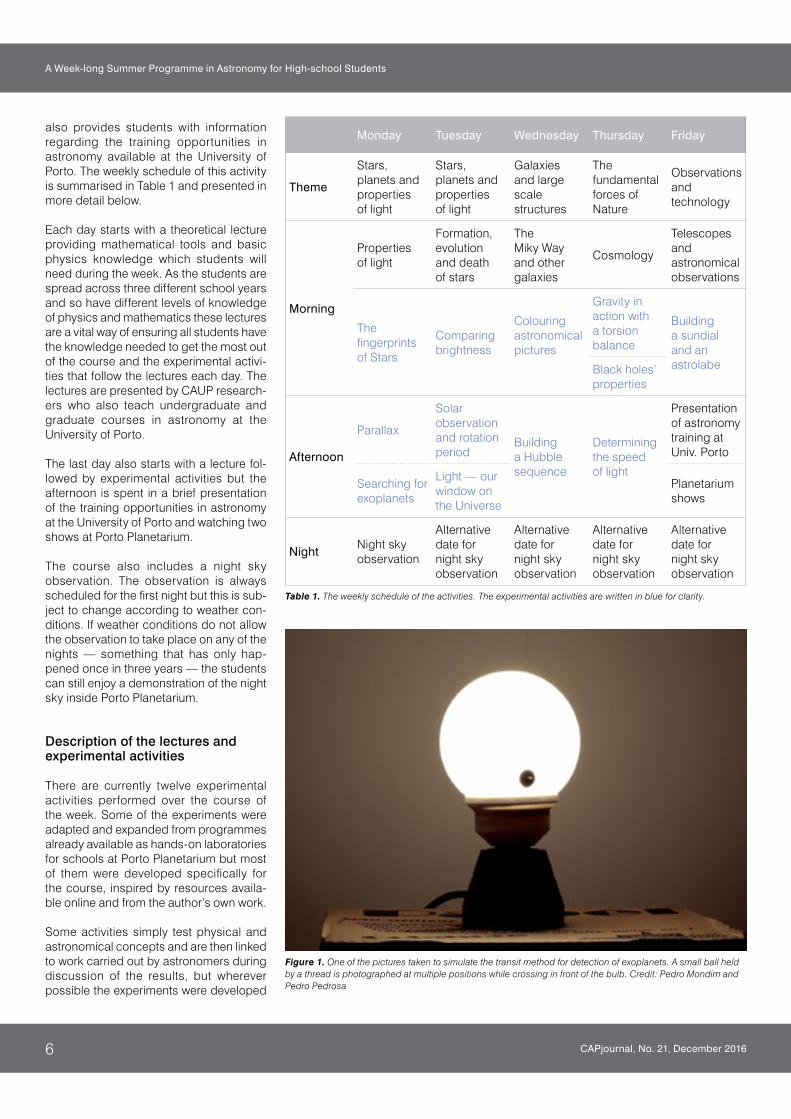
Figure 1. One of the pictures taken to simulate the transit method for detection of exoplanets. A small ball held by a thread is photographed at multiple positions while crossing in front of the bulb. Credit: Pedro Mondim and Pedro Pedrosa

7
CAPjournal, No. 21, December 2016
A Week-long Summer Programme in Astronomy for High-school Students
Thursday — lecturesThis lecture presents some basic cosmology concepts, and discusses the history and evolution of the Universe and the main properties of the fundamental forces of nature. Developing experimental activities for cosmology proved to be a challenge and therefore this day’s experiments deal with just one of the topics of the lecture: the gravitational force.
Thursday — activitiesGravity in action with a torsion balanceWhile the effects of gravity are quite clear in astronomy, it is difficult to gain a reasonable idea of gravity’s effects between small objects. This experiment allows students to actually observe such effects. They also compare gravitational and electric forces, doing some simple calculations. The torsion balance in this activity is based on the one described by John Walker9.
Black hole propertiesIn order for students to better grasp the order of magnitude of the sizes and masses of black holes they use the Schwarzschild radius equation to estimate the properties of black holes.
Determining the speed of lightThe entire afternoon is devoted to this activity, adapted from the work of Jan Paul Dabrowski and other collaborators at Gettysburg College10. Its aim is to better prepare students for the reports they will be required to write in school and university. This is done by having students determine the speed of light, using Rømer’s method, and then write a report. This report is read by the author and discussed with each group the following day, providing detailed feedback and suggestions for improvement.
Friday — lecturesFriday’s lecture is devoted to telescopes and astronomical observations and is somewhat longer than the others as several astronomical instruments are displayed and manipulated by the students during the lecture.
Friday — activitiesBuilding a sundial and an astrolabeThis activity was developed to show students how astronomical concepts and data can be used to provide useful information for our daily lives, namely, time and orientation, and also how simple materials can be used to build astronomical instruments.
Tuesday — activitiesComparing brightnessThis activity was inspired by the work of Paul Doherty6 and is used to allow students to better understand the concepts of magnitude and measurements of a star’s brightness, which have already been presented in the first lecture.
Solar observation and rotation periodIn this activity, students are shown some of the phenomena that take place in a stellar atmosphere (like sunspots and prominences) and how they can be used to determine a star’s rotation period. The teaching of how to determine the rotation period is similar to the description available in protocols online7, but makes use of digital images of the Sun.
Light — our window on the UniverseThis activity was adapted from a handson laboratory already available at Porto Planetarium3 and with it we expect students to be able to understand refraction, total internal reflection, specular reflection and diffraction and how these phenomena can be used to build astronomical instruments.
Wednesday — lecturesThe Wednesday lecture presents a qualitative overview of the Milky Way’s properties and dynamics as well as galaxy formation and interaction models.
Wednesday — activitiesColouring astronomical picturesMost students have no idea how the astronomical pictures shown in the media are produced and imagine that astronomers always work with coloured pictures. This activity challenges these assumptions, explaining how coloured pictures are obtained and letting the students apply some techniques to compose coloured astronomical pictures. Several stepbystep guides to producing coloured images can be found online8.
Building a Hubble sequenceAlthough the morphological classification of galaxies is discussed in this day’s lecture, this activity reinforces the topic, challenging students to try and classify galaxies themselves. Afterwards, each student selects their favourite Hubble sequence and receives their own A3sized copy of their chosen Hubble sequence.
to be as similar as possible to experiments actually carried out by astronomers.
Monday — lecturesAt the beginning of the week, each student receives a guide that provides, for each experiment they will perform, a short theoretical introduction, the experimental protocol and extra space for recording results, performing calculations and taking notes. The students are guided throughout their activities by the author, an astronomy outreach professional, and also by another guide with a collegelevel education in astronomy.
After a short introduction to the course, the week starts with a lecture on techniques used to measure astronomical distances, on the concepts of brightness, luminosity and magnitudes and also on stellar spectra and the Hertzsprung–Russell diagram.
Monday — activitiesThe fingerprints of starsThis activity, adapted from a handson laboratory experiment available at Porto Planetarium (Mondim, 2010), has the goal of showing the students the major role played by spectroscopy in astronomy and some of the information astronomers obtain from it.
ParallaxThis activity, which was also adapted from a handson laboratory experiment available at Porto Planetarium3, leads the students to think about how astronomers are able to measure distances, providing an example of one of the several available methods.
Searching for exoplanetsExoplanets, whilst a major focus of modern astronomy, are not explicitly presented in any of the lectures but that is compensated for by a theoretical introduction to this activity, after which students use the transit method to determine the presence of a planet around a star and estimate its size (Figure 1). This activity was developed from scratch by the author but related experiments can be found elsewhere4, 5.
Tuesday — lecturesThe Tuesday lecture focuses on the techniques used to measure the velocity of an astronomical body, and then qualitatively describes the formation, evolution and death of stars.

8 CAPjournal, No. 21, December 2016
A Week-long Summer Programme in Astronomy for High-school Students
had increased a lot or increased somewhat how much they like astronomy is remarkable (80.9%) and only one student over the three years said it had actually decreased his interest. Over 70% of participants reported that the effect of our programme had increased their perceived likelihood of enrolling in the astronomy degree, while this likelihood remained the same for 27% of the students and decreased somewhat for just 2.2% of students. However, it is not yet known if these effects are sustained over time and if students actually end up enrolling in the astronomy degree, as only a small number of those who participated in this programme have finished high school and applied to universitylevel degrees. So far, only eleven of our students have applied to university level education; of these, four enrolled
Effect on uptake and interest in astronomy
Analysing the survey results we have found that, of the students who attended the programme over three years, 43.8% had just finished a school year spanning ages fourteen to fifteen. In comparison, 38.2% had just finished a school year spanning ages fifteen to sixteen and only 18.0% had finished a school year spanning ages sixteen to seventeen.
Students were questioned about how this activity had changed their view of astronomy and if their perceived likelihood of applying for an astronomy undergraduate degree had changed. The results are shown in Figures 3 and 4. The percentage of students who stated that this activity
The sundial is built using a precut piece of cardboard which has to be assembled and glued (Figure 2), while the astrolabe is built according to a technique described online11.
Presentation of undergraduate and graduate astronomy programmes
As one of the main goals of this programme is to increase the number of students enrolling in undergraduate and graduate programmes in astronomy, at the end of the week we present them with the options available at the University of Porto. This presentation is led by the director of the astronomy undergraduate degree who also discusses the employment and career options for people with academic degrees in the field of astronomy.
The programme ends with two shows inside Porto Planetarium, one on dark matter and the other on the origins of life.
Evaluating the course
At the end of the week, just before the planetarium shows, each student completes a questionnaire to evaluate this programme. From 2016 students will also fill out an additional questionnaire on the first day to provide a baseline and allow for better evaluation of the programme’s effects. The questionnaires are filled in anonymously and the students’ comments over three years have led to several changes to the global organisation of the programme (described below) and in the theoretical lectures and experimental activities themselves. However, another important goal of these surveys is to understand if the activities have actually had any influence on the willingness of the students to enrol in undergraduate studies in astronomy.
All the students who participated in this programme — 89 over the three years the activity was held — were required to fill in the questionnaire on the last day of the activity. The number of students is higher than the maximum number of students officially allowed to attend a Junior University course (sixteen) as high demand has led to an increase in available vacancies for Astronomy: from concepts to practice. The average rating students gave to this programme was 4.57 on a 5point scale.
Figure 2. Sundials built by the students during the last day of the programme. Credit: Paulo Pereira
58.4%
31.5%
9.0%1.1%
I now like astronomy much moreI now like astronomy somewhat moreIt didn’t change how much I like astronomy I now like astronomy somewhat lessI now like astronomy much less
16.9%
53.9%
27.0%
2.2%
I’m now much more willing to applyI’m now somewhat more willing to apply It didn’t change my willingness to apply I’m now somewhat less willing to apply I’m now much less willing to apply
Figure 3. Answers to the question “How did this programme change how much you like astronomy?” from surveys over three years.
Figure 4. Answers to the question “How did this programme change your willingness to apply to the astronomy degree?” from surveys over three years.

9
CAPjournal, No. 21, December 2016
A Week-long Summer Programme in Astronomy for High-school Students
8 Levay, Z. Create your own Color Hubble Images. Available at: http://hubblesource.stsci.edu/services/articles/20050210/
9 Walker, J. 1997, Bending spacetime in the basement. Available at: http://www.fourmilab.ch/gravitation/foobar
10 Dabrowski, J. P. et al. Jupiter’s Moons and the Speed of Light. Project CLEA, Gettysburg College. Available at: http://www3.gettysburg.edu/~marschal/clea/roemerlab.html
11 The Editors of Publications International Ltd. Science projects for kids: The Incredible Universe — Make an astrolabe. Available at: http://lifestyle.howstuffworks.com/crafts/ otherartscrafts/scienceprojectsforkids theincredibleuniverse6.htm
References
Ferreira Gomes, J. 2007, Universidade Júnior, a project to motivate school pupils, Proc. International Conference on Engineering and Computer Education, ed. Brito, C. R. et al., 199, available at: http://www.fc.up.pt/pessoas/jfgomes/documentos/documentos/Universidade%20Junior,%20a%20project%20to%20motivate%20school%20pupils%20%20JF%20Gomes.pdf
Marques, J. & Restivo, M. 2010, Working with young people at the University of Porto, Proc. Joint International IGIPSEFI Annual Conference 2010, available at: www.sefi.be/wpcontent/papers2010/papers/2394.pdf
Mondim, P. et al. 2014, CAPjournal, 15, 28, available at: http://www.capjournal.org/issues/15/15_28.pdf
most students’ willingness to apply for the astronomy degree and to improve their opinions about astronomy. The high rating the programme received (4.57/5) also shows that it meets or perhaps even surpasses the students’ expectations.
This activity will be offered once again to students next summer for two weeks, with minor rearrangements to theoretical lessons and with a programming activity replacing the one using the torsion balance. The author expects to keep applying further changes to the programme in the following years according to the future feedback given by the students and the author’s opinion of what could be improved in the different lectures and experimental activities.
Acknowledgments
The author would like to thank Filipe Pires and Ricardo Reis, for their collaboration in planning the experimental activities and Carlos Martins, Catarina Lobo, João Lima, Jorge Gameiro, Paulo Maurício de Carvalho, Pedro Avelino and Ricardo Reis for the presentation of the theoretical lectures.
Notes
1 Webpage of the 2016 edition of Dia da Astronomia, in Portuguese, available at: http://www.astro.up.pt/formacao/index.php?WID=361&CID=17&Lang=pt
2 Webpage of the Show of Porto University in which CAUP participates, in Portuguese, available at: http://www.mostra.up.pt/
3 Porto Planetarium handson laboratories, in Portuguese, available at: http://planetario.up.pt/planetario/laboratorios.html
4 Detecting Extrasolar Planets (2007), available at: http://kepler.nasa.gov//files/mws/DetectingTransitsSSSmsGEMS.pdf
5 Bertone, S. and Melchior, A. L. 2011, Astronomy with SalsaJ — Discover an exoplanet: the transit method. Available at: http://www.euhou.net/index.php/exercises mainmenu13/astronomywithsalsaj mainmenu185/269discoveranexoplanet v15269
6 Paul Doherty, Solar Brightness, available at: http://www.exploratorium.edu/wsw/ progress_snacks/solar_brightness/
7 Teacher Guide, Activity 4: Rotation Period of the Sun (1999). Available at: http://www.spaceweathercenter.org/resources/05/solarscapes/Act4t.pdf
in nonscientific degrees, two enrolled in aerospace engineering at another university, two enrolled in physics at another university and three enrolled in the physics degree at the University of Porto. It should be noted that one of the measures taken by the University to ensure the continuity of the astronomy training programmes was to merge the astronomy degree into the physics degree as an option available for students to choose in their last year. Thus, our students have been informed they should opt for the physics degree at the University of Porto when seeking a career in astronomy.
Updates to the course based on feedback
In the questionnaire, students were asked about the experimental activities and lectures and about several organisational aspects of the programme.
The results have led the author to implement several changes over the years. The cosmology lecture was replaced by a simpler version: it became essentially descriptive, with a very limited quantitative content, as the original version was deemed by the students to be too hard to grasp.
The extragalactic astronomy lecture was somewhat refocused towards galaxies, with just a couple of minutes dedicated to the largescale structure of the Universe and it was also changed to present a more detailed description of Sagittarius A*, the central black hole in the Milky Way.
The lectures of the first two days were reorganised to allow a chapter devoted to star formation, evolution and death.
Regarding changes in experimental activities, the optics experiment was simplified, as it originally included a protocol for critical angle estimation that was not easily understood by the students. Two new activities were also developed and added, after the first year, to reduce downtime, as the author realised some activities took less time than expected.
Conclusion
This programme seems, based on evaluation so far, to provide a major boost to
Pedro Mondim works at the Centro de Astrofísica da Universidade do Porto (CAUP), the association that manages the Planetário do Porto — Centro Ciência Viva and is the host institution for the Instituto de Astrofísica e Ciências do Espaço. He is involved in many astronomy outreach activities for the general public and especially for students. He regularly presents planetarium sessions, develops new experimental activities and guides students in the handson laboratories. He previously worked as a trader in investment banking, while finishing his Masters degree in astronomy, and is currently finishing a medical degree.
Biography

10 CAPjournal, No. 21, December 2016
Selling a Story: How to Write a Successful Press ReleaseBes
t P
ract
ices
Elizabeth PearsonNews Editor, BBC Sky at Night [email protected]+44 1173 148 759
KeywordsMedia, press release
Press releases are an important part of communicating new discoveries with the general public. However, if they are confusing or difficult to read then they are unlikely to be picked up by media outlets. This article details how to create a successful press release by addressing a series of points: learning how to identify the audience; writing text that is both eye catching and clear; including multimedia and contact details; getting your press release to the media; and timing.
Editors also love superlatives: first, best, biggest, fastest, furthest. If you can find one, then it should absolutely be included, but do not twist a story just to create one as it will only lead to confusion and misreporting.
If by the second or third paragraph all three of these questions have been answered then you are off to a good start.
The rest of the story
Once you have established what the story is in the first few paragraphs, start going into the details. Get the important facts out first then move onto the whys and wherefores of how the research was done, ensuring you include details of all the telescopes, instruments and organisations that were involved. You should also ensure that there is a forwardlooking part which details what comes next and how this new result will impact the field from now on.
Being too technical is the bane of most efforts to communicate science to the public. Press releases are no different. The most important thing at this stage is not to get lost in a sea of impenetrable jargon, technical terms and bad English. Remember, most of the editors and writers reading the release will not be experts in the given field, and may not have a scientific background at all. They could be receiving hundreds of releases a day, so if the press release cannot be understood on a quick pass, then it runs the risk of being overlooked, or reported incorrectly. By all means use technical terms, but make sure you explain them clearly as soon as they appear.
How to write a press release
The media are becoming increasingly captivated by astronomy, with mainstream channels devoting more air time and column inches to the field while smaller specialist blogs and websites are gaining growing audiences. And they are always hungry for more stories. One of the classic ways of making sure a paper is reported on is via the publication of a press release. However, if this fails to captivate the editor or writer reading it, it is going to get thrown out immediately. This article will lay out how best to ensure your press release is not one of those that is passed over.
Know your audience
The first question writers ask themselves is who is the audience? Writing a press release is no different. Identify who you want to appeal to: the mainstream media or a specialist site? Television? Radio? Online? Print?
Once you know this, keep it in mind throughout the process of writing a press release. Mainstream media want easily accessible stories about things that are ground breaking, so a press release to them needs to sell the importance of the discovery. Specialist publications want to be able to delve into the details and show their expertise, so it is important to include the facts and figures.
Get off to a good start
There are three questions which need to be answered as soon as possible: What is the story about? Why is it news? Why do we care?
“What is the story about?” should be answered in the headline. Make it clear what the story is about. Occasionally a witty headline might catch an editor’s attention, but it will likely be passed over if they cannot see what the story is. There have been several cases where a badly worded introduction has led to a finding’s being widely misinterpreted, such as the University of Exeter’s release “Rotten Egg Gas Holds Key to Healthcare Therapies” which was transmuted into the incorrect (but more click worthy) “Farts Cure Cancer”1.
“Why is it news?” means describing what it is that makes this result worthy of report over the next paper in the journal. To be news, a finding has to create some shift in the way we understand the Universe, so make sure the reader knows what that is.
“Why do we care?” asks what it is that will make people stop and read the story. Answering this depends on the audience you are appealing to. Generalist media tend to pick up only science stories that either have a profound but understandable effect on our understanding of the Universe, or directly affect the person in the street, or tap into people’s dreams, like space travel, aliens or anything that appears in science fiction. Specialist science and space media care about much smaller stories, but they must still have some element of interest beyond being another new result.

CAPjournal, No. 21, December 2016
11Selling a Story: How to Write a Successful Press Release
imposed on it, or an interview with one of the researchers, will make a story stand out.
Contact is key
Even if you fulfil all the above steps, there will always be something left out that an editor wants and if they cannot contact the relevant people then the story may be unusable. Make sure you include contact details for both the press officer in charge of the release and several, if not all, of the researchers referenced and quoted in the article. The latter will hopefully be inundated with requests for further interviews, so make sure they are okay with that before including their contact details.
If you have access to radio or television recording equipment through your institution or otherwise, list this as well.
Getting out there
Most press releases that I receive come through news distribution agencies that act as middle men between the media and researchers.
The American Astronomical Society has a forwarding list that goes out to over 2000 reporters and public information officers at no charge. This does not have much mass appeal, but it is great if you are targeting space enthusiasts.
of the nebula being studied for instance. However, if the report is on theoretical work on dark matter then it might be trickier.
There are thousands of artists’ impressions that are free to use courtesy of NASA, ESA, ESO and other space agencies. Half an hour of hunting should turn up something usable, though be sure you have the right to use it.
If your budget can stretch to it, it might be worth commissioning your own artist’s impression. The price for this varies depending on the artist and usage agreement, but costs are usually around a few hundred US dollars.
If there is nothing that will suit, include an image of the telescope used, or a shot of the researchers at work on the task.
Any image supplied needs to be as large as possible; roughly 3000 pixels for print or 1000 pixels for web. If the image contains any annotations or markings, then there should be an unannotated copy available as well so that labels can be added in the house style. It is also advisable to have some good quality headshots of researchers on standby should anyone request them, as some house styles require portraits of interviewed experts.
Video is also a great bonus, and not just for television. As news moves online, short videos can really help to popularise a story, particularly on social media. A short visualisation with some of the facts super
That said, it is important to ensure you still say something definitive. People often believe that simplifying for a lay audience requires stripping out all the details. Sentences such as “this will teach us a lot about the Solar System” or similar, while true, tell me nothing: what will it teach us? How? Why is it important to know?
If you want your release to become a news article, quotes from the people involved are an absolute must as they give stories authority. Make sure that every key point in your press release has a matching quote to go with it.
A human angle can also lift an otherwise mundane story to a much more interesting level. Stories that involve members of the public or young people always do well, as do ones with an anecdote or two. Something along the lines of “we came up with the idea over a beer” or “we nearly lost all our work because someone didn’t back it up” can connect the reader to the story and is the kind of thing writers look out for.
Multimedia
Any news story is about more than mere words. Images, videos and sound clips not only help to tell the narrative, but draw attention to the story as well.
For all media bar radio, images are an absolute must and if none is supplied it can be grounds for dropping a story. Sometimes this is easy: a beautiful shot
Figure 1. Artists’ impressions are a useful way to illustrate topics where the source observations, while scientifi-cally interesting, aren’t particularly visually arresting. There are many sources that give away impressions of gen-eral topics such as the black holes above, but if you want your discovery to stand out it might be worth commis-sioning one. Credit: NASA
Figure 2. A screenshot from an embargoed press release on EurekAlert. Releasing a story early, but under embargo, is a good way to ensure that your story hits the news at the best time. When signing up to a news dissemination site, such as EurekAlert, jour-nalists agree to respect the embargo, so you need not worry about your work leaking early. Credit: EurekAlert

12 Selling a Story: How to Write a Successful Press Release
CAPjournal, No. 21, December 2016
Notes
1 University of Exeter’s “Rotten Egg Gas Holds Key to Healthcare Therapies” press release: http://www.exeter.ac.uk/news/research/title_393168_en.html
2 EurekAlert: www.eurekalert.org3 AlphaGalileo: www.alphagalileo.org4 Newswire: www.newswire.com5 ResponseSource: www.responsesource.com6 Vuelio: www.vuelio.com
If you want a wider appeal then there are many agencies that distribute general science such as EurekAlert2 and AlphaGalileo3, or general news, like Newswire4. There is usually a fee associated with these services, so your institution may already subscribe to a specific one.
Some researchers prefer to contact press officers directly. Press listings, such as ResponseSource5 and Vuelio (UK centric)6 can supply contact details for most media outlets. A phone call to a specific editor ensures they know about your release, though some writers find the practice annoying.
Timing
Timing can be vital when considering a press release. Most news outlets will look for stories within usual working hours. Even 24hour news outlets will do the bulk of their news finding during the day. Most editors will decide what they are going to cover in the morning, then spend the rest of the day working on it. If something comes in at 5pm, it won’t get looked at until the next day, at which point it has already become outdated. Releasing the story early under embargo, giving the media time to write it up without its becoming irrelevant, can help with this problem. However, if the embargo is longer than 24 hours then there is a chance that the story will be forgotten about.
News tends to operate on a yearly cycle, and some months are lighter on news than others. Astronomy news is often seen by the mainstream as ‘soft’ news. The less hard
news there is, the more likely it is that an astronomy story will make the cut. Most countries will have a month or so in the year when the government is taking a break or similar, meaning there are fewer political and business news stories, so if possible it might be best to release during this time.
There is also a drop in the number of sciencerelated press releases being sent out between June and September in many countries, when universities have their summer breaks. This can mean that specialist publications are left with few stories to cover, and it improves the chances of yours being selected.
There are many factors that can determine whether or not a press release is picked up for further reporting, but following these steps should help to give yours the best chance.
MWC 758 (HD 36112)ESO/VLT
Size ofNeptune’s Orbit
N
E100 au
0 .37
NASA, ESA and ESO STScl-PRC15-40a
Protoplanetary Disk Simulated Spiral Arm vs. Observational DataESO/VLT
Location of Planet
SimulationMWC 758ESO/VLT
Figure 3. An image of engineers David Pearson and William Taylor used to illustrate a feature about the role of engineers in astronomy. Sometimes a human angle can lend relevance to an otherwise distant topic. For a press release about the work of engineers at the UK Astronomy Technology Centre, as in this case, it might be worth including an image of the engineers involved. Credit: Dr David Pearson
Figure 4. If you are supplying a compilation of several images which are annotated, it is a good idea to also supply the individual images in a clean format. Credit: NASA, ESA, and Z. Levay (STScI)
Elizabeth Pearson is News Editor for BBC Sky at Night Magazine. She obtained her PhD in Extragalactic Astrophysics from Cardiff University.
Biography

13CAPjournal, No. 21, December 2016
Astronomy on Tap: Public Outreach Events in Bars
Astronomy on Tap public outreach events are as easy to organise or as elaborate as you would like them to be. In addition to communicating cuttingedge research and fundamental concepts to the public, Astronomy on Tap events showcase the passion, creativity and diversity of scientists, facilitate personal and meaningful interactions between scientists and the general public, and offer networking and professional development opportunities for scientists. Astronomy on Tap organisers provide a growing cadre of resources for starting similar events, which have so far taken place in twenty locations around the world, mainly in the United States but also in Canada, Chile, and Taiwan, reaching a total of almost 15 000 people. Through this reflection on the Astronomy on Tap project we invite you to consider whether you could adopt aspects of the Astronomy on Tap model for existing outreach programmes, or even organise a new satellite event in your location.
Bes
t P
ract
ices
Emily L. RiceCollege of Staten Island, City University of New [email protected]
Keywordspublic outreach, public engagement, science communication, adult education, informal education, professional development, networking
Background and goals
Adults in the United States who have finished formal schooling generally spend less than 5% of their lives in formal learning environments. Informal learning, however, can encompass a variety of experiences and tap into notions of lifelong, lifewide (across different social settings), and lifedeep (exploring cultural and community values) learning, as detailed in the National Research Council’s Learning Science in the Informal Environment report (NRC 2009). The same report also identifies the best qualities of informal science learning, stating that it should be exciting and engaging, and should encourage sensemaking and reflective practice, participation, and identity building.
Nearly threequarters of American adults consider themselves lifelong learners, and a similar percentage are personal learners, in that they engage in activities to advance their knowledge based on personal interest. Over 80% of personal learners cite a physical location as the venue for that learning (Horrigan, 2016). Recent reports on the expanding nature of science engagement programming have pointed to the need not only for content, but for presenting it in engaging ways that reach wider audiences, both public and professional (Kaiser et al., 2014). Events should be flexible in terms of the physical spaces in which they run, and audiencecentric,
Introduction
Astronomy on Tap (AoT) is a network of free public outreach events featuring engaging science presentations in bars, often combined with music, games, and prizes for a fun, interactive atmosphere. The events are held in bars and other social venues in order to bring science directly to the adult public and to engage a broader adult audience than typical lectures held at academic and cultural institutions. Each event, typically held on a weekday evening, features several short astronomyrelated presentations, primarily led by professional scientists but also by engineers, educators, writers, and artists. There is ample time for questions and conversations between presenters and the audience throughout the event with a dedicated question and answer session and/or panel discussion in every event. Organisers further encourage interactivity by offering small rewards for questions, playing games like trivia or bingo as part of the event, and awarding sciencerelated books, DVDs and posters as prizes.
Over 150 AoT events were held between April 2013 and March 2016, including regular events in over a dozen locations and several singular events (see Table 1)1. Events continued at a rate of around ten per month. These have attracted extremely positive feedback from presenters, attendees, and venues, all without significant
funding. We provide organiser and presenter guides and other resources for new organisers, and our model of events is easy to customise based on the interests and resources of local organisers and their community.
Brian W. LevineAmerican Museum of Natural [email protected]
Figure 1. The original Astronomy on Tap logo designed by Alex Parker (Southwest Research Institute) featuring the Hubble Ultra Deep Field (NASA, ESA, S. Beckwith [STScI] and the HUDF Team), based on an image created for the Pub Astronomy podcast by Renée Hlozek (University of Toronto) and Chris Lintott (University of Oxford). Many AoT “satellite” locations have designed their own logos based on the astronomy-image-in-a-glass concept.

14 CAPjournal, No. 21, December 2016
Astronomy on Tap: Public Outreach Events in Bars
senters to use informal language and tone and to include pop culture references or add interactive elements, like demonstrations, whenever possible in order to make their presentations accessible and engaging to the general public. An emphasis on cuttingedge research in presentations can convey science as an ongoing and everevolving endeavour. While we don’t (yet) track audience outcomes, we evaluate the success of the events based on attendance, perceived audience engagement and participation, and feedback received in person and via social media. In particular, organisers have noticed positive reactions from nonexpert audience members when a professional scientist admits they do not know the answer to a question, or that no one yet knows. Furthermore, organisers strive to showcase presenters from all genders, ethnic backgrounds, career levels, and types of institutions and they encourage presenters to include personal and creative aspects in their presentations. This exposure to scientists as individuals, and the opportunity to interact with them in a social setting, is often a rare and invaluable experience for attendees.
AoT also provides networking and professional development opportunities for scientists at many levels. Most AoT events take place in cities with multiple academic and cultural institutions and thus provide networking opportunities for scientists from different institutions in addition to interactions with the general public. The format of multiple short talks also means
connecting the audience and the scientific community in ways that are customised to their wants and needs (Durant et al., 2016). Along these lines, the primary goals of the AoT events are to:
1. Communicate cuttingedge research and fundamental concepts in science, including astrophysics, planetary science, Earth science, and other related fields, directly from scientists to the public in exciting and engaging live performances.
2. Convey the accessibility, relatability, creativity, diversity, and humanity of science and scientists to the public.
3. Provide opportunities for scientists to practise communication and presentation skills for nontechnical audiences in a lowpressure atmosphere.
4. Enable networking among scientists, students, professionals in related fields, and members of their local communities.
The key to AoT is the relaxed, interactive environment. The motivation for having events at a bar or other social venue, instead of at an academic or cultural institution, is to bring science into the everyday life of the general public. In doing so, we aim to reach people who might be intimidated or discouraged by the traditional venues of science outreach. Events are structured to encourage interactions between scientists and the public via questions during and/or after the presentations and also the more extended conversations that are possible because of the open, social venue. We encourage questions from the audience by rewarding those who ask questions with token prizes, thereby explicitly emphasising that questions are fundamental to the pursuit of science and implicitly alleviating the pressure to “do well” — to ask the right questions, or to behave in the right manner — which can be a barrier to developing further interest in the subject matter (NRC, 2009; Hidi & Renninger, 2006). There are typically additional scientists in attendance other than the presenters, and they can be given the option of identifying themselves as available for questions and conversations with lanyards, wristbands, nametags, or even with a sticker that reads “Ask Me About !” filled in with their area of expertise. Both the scientists and the audience members appreciate opportunities to interact in smaller groups or oneonone in addition to the presentations.
This type of informal environment has been shown to promote learning and is also evident in programmes such as Pint of Science, Café Scientifique, and Nerd Nite events. Key aspects of the format include the supportive, lowpressure nature of events, the audience members’ choice of learning in their leisure time, and personal relevance to the audience through encouraging and rewarding questions, pop culture references and more (Falk & Dierking, 2002). AoT events are similar to Nerd Nite events in that they typically feature multiple presentations along with games/trivia and prizes, but AoT is unique in its narrower focus on astronomy and related topics with the majority of presenters representing practising scientists from a range of institutions, career levels, and areas of expertise. Additionally, AoT blends aspects of science, art, performance, and comedy, tapping into what is recently being recognised as a cultural phenomenon (Kaiser et al., 2014).
The informal, entertaining nature of AoT leverages astronomy as a “gateway” science (Muñoz, 2013) to inspire public interest in, and appreciation of, scientific research. The presentations often include: foundational physics concepts like light and spectra, fundamental forces and particles, sounds waves and seismology, and spacetime curvature; research tools such as telescopes, colliders, spacecraft and computing; and results from research, both specific to the presenter and from other areas. As organisers, we encourage pre
Figure 2. AoT “Uptown” (New York City) organisers Jeff Andrews (left) and Adrian Price-Whelan (centre) with Duane Lee (right), all Columbia University graduate students at the time, at an October 2013 event. Credit: Emily Rice

15
CAPjournal, No. 21, December 2016
Astronomy on Tap: Public Outreach Events in Bars
that several different topics will be presented (optionally organised around a theme), and scientists can benefit from this exposure to research outside of their subfield. Events often include visiting scientists and presenters from other fields (engineering, education, writing, art, etc.) allowing for even broader exposure and networking opportunities. The typical format of multiple short talks combined with the informal, social nature of the events allows presenters to experiment with their presentations in a lowstress environment. Presenters have to actively maintain the audience’s attention so vocal projection and stage presence are required even more than in a typical academic presentation. We suspect that practising these skills in a bar can help scientists improve the quality of their presentations in other venues as well.
Formation, expansion, and organisation
AoT began with two events called “Astronomy Uncorked” in New Haven, Connecticut, USA in 2012. They were organised by Meg Schwamb, who was at the time a postdoctoral fellow at Yale University. She initiated events in New York City (NYC) starting in April 2013 and continued them with the help of Emily Rice. By the end of the year there were nine AoTbranded events in New York City, including two “AoT Uptown” events organised by Columbia University graduate students and the first “Astronomy
on Deck” in the Space Shuttle Pavilion at the Intrepid Air, Sea, and Space Museum with over 400 people, and two events in Columbus, Ohio, USA organised by Demitri Muna.
A reflection on the first year of events was presented in a poster at the 223rd American Astronomical Society (AAS) meeting. This garnered tremendous interest, and by the end of 2014 regular events were established in New Haven (Connecticut, USA), Toronto (Ontario, Canada), Santiago (Chile), and Austin (Texas, USA) (Rice et al., 2014). In 2015 events began in Seattle (Washington, USA), Denver (Colorado, USA), Rochester (New York, USA), Baltimore (Maryland, USA), Lansing (Michigan, USA), Tucson (Arizona, USA, a rebranding of events formerly known as Space Drafts), Washington (DC, USA), and Ann Arbor (Michigan, USA). Also in 2015 several new organisers were inspired by a presentation given by AoT organisers at the International Astronomical Union (IAU) General Assembly in August (Livermore & Silverman, 2015).
An overview of the expanded AoT community was presented in a second AAS poster in January 2016 (Rice et al., 2016) and by March 2016 events had begun (Urbana and Chicago in Illinois and Santa Barbara and Palo Alto in California, all in the USA). The hope is that by improving the coordination of procedures and resources described below, we will provide support
for further expansion of existing events and new locations around the world.
Coordination of the independent “satellite” locations (pun intended) is led by Emily Rice, Demitri Muna, Jeffrey Silverman, Rachael Livermore, and Meg Schwamb. Online resources for satellite locations are developed and disseminated for event planning and promotion. This is done through the website2, social network accounts of AoT and the satellite locations themselves, and a “Host Stars” (organisers) Google group.
Currently only a few locations conduct audience surveys for demographic information and event evaluation, but organisers are planning on adding procedures for tracking attendance, conducting audience surveys, and obtaining presenter feedback to our advice package, known as the Launch Manifesto.
Summary of existing satellite locations
Satellite events are run independently, with local organisers adapting the suggested guidelines to suit their resources, presenters, and local community. In some locations events take place monthly, while in others they are held every 2–3 months. Several locations have switched, or rotate through, venues, some in search of bigger space and/or better equipment and some in order to reach different geographical populations. Organisers are most typically postdoctoral researchers or graduate students but can also be science and/or outreach staff and science educators.
The first satellite locations were started by scientists who had presented at (or attended) an AoT and then moved to another city, or who learned about the events through visiting scientists. The expansion of the AoT universe has been accelerated by several presentations at research conferences, including the AAS and IAU (Rice et al., 2014; Livermore & Silverman, 2015; Rice et al., 2016). Interestingly, a nonastronomer who had attended an event in NYC initiated the satellite location in Denver, Colorado, USA. Table 1 summarises the first three years of events and lists approximate cumulative attendance for each satellite location.
Figure 3. Emily Rice as “DJ Carly Sagan” (left) and the audience watch a presentation on rocketry by AMNH educator Russ Taragan and prepare to launch their own straw rockets at an AoT NYC event in May 2014. Glow necklaces are rewards for asking questions. Credit: Brian Levine

16 CAPjournal, No. 21, December 2016
Astronomy on Tap: Public Outreach Events in Bars
Location (USA unless otherwise noted)
Number of Events
Organisers & Affiliations*Approximate Total Cumulative Attendance
New York, NY 51Emily Rice (CUNY/American Museum of Natural History (AMNH)), Brian Levine (AMNH), Jeff Andrews, Dan D’Orazio, Adrian PriceWhelan (Columbia University), Meg Schwamb (Yale University)
3000
Columbus, OH 8 Demitri Muna (The Ohio State University) 450
New Haven, CT 10Stephanie LaMassa, Bhaskar Agarwal, Grant Tremblay (Yale University)
1000
Santiago, Chile 7 Amy Tyndall (European Southern Observatory) 250
Austin, TX 17Jeffrey Silverman, Rachael Livermore (University of Texas at Austin)
3655
Toronto, ON, Canada 7Stephanie Keating, Lauren Hetherington, Zoë Jaremus, Max MillarBlanchaer, Michael Reid, Chris Sasaki, Michael Williams (University of Toronto)
750
Seattle, WA 14Kristen Garofali, Brett Morris, Nell Byler (University of Washington)
1700
Denver, CO 5Adalyn Fyhrie, Morgan Rehnberg (Colorado University at Boulder), Quyen Hart (Regis University), Josiah Albertsen
250
Rochester, NY 4 Jennifer Connelly (Rochester Institute of Technology) 200
Lansing, MI 7 Devin Silvia (Michigan State University) 1000
Baltimore, MD 1 Jackie Radigan, Joel Green (Space Telescope Science Institute) 150
Tucson, AZ 7*
Gautham Narayan (National Optical Astronomy Observatory/University of Arizona), Sarah Morrison (Lunar Planetary Laboratory/ University of Arizona), Evan Schneider (Steward Observatory/University of Arizona)
600**
Washington, D.C. 3 Stephanie LaMassa (NASA Goddard Space Flight Center) 300
Urbana, IL 2Meagan Lang, Joaquin Vieira (University of Illinois at UrbanaChampaign)
200
Ann Arbor, MI 2Yuan Li, Keren Sharon, Aleksandra Kuznetsova, Erin May (University of Michigan)
100
Chicago, IL 1Benjamin Nelson, Laura Sampson (Northwestern University), Megan Bedell, Nora Shipp, Gourav Khullar, James Lasker, Laura Kreidberg (University of Chicago)
70
Santa Barbara, CA 1Iair Arcavi (Las Cumbres Observatory Global Telescope Network, University of California, Santa Barbara)
200
Palo Alto, CA (Bay Area) 1Sean McLaughlin (Stanford/Stanford Linear Accelerator Center (SLAC)), Mandeep Gill (SLAC)
90
“Flyby” events*** 3 Washington, D.C., Chicago, Taipei 150
Total 151 Total 14115
Table 1. Summary of AoT events April 2013–March 2016.
*Affiliations listed were accurate at the time of event organisation and may have changed. **Not including fifteen previous events under the previous title “Space Drafts”. ***One-time events, two of which occurred in the same city where regular events were started later by different organisers so are listed separately.

17
CAPjournal, No. 21, December 2016
Astronomy on Tap: Public Outreach Events in Bars
Creative ElementBranch of AoT listed by state (USA unless otherwise noted)
Details of Creative Element
Format AustinCreates themed introductory videos for each event, records each presentation, and posts videos on a YouTube channel3.
Format NYC Screened all thirteen episodes of COSMOS: A Spacetime Odyssey (2014) at “Cosmos on Tap” events, with a special guest commentator and game for each episode.
Format Seattle Occasionally screens episodes of Cosmos: A Personal Voyage (1980).
Format Baltimore Held their first event at a live music venue in conjunction with Space Dance (a DJ dance party).
Format Austin and Santa Barbara Have a segment of “Astronomy in the News” between talks, showcasing and explaining recent astronomical news items.
Format NYC
Has collaborated with the Intrepid Sea, Air, and Space Museum, the international Pint of Science festival, the World Science Festival, and NYC STEMFest to host events as part of broader sciencebased productions.
MerchandiseMultiple locations have logo merchandise to sell and/or give away as prizes
AUSTIN: tshirts, can koozies, pint glasses, buttons, stickersNYC: buttons, stickersLansing: bottle openers, etched glasses, coastersSeattle: etched glassesSanta Barbara: etched glassesChicago: stickers, etched glasses, tshirtsTucson: tshirtsWashington, DC: buttons, stickers
Funding Austin and LansingSolicit donations via competitive polls. Some of the polls included so far have been: Star Wars vs. Star Trek and Should Pluto be a Planet?
Funding NYC Collects donations via mascot “space bear” (plastic bank painted like an ursine astronaut) and gives away “Neil Tyson’s Trash Treasures” as prizes.
Funding AustinWas offered a beer sponsorship by Odell Brewing Company: their beer is now on tap at the venue and they donate prizes.
Funding NYC Offer drink discounts during events and gave away prizes donated by two beer companies.
Funding Lansing Is provided support from their venue in the form of rented sound equipment and the donation of gift cards to give away as prizes.
Funding Tucson Sells donated pizza to raise funds for visits to local schools.
Funding Rochester Collects donations via mascot “space pig” (black chalkboard piggy bank) and gives away prizes donated by the Strasenburgh Planetarium at the Rochester Museum and Science Center.
Funding Seattle Give away custom cupcakes donated by a local bakery, Trophy Cupcakes and Party as prizes.
Accessibility Rochester Events have an American Sign Language interpreter available by request.
Miscellaneous Seattle and Lansing
Venues brew custom beers given astronomically themed names selected by AoT fans. Lansing will be featured at a local beer festival to pour the abovementioned beers and talk with the public about astronomy.
Table 2. Highlighting creative alterations to various elements of the AoT model from various satellite locations.

18 CAPjournal, No. 21, December 2016
Astronomy on Tap: Public Outreach Events in Bars
time and energy of organisers, presenters, and other volunteers who design fliers, promote events, maintain websites and social media accounts, as well as sell merchandise, explain the trivia/games, award prizes, live post on social media, and record video at events.
Many locations collect donations, some invest in logo merchandise to sell at a profit, and several are institutionally subsidised. Institutional support provides publicity, prizes, and/or meals and drinks for speakers and organisers. AoT Tucson sells donated pizza by the slice to support outreach visits to local schools. For certain events, tickets are offered for a nominal fee of ten US dollars or less when partnering with other event series, and profits are shared between AoT and the event organisers. More information about funding models can be found in Table 2.
Presenting
Presenters have included professional and amateur astronomers, planetary scientists, physicists, engineers, and educators along with occasional appearances by writers, designers, artists, filmmakers, and other professionals with astronomy or sciencerelated projects. The science presenters represent a range of career stages including postbaccalaureate researchers and educators, graduate students, postdoctoral scientists, research scientists, and professors.
The best talks are accessible and engaging, with a straightforward but compelling concept or narrative, and limited to ten to twenty minutes of uninterrupted presentation. Because these events are held in a bar, speakers are not guaranteed a captive or even necessarily respectful audience. Presenters should be prepared to actively earn the attention of the audience in order to maintain their engagement. This is a useful skill to practice and improve for teaching, outreach, networking, and more (Kuchner, 2011). We recommend TEDstyle slides: visually striking but simple with little or no text and featuring clearly explained and wellmotivated science figures, and as much humour, pop culture, and even profanity (without insults or offensiveness) as the presenter would like.
prioritise the accessibility of the bar, proximity to public transportation, and ease of parking, depending on the needs of local community. Finally, events are much easier to coordinate with supportive venue staff who are reliable and communicative.
Suggested format and logistics
We encourage having one or more organisers act as creativelynamed masters of ceremonies (e.g. DJ Carly Sagan, MC Tycho Brewhaha, MC SuperDuperNova, MC Highz, MC Nebrewla, DJ Bailey’s Comet) to warm up the crowd, play music, explain games, introduce speakers, and encourage questions. We have found that between two and four short presentations minimises the pressure on any one presenter and gives presenters freedom and flexibility to experiment. It also allows for an evening to be themed around particular content while presenting a variety of aspects and viewpoints. We typically schedule one or two breaks in the programme and end early enough that socialising can continue afterward. Most locations do equally timed talks with time after each for questions. Scheduling of presenters in the programme should take into account their experience level and audience flow. For example, AoT NYC schedules presenters with less experience earlier in the programme so they have a smaller, fresher audience. More experienced presenters headline in the later slots when they may be presenting to a larger, and possibly more drunk, rowdy, and/or tired crowd. Conversely, AoT Austin schedules the least experienced presenter as the middle of three in order to start and end with strong presenters.
Funding
The required monetary costs of AoT events are minimal, especially with venues that do not charge for space or equipment and with access to institutional resources for audio visual equipment, printing and web hosting. Costs can include small prizes that are given away, materials like pens/pencils for filling out games cards or surveys, and presenter costs that are reimbursed. Venues may contribute tips to AoT and/or help encourage donations from attendees. The nonmonetary costs, which are potentially significant, include the generally unpaid
A major advantage of AoTstyle events is the existence of recommended guidelines and resources, as will be detailed below, in combination with significant flexibility in format and content. Some of the examples of creative approaches adopted by various satellite locations are listed in Table 2.
Starting a new satellite location
Several AoT organisers have drafted a Launch Manifesto that details effective practices for many aspects of AoT events, including finding a venue, scheduling and promoting events, recruiting and preparing presenters, resources for games, trivia, music, and prizes, and how to live stream or record and edit events for the internet. In addition to the crowdsourced document, there is an active AoT Host Stars (organisers) Google group for discussion of issues that arise.
Some of the most important information needed for organising AoT events is summarised below, and we encourage those interested in starting a new event and looking for more information about our manifesto to get in touch via this form: bit.ly/AoTAAS227 or our gmail address: [email protected].
Finding a venue
One of the biggest hurdles to starting an event series is finding a venue. Many AoT locations have experimented with several different venues before finding a good fit with their event and audience. We recommend approaching bars in person to appraise the space and equipment, meet the staff, and explain the event’s purpose and format, after calling ahead to make sure a manager, booker, or owner will be available. We avoid paying venue fees whenever possible, because they are generally outside of our (negligible) budgets. These fees can often be avoided by holding events on less popular nights for venues like Monday or Tuesday. The essential requirement for a venue is functional, reliable audio/visual equipment: screen and projector and/or large televisions and an audio system with at least one microphone. Optimal venue layouts provide sufficient space for the audience to sit with bar access at the rear or side of the audience, or table service. It is up to the organisers to

19
CAPjournal, No. 21, December 2016
Astronomy on Tap: Public Outreach Events in Bars
http://www.pewinternet.org/2016/03/22/ lifelonglearningandtechnology/
Kaiser, D. et al. 2014, The Evolving Culture of Science Engagement, http://www.cultureofscienceengagement.net/2013convening/report/
Livermore, R. C. & Silverman, J. M. 2016, Astronomy on Tap: science engagement in the pub, IAU General Assembly, Meeting #29, id.2257428, http://adsabs.harvard.edu/abs/2015IAUGA..2257428L
Kuchner, M. J. 2011, Marketing for Scientists: How to Shine in Tough Times, 3rd Edition, Island Press
Muñoz, D. J. 2013, Astronomy: The Gateway Science, Harvard Policy Lab blog, http://www.hcs.harvard.edu/~policylab/ 2013/05/18/astronomythegatewayscience/
NRC (National Research Council) 2009, Learning Science in Informal Environments: People, Places, and Pursuits, (Washington, DC: The National Academies Press), 28
Rice, E. L. et al., 2014, Astronomy on Tap: A New Event Series for Outreach and Professional Development, American Astronomical Society, AAS Meeting #223, #444.05, http://adsabs. harvard.edu/abs/2014AAS...22344405R
Rice, E. L. et al. 2016, Expanding the Universe of “Astronomy on Tap” Public Outreach Events, American Astronomical Society, AAS Meeting #227, id.248.02, http://adsabs.harvard.edu/abs/2016AAS...22724802R
based on the AoT Austin audience survey was recently made available to organisers of all AoT locations.
Acknowledgements
The authors gratefully acknowledge the AoT Host Stars (organisers) listed in Table 1 for their tireless devotion to expanding the AoT Universe and Jeffrey Silverman for contributions to the text.
Notes
1 More information on past AoT events: http://astronomyontap.org/events/pastevents/
2 Visit the AoT website: www.astronomyontap.org
3 Themed introductory videos from the Austin AoT: https://www.youtube.com/channel/UCGCrrMV2fwbA9_46Devd09g
References
Durant, J. et al. 2016, Science Live: Surveying the landscape of live public science events, https://livescienceevents.org/portfolio/readthereport/
Falk, J. & Dierking, L. 2002, Lessons without limit: How free-choice learning is Transforming Education, (Walnut Creek, CA: AltaMira Press)
Hidi, S. & Renninger, K. A. 2006, Educational Psychologist, 41(2), 111
Horrigan, J. B. 2016, Lifelong Learning and Technology, Pew Research Center,
We also encourage presenters to include creative or personal aspects in their presentations, because as part of the second goal of AoT, we want to not only convey science content but also represent the humanity and culture of science and scientists, to make them accessible and relatable to the public. Audiences respond very positively to, and ask many questions about, the stories of how people became scientists, what their personal opinions are, and the mistakes, pitfalls, and other behindthescenes stories of research.
Evaluation
Methods of evaluating the success of AoT events are currently limited to estimates of attendance (sometimes tracking new and returning attendees) and subjective assessment based on the organisers’ observations and interpretation of audience engagement, anticipation, and reactions in person and on social media. AoT Austin does, however, conduct monthly surveys in conjunction with trivia questions to estimate audience demographics, find out how people learned about the event, and allow attendees to suggest future topics and provide comments. Their typical response rate is 15–20% with an average attendance of 220. Survey results indicate that their audience consists of about 50% female and 15% black or minority ethnic attendees, which is consistent with their byeye estimates of the entire crowd. Most of the comments are positive, and a couple of comments each month have useful criticisms or suggestions. A template
Figure 4. Astronomer Jana Grcevich (AMNH) presents at a Hubble Space Telescope themed Astronomy on Tap NYC event in April 2014. In the lower left are glow necklaces that are offered as rewards for asking questions. Credit: Brian Levine
Emily L. Rice is an assistant professor in the Department of Engineering Science & Physics at the College of Staten Island (City University of New York), faculty in Physics at the CUNY Graduate Center, and resident research associate in the Department of Astrophysics at the American Museum of Natural History (AMNH) in New York City. She is coPI of BDNYC, a research group studying low mass stars, brown dwarfs, and exoplanets. In addition to organising Astronomy on Tap events in NYC and coordinating locations worldwide, Emily co authored Astronomy Labs: a Concept Oriented Approach and writes for the astronomy fashion blog STARtorialist.
Brian W. Levine is a Manager of Youth Programmes and an Astrophysics Educator at the AMNH in NYC. He runs a unique sevenyear extracurricular science programme for school students. Additionally at AMNH, he presents in the planetarium and assists with several recurring public programs. He coorganises and hosts Astronomy on Tap New York City events and is involved in other science outreach efforts in and around NYC. He has a BSc in Astrophysics and is a candidate for an MSc in Science Education with a concentration on FreeChoice Learning.
Biographies

20 CAPjournal, No. 21, December 2016
This paper presents the results of a massive open online class (MOOC) on astronomy called Astronomy: Exploring Time and Space. The class was hosted by the web platform Coursera and ran for six weeks from February to May 2015. Coverage was designed to emphasise topics in astronomy where there has been rapid research progress, including large telescopes, exploration of the Solar System, the discovery of exoplanets, exotic end states of stars, and the frontiers of cosmology. The core content was nearly eighteen hours of video lectures, assessed by thirteen video lecture quizzes, three peer review writing assignments, and two online activities. Information on demographics and on the goals and motivations of the learners was gathered using standard Coursera entry and exit surveys and an external Science Literacy survey. A total of 25 379 people registered for the course, and most of them did not complete any assignments. About twothirds of the 14 900 learners who opened the course lived outside the United States, distributed across 151 different countries. Out of 4275 participants who completed one or more assignments, 1607 passed the course, and a majority did so with a grade of 80% or higher. Those who completed the course were generally very satisfied with their experience and felt it met their learning goals. The people with the highest chance of completing the course tended to be in the range 40 to 60 years old, had a college education, and were either retired or working in professional fields. The strongest predictors of passing the course were to have completed the first written assignment or the first online activity.
educational experience in terms of paying for tuition and receiving college credit. Many people clearly use the MOOC marketplace to browse options or sample an interesting subject without making a real commitment. Modular MOOCs still allow a lot of aggregate consumption of content and learning, even for those who are not completing the course. Moreover, a clear majority of those who do complete MOOCs report educational benefits and a majority also claim career benefits (Zhenghao et al., 2015).
A strong argument for the benefit of MOOCs is their role in democratising education, where people in lower income or developing countries can access worldclass education with only Internet access (Dabbagh et al., 2015). That shine dims with the realisation that most MOOC learners already have degrees and jobs, and the majority come from developed counties (Hansen
Introduction
Five years after they burst onto the educational scene, the jury is still out on massive open online classes (MOOCs). The number of MOOCs has grown dramatically to over 4000, and the number of learners is more than 35 million (Shah, 2015). A MOOC is a universitylevel course that’s offered completely online with no prerequisites, usually free, though often learners pay for a completion certificate. There are three main types of providers: forprofit companies like Coursera1 partner with universities and faculty to offer a wide range of subjects typical of a Liberal Arts curriculum; nonprofit companies like edX2 operate in a similar way and the smaller companies like Udemy3 offer vocational courses and courses addressing professional development, with revenues shared between the company and individual instructors.
There is tension between the commercial and educational motivations of the MOOC providers (Ong & Grigoryan, 2015). None of these providers charge tuition fees in the way that major universities do, but their annual revenues are nearly $2 billion and that is expected to grow to over $8 billion by 2020 (Shah, 2015). MOOCs are here to stay.
Despite this strong growth, the debate over the efficacy of MOOCs and their role in the educational landscape continues unabated (Gammage et al., 2015; Hollands & Tirthali, 2014; MacAndrew & Scanlon, 2013). The benefit of free exposure to faculty expertise from major world universities is mitigated by the generally low completion rates of MOOCs, in the range of 6–10% (Khalil & Ebner, 2014). However, it is unrealistic to expect very high completion rates in a freechoice learning situation, with adult learners who have to juggle families and jobs and who are not as invested in the
Res
earc
h &
A
pp
licat
ion
s
Bringing the Universe to the World: Lessons Learned from a Massive Open Online Class on Astronomy
KeywordsMOOC, astronomy, online learning, lifelong learning, free-choice learning, demographics
Chris ImpeyDepartment of Astronomy, University of Arizona, [email protected]
Matthew WengerDepartment of Astronomy, University of Arizona, [email protected]
Martin FormanekDepartment of Physics, University of Arizona, [email protected]
Sanlyn BuxnerDepartment of Teaching, Learning, and Sociocultural Studies, University of Arizona, [email protected]

CAPjournal, No. 21, December 2016
21Bringing the Universe to the World: Lessons Learned from a Massive Open Online Class on Astronomy
As in most MOOCs, the core content was a series of video lectures. The ten highlevel modules were divided into ten to twelve topics each, and the video segments were at the level of a topic, typically six to fifteen minutes long, with an average of ten minutes. Video was shot with HD resolution against a green screen so that background and graphics could be added later. Two camera angles were used for variety. The lead author acts as the instructor and is the talking head in all of the videos. The instructor did not read from a script; rather, he created a narrative from lecture slides created for this course. Images, animations and video clips were incorporated into the videos in the production phase. Video editing was done in Final Cut Pro X4. The goal for the video lectures was a natural style and a varied presentation so they would appeal to people accustomed to science shows on television and high quality web videos. The 109 video lectures total just under eighteen hours, which is at the high end for most MOOCs. No textbooks were used. Instead, the learners had access to a free electronic textbook and other online astronomy resources provided by the instructor at the “Teach Astronomy” website5 (Impey et al., 2013).
It is always challenging to use pedagogy that engages learners in a disembodied online environment with thousands of participants. As in most MOOCs, Astronomy: Exploring Time and Space used multiple choice quizzes linked to the video lectures. A total of thirteen quizzes were used, each referring to about 75 minutes of video lecture. Learner engagement was increased with three writing assignments and two online activities. Each writing assignment was peerreviewed using tools provided by Coursera that randomly assigned three reviewers to each piece of writing. The writing assignments were graded on a fivepoint scale using a rubric provided by the instructor that each reviewer used to score the work of their peers. The three topics for the 500word writing assignments were: figures of merit for telescopes across the electromagnetic spectrum, the detection of exoplanets and their properties, and the exotic end states of stars. In addition, students completed two online activities. One was Galaxy Zoo (Lintott, 2008), a pioneering citizen science project that asks participants to classify a set of faint galaxies from the Sloan Digital Sky Survey6. The second online activity had the learners
& Reich, 2015; Ho et al., 2015). However, there remains a substantial minority of participants that includes those from countries with no welldeveloped higher education system and others where repressive governments try to suppress the free flow of information, so the idealistic goal of MOOCs is being realised, if on a fairly small scale. While the archetypal participant is a welleducated white male from a wealthy country, MOOCs are providing opportunities for advancement. Two years of data from Coursera show that people from developing countries more often report benefits from taking MOOCs, and people in those countries with low socioeconomic status and less education report the most benefits (Zhenghao et al. 2015).
MOOCs have been an important testbed for instructional strategies and pedagogy. Providers like Coursera offer a datarich environment for researchers where learner privacy can be safeguarded while their behaviour can be analysed at the level of clicks on the website. One criticism is that MOOCs typically depend on video lectures and multiple choice quizzes, augmented by online discussions. For the most part, the pedagogy is transmissive and the learners are passive, similar to many traditional university learning environments. However, a growing body of research has demonstrated that the best learning gains come from methods that actively engage students and let them work with peers and also get direct feedback from instructors (Freeman et al., 2014; Waldrop, 2015). Typical online environments make this kind of instruction challenging, if not impossible. In addition, the current MOOC platforms do not support interactive modes of instruction or provide easy ways to incorporate external or third party tools. Few argue that online instruction rivals the best classroom experience, although some experts argue that virtual classes can be better than real ones (Oakley, 2015). On the plus side, though, they allow new tools and technologies to be tested readily on any MOOC platform, generating copious data and permitting a very rapid development cycle.
Each of these issues represents an opportunity for research and for learning how to improve online instruction. We started developing our course in 2012, and the goal was not a survey of astronomy topics that might be appropriate for a general
education course, but coverage of the research topics, from comets to cosmology, where there is rapid progress. Our first offering was through course site Udemy, starting in February, 2013. That course is still running, and it has had over 36 000 people enrolled to date (Impey et al., 2015). We then augmented the video content by 50%, and started a second course on Coursera, which was the first offering by the University of Arizona after it joined their university consortium. That course ran for six weeks from February to May 2015 with over 25 000 enrolled learners, and is the subject of this paper. In the summer of 2015, we transitioned to Coursera’s on demand platform. A continuously enrolled course has been running on that platform since August 2015; it will be the subject of a future paper. Our goal in this paper is to detail the demographics and motivations of a typical MOOC audience, and identify indicators of engagement and predictors of course completion.
Course materials and pedagogy
Astronomy is a dynamic subject, with new research results reaching the level of the popular media almost daily. Particularly rapid progress is being made in the areas of exoplanets and cosmology. The course Astronomy: Exploring Time and Space was the first MOOC to be offered by the University of Arizona after it joined the Coursera consortium. The goal was to offer a survey of the subject with an emphasis on topics where advances in knowledge have been particularly rapid or profound. The major modules in the course were: the scientific method and the history of astronomy; the night sky; telescopes and the tools of astronomy; matter and radiation; the Solar System; extrasolar planets; the birth and death of stars; galaxies and the large scale structure of the Universe; cosmology and the big bang; and life in the Universe. The material often included research being done in the University of Arizona Department of Astronomy and Steward Observatory, one of the most prominent astronomy programmes in the world. Relative to an introductory astronomy textbook, the course gave particular emphasis to the method of science, big new telescopes, exoplanet detection and characterisation, tests of cosmological models, and the prospects of life in the Solar System and beyond.

22 CAPjournal, No. 21, December 2016
Bringing the Universe to the World: Lessons Learned from a Massive Open Online Class on Astronomy
As found in similar studies (Daly, 2014), those enrolled in the astronomy MOOC were substantially older than traditional students, with an average age of 36 and a median age group of 31–40 years old. The age distribution was flat except for a peak of people in their twenties (Figure 2). Learners’ geographical locations were classified based on IP addresses. A third of those who visited the course at least once lived in the United States (34.8%). The next most common countries were India (8.2%), United Kingdom (4.7%), Canada (3.9%), China (3.8%), Brazil (3.1%) Spain (2.6%), Russia (2.4%), Australia (2.0%), and Germany (1.9%). A total of 151 countries were represented (Figure 3). In terms of occupations, the course attracted a diverse set of learners. As determined by our external survey the largest group was students (19%), followed by science and engineering professionals (11%), software and computer professionals (11%), and educators (9%). Surprisingly, the next largest category was unemployed people (8%). About equal were retirees and business managers at around 5% each (Figure 4). Consistent with other Coursera studies this was a highly educated cohort (Christensen et al., 2013). Only 16% did not have any level of college education, a third had bachelor’s degrees and another third had advanced degrees (Figure 5). Many had had a substantial amount of previous collegelevel training in science. Only a
using the NASA MicroObservatory robotic telescope network7 to take an image of an object in the sky, then write a brief report on the properties and the significance of the target chosen.
The course used other modes of engagement which did not affect the final grade or the ability to attain completion certificates. Coursera provides embedded discussion boards, and threads were created for each content module as well as for general course issues. Topics generated by the learners proliferated during the course, and included topics such as practical observing with small telescopes, UFOs, science and religion, and astronomy in the news. We could sort threads by activity level and popularity, and members of the instructional team tried to participate in every thread at least once. Live question and answer sessions were conducted using Google Hangouts every week of the course, and automatically archived and posted publicly on YouTube. The course had a Facebook page and a Twitter account, and the instructor maintained an active presence on social media, typically making three or four posts per week.
Learner demographics and motivations
Who takes MOOCs today? This simple question does not have a simple answer because freechoice learning can have many types of motivation (Falk and Dierking, 2002). Someone might take a course on programming or algorithms for advancement or for professional development, a course on photography to further a hobby, or a course on philosophy for general interest. We can assume that astronomy draws people because of curiosity or a fascination with the subject. This is probably a different motivation from that for the students at the University of Arizona, who take introductory astronomy as part of a General Education requirement. This course was offered over a six week period in the spring of 2015, and the instructor used his social media footprint to promote the course, reaching amateur astronomers and people who had read his popular books. Students started registering in early December 2014, and a stream of several hundred people a week registered over the two months that followed, with a spike in early February when Coursera started pro
moting the course in its online marketplace (Figure 1). By the time the course started 25 379 people had registered.
We gained valuable demographic information from two surveys carried out near the beginning of the course. Coursera gave their standard entry survey to a randomly selected group of 4657 registered learners and shared the anonymised data with us later. We then asked learners to complete a separate Science Literacy survey of our own design that gathered demographic information, as well as asking questions about basic science knowledge and attitudes towards issues of science and technology. We have used parts of this survey for over twentyfive years to measure science literacy in the undergraduate student population at the University of Arizona (Impey et al., 2011). The survey was voluntary, but was motivated by a small amount of credit towards course completion that did not significantly influence the final grade. A total of 2465 learners completed our external survey. Not surprisingly, respondents to the two surveys are skewed in favour of people who participated in the course, and people who passed the course. Out of the roughly 14 900 users who visited the course at least once, 11% graduated, whereas for the survey takers, the graduation rate was 33%. Full analysis of these two data sets is the subject of a separate paper.
0
200
400
600
800
1000
1200
1400
1600
1800
12/11
/14
12/18
/14
12/2
5/14
1/1/15
1/8/15
1/15/
15
1/22/15
1/29/
15
2/5/15
2/12/15
2/19/15
2/26/
15
3/5/
15
3/12
/15
3/19
/15
3/26
/15
Num
ber
of n
ew re
gist
ered
use
rs
Date
Figure 1. Registration pattern for “Astronomy: Exploring Time and Space,” a MOOC on Coursera that ran from February to May 2014. Many of those who pre-registered were amateur astronomers or teachers reached by the instructional team using social media.

23
CAPjournal, No. 21, December 2016
Bringing the Universe to the World: Lessons Learned from a Massive Open Online Class on Astronomy
entry survey were selfselected to be much more motivated that the typical person who registers for the course. This group of 4969 splits roughly equally into those who did
quarter had never taken any college science class, and a quarter had taken ten or more (Figure 6). In this context, a class represents a quarteryear or semesterlong course for three credits, in the typical U.S. system. The generally high education level of those who completed the course is discussed later in this paper.
The learners’ intentions and motivations were measured through the Coursera entry survey. This instrument has 22 questions, and it starts by asking about the intentions behind watching the video lectures, completing the assessments, participating in the forums, and attaining a completion certificate. It then probes various motivations for taking the course, using a fivepoint Likert scale with responses ranging from “not at all important” to “absolutely critical.” The survey ends with three questions
about previous familiarity with the subject matter of the course, and two openended questions about why the learners are taking the class. People who completed the
13%
33%
17%
11%
11%
15%
1–20 years old21–30 years old31–40 years old41–50 years old51–60 years old61 years old and oldernot stated
2%
47%
24%
24%
3% AfricaAmericaAsiaEuropeOceania
StudentProfessional (science/engineering)Technical (software/computers)Educator (school/college)UnemployedRetiredManagerial/businessOtherProfessional (law/medicine)Clerical/administrativeWork at homeService/retail
19%
11%
8%
8%
6%
5%
5%
5%
5%
11%
9%
8%
14%
18%
34%
24%
11% 2% Some high schoolHigh schoolSome collegeBachelor's degreeMaster's degreeDoctorate degree
Figure 2. Age distribution of the people registered for the MOOC from the sample of 2465 who took the external Science Literacy survey. The average age is 38 and the median is 55.
Figure 3. Geographical distribution of the 14 900 MOOC participants who opened the course based on their IP addresses.
Figure 4. Occupations of the sample of 2465 MOOC participants who took the external Science Literacy survey. A quarter worked in technical and professional fields.
Figure 5. Highest education level of the sample of 2465 MOOC participants who took the external Science Literacy survey. A third had bachelor’s degrees and another third had advanced degrees.
26%
35%
14%
25%
01–45–910+
Figure 6. Number of college science courses previously taken by the sample of 2465 MOOC participants who took the exter-nal Science Literacy survey. As many as a quarter were likely to already have a science degree.

24 CAPjournal, No. 21, December 2016
Bringing the Universe to the World: Lessons Learned from a Massive Open Online Class on Astronomy
not attempt to complete the course, those who tried to complete the course but failed, and those who passed (Figure 7).
Various levels of intention and commitment were seen at the beginning of the course. About 85% intended to watch all the lectures, 71% intended to do all the assessments, 26% intended to participate in the discussion forums, and 46% intended to achieve a paid completion certificate or a free statement of accomplishment. The people taking this MOOC generally had some prior interest or background in astronomy. Just 10% had actual work experience in astronomy, but a third had taken astronomy coursework, and over 70% said they were somewhat or very familiar with the subject. The survey listed ten reasons for taking the course. The reason where the highest percentage of respondents said it was “very important” or “absolutely critical” (80%) was “for general interest, curiosity, or enjoyment,” bolstering the premise that these freechoice learners are not studying astronomy with a practical or a vocational motivation. There was a large drop down to the next set of reasons given by respondents for enrolling in the course: 21% to earn a completion certificate, 10% for gaining skills that might be useful in a new job, 9% for connecting to other students interested in astronomy, 8% to take a course from this particular professor, and 8% to take a course from this particular institution.
Additional clues to learner motivation came from analysis of the openended responses to the last two questions in the entry survey: “Why are you taking this class?” and “Do you have any additional comments?”. Word counts of the answers to those questions showed the most frequent keyword, by a factor of two, to be “interest.” The next most frequently counted keywords were: learn, want, curiosity and knowledge. Curiosity is a central attribute of people who become scientists so it’s gratifying that it is also one of the core motivations for people taking this online astronomy course (Figure 8).
In these data, we can see reasons for the typically low completions rates of a MOOC. More than half of those enrolled were between the age of typical students and retirement age. More than half already had a college degree, often a Masters or a Doctorate. More than half were working professionals. People in this segment of the adult population often have busy lives and
0
200
400
600
800
1000
1200
1400
1600
0 10 20 30 40 50Final course grade
60 70 80 90 100
Num
ber
of u
sers
Figure 7. Grade distribution of the 4969 MOOC participants who completed the Coursera entry survey. Red indicates failing the course, yellow indicates passing, and green indicates passing with distinction.
Figure 8. Word cloud from responses to the question “Why are you taking this class?” from the 4657 MOOC participants who took the Coursera entry survey. Size indicates the relative frequency of the word.
0
200
400
600
800
1000
1200
1400
0 10 20 30 40 50Final course grade
60 70 80 90 100
Num
ber
of u
sers
Figure 9. Grade distribution of the 4275 MOOC participants who did at least one assignment. Red indicates failing the course, yellow indicates passing, and green indicates passing with distinction.

25
CAPjournal, No. 21, December 2016
Bringing the Universe to the World: Lessons Learned from a Massive Open Online Class on Astronomy
4275 learners divide into 1607 who passed by achieving the required minimum of 50% across all of the assignments and 2668 who failed by not scoring at least 50% on the assignments. Of the 1607 who passed the course, 1109 (69%) passed with distinction, a grade of 80% or better, and 498 (31%) passed with a grade between 50% and 80%. The number of people registered and paid for a completion certificate was 296, of which 247 (84%) actually passed the course and so received the certificate from Coursera. The most salient percentages are that 6% of the people who registered passed the course and 69% of those who passed did so with distinction. This suggests a bimodal distribution of performance, with most participants doing a few assignments and then falling away from the class, and a small tail performing at a very high level (Figure 9).
Engagement with the content showed a steep or exponential decline over the first week followed by transition to a steady, linear decline over the rest of the course (Figure 10). There was a small surge at the beginning of the second module on Observing, and two smaller upturns at the beginnings of the modules on the Solar System and Stars. Similar data on the participation in graded assignments shows a similar declining curve, with an added interesting feature: there is a substantial drop for each of the three short writing assignments (Figure 11). Apparently, these learners were more interested in watching videos and in taking video quizzes than in writing about astronomy, even though the writing counted for a significant fraction of the total grade. Participants in the discussion forum were among the most engaged learners in the class, and the numbers of posts and comments and new threads shows no particular trend, except for a strong peak for each new module and less prominent peaks for deadlines of peer grading (Figure 12).
The sample size of n = 25 379 is large enough to test some potentially interesting correlations. Since the video lectures represented the core of the course, it might be anticipated that the number of video lectures watched would correlate strongly with the final score. It does (r = 0.67, p < 0.001), but the plot shows wide scatter (Figure 13). If those who did not watch any videos are removed, n = 12 042, the result is still significant (r = 0.62, p < 0.001)8. The correlation
0
2000
4000
6000
8000
10000
12000
1 5 9 13 17 21 25 29 33 37 41 45 49 53 57 61 65 69 73 77 81 85 89 93 97101105109
Num
ber
of u
sers
Video numberFigure 10. The number of MOOC participants who watched each of the 109 videos. An exponential decline in the first week was followed by a slower, more linear decline, with slight increases at the start of most modules or major topics.
0
500
1000
1500
2000
2500
3000
3500
4000
4500
5000
Num
ber
of p
eop
le p
artic
ipat
ing
Lectu
re Q
uiz 1a
(Video
s 1–9)
Coursera
Stu
dent E
ntry S
urve
y
Lectu
re Q
uiz 2a
(Video
s 1–1
4)
Lectu
re Q
uiz 1b
(Video
s 10–1
5)
Writ
ing A
ssignm
ent n
o. 1
Lectu
re Q
uiz 2b
(Video
s 15–2
2)
Writ
ing A
ssignm
ent n
o. 2
Lectu
re Q
uiz 3b
(Video
s 14–2
2)
Writ
ing A
ssignm
ent n
o. 3
Lectu
re Q
uiz 2c
(Video
s 23–2
8)
Lectu
re Q
uiz 4b
(Video
s 7–1
1)
Lectu
re Q
uiz 3a
(Video
s 1–1
3)
Lectu
re Q
uiz 4a (
Videos 1
–6)
Activit
y no.
1 — “G
alaxy
Zoo”
Lectu
re Q
uiz 5a
(Video
s 1–1
1)
Lectu
re Q
uiz 6a
(Video
s 1–8)
Lectu
re Q
uiz 5b
(Video
s 12–2
1)
Activit
y no.
2 — “O
bserv
ing Pro
ject”
Coursera
Stu
dent E
xit S
urve
y
Lectu
re Q
uiz 6b (V
ideos 9
–13)
Figure 11. The number of MOOC participants who completed each of the surveys and graded assignments, showing a sharper drop for each of the writing assignments.
are juggling family and work. Even though 80% expressed an intention to watch all of the video lectures, and 70% intended to complete all of the assignments, only 1 in 5 of those intending to complete the course actually did so. Therefore, 20% could be viewed as a practical ceiling on the likely completion rate in this type of freechoice, informal learning environment.
Learner engagement and outcomes
Out of 25 379 people registered at the beginning of the course, 21 104 (83%) did not complete any graded assignment. They are referred to as “phantoms” in the online world because they express an initial interest by registering, but are probably browsing or windowshopping with no intention of completing the course. The remaining

26 CAPjournal, No. 21, December 2016
Bringing the Universe to the World: Lessons Learned from a Massive Open Online Class on Astronomy
For the course participants who had some background in astronomy, or those who were highly motivated to complete all the assignments, video lectures were apparently not essential for success. This has not been noted before and is a particularly surprising result of our study. On the other hand, people watching at least one video watched on average 5.5 hours of content. The distribution is bimodal (Figure 14), and it mirrors the distribution of overall grades (Figure 9). A major goal of MOOCs is outreach rather than formal education, so it is worth noting that, in the aggregate, several thousand people watched 65 200 hours, equating to seven and a half years worth, of astronomy videos as a result of taking this course.
The other type of activity that indicates engagement but is not formally part of the grade was participation in the discussion forums. In this MOOC, forums were the best and often the only form of asynchronous interaction between students and the instructor and his team. We have gathered a wealth of detailed data from the forums, but only summarise the broad results here. The topics of online discussion parse into several categories: comments on specific course content (which is very useful because it includes many eyes catching occasional misstatements in the videos and errors in the assignments); topical threads on recent discoveries and news stories in astronomy; discussion of the practical aspects of amateur astronomy such as where to buy a small telescope and what to observe in the night sky; and threads on potentially controversial issues like science and religion and UFOs. Postings were generally civil and courteous, with only a couple of instances of bad behavior and “trolling,” out of nearly 750 people who posted. Overall, people who participated in the forums earned grades twice as high as those who never participated (65% with a standard deviation of 38% versus 32% with a standard deviation of 34%). The difference in these distributions is significant with p < 0.001 using a Kolmogorov–Smirnov test9. The number of posts also correlates weakly with grade for the whole population, n = 25 379 (r = 0.16, p < 0.001) and this result weakens even more if people who did not participate in the forums are excluded, n = 749 (r = 0.11, p = 0.003).
The strongly positive responses in the exit survey naturally reflect the views of those
coefficient is lower because we are removing mostly those who watched no videos and had zero score. On the other hand, if we remove those who did not participate in any assessment, n = 4275, the correlation improves (r = 0.75 p < 0.001). Within the whole population (Figure 13), there are people who failed despite watching all the videos (upper left corner) and there are also people who passed with
out watching many, or even any, videos (lower right corner). A cohort that is particularly interesting is the vertical slice of those who passed the course with distinction, a score of 80% or better. A group of those high performers cluster at the top, having watched all or nearly all the videos, but below 85 out of 109 videos watched, the distribution is nearly uniform.
0
50
100
150
200
250
300
Feb. 01 2015 Mar. 01 2015Date
Apr. 01 2015 May 01 2015
Num
ber
of t
hrea
ds/
pos
ts
Number of threadsNumber of posts + comments
Figure 12. Activity on the discussion forums for the astronomy MOOC. The number of new threads created is in blue and number of new posts and comments is in green. Most of the peaks correspond to the start of a new module (dashed lines) or the deadlines for peer evaluations of writing assignments (dotted lines).
0
20
40
60
80
100
0 20 40 60 80 100Score in %
Num
ber
of v
ideo
s w
atch
ed
Figure 13. Final score plotted against number of videos watched by each user (r = 0.67, p < 0.001), with n = 25 379. Despite wide scatter the correlation is significant.

27
CAPjournal, No. 21, December 2016
Bringing the Universe to the World: Lessons Learned from a Massive Open Online Class on Astronomy
The exit survey also asked how well the course met the goals and expectations of the learners. Overall satisfaction was high. Over 90% strongly agreed or somewhat agreed that their goals in taking the course were met. The motivations were recreational rather than vocational; only 24% said that the topic of the course was relevant to their current or potential career.
People were asked how the course affected their understanding of astronomy. The percentage with excellent understanding increased from 3% to 18%, and the percentage with very good understanding increased from 12% to 53%. The primary goal of any course is increasing content knowledge, so it is a solid success when the percentage of learners with very good or better understanding grows from 15% to 71%. Consistent with the premise of lifelong learning, 85% said they would be likely to revisit the class materials and 41% even said they would be likely to take the class again. Additionally, 92% said they would be likely to recommend the course to a friend and 90% said they would take another course by the same instructor.
What are the particular characteristics of those who completed the course?
We were able to study characteristics of those who completed the course using data from our external survey of 2465 participants. The percentage of learners who completed the course rises with age, peaking at 46% with the cohort who were in their fifties, dropping slightly for the oldest group (Figure 16). Not surprisingly, completion rate rises with education level, from 26–28% for those with no college education, to nearly 50% for those with a doctorate (Figure 17). By comparing age distribution from Figure 2, educational distribution from Figure 4 and distribution of previous college science courses from Figure 6 with the same distributions for the course graduates we conclude that they are significantly statistically different populations, with p < 0.05 determined by a Kolmogorov–Smirnov test. Therefore, we can state that graduates were typically older and more educated than the general survey population. The highest performing learners were retirees, who had over 40% completion. At slightly lower levels of performance were people in technical fields or professional jobs. Unemployed people were in the middle of the distribution,
who performed particularly well in the course (Figure 15). The learner experience was measured by Coursera using their standard exit survey, taken by an anonymous subset of 1472 of those enrolled who also finished the class. On the overall experience, 52% rated it excellent, 34% rated it very good, 12% rated it good, and only 2% rated it fair or poor. In general, learners thought the level of difficulty was slightly easier than expected, workload was slightly heavier than expected, and the pace slightly faster than expected. In terms of their satisfaction with various components of the course, the judgement was the most positive for instructor
knowledgeability (96% very good or excellent), instructor clarity (91% very good or excellent), and the videos (87% very good or excellent), and lower for assessments (63% very good or excellent) and the discussion forums (37% very good or excellent). In terms of potential changes and improvements, the most popular suggestion was to spread the content over more than six weeks (53% positive), along with covering more topics (52% positive). Survey respondents were more tepid on the idea of splitting the course into multiple, shorter courses (31% positive). Only one in four said they would have taken this course if it had not been free.
0
1000
2000
3000
4000
5000
6000
0 21 4 6 8 10No. of hours spent watching
12 14 16 183 5 7 9 11 13 15 17
Num
ber
of u
sers
Figure 14. Bimodal distribution of number of hours of video watched by the MOOC participants, mirroring Figure 7, with n = 12 042. The median amount watched was 5.5 hours for those who watched at least one video.
0
100
200
300
400
500
600
0 10 20 30 40 50Final course grade
60 70 80 90 100
Num
ber
of u
sers
Figure 15. Grade distribution for MOOC participants who completed the exit survey (n = 1472). It is strongly skewed towards people who performed well in the course.

28 CAPjournal, No. 21, December 2016
Bringing the Universe to the World: Lessons Learned from a Massive Open Online Class on Astronomy
science literacy survey at the beginning of the course completed the course and 36% of the people who did the first video quiz completed the course. In the middle tier, there was a 67% completion rate for people who participated, even just once, in the discussion forums. In the highest tier as far as percentage who graduated are: 81% of those who did the first writing assignment; 83% of those who chose the certificate path; 89% of those who did required peer reviews for the first writing assignment; and 94% of those who did the first activity (Figure 19). The message to be drawn from this data is that early engagement in the more intensive assessments like writing and projects is a strong predictor of success in this MOOC.
Summary and future research
Massive open online classes are still in their early days of development, so their full impact on education is not yet clear. However, the potential of MOOCs to facilitate freechoice learning and outreach is beyond doubt. Material that was once confined to enrolled students at major universities is now available free of charge online. MOOCs have gained enormous geographic reach from the penetration and diminishing cost of Internet access across the world.
Astronomy: Exploring Time and Space has put the cutting edge research results of astronomy in the hands of thousands of people in over 150 countries. Even though 41% of those who registered for the course did not “open” the course, the 12 042 people who did watched 65 200 hours of astronomy lectures on video. These participants were generally older than 30 years, and had some level of college education, but their jobs and work experiences were varied. A course like this can meet the goals of lifelong learners to increase their understanding of a technical subject for the purest of motivations: curiosity and intellectual enjoyment (Koller et al., 2013). More nuanced measures of success than completion rate are needed to fairly evaluate MOOCs (Klobas, 2014).
MOOCs give learners great flexibility in being able to access instructional materials anytime and in any place (the Coursera platform delivers materials to handheld devices), and free access means they
at 33%, and students performed poorest of all major categories, with 25% completion (Figure 18). The different motivations of this diverse population cannot be neatly summarised, but taking an online course with eighteen hours of video content and two dozen assignments is timeconsuming, so it is not very surprising that the retired population did much better than average in this course.
What are the major predictors of comple-tion, especially early in a course like this?
The baseline for this discussion should omit the “phantoms” who never opened the course or completed any assignment. That baseline is the 11% of people who opened the course and then completed the course and graduated. Participation of any kind boosts the odds of completion, but there are different levels of predictors. In the lowest tier, 33% of those who did the
0%
5%
10%
15%
20%
25%
30%
35%
40%
45%
50%
1–20 years old
21–30 years old
31–40 years old
41–50 years old
51–60 years old
61 years old and older
Figure 16. Percentages of graduates in each age category, based on demographics data from the Science Literacy survey.
0%
10%
20%
30%
40%
50%
60%
Some highschool
Highschool
Somecollege
Bachelor'sdegree
Master'sdegree
Doctoratedegree
Figure 17. Percentages of graduates for groups with different educational background based on demographics data from the Science Literacy survey.

29
CAPjournal, No. 21, December 2016
Bringing the Universe to the World: Lessons Learned from a Massive Open Online Class on Astronomy
sion forums (Jiang, 2014). Going beyond multiple choice tests and simple forms of assessment to add more interesting and challenging projects may help reduce class attrition (Gutl et al., 2014). The variables that affect student success in MOOCs are still being actively investigated (Reich, 2015; Reilly, 2013).
We plan to continue exploring pedagogy that increases engagement in MOOCs and improves the completion statistics. To do this will require more evaluation of written work, using peer grading since that is the only way to handle thousands of assignments. We will also explore ways to do projectbased or handson science online, in particular with the type of Citizen Science tool that we used in this course: the galaxy classification activity called Galaxy Zoo. Another approach we will explore is to try and replicate the learning potential of facetoface group activities like lecture tutorials in an online environment. We will also continue using surveys to better understand the level of incoming science literacy of the learners and their motivation for taking a MOOC. In 2015, we transitioned Astronomy: Exploring Time and Space to Coursera’s ondemand platform, where people can enrol continuously and finish the class at their own pace. This platform is wellsuited to trying out new approaches in successive versions of the class, and tracking the outcomes for each cohort. As research on MOOCs grows, and best practices spread, we expect them to become increasingly important for formal, distributed learning.
really are available to anyone. On the other hand, without the financial commitment of tuition, and the incentive of a grade and college credit, learners are far less invested in the experience than the typical college student. As a result, the completion rate is low. Like other MOOCs, we saw a steep decline in participation and engagement with time over a 6week course. Out of more than 25 000 registered at the start of the course, only 17% completed any graded assignment. Among those 4275, 38% completed the course with a pass
ing grade of over 50%. Two thirds of those who passed did so with distinction, a grade of over 80%. Performance and participation was bimodal, with a small tail of very engaged and highly achieving students. Those who completed the course were older and more educated than the average participant and they tended to be either students, professionals working in sciences, or educators. The strongest predictors of completion were participation in early assessments like the peer writing and the project, and participation in the discus
0%
5%
10%
15%
20%
25%
30%
35%
40%
45%
Studen
t
Profes
siona
l (scie
nce/e
ngine
ering
)
Tech
nical
(softw
are/c
ompute
rs)
Educato
r (sc
hool/c
ollege)
Unem
ployed
Retire
dOth
er
Manag
erial
/bus
iness
Profes
siona
l (law
/med
icine
)
Clerica
l/adm
inistr
ative
Work
at ho
me
Servic
e/re
tail
0% 10% 20% 30% 40% 50% 60% 70% 80% 90 100%
6%Registered users
11%Users who opened the course
33%Science and Literacy Survey participants
36%Learners who did the first video quiz
67%Learners who participated in the forum
81%Learners who submitted the first writing assignment
83%Learners In the certificate path
89%Learners completed grading for the first writing assign
94%Learners who did the first activity
Percentage of graduates
Figure 18. Percentages of graduates for different occupations, based on the external Science Literacy survey.
Figure 19. Percentages of graduates for different groups of learners within the course sorted from the lowest to the highest. This shows that those who completed the early writing assignment and activity were the most likely to complete the overall course.
30
CAPjournal, No. 21, December 2016
Bringing the Universe to the World: Lessons Learned from a Massive Open Online Class on Astronomy
Reich, J. 2015, Science, 347, 34
Reilly, C. 2013, MOOCs Deconstructed: Variables That Affect Student Success, in Proceedings of ELearn: World Conference on ELearning in Corporate, Government, Healthcare, and Higher Education 2013, 1308, (Chesapeake, VA: Association for the Advancement of Computing in Education)
Shah, D. 2015, MOOCs in 2015: Breaking Down the Numbers, EdSurge online article, published on 28 December 2015 at https://www.edsurge.com/news/20151228moocsin2015breakingdownthenumbers
Waldrop, M. 2015, Nature, 523, 272
Zhenghao, C. et al. 2015, Who’s Benefiting from MOOCs, and How?, Harvard Business Review online, published on 22 September 2015 at https://hbr.org/2015/09/whos benefitingfrommoocsandwhy
We acknowledge encouragement and support from Melody Buckner in the Office of Digital Learning, and from the staff of the Office of Instruction and Assessment at the University of Arizona. Our contacts at Coursera provided excellent assistance at all stages of deploying and supporting the course. Chris Impey is grateful for support from the Howard Hughes Medical Institute under grant number 52008138 for the project “Towards a Next Generation Online Science Course.”
Notes
1 Coursera: https://www.coursera.org2 edx: https://www.edx.org/3 Udemy: https://www.udemy.com/4 Final Cut Pro X: http://www.apple.com/
finalcutpro/5 Teach Astronomy:
http://www.teachastronomy.com6 Sloan Digital Sky Survey:
http://www.sdss.org/7 MicroObservatory Robotic Telescope
Network: http://mowww.harvard.edu/OWN/8 r here is the correlation coefficient whilst
the calculated probability is denoted with the pvalue
9 More information on the Kolmogorov–Smirnov test: https://en.wikipedia.org/wiki/Kolmogorov–Smirnov_test
References
Christensen, G. et al. 2013, The MOOC Phenomenon: Who Takes Massive Open Online Courses and Why?, DOI: 10.2139/ssrn.2350964
Dabbagh, N. et al. 2015, Learning Tech-nologies and Globalization: Pedagogical Frameworks and Applications, Springer Briefs in Educational Communications and Technology, (Heidelberg: Springer)
Daly, J. 2014, HarvardX’s and MITx’s MOOC Data Mapped and Visualized, Ed Tech Magazine, published online at: http://www.edtechmagazine.com/higher/article/2014/02/harvardxsandmitxsmoocdatavisualizedandmapped
Falk, J. H. & Dierking, L. D. 2002, Lessons without limit: How free-choice learning is transforming education, (Walnut Creek, CA: AltaMira Press)
Freeman, S. et al. 2014, Proceedings of the National Academy of Sciences, 111, 8410
Gammage, D. et al. 2015, Quality of MOOCs: A Review of Literature on Effectiveness and Quality Aspects, in: 8th International Conference on UbiMedia, 224, DOI: 10.1109/UMEDIA.2015.7297459
Gutl, C. et al. 2014, Communications in Computer and Information Science, 446, 37
Hansen, J. D. & Reich, J. 2015, Science, 350, 1245
Ho, A. D. et al. 2015, HarvardX and MITx: Two Years of Open Online Courses, HarvardX Working Paper No. 10, DOI: 10.2139/ssrn.2586847
Hollands, F. M. & Tirthali, D. 2014, MOOCs: Expectations and Reality, Full Report, Center for BenefitCost Studies of Education, Teachers College, Columbia University, NY
Impey, C. D. et al. 2011, Journal of College Science Teaching, 40, 31
Impey, C. D. et al. 2013, Astronomy Education Review, Vol. 12, DOI: 10.3847/AER2012046
Impey, C. D. et al. 2015, Astronomy for Astronomical Numbers: A Worldwide Massive Open Online Class, The International Review of Research in Open and Distributed Learning, Vol. 16, No. 1, published online at http://www.irrodl.org/index.php/irrodl/article/view/1983/3204
Jiang, S. et al. 2014, Predicting MOOC Performance with Week 1 Behavior, in Proceedings of the 7th International Conference on Educational Data Mining, 273
Khalil, H. & Ebner, M. 2014, MOOC Completion Rates and Possible Methods to Improve Retention — A Literature Review, in Proceedings of World Conference on Educational Multimedia, Hypermedia, and Telecommunications, 1305, (Chesapeake, VA: Association for the Advancement of Computing in Education)
Koller, D. et al. 2013, Retention and Intention in Massive Open Online Classes, Educause Review online, published on 3 June 2013 at http://er.educause.edu/articles/2013/6/ retentionandintentioninmassiveopenonlinecoursesindepth
Klobas, J. E. 2014, Performance Measurement and Metrics, 35, 45
Lintott, C. J. et al. 2008, MNRAS, 389, 1179
MacAndrew, P. & Scanlon, E. 2013, Science, 342, 1450
Oakley, B. 2015, Why Virtual Classes Can Be Better Than Real Ones, Nautilus, online article published on 29 October 2015 at http://nautil.us/issue/29/scaling/whyvirtualclassescanbebetterthanrealones
Ong, B. S. & Grigoryan, A. 2015, International Journal of Information and Education Technology, Vol. 5, No. 5, 373
Chris Impey is Associate Dean of the College of Science at the University of Arizona and a University Distinguished Professor of Astronomy. He is leading a digital learning initiative for the university, including online courses and MOOCs. Chris’s research has focused on observational cosmology as well as education and science literacy.
Matthew Wenger is an Educational Program Manager for Astronomy at Steward Observatory. He has a PhD in astronomy education and twenty years of experience in informal education and freechoice learning. Matthew oversees the development of course curricula, assessments, and video production for online classes and educational outreach.
Martin Formanek is a PhD student in physics at the University of Arizona. His research topic is primarily computational quantum chemistry, but he has always been interested in physics education and outreach as documented by his two years of instructional experience and a certificate in learnercentered teaching. Martin is in charge of data management and processing for online courses.
Sanlyn Buxner is an Assistant Research Professor in the department of Teaching, Learning, and Sociocultural studies at the University of Arizona. She studies issues related to scientific literacy: how to measure it and investigating how it is changed by education, outreach, and online media. Sanlyn helps develop data collection instruments and analyse data from online science classes.
Biographies

31CAPjournal, No. 21, December 2016
The project Cielo y Tierra, Spanish for Sky and Earth, was undertaken in order to bring astronomy and ecology to remote villages throughout Colombia using sustainable transport. This transport included three horses and two paragliders. The innovative approach of the expedition helped to keep an extremely low budget whilst making it possible to cross the Colombian Andes from northeast to southwest. This article will show how projects like these can succeed, the need for this kind of project, and the possible impact, with this project reaching more than 1500 people. We hope to encourage others not to be afraid of going into countries like Colombia on a lowbudget educational expedition. The success of this project shows that outreach and education projects are possible in these remote areas where little or no governmental or other support reaches.
The location
Colombia lies at the northwest of the South American continent. It has an extremely large variety of flora and fauna since its geology reaches from sea level up to more than 5000 metres in the Andean mountains. Horses are a strong part of Andean culture and the Andes offer some of the best paragliding conditions in the world. The reason for choosing Colombia for this project is that there still exists a huge gap between the urban and rural areas in respect of wealth and education.
While cities like Bogotá and Medellin have benefited from a number of astronomy outreach activities, such as Galileo Mobile, in recent years, remote locations in the countryside are usually not part of such initiatives. These regions suffer from a lack of resources in schools and are neglected by NGOs and government development programmes. This leads to large dropout rates at the primary school level in these areas and a lower level of literacy in rural areas compared to urban areas (González & López; Unicef; WIN/Gallup International Association). This problem is not unique to Colombia. In the entirety of Latin America (and the Caribbean), about 35 million children between three and eighteen years old are not attending school, which is a total almost equal to the population of Colombia1. Instead, children start work extremely early or drift into the narcotics trafficking scene, because these are often
Introduction
What happens when you combine astronomy, ecology, long distance horse trekking and cross country paragliding and undertake a 1000kilometre journey through Colombia? Cielo y Tierra is the result of this experiment.
To our knowledge, it is the first expedition to bring telescope observations and small educational activities to villages via horse and paraglider instead of using expensive four wheel drives to reach these remote areas. The primary aim of this first expedition was not only to teach factual astronomy but also to excite people, in particular children, and encourage them to explore, discover and keep studying, while at the same time raising awareness of the uniqueness of our planet and the need to care for it.
Transport and equipment
To achieve our aims we decided to use sustainable means of transport: horse and paraglider. This combination is not only very lowbudget, but also allows us to bring the necessary materials for our workshops and observations while minimising the weight on the horses because as soon as conditions allowed, one of us covered the daily distance with the paraglider while the other advanced with the three horses and our luggage. We carried two telescopes with us, a LightBridge Mini
82 for nightsky and especially lunar observations and a Coronado PST for daytime solar observations, both donated by the company Meade Instruments.
We also had to think carefully about the other materials we brought as electronic equipment, like computers and projectors, was normally not available in the villages we visited. We carried an inflatable solar system, magnifying glasses, a lunar puzzle, many different posters and of course play dough, string and other arts and craft materials.
Partnership
Before the expedition we were in touch with only four local collaborators in different major cities in Colombia; Bucaramanga, Tunja, Sopo and Medellin. However, each of them had a network of friends around the country who helped us to plan the route. Whilst useful, an exact plan and direct contacts at the village you plan to visit are not always possible, especially for very small villages with no internet connection. In these cases it is best to arrive in the village sometime in the late afternoon, make contact with the school’s headteacher and organise the activities for the next morning.
Rev
iew
KeywordsColombia, astronomy outreach, remote villages, solar telescope, South America
Marja K. SeidelCarnegie Observatories, Pasadena, [email protected]
The Flying Telescope: How to Reach Remote Areas in the Colombian Andes for Astronomy Outreach
Kira BuelhoffGrenoble, France

32 CAPjournal, No. 21, December 2016
The Flying Telescope: How to Reach Remote Areas in the Colombian Andes for Astronomy Outreach
Workshops
The workshops were intended to incite dialogue, curiosity and the joy of exploration. But how to achieve this, the more so in
Apart from the challenging logistics of traveling to remote villages in Colombia, the El Niño phenomenon also caused severe droughts and thus did not ease our travel.
the only possibilities they perceive and a higher education is not seen as an option.
The expedition
Over two months we travelled more than 1000 kilometres, from Bucaramanga to Calí, through remote terrain, and we offered workshops, observations and small experiments in almost thirty different schools, associations and village squares. Figure 1 shows the approximate route and locations. We started in the north and went by horse and paraglider (Figures 2 and 3) until close to Bogotá where we sold the horses and crossed the Magdalena river valley by bus to continue on foot and by paraglider to Calí.
Often we met with the entire school of the village we passed through. In the most remote places, this could mean only twenty to thirty children, but in the slightly bigger villages, we had up to three hundred children to entertain for an entire day with ages ranging from preschool up to the graduating high school class. We were also joined by adults during the public observations and everyone, no matter what their age, was fascinated by the telescopes. During the day, we observed with a Coronado PST and during the night with a LightBridge Mini, both generously donated by Meade Instruments. We still receive messages, mainly via our Facebook page4 or email, like “You really changed my perception of the world.” This is what makes it worth all the effort — and a lot of effort was needed.
Figure 1. The route of the expedition on the map of Colombia. The starting point was Bucaramanga in the north and we then proceeded southwards to Bogotá and then from Armenia towards Calí. Credit: Marja Seidel
Figure 2. Travelling with the two horses and the mule through the valley of a canyon between two mountain ranges, north of Tunja. Sometimes paths were too steep to even ride the horses. Credit: Marja Seidel
Figure 3. Travelling with the paraglider (and the telescope in the backpack of the harness). Credit: Marja Seidel

33
CAPjournal, No. 21, December 2016
The Flying Telescope: How to Reach Remote Areas in the Colombian Andes for Astronomy Outreach
We usually started with a simple question, such as “where is which planet in our Solar System?” and the attendees’ interests then dictated the further course of the activity. The workshop attendees then tried to reconstruct the Solar System. During this interactive workshop, we discussed each planet, first assessing prior knowledge and then giving detailed information, as detailed as we judged suitable according to the age group.
We also estimated the true size of the Earth with them. We again used our inflatable planets and started this activity by asking “Do you think this model of the Solar System is to scale? If the Sun was this size, who thinks the Earth would be this big? Who thinks it would be smaller? Bigger?” Compared to our large model of the Sun, the Earth was no bigger than half of their little fingernail. The interactive voting helped us to capture the children’s attention and awaken their curiosity. They were part of the activity, wanted to know more and were amazed at the sizes and distances when we re created the Solar System to scale using the play dough, realising that the entire village would be too small to reach Neptune.
We also discussed the Earth. Again we used our inflatable model Earth to first find out: “Where are we right now?” Colombia is the answer but it was often surprisingly difficult for the children, or even adults, to find the country on the model planet. There are no borders, no city names — it is the Earth as seen from space.
Another question related to the Earth’s colours. We talked about oceans, their abundance and the important role water plays in our survival. We discussed plants, their importance both for food and as climate regulators. Often we used this observation as a transition to an activity about plants, their morphology and their extraordinary capacity to transform carbon dioxide into oxygen. Of course this activity was adapted to the attendees’ age and ranged from the simple statement that we cannot survive without plants to complex photosynthesis diagrams that we had prepared on our posters with different stickers for them to complete the diagrams.
The workshops usually ended with the solar observations. Children and adults alike could not get enough of observing
Figure 4. Wrap up of the day of activities. Each participant tells us what he or she learned, was surprised by the most, and particularly enjoyed. This reflection on what has been learned is really helpful for the children to mem-orise what we have done with them and is a nice end to the day. Credit: Ricardo Gómez.
remote areas? In fact, it was far less complicated than one would expect. As soon as we arrived in a village, we would start talking to the inhabitants and ask for the local school teachers. Everyone always welcomed us really warmly and since these rural areas have normally never received support or international visits of any kind we were met with excitement. Arriving in the afternoon we would usually meet the school coordinator at home and plan activities for the next morning. So, early in the morning on the following day, we usually spent several hours with the entire local school on a central village square.
We brought an inflatable Solar System to teach about other planets. We had a large panel of different questions we could address with the help of our inflatable Solar System. Our goal was to provide a workshop different from their everyday school routine. We did not want to present information but rather motivate the children to learn and awaken their interest. In order to achieve this goal, our workshops did not follow a strict learning scheme but helped the attendees realise, understand and wonder about our unique planet and its place in the Universe.
Figure 5. Solar observations with the Coronado P.S.T. from Meade. Credit: Marja Seidel

34 CAPjournal, No. 21, December 2016
ent age groups. We sometimes split the children between us and often found one or two local helpers who we briefed before the activities and who helped us — usually these were the teachers themselves. We recommend talking to the teachers beforehand and giving them a rough walk through of the planned activities so that they can be part of the workshops. At the end of our activities we usually formed a circle and had each person explain what he or she had learned.
Towards the end of this project we had to sell the horses early. The drought was so severe that Colombia’s largest river was at the lowest point for fifty years. So we reduced our luggage drastically and crossed by bus towards Armenia and continued on foot and by paraglider. It was probably the first time that someone has flown with a telescope in a paragliding backpack, but it worked. Our glider fitted the small LightBridge Mini along with the inflatable Moon and Earth. We hiked and flew our way down the Cauca Valley towards Cali, still continuing to offer workshops and observations in the small villages we passed through. During these last days Colombia once more offered breathtaking night skies and we were lucky enough to observe Jupiter, Saturn and Mars together with the local people. The children loved to play with our green laser pointer. Of course, safety measures are really important here, but the children seemed sometimes to understand better than the older people. Together, we invented new constellations and let them tell their stories, while trying to find answers to all their questions.
Conclusion
Unfortunately, we could not stay much longer than one or two days in each place, but we always took contact information from teachers and older students in order to remain in touch, typically over Facebook or Email, although sometimes they only had a local phone number. We hope that out of the more than 1500 people we met during the expedition, some have really become curious and will follow their dreams and pursue higher education. We also hope that projects like this continue and that we will not only reach the big cities, but really go where no other outreach is done.
paraglider always seemed to inspire people’s imaginations. Of course these were also major logistical challenges around finding a place for us and the horses to stay but we always managed and this also enabled us to forge direct bonds with the people we stayed with.
The other major difference between our project and most other astronomy outreach projects is the focus on really remote locations which sometimes were only accessible on foot, by horse or maybe by a crosscountry motorbike. A minor, but also important, difference was that we were an entirely female team. The fact that we as women travelled alone and worked as scientists seemed to encourage in particular the girls and women we met. Having undertaken projects in mixed and femaleonly teams, we have observed numerous times that girls seem to show more curiosity and are less afraid of trying out an experiment when a female team was leading the activity. This setup does also create challenges though, especially in Colombia where at first men will not necessarily grant women the same respect. However, as soon as they realised that we knew what we were doing and did it well they would help and support our project with due respect.
Another challenge concerning the workshops could be the coordination of differ
The Flying Telescope: How to Reach Remote Areas in the Colombian Andes for Astronomy Outreach
the red ball with the tiny filaments to its sides all made visible by the Halpha ( ionised hydrogen) filter on our Coronado telescope (Figure 5). Sometimes, even the Moon was visible in the afternoon and we could observe it with the LightBridge Mini (Figure 6). One child claimed: “I always wanted to be a soccer player, but I think astronomer is just so awesome!” Of course, we do not think that everyone will become an astronomer. The aim of this project was not to teach detailed astronomy or ecology knowledge, but to transmit the joy of discovering and exploring and the feeling that there is so much more out there.
Challenges
All the above are just brief outlines of our workshops, which are generally similar to those delivered by other outreach organisations such as some programmes from Astronomers without Borders2 or Galileo mobile3. In all cases, the activities rarely follow a very strict outline but end up as a mix of different activities, led by the children’s questions and interests. The major difference between this project and previous expeditions delivered by the abovenamed groups is the means of transport. Using the horses created a much stronger bond between us as the organisers and the local population than would have been possible had we used a motorised vehicle, and the
Figure 6. Observing on the village square at night, everyone from police to children was equally amazed by the view of the Moon and planets through the LightBridge Mini 82. Credit: Marja Seidel

35
CAPjournal, No. 21, December 2016
WIN/Gallup International Association, Annual global End of Year survey reveals a world of conflicting hopes, happiness and despair, available from: http://www.wingia.com/web/files/richeditor/filemanager/WINGIA_Final_Press_Release_EOY_2015.pdf
Finally, we are so thankful for all the support during this trip: Meade Instruments for the two amazing telescopes which survived all this travel; Skywalk for paragliders that carried us about 400 km during this expedition; GoPro for a great camera capturing some of the extraordinary moments and Paula Iglesias and Ana Serna from Al Borde films who came along with proper equipment to film part of the journey; GPS live tracking and Spot for the live tracking and hence our parents’ health; Salewa for good helmets and clothing; Petzl for giving us lights; Le Bip Bip for solar pads and instruments; and Colombia paragliding, Leito Rey and Ricardo Gómez for the local support in the country.
We would be extremely happy to tell you more about this educational outreach adventure and about what we learned, so please contact us via our webpage5 where you can also find updates on forthcoming projects and on the documentary that we are developing with Al Borde films about the Cielo y Tierra expedition.
Notes
1 Full education statistics for Colombia: www.unicef.org/infobycountry/colombia_statistics.html
2 Astronomers without Borders: http://astronomerswithoutborders.org
3 Galileo mobile: http://galileomobile.astro.ufsc.br
4 Project Facebook: www.facebook.com/cieloytierra.project
5 Project webpage: www.cieloytierraproject.com
References
González, E. L. & López, R. V. 2012, available from: http://es.slideshare.net/KatherinLetrado/analfabetismo11874445 (in Spanish)
Unicef, Fast facts on Adolescents and Youth in Latin America and the Caribbean, avail able from: www.unicef.org/media/files/Fast_facts__EN.doc
The Flying Telescope: how to reach remote areas in the Colombian Andes for astronomical outreach
Confirmation of
CAPjournalsubscription
Dear Subscriber,
We are currently updating our subscribers database for the print edition of CAPjournal. If you wish to continue receiving a hard copy of the journal, please read on.
On the label of the envelope in which you received this issue of the journal you will find a unique web link, written in the format http://eso.org/capj/MMMM. Please do the following:
• Find your unique web link on the envelope of this issue.• Type the link into a browser.• Tick the box next to “Subscribe to receive CAPjournal”.• Press the “Submit” button.
By following these steps you will continue to receive the print version of CAPjournal.If you want to check your physical address, you can click on “Update your profile”. Enter your correct address and press the “Save” button.
If we have your email address, we will also send you an email to remind you about the confirmation of your subscription.This is your last chance to confirm your print subscription.
If you do not confirm your subscription by 15 March 2017, we will assume that you no longer have an interest in receiving CAPjournal in print form and wish to continue reading it online instead.
Marja K. Seidel is an astrophysicist and currently works at the Carnegie Observatories, Pasadena, USA. She is an expert in integral field spectroscopy and uses both kinematics and stellar populations to better understand the multitude of galaxies that we find in today’s Universe. Apart from her research, she is a dedicated science communicator in worldwide outreach events and expeditions.
Kira Buelhoff is both an environmental biologist with a special interest in alpine and arctic ecosystems and a nature guide. When she is not studying ecosystems or doing outreach projects, she guides hiking tours on glaciers and in the mountains.
Biographies

36 CAPjournal, No. 21, December 2016
Model one: the tactile constellation
The first model is limited to the tactile sense since there seems to be no proper way of switching to another sense. The main goal of this model is to show the difference between the appearance of a constellation of stars in the sky and their actual magnitudes and positions in space.
Not every constellation of stars can be converted into a model because some of them include giant stars which are visible over huge distances. Without making use of a logarithmic length scale, a model of such a constellation would be too large to manage.
With this in mind and after some consideration the constellation Cassiopeia was selected. The model (shown in Fig ure 1) shows how the constellation appears on the sky, with five main stars that have almost the same apparent magnitude. The model further contains information about the real distances of these five stars
Introduction
The desire to give visually impaired and blind people access to astronomy has long been pursued. In Germany these efforts can be traced back to the 1960s. These projects have mainly tried to communicate classic astronomy, using, for example, models of the Moon, a representation of the Sun’s activity or a planisphere. All of these techniques centred on tactile elements (Henschel, 1965) and so too have many of the more modern attempts, mimicking their predecessors but using modern lightweight materials (Carvalho and Aquino, 2015).
To give everyone a chance to develop a world view that is compatible with our scientific knowledge, engagement with astronomy needs to go beyond classic astronomy and integrate astrophysical topics. Modern attempts to communicate scientific advances in the field of astronomy have involved, for example, tactile images of currently active instruments, specifically
the Hubble Space Telescope (Grice, 2007; Grice et al., 2007; and Arcand et al., 2010).
The first aim of the work presented here is to give visually impaired people access to different astronomical subjects. This should include classical astronomical questions as well as modern astrophysical topics.
The second aim is to extend such astronomical models beyond the use of the tactile sense. Many details, such as the temperature of an object, can be represented in a model, leading to a stronger connection between the model and the original phenomenon. Examples of models which respond to different senses will be presented in this article.
Currently all the models have a plain design, because they were mainly made for entirely blind people. Further infor mation in the form of colour can easily be added if they are to be used by a mixed audience.
This article presents a number of ways of communicating astronomy topics, ranging from classical astronomy to modern astrophysics, to the blind and visually impaired. A major aim of these projects is to provide access which goes beyond the use of the tactile sense to improve knowledge transfer for blind and visually impaired students. The models presented here are especially suitable for young people of secondary school age.
KeywordsVisually impaired, accessibility, disabilities
Simon KrausPhysics Education Research Group, University of Siegen, [email protected]
Astronomy for the Blind and Visually ImpairedBes
tP
ract
ices
Figure 1. The model Tactile Constellation shows the apparent magnitudes and distribution of the stars in the constellation of Cassiopeia (left) and the real magnitudes and distances of the stars (right). Credit: S. Kraus

CAPjournal, No. 21, December 2016
37Astronomy for the Blind and Visually Impaired
spheres with different diameters and temperatures. The smallest sphere is at room temperature while the other spheres are warmed to temperatures of 33°C and 42°C.
The temperature is regulated by two containers filled with water, heated by immersion heaters and controlled by electronic thermostats. Warm water is pumped through flexible tubes from the container to the corresponding sphere. These pumps can be easily sourced at low cost. In our project one pump (P1 in figure 3) was originally designed to be used in a computer’s water cooling system. The second pump (P2 in Figure 3) was made for an aquarium. This setup guarantees a uniform temperature over the whole surface of each sphere.
from each other, and from the observer. It becomes clear that the appearance of the constellation has no relation to the real distribution of the stars in the Universe.
The second important piece of information one can obtain from this model is that the absolute magnitudes of the stars increase with increasing distance from the observer. Absolute magnitudes are represented by the different diameters of the wooden spheres mounted on the wires. Each wire connects one of the spheres with one of the hemispheres mounted on the model’s front.
The combination of these simple physical facts leads to the insight that this constellation is unique for observers positioned in our Solar System.
Model two: the Hertzsprung–
Hertzsprung–Russell diagram
The second model leads us away from classical astronomical observations. Instead it represents an important relationship between two properties in astrophysics, namely the luminosity and temperature of main sequence stars. The Hertzsprung–Russell diagram (HRD) illustrates the connection between these variables. It can be shown through the diagram that for main sequence stars a higher surface temperature necessarily implies a larger radius of the star — big stars are hotter than smaller ones.
Since temperature is key to this concept it is desirable to represent it within the model. The model therefore comprises three metal
S1 S2 S3
ET1 ET2PS
IH2IH1
TS2TS1
P1 P2
Figure 2. The three spheres shown here represent different main sequence stars. Credit: S. Kraus
Figure 3. Schematic overview of the main sequence star model: spheres (S), pumps (P), immersion heaters (IH), electronic thermostats (ET), thermostat sensors (TS) and power strip (PS). Credit: S. Kraus
Figure 4. Tactile image of the Hertzsprung–Russell diagram and the corresponding template. Credit: S. Kraus

PARI 2017Workshop on Public Awareness of Research Infrastructures
Communicating theImportance of Science to Society
ESO Headquarters, Garching bei München, Germany29–30 May 2017
Science is exciting, enlightening, complex, fundamental, precise, logical, and creative, all at the same time. However, for the public to get in touch with it and under-stand why it encompasses all these concepts, efforts need to be made to bridge science and society. With this aim, communication teams in research infrastructures work with a range of methods and channels. They make complex information more tangible and disseminate it as broadly as possible so that the public can understand and be engaged.
This conference will be a hands-on forum for communi-cation officers and public relations staff to share their experiences and expertise. The aim is that participants return home with new ideas for their work, by learning how and by what means other research institutions are communicating the importance of science and research infrastructures to society.
Topics include:
– Evaluation of communication activities and impact– Unconventional outreach: thinking out of the box– Online social media channels– Crisis communication– Communication with small budgets– Funding for communication outside the known pathways
(e.g. crowdfunding, companies, European Commission)– Museums and visitor programmes
Contact: [email protected] www.frm2.tum.de/PARI-2017
38 CAPjournal, No. 21, December 2016
Astronomy for the Blind and Visually Impaired
References
Arcand, K. K. et al. 2010, CAPjournal, 8, 15
Carvalho, C. L. & Aquino, H. A. 2015, CAPjournal, 17, 36
Grice, N. 2007, Astronomy Education Review, Vol. 5
Grice, N. et al. 2007, Touch the invisible sky, a multiwavelength braille book featuring tactile NASA images, (San Juan)
Henschel, G. 1965, Astronomie in der Oberschule für Sehgeschädigte, in Blick in das Weltall, 9, 80
Isidro, G. M. & Pantoja, C. A. 2014, CAPjournal, 15, 5
Kraus, S. 2015, Astronomie für Blinde und Sehbehinderte, Dissertation, Universität Siegen, http://dokumentix.ub.unisiegen.de/opus/volltexte/2016/976/index.html
Students can handle the model and compare the diameters and temperatures of the spheres to deduce how the properties of the stars are correlated. The high temperature and twentycentimetre diameter of the biggest sphere led one student to describe it as a star “with tremendous power”.
To supplement this activity, students can study a tactile image of the complete HRD, which can easily be produced out of everyday objects (Figure 4). They thereby have the chance to compare their impressions with this graph.
Model three: sunspots
The third model represents a phenomenon which can easily be observed even with small telescopes: sunspots. These are caused by strong magnetic fields breaking through the Sun’s photosphere. This causes convection to slow down and decreases the temperature by more than 1500 K in comparison with the periphery. Therefore, the model should communicate both the (relatively) low temperature of the spots and the magnetic field.
Unlike other models (Isidro and Pantoja, 2014) there is no tactile element to the model Sun’s surface. Given that the main effect is caused by temperature differences the model instead makes use of the sense of temperature. To achieve this, the model Sun is made out of a plastic globe. On its inner surface several thermoelectric elements are placed with their cool sides pointing outwards. Small fans are mounted in the globe, pointing towards the thermoelectric elements and enhancing their cooling effect. The elements come in groups of two, illustrating the ideal bipolar sunspot groups that can often be observed on the Sun (see Figure 5 for schematics).
In the first step the model is explored with the fingertips and sunspots are identified by the drop in temperature over the elements. In the second step the exploration can be continued by means of a magnet. A magnet is a well known and very simple tool and is therefore appropriate for the exploration of the sunspots’ magnetic fields. A student will be able to detect the opposite magnetisation within a single group of sunspots and between the two hemispheres of the Sun.
Altogether the model allows students to identify the temperature drop, recognise the presence of a magnetic field, find the ideal appearance of the sunspots in bipolar groups and compare the relationship between the magnetic polarisation within a group of sunspots and between the two hemispheres.
The model is nevertheless limited in its representation of a sunspot for technical reasons, and the restricted resolution of our sense of temperature. There can be no differentiation between the umbra and penumbra of a single spot, which can easily be recognised with a small telescope thanks to the different colours.
Conclusion
The development of models for visually impaired people not only gives these students access to an important natural science but is also an important step towards a conception of the world that is complete and compatible with modern scientific knowledge.
What is more, adapting a topic to suit the needs of visually impaired or blind students may yield models and concepts that can be of great advantage to sighted people too.
Fan
Connection line
Airflow
Connector
Heatsink
Peltier element
Magnet
Figure 5. Schematic illustration of the model “sunspots”. Credit: S. Kraus
Simon Kraus obtained his doctorate at the University of Siegen, Germany. In his dissertation he demonstrated new methods for teaching astronomy and astrophysics to blind and visually impaired learners. He is also interested in using science fiction in physics lessons and finding ways to implement experiments and models about renewable energy in school.
Biography

PARI 2017Workshop on Public Awareness of Research Infrastructures
Communicating theImportance of Science to Society
ESO Headquarters, Garching bei München, Germany29–30 May 2017
Science is exciting, enlightening, complex, fundamental, precise, logical, and creative, all at the same time. However, for the public to get in touch with it and under-stand why it encompasses all these concepts, efforts need to be made to bridge science and society. With this aim, communication teams in research infrastructures work with a range of methods and channels. They make complex information more tangible and disseminate it as broadly as possible so that the public can understand and be engaged.
This conference will be a hands-on forum for communi-cation officers and public relations staff to share their experiences and expertise. The aim is that participants return home with new ideas for their work, by learning how and by what means other research institutions are communicating the importance of science and research infrastructures to society.
Topics include:
– Evaluation of communication activities and impact– Unconventional outreach: thinking out of the box– Online social media channels– Crisis communication– Communication with small budgets– Funding for communication outside the known pathways
(e.g. crowdfunding, companies, European Commission)– Museums and visitor programmes
Contact: [email protected] www.frm2.tum.de/PARI-2017

CAPjournal submission guidelinesWe are keen to encourage readers to submit their own articles, reviews, etc. Some key points are addressed below.
Technical and esoteric language should be either avoided or used with a footnoted explanation if absolutely required. All contributions will be made to conform to British spelling and punctuation practice. Figures and tables should be referred to as “Figure n” and “Table n” respectively. Acronyms should be spelt in full once and then parenthesised; thereafter they can then be used as lettered acronyms. Numerals should be used for numbers greater than two words and always for numbers greater than ten.
Manuscripts should be delivered in MS Word or text (.txt) format, with no formatting apart
from bold, italics, super and subscripts. Hard carriage returns after each line should be avoided, as should double spacing between sentences. If the contribution contains figures, these may — just for the sake of overview — be pasted inline in the Word manuscript along with the caption (Word files below 4 MB are encouraged). However, images must also be delivered individually as Tiff, PDFs, vector files (e.g.,.ai,.eps) in as high a resolution as possible (minimum 1000 pixels along the longest edge).
CopyrightAuthors are solely responsible for ensuring copyright clearance to reproduce illustrations, text, etc., for which they themselves do not own the copyright. CAPjournal accepts only original submissions and will only reproduce previously published work by special arrangement.
ContactSubmissions should be sent to the Editor:[email protected]
Sponsors
www.capjournal.orgOnline issues
Free subscriptionsArticle submission
Review
Column
Research & Applications
Best Practice
Announcement
Explain in 60 Seconds
News
Submit articles for oneof the following journal sections:
Colophon
SponsorsIAU and ESO
AddressCAPjournal,ESO ePOD,KarlSchwarzschildStrasse 285748 Garching bei MünchenGermany
Websitewww.capjournal.org
Phone: +49 89 320 06 761Fax: +49 89 320 2362
ISSNs19965621 (Print)1996563X (Web)
Editor-in-ChiefGeorgia Bladon
Executive EditorLars Lindberg Christensen
ProofreaderPeter Grimley
Layout and ProductionMafalda MartinsJutta Boxheimer
ContributorsSebastian DanielsPedro MondimElizabeth PearsonEmily L. RiceBrian W. LevineChris ImpeyMatthew WengerMartin FormanekSanlyn Buxner
Marja K. SeidelKira BuelhoffSimon Kraus
Web Design and DevelopmentRaquel ShidaMathias Andre
DistributionSebastian WassillOana Sandu
IAU DIVISION CCommission C2 Communicating Astronomy with the Public Journal Working GroupFarid CharLars Lindberg ChristensenGeorgia BladonPedro RussoDetlef KoschnyBruno Merín Martín