jonathan cockram –united utilities • duncan allen – • tim ...€¦ · %age so 0.5 for 2:1...
TRANSCRIPT

PRV Workshop
• Jonathan Cockram – United Utilities
• Duncan Allen –
• Tim Balding - Atkins

PRV Workshop
• General model settings for different types of PRVs (yes you should all know this)
• In depth/advanced/improved PRV model settings?
• Problem Valves• Hour Day Factors (If we have Time)

Modelling PRVs - General Model Settings
• Typical model settings for mains types of PRV schemes for Infowater, Infoworks & Synergee– Fixed Outlet– Flow Modulated– Time Modulated– Closed loop – Maintaining a fixed pressure at a CP– Fixed Ratio (e.g. 2 to 1 halves the pressure?)– Are other methods being used?

PRVs - InfoWorks
• InfoWorks has straightforward approach to modelling PRV’s
• Various valve types allow a lot of options• Quick to set up – usually only a few boxes to
be completed• Allows us to quickly set up/insert a PRV and
obtain an understanding of the network impact
• 15 minute data – believe generally fine but not always sure what is going on in interim
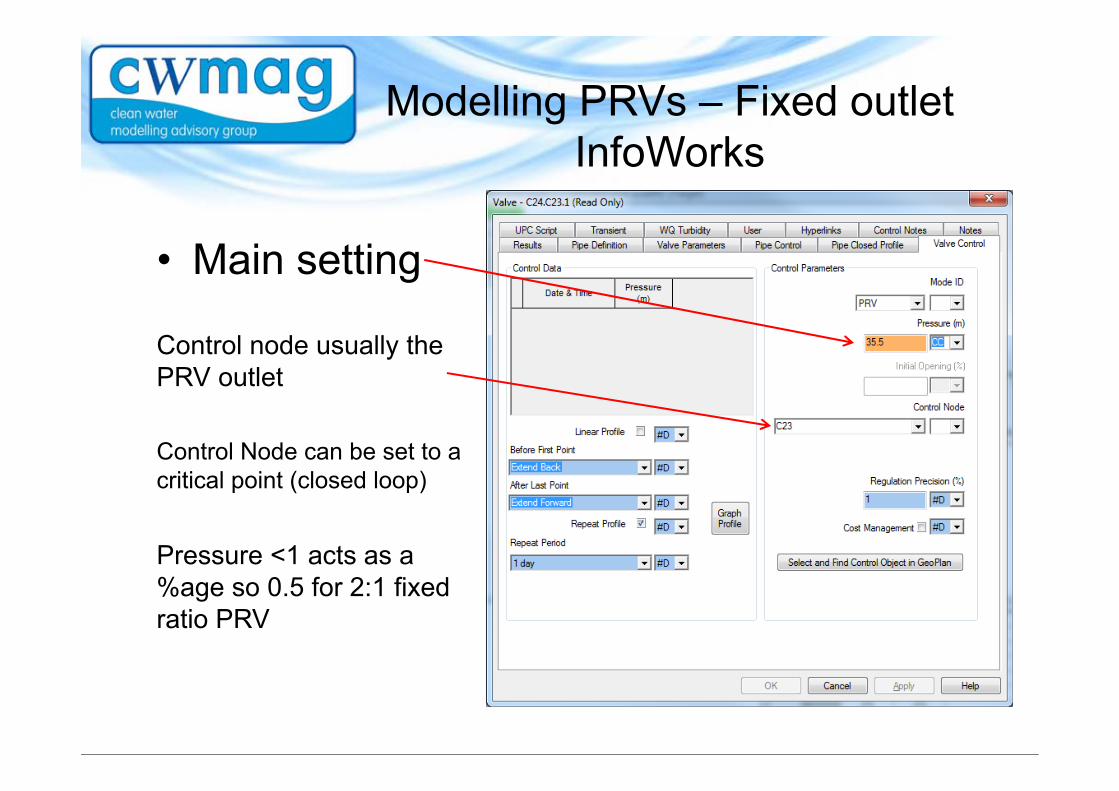
Modelling PRVs – Fixed outletInfoWorks
• Main setting
Control node usually the PRV outlet
Control Node can be set to a critical point (closed loop)
Pressure <1 acts as a %age so 0.5 for 2:1 fixed ratio PRV

Modelling PRVs – Flow Modulated InfoWorks
Flow Modulating Valve
Flow to pressure table
Control node usually PRV outletControl pipe usually the PRV(or meter next to the PRV)

Modelling PRVs – Time Modulated InfoWorks
Time Modulating Valve
Time to outlet pressure table
Control node usually PRV outlet

PRVs - Infowater• InfoWater can model eight types of control valves.
• Pressure Reducing Valve (PRV) – Pressure regulating valves limit the pressure on their downstream end to not exceed a pre-set value when the upstream pressure is above the setting. InfoWater automatically computes in which of three different states a PRV can be in:– Partially opened (i.e., active) to achieve its pressure setting on
its downstream side when the upstream pressure is above the setting
– Fully open if the upstream pressure is below the setting – Closed if the pressure on the downstream side exceeds that
on the upstream side (i.e., reverse flow is not allowed).

Modelling PRVs – Fixed outletInfoWater

Modelling PRVs – Time Modulated InfoWater

Modelling PRVs – Flow Modulated InfoWater

PRVs - Synergee
• SynerGee has relatively straightforward approach to modelling PRV’s
• Fixed outlet PMV’s• Time modulated• Flow modulated
• This can be both a disadvantage and advantage
• Allows us to quickly set up/insert a PRV and obtain an understanding of the network impact

Modelling PRVs – Fixed outletSynergee
Control node

Modelling PRVs – Time Modulated SynerGee
Profile added to control node
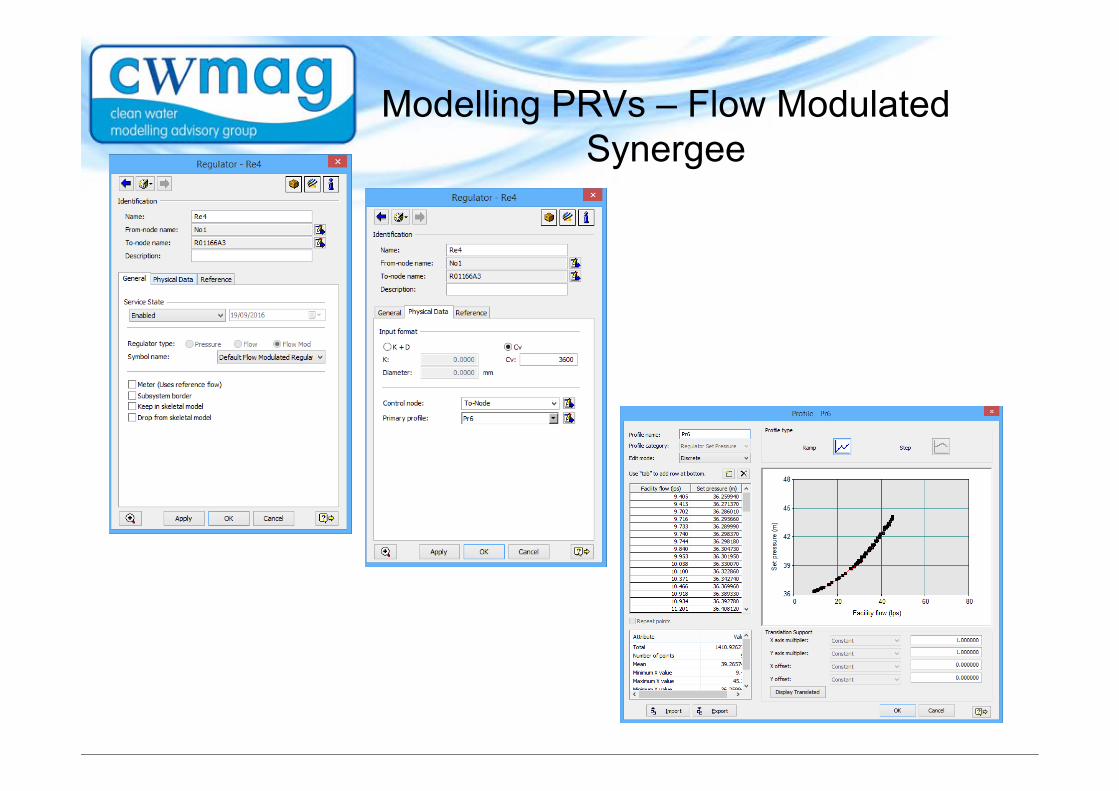
Modelling PRVs – Flow Modulated Synergee

Question / Debate 1
• Is this how you model general PRV settings– Variations? Differences?
• Other− Differences for types of PRVs or one size fits all− Source of information− Any other types of control
• More in-depth in next section

Improved Modelling of PRVs?In depth/advanced/improved?
• What we hope to achieve in this section– In preparation for this workshop we researched PRVs and
made some (potentially interesting) discoveries– This section is a summary of our findings – How to set up a PRV more accurately (We hope)
• Generally does not seem to impact on existing models unless critical flow rates are being exceeded
– Raise some points for debate?

K = Head loss coefficient for the valve fully open
Cv = flow of water in gallons per minute @ a pressure drop of 1 lb per square inch (again fully open)
Information required by the SynerGeeRegulator
Where can we get this information from ?
For a given fluid, the dimensionless constant K is considered constant for a given valve obstruction under all conditions of flow. Thus the head loss coefficient will vary only with the extent of opening in the valve

Fitting KGlobe valve (fully open) 10.0Angle valve (fully open) 5.0Swing check valve (fully open) 2.5Gate valve (fully open) 0.19Close return bend 2.2Standard tee 1.8Standard elbow 0.9Medium sweep elbow 0.75Long sweep elbow 0.60
Head Loss Coefficients for Various Fittings
This table was derived from Fluid Mechanics, Seventh Edition, Streeter, Victor L., and Wylie, E. Benjamin, McGraw Hill, 1979.
Typical K values

Information obtained manufacturers from sizing software Computed Cv (l/s)
Computed K
When we set the valve to drop the pressure by 1 bar our computed Cvwill gives us our Q max ie flow when valve is fully open

Compare the K values in the sizing software with the way the PMV reacts in SynerGee
Simple model set up in SynerGee to study how SynerGeeregulators workWe can’t show velocities through a
regulator in SynerGee
We can’t show the K or Cv values at any given Tau for the regulator
All Coefficients have to be inferred
• For a 150mm PRV K =18.6• This gives us the same response in
SynerGee as predicted on the sizing software

Valve Type NGESize [mm] 150Globe/Angle : [1/2] 1Normal/Reverse : [1/2] 1STD/LFS/ACS : [0/1/2] STDQ max. : [l/s] 10.0Q min. : [l/s] 5.0P. Inlet : [bar] 3.0
P. Outlet : [bar] 2.0
Other Cv : [l/s] 0Print : [F,D,UK] 1
Opening Curve TestTotal volume [l] 0.640Removed volume [l] 0.066Computed Cv [l/s] 58Computed K [-] 18.6Seat [mm] 100
Cv Opening K V sys. DH DH Lift Section V seat L eq.
l/s [%] [%] [-] [m/s] [m] valve [m] [cm] [cm2] [m/s] [km] l/s m/s
Head drop (m)
Tau with18.6 k
Tau with Cv241
58 100 100 19 3.3 10 10.2 2.81 88.32 6.6 0.12 58 3.282 10 1 150 86 82 25 2.8 10 7.6 2.30 72.13 6.9 0.16 50 2.846 10 0.873 0.87345 78 74 31 2.5 10 6.1 2.08 65.37 6.9 0.19 45 2.539 10 0.784 0.78540 69 67 39 2.3 10 4.9 1.88 59.17 6.8 0.25 40 2.256 10 0.697 0.69835 60 60 51 2.0 10 3.7 1.69 52.98 6.6 0.32 35 1.973 10 0.609 0.6130 52 53 69 1.7 10 2.7 1.49 46.89 6.4 0.44 30 1.697 10 0.522 0.5225 43 47 100 1.4 10 1.9 1.31 41.19 6.1 0.63 25 1.407 10 0.435 0.43520 34 41 156 1.1 10 1.2 1.15 36.08 5.5 0.98 20 1.124 10 0.348 0.34815 25.9 35.5 278 0.8 10 0.7 0.99 31.22 4.8 1.74 15 0.841 10 0.261 0.26110 17 29 625 0.6 10 0.3 0.81 25.45 3.9 3.92 10 0.558 10 0.174 0.174
5 8.6 18.6 2500 0.3 10 0.1 0.52 16.37 3.1 15.63 5 0.282 10 0.087 0.087
Modelleddata
CV SynerGee = / ∗.

Modelling PRV’s
Calibrated model should have the correct K value for the PRVIncorrect K values will impact on the results when the valve is at it’s capacity
• 150mm PRV with k of 18.6• Flow rate of 81 l/s
150mm PRV with K of 5Flow rate of 81 l/sThe lower K value allows the modelled PRV to control pressures at higher flow rates
1
2

• Manufactures recommend 70% opening as max– SynerGee reports purely on the hydraulics
• Model the PRV and check also against the sizing software
PRV limits

Modelling PRVs - InfoWorks
• Using Cla-Val sizing software – need the Cv

Modelling PRVs - InfoWorks
• Similar for IVL (Dorot) sizing software
• Cv – imperial• Kv – MetricBelieve this ism3/hr

InfoWorks headloss through valves
• InfoWorks calculates the headloss through a valve as the sum of:– Pipe friction loss– Pipe minor loss– Valve opening minor loss
• Generally our valves are short lengths of pipe so first two are largely irrelevant for this
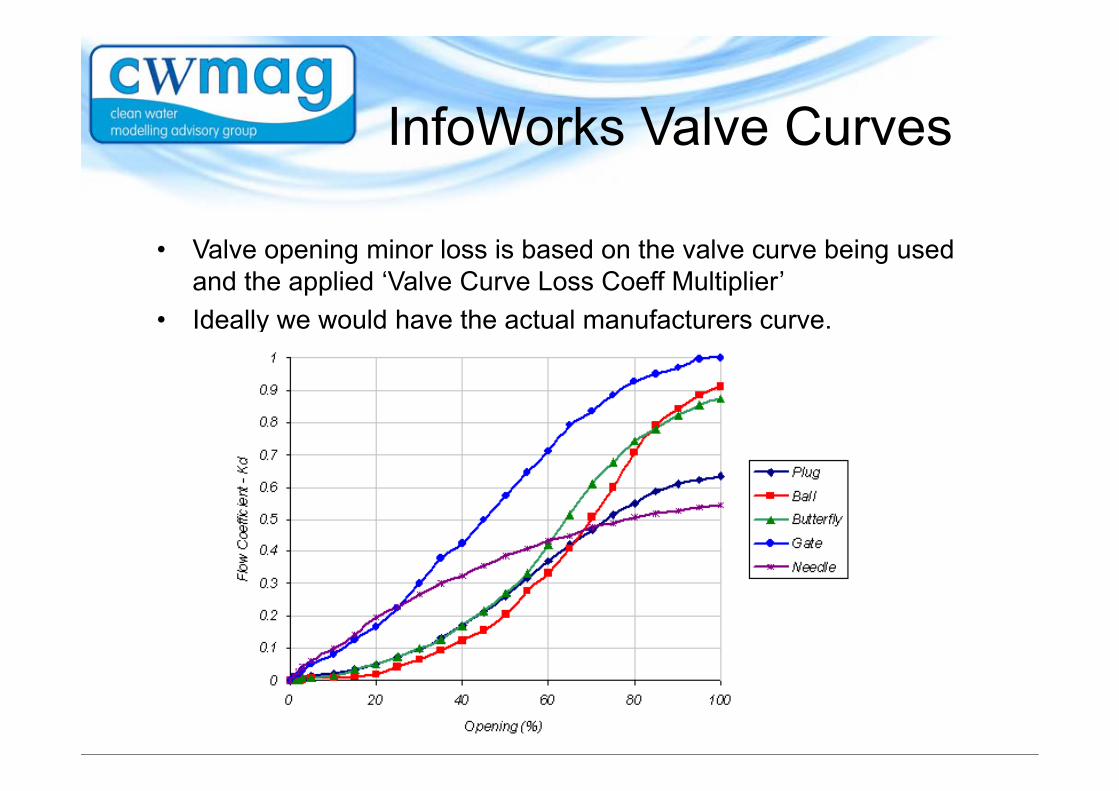
InfoWorks Valve Curves
• Valve opening minor loss is based on the valve curve being used and the applied ‘Valve Curve Loss Coeff Multiplier’
• Ideally we would have the actual manufacturers curve.

Modelling PRVs -InfoWorks
• Cv is 58 l/s (flow at which pressure drops by 10m when valve fully open)
• Essentially adjust Loss Coeff until valve operation curve matches the Cv

Modelled Example
• Cv of 58l/s• Flow set to exceed this
during the day• Inlet pressure set to 30m• PRV control set to fixed outlet
of 20m

Modelled outputs%age open and PRV outlet pressure

Updating existing models• I have increased the loss coefficient multiplier on PRVs in few
models• Impact has been minimal to existing calibration• Main exception has been fully open PRVs as headloss increased
through them but even this is minor

Valve <1% open• Loss coefficient between 0% & 1% is essentially indeterminate• InfoWorks uses a loss coefficient of 100000 at 1% and quotes “Fully
Closed” at 0% - actually uses a loss value of around 1 x 10^12• Therefore each change of 0.1% between 0% & 1% interpolates to avery large headloss value givinga minor instability in the results
Any valve dropping below 1% open is detailed in the run log

Valve <1% open

Modelling PRVs -InfoWorks
• From my experiments increasing the multipliers has:– Had minimal impact on the model calibration– Kept the valves at more than 1% open
• What next (personally speaking)?– Ideally I want a table of Cv’s for different PRV make and models– I think a default multiplier should be applied

Question / Debate 2
• Does anyone apply these factors (Cv, K&D etc.)• Does anyone do something different for the same
results• Does anyone look up Cv etc. for PRVs
– Variations? Differences?– What source of information do you use?– Differences for types of PRVs or one size fits all
• Will this change how you model PRVs

Problem PRVs
• Some common issues we have come across
• How we have modelled them
• Are there better ways to model them?
• Any other typical issues?

PRV Bleed through
• Nighttime pressure increases• Believe the zone is tight – No BVs in some areas

PRV Bleed through

PRV Bleed through
• Alternative options• If flow unknown then
time control

Poorly performing PRVs?
• Fixed outlet varying over around 8m• d/s of PRV – u/s >50m, Qmax 12 l/s 100mm PRV• Sometimes modelled with full time control i.e. 96 outlet pressures

Poorly performing PRVs?

1. Using the K value to produce head loss across the valve
As the Tau of the valve is changing as the PRV operates we only get a pressure drop at our maximum flow rate i.e. when the valve capacity has been reached
Modelling problem PRV’s

The Throttled valve2. Fixed tau caused a head loss response at flows less than the PRV’s capacity. This method gives a better match to logged data

Flow related pressure drop on PRV Outlet
15% THV100mm PRVCv=33l/s

Flow related pressure drop on PRV Outlet
• Should we use them?• In my opinion
– More accurate until the PRV is fixed / maintained etc.– Will highlight a potential issue in scenario work
• Would rather do a flow discharge test through a PRV to confirm no issue than have a new development go without water etc.
– ADPW Scenario as ‘Worst Case’ so THV also ‘Worst Case’– At Scottish Water we flag the THV as a Virtual Asset (VA)
• Risk is they over exaggerate the issue

Closed Loop issues
• These get modelled perfectly• The one I have modelled there were interruptions to
the Radio Signal• If signal interrupted the PRV went to a default setting• Data was up and down all day• Can we model Radio Signal interruptions?

Slow valve changes?
• Can we model slow valve operations?• What do the graphs look like?• We suspect that we do not see any resolution
on this as we typically log at 15 mins

Poor PRVs – options?
• What can we do?– Maintenance pre field test?– Maintenance post field test?
• Relog post maintenance?• Keep calibration actions in the model or remove for
generic day – esp THV

Question / Debate 3
• Problem Valves– How do you model problem valves and get them to match calibration
data– Profile used to match calibration data (personal pet hate)
• What can be done– PRV maintenance – when before or after the field test?– Do you re-log after maintenance?
• Others