john smiciklas u4ssc auditor
TRANSCRIPT

John Smiciklas
U4SSC Auditor

Content
• Overview - United for Smart Sustainable Cities Initiative (U4SSC)
• Key Performance Indicators for Smart Sustainable Cities
• Dubai Case Study
• Singapore Case Study
• Other Reports
• How to Become Involved

United 4 Smart Sustainable Cities (U4SSC)
USSC is a United Nations Initiative coordinated by
ITU and UNECE and supported by other 14 UN agencies to respond to the Sustainable Development Goal 11: "Make cities and human settlements inclusive,
safe, resilient and sustainable.
It advocates for public policy to encourage the use
of ICTs to facilitate and ease the transition to smart
sustainable cities.
Supported by:
U4SSC publications
Available for free on the U4SSC website: http://itu.int/go/U4SSC

U4SSC current work
Guidelines on tools and mechanisms to finance SSC projects
Guidelines on strategies for circular cities
City science application framework
Blockchain 4 cities
Guiding principles for artificial intelligence in cities - New
The impact of Artificial Intelligence and cognitive computing in
Cities - New
The impact of data processing and computation in cities - New
The impact of sensing technologies and IoT in cities - New

U4SSC Key Performance Indicators for Smart Sustainable Cities
https://www.itu.int/en/publications/Documents/tsb/2017-U4SSC-Collection-Methodology/index.html

The U4SSC Initiative has developed a set of international
key performance indicators (KPIs) for Smart
sustainable cities (SSC) to establish the criteria to
evaluate ICT´s contributions in making cities smarter and
more sustainable, and to provide cities with the means
for self-assessments.
Over 50 cities worldwide are already implementing these KPIs
U4SSC Key Performance Indicators for Smart Sustainable Cities
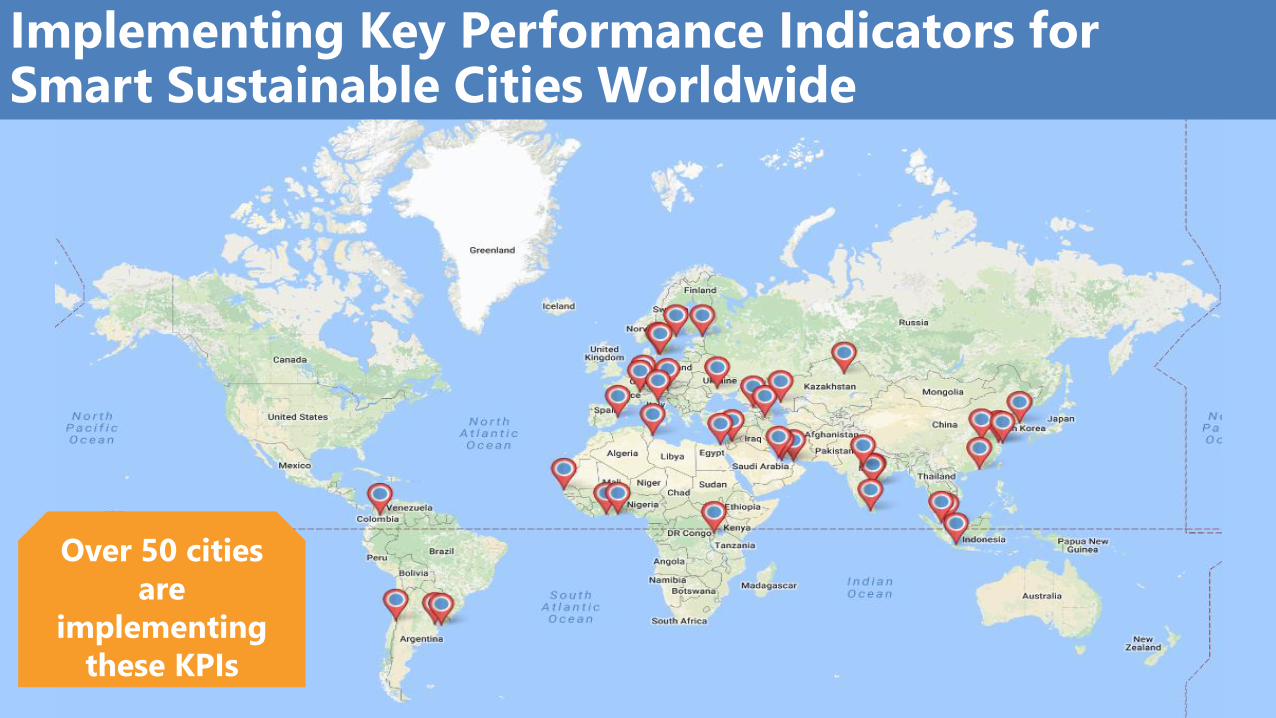
Implementing Key Performance Indicators forSmart Sustainable Cities Worldwide
Over 50 cities
are
implementing
these KPIs

Achieving the Sustainable
Development Goals
Becoming a smarter city
Becoming a more sustainable city
These indicators have
been developed to
provide cities with a
consistent and
standardized method to
collect data and measure
performance and progress
to:
Cities will be able to:
Compare their progress over
time
Compare their performance to
other cities
Through analysis and sharing
allow for the dissemination of
best practices
Set standards for progress in
meeting the SDGs
Objectives

KPIs Principles
Comprehensiveness: The set of indicators should cover all the aspects of SSC.
Availability: The KPIs should be quantitative and the historic and current data should be either available or easy to collect.
Simplicity: The concept of each indicator should be simple and easy to understand for the urban stakeholders.
Timeliness: This refers to the ability to produce KPIs with respect to emerging issues in SSC construction.

KPIs Structure
Economy Environment Society and CultureDimension
54 Core Indicators + 37 advanced Indicators
20 Smart + 32 Structural + 39 Sustainable
132 Data Collection Points
3 Dimensions
ICT
Productivity
Infrastructure
Environment
Energy
Education, Health and
Culture
Safety, Housing and
Social Inclusion
Sub-
dimension

KPIs Structure (2)
Economy
ICT Infrastructure
Water and Sanitation
Drainage
Electricity Supply
Transport
Public Sector
Innovation
Employment
Waste
Buildings
Urban Planning
Environment
Air Quality
Water and Sanitation
Waste
Environmental Quality
Public Space and
Nature
Energy
Society and Culture
Education
Health
Culture
Housing
Social Inclusion
Safety
Food Security
Dimension
Category
ICT
Productivity
Infrastructure
Environment
Energy
Education, Health and
Culture
Safety, Housing and
Social Inclusion
Sub-
dimension

KPI Examples
Sources – where we found it
Rationale – why we included it
Benchmarking – what are
good trends
Description and
Categorization of the KPI
How to calculate and units
Sources and SDG

U4SSC KPIs Advantages
The first and only International Standard supported by
16 United Nations Agencies and Programmes;
Policy tool;
General screening of the city that allows to identify the
areas of improvement and give cities the opportunity to
assess its own progress;
Allows cities to develop better strategies for the
management of the city;
Provide cities with the possibility to compare itself with
other cities allowing an International Collaboration;
Help cities to achieve the Sustainable Development
Goals.
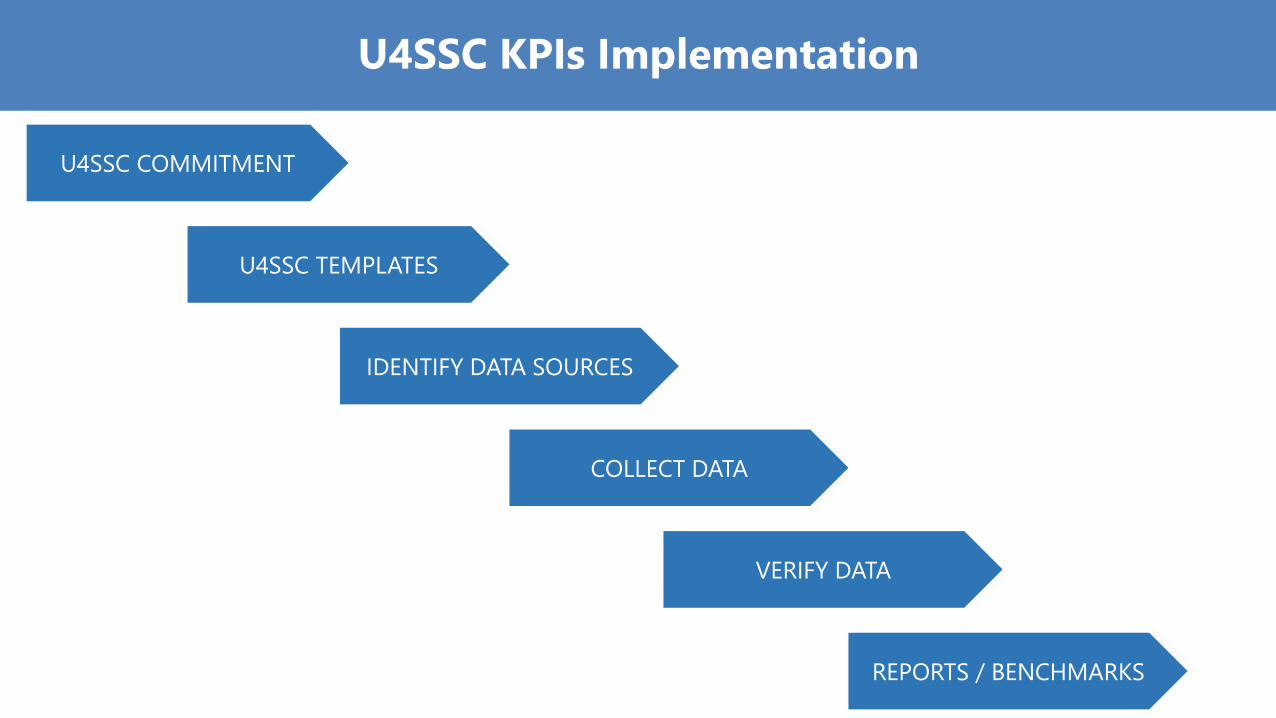
U4SSC KPIs Implementation
U4SSC COMMITMENT
U4SSC TEMPLATES
IDENTIFY DATA SOURCES
COLLECT DATA
VERIFY DATA
REPORTS / BENCHMARKS

Implement these KPIs now and measure the smartness and sustainability of your city
“You cannot manage what you
cannot measure”
Therefore……
You cannot improve it!
-Peter Drucker

Implementing ITU-T International Standardsto Shape Smart Sustainable Cities
Case Study - Dubai

Implementing ITU-T International Standards to Shape Smart Sustainable Cities – Case Study - Dubai
• First City to Pilot Test KPIs
• These indicators are contained in Recommendation ITU-T L.1601: Key
performance indicators related to the use of information and
communication technology in smart sustainable cities, and in
Recommendation ITU-T L.1602: Key performance indicators related to
the sustainability impacts of information and communication
technology in smart sustainable cities.
• Provided Feedback to Improve KPIs
• Updated KPIs a Direct Result of Dubai Feedback

Implementing ITU-T International Standards to Shape Smart Sustainable Cities – Case Study - Dubai
The case of Dubai
The Case of Dubai” details Dubai’s ambitious and trailblazing journey towards becoming a
smart city, a venture worthy of emulation by other aspiring smart cities around the world.
Available for free on the ITU-T SSC website: http://itu.int/go/ITU-T-SSC

Implementing ITU-T International Standardsto Shape Smart Sustainable Cities
Case Study - Singapore

Total % KPIs Verified of
Total KPIs
EconomyCore KPIs 23 100%
Advanced KPIs 22 82%
EnvironmentCore KPIs 12 100%
Advanced KPIs 5 60%
Society & CultureCore KPIs 20 90%
Advanced KPIs 9 56%
OverallCore KPIs 55 96%
Advanced KPIs 36 72%
Total 91 87%
87% of the KPIs verified
Implementing ITU-T International Standards to Shape Smart Sustainable Cities - Case Study - Singapore

Implementing ITU-T International Standards to Shape Smart Sustainable Cities - KPI Reporting and Verification
Total Reported Verified % KPIs Verified
Economy
Core KPIs 23 23 23 100%
Advanced KPIs 22 22 22 100%
Environment
Core KPIs 12 11 11 92%
Advanced KPIs 5 5 5 100%
Society & Culture
Core KPIs 19 19 19 100%
Advanced KPIs 10 9 9 90%
Overall
Core KPIs 54 53 53 98%
Advanced KPIs 37 36 36 97%
Total 91 89 89 98%

Implementing ITU-T International Standards to Shape Smart Sustainable Cities - Benchmarking
Performance to Benchmarks – Dimensions
- Categories
- KPIs

Implementing ITU-T International Standards to Shape Smart Sustainable Cities - Snapshot Report
Performance to Benchmarks – Sub Dimensions
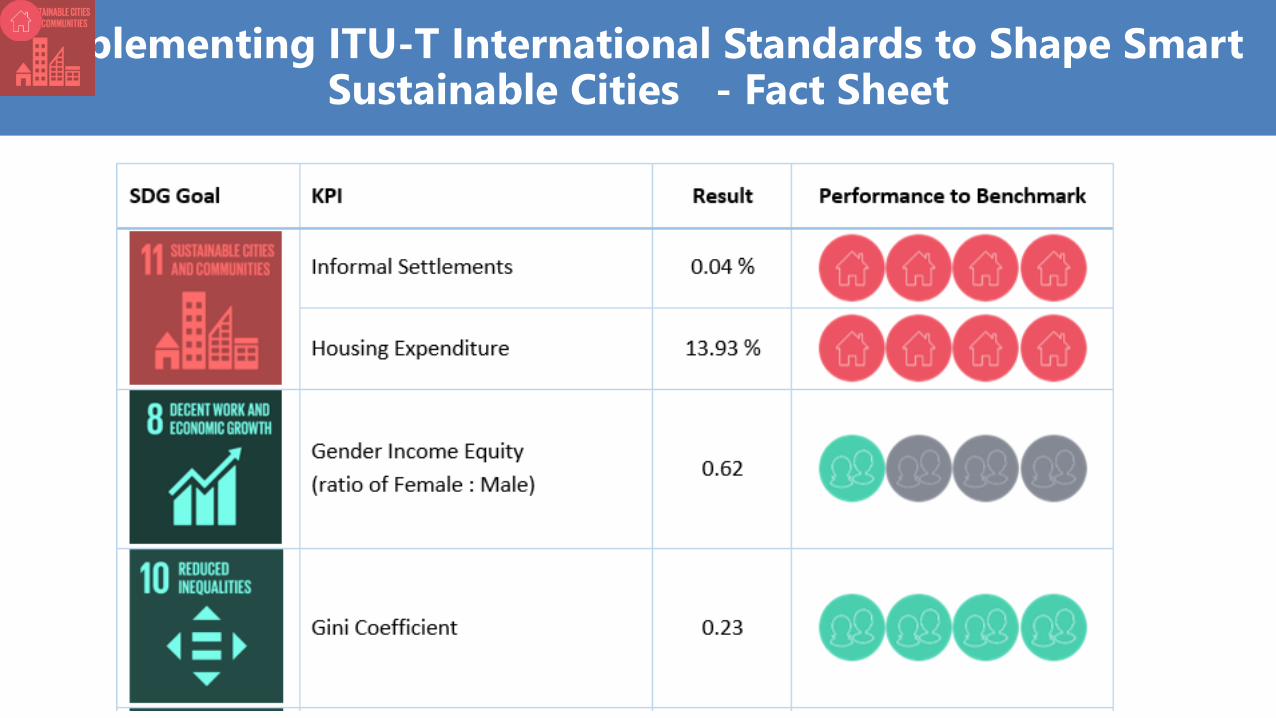
Implementing ITU-T International Standards to Shape Smart Sustainable Cities - Fact Sheet

How to Get Involved

U4SSC Call for Experts
• The impact of Artificial Intelligence and Cognitive Computing
in Cities
• The impact of Data Processing and Computation in Cities
• The impact of Sensing Technologies and IoT in Cities
• Blockchain 4 cities
• https://www.itu.int/en/ITU-T/ssc/united/Pages/default.aspx

To support cities in the
implementation and use of the
SSC KPIs
To test and verify the
applicability of SSC-KPIs in
several cities of the world.
To develop a global Smart
Sustainable Cities (SSC) Index.
Join this Project now!
KPIs Project for Smart Sustainable Cities to Reach SDGs
Maldonado
Guangshan
Wuxi
Dubai
Manizales
Montevideo
and many others…
Singapore
Valencia
Pully
Foshan
Kairouan
Moscow
Bizerte

Thank you!
More information can be found at:
https://www.itu.int/en/ITU-
T/ssc/united/Pages/default.aspx
John Smiciklas
U4SSC KPI Verifier
Appendix
KPIs in Detail

ECONOMY
ICT – Core Indicators
Household Internet
AccessPercentage of
households with Internet
access.
Fixed Broadband
SubscriptionsPercentage of
households with fixed
(wired) broadband.
Wireless Broadband
SubscriptionsWireless broadband
subscriptions per 100
000 inhabitants.
Smart Water MetersPercentage
implementation of smart
water meters.
Smart Electricity
MetersPercentage
implementation of smart
electricity meters.
Wireless Broadband
CoveragePercentage of the city
served by wireless
broadband (3G and 4G).
Dynamic Public
Transport
InformationPercentage of urban public
transport stops for which
traveller information is
dynamically available to the
public in real time
Traffic MonitoringPercentage of
major streets monitored
by ICT.

ECONOMY
ICT – Advanced Indicators
Open DataPercentage and number
of inventoried open
datasets that are
published.
e- GovernmentNumber of public
services delivered
through electronic
means.
Public Sector e-
ProcurementPercentage of public sector
procurement activities that
are conducted electronically.
Water Supply ICT
MonitoringPercentage of the water
distribution system
monitored by ICT.
Drainage / Storm
Water System ICT
MonitoringPercentage of drainage /
storm water system
monitored by ICT.
Electricity Supply ICT
MonitoringPercentage of electricity
supply system monitored
by ICT.
Intersection ControlPercentage of road
intersections using
adaptive traffic control or
prioritization measures.
Availability of WIFI
in Public AreasNumber of public WIFI
hotspots in the city.
Demand Response
PenetrationPercentage of electricity
customers with demand
response capabilities.

ECONOMY
Productivity – Core Indicators
R&D ExpenditureResearch and
Development
expenditure as a
percentage of city GDP.
PatentsNumber of new patents
granted per 100 000
inhabitants per year.
Small and Medium-
Sized EnterprisesPercentage of small and
medium-sized
enterprises (SMEs).
Unemployment RatePercentage of the total
city labour force that is
unemployed.
Youth
Unemployment RatePercentage of the city
youth labour force that is
unemployed.
Tourism Sector
EmploymentPercentage of the city
labour force working in
the tourism sector.
Productivity – Advanced Indicators
ICT Sector
EmploymentPercentage of the city
labour force working in
the ICT sector.

ECONOMY
Infrastructure – Core Indicators
Basic Water SupplyPercentage of
households with access
to a basic water supply.
Potable Water
SupplyPercentage of
households with a safely
managed drinking water
service.
Water Supply LossPercentage of water loss
in the water distribution
system.
Wastewater
CollectionPercentage of
households served by
wastewater collection.
Household
SanitationPercentage of
households with access
to basic sanitation
facilities.
Electricity System
Outage FrequencyAverage number of
electrical interruptions
per customer per year.
Public Transport
NetworkLength of public
transport network per
100 000 inhabitants.
Electricity System
Outage TimeAverage length of
electrical interruptions.
Access to Electricity Percentage of
households with
authorized access to
electricity.
Bicycle NetworkLength of bicycle paths
and lanes per 100 000
population.
Solid Waste
CollectionPercentage of
households with regular
solid waste collection.

ECONOMY
Infrastructure – Advanced Indicators
Public Transport
Network
ConveniencePercentage of the city
population that has convenient
access (within 0.5 km) to public
transport.
Transportation
Mode SharePercentage of people using various
forms of transportation to travel to
work (public transportation,
personal vehicles, bicycles, walking,
paratransit)
Shared BicyclesNumber of shared
bicycles per 100 000
inhabitants.
Pedestrian
InfrastructurePercentage of the city
designated as a
pedestrian / car free
zone.
Urban Development
and Spatial PlanningExistence of urban
development and spatial
planning strategies or
documents at the city level
Public Building
SustainabilityPercentage area of public buildings
with recognized sustainability
certifications for ongoing
operations.
Shared VehiclesNumber of shared
vehicles per 100 000
inhabitants.
Low-Carbon
Emission Passenger
VehiclesPercentage of low-
carbon emission
passenger vehicles.
Travel Time IndexRatio of the travel time
during the peak periods
to travel time at free flow
periods.
Integrated Building
Management Systems in
Public Buildings Percentage area of public buildings
using integrated ICT systems to
automate building management

ENVIRONMENT
Environment – Core Indicators
Air PollutionAir Quality Index based on reported
value for: Particulate matter (PM2.5)
;
NO2 (nitrogen dioxide);
SO2 (sulphur dioxide); and,
O3 (ozone).
GHG EmissionsGreenhouse gas (GHG)
emissions per capita.
EMF ExposurePercentage of mobile network
antenna sites in compliance
with EMF exposure guidelines.
Green AreasGreen areas per 100 000
inhabitants.
Drinking Water
QualityPercentage of
households covered by
an audited Water Safety
Plan.
Freshwater
Consumption Freshwater consumption.
Water Consumption Water consumption per
capita.
Solid Waste
TreatmentPercentage of solid
waste.
Wastewater
TreatmentPercentage of wastewater
receiving treatment.

ENVIRONMENT
Environment – Advanced Indicators
Noise ExposurePercentage of inhabitants
exposed to excessive
noise levels.
Green Area
AccessibilityPercentage of inhabitants
with accessibility to
green areas.
Protected Natural
AreasPercentage of city area
protected as natural sites.
Recreational
FacilitiesArea of total public
recreational facilities per
100 000 inhabitants.

ENVIRONMENT
Energy – Core Indicators
Renewable Energy
ConsumptionPercentage of renewable
energy consumed in the
city.
Public Building
Energy Consumption Energy consumption of
public buildings.
Electricity
ConsumptionElectricity consumption
per capita.
Residential Thermal
Energy Consumption Residential thermal
energy consumption per
capita.

Society and Culture
Education, Health and Culture – Core Indicators
Student ICT AccessPercentage of students
with classroom access to
ICT facilities.
Cultural ExpenditurePercentage expenditure
on cultural heritage.
Life ExpectancyAverage life expectancy.
School EnrollmentPercentage of school-
aged population enrolled
in schools.
Higher Education
DegreesHigher level education
degrees per 100 000
inhabitants.
Adult LiteracyAdult literacy rate.
Maternal Mortality
RateMaternal deaths per
100 000 live births.
PhysiciansNumber of physicians
per
100 000 inhabitants.

Society and Culture
Education, Health and Culture – Advanced Indicators
Electronic Health
RecordsPercentage of city inhabitants
with electronic health records.
Cultural
InfrastructureNumber of the cultural
institutions per 100 000
inhabitants.
In–Patient Hospital
BedsNumber of in-patient
public hospital beds per
100 000 inhabitants.
Health Insurance/Public
Health CoveragePercentage of inhabitants
covered by basic health
insurance or a public health
system.

Society and Culture
Safety, Housing and Social Inclusion – Core Indicators
Informal SettlementsPercentage of inhabitants
living in slums, informal
settlements or
inadequate housing.
Natural Disaster
Related DeathsNumber of natural
disaster related deaths
per 100 000 inhabitants.
Gender Income
EquityRatio of average hourly
earnings of female to
male workers.
PovertyPercentage of inhabitants
living in poverty.
Gini CoefficientIncome distribution in
accordance with Gini
coefficient.
Disaster Related
Economic LossesNatural disaster related
economic losses as a
percentage of the city’s GDP.
Police ServiceNumber of police officers
per 100 000 inhabitants.
Fire ServiceNumber of firefighters
per 100 000 inhabitants.
Violent Crime RateViolent crime rate per
100 000 inhabitants.
Voter ParticipationPercentage of the eligible
population that
voted during the last
municipal election.
Traffic FatalitiesTraffic fatalities per 100
000 inhabitants.

Society and Culture
Safety, Housing and Social Inclusion – Advanced Indicators
Housing ExpenditurePercentage expenditure
of income for housing.
Resilience PlansImplementation of risk
and vulnerability
assessments for disaster
mitigation.
Population Living in
Disaster Prone AreasPercentage of inhabitants
living in a zone subject to
natural hazards.
Local Food
ProductionPercentage of local food
supplied from within
100 km of the urban
area.
Child Care
AvailabilityPercentage of pre-school
age children (0-3)
covered by (public and
private)
day-care centres.
