john p. holdren - archives
TRANSCRIPT

John P. Holdren
Assistant to the President for Science and Technology and Director, Office of Science and Technology Policy Executive Office of the President of the United States
Maryland-Delaware Climate-Change Education Summit
The Fall 2001 Langenberg Lecture University of Maryland • 19 September 2011
Coping With Climate Change: Issues in Science, Policy, and Education

Overarching questions
In climate-change science: • What do we know (or think we know)? • How (and with what confidence) do we know it? • What more do we most need to know? • How (and when) can we know it?
In climate-change policy: • What should we do and when should we do it?
At the intersection of science and policy: • How can the answers about the science better inform
the answers that publics and policy-makers embrace about what to do and when to do it?

The science questions

Five myths about the science
1. The Earth stopped warming in the last decade.
2. If it is warming, humans aren’t the main cause.
3. A little warming isn’t harmful anyway.
4. If there is any danger, it’s far in the future.
5. The CRU e-mails & IPCC mistakes show that mainstream climate science is deeply flawed.

Green bars show 95%
confidence intervals
2005 was the hottest year on record;
2007 tied with 1998 for 2nd hottest; 14
hottest all occurred since 1990
http://data.giss.nasa.gov/gistemp/graphs/
No longer warming? Here’s what thermometers say
2010 tied 2005 as the hottest year on
record; 2007 tied 1998 as 2nd hottest;
15 hottest all occurred since 1990
Green bars show 95%
confidence intervals

No longer warming? 1998 was just a bump
The Copenhagen Diagnosis 2009 +
GISS website 2011

Other climate indicators are changing apace
NCDC, 2000
Most places getting wetter, some drier; Earth wetter overall.

Indicators: glaciers retreating
Rongbuk glacier in 1968 (top) and 2007. The largest glacier
on Mount Everest’s northern slopes feeds Rongbuk River.
National Snow & Ice Data Center 2010

Indicators: Arctic sea ice shrinking & thinning

Indicators: Greenland & Antarctic ice losing mass
The Copenhagen Diagnosis, 2009

Indicators: sea level rising
National Research Council 2010

What do we know about the causes?
Human vs natural influences 1750-2005 (watts/m2)
Human emissions leading to increases in…
atmospheric carbon dioxide + 1.7
methane, nitrous oxide, CFCs + 1.0
net ozone (troposphere↑, stratosphere↓) + 0.3
absorptive particles (soot) + 0.3
reflective particles (sulfates, etc.) - 0.7
indirect (cloud forming) effect of particles - 0.7
Human land-use change increasing reflectivity - 0.2
Natural changes in sunlight reaching Earth + 0.1
The warming influence of anthropogenic GHG and absorbing particles is ~30x the warming influence of the estimated change in input from the Sun.
IPCC AR4, WG1 SPM, 2007

The key greenhouse-gas
increases were caused by
human activities.
Compared to natural changes over the past 10,000 years, the spike in concentrations of CO2 & CH4 in the past 250 years is extraordinary.
We know humans are responsible for the CO2 spike because fossil CO2 lacks carbon-14, and the drop in atmospheric C-14 from the fossil-CO2 additions is measurable.
IPCC AR4, WG1 SPM, 2007

Source: Hansen et al.,
Science 308, 1431, 2005.
Human influence:
the “fingerprint”
Top panel shows best
estimates of human
& natural forcings
1880-2005.
Bottom panel shows
that state-of-the-art
climate model, when
fed these forcings,
reproduces almost
perfectly the last
125 years of
observed
temperatures.

Why worry? What harm can it do?
Climate governs (so altering climate will affect)
• availability of water
• productivity of farms, forests, & fisheries
• prevalence of oppressive heat & humidity
• formation & dispersion of air pollutants
• geography of disease
• damages from storms, floods, droughts, wildfires
• property losses from sea-level rise
• expenditures on engineered environments
• distribution & abundance of species
S
#
S#
SS S
S SS
S # # #
S S#
S ##
S S# #
#S
S# #
##
S SSS
#S
SS #
SS S
SS
SS
S
S S
S
## S
S SS
SS
# S
SSS S S
S SS
S
SS
SS
S
#
S S #
S # #
#
S
S
#
## # #
## #
#
##
#
# ## #
##
# #S
# # ##
# # ##
#S
S S S#
SS
##
S ###
## #
###
#
##
# # #S
##
##
#
S S
##
#S
#
#
SS
#
#S
S
S
#
S S ##
SS
##
S #
S# S
S S SS
#
# #S#
#
# # ##
# ##
# S
SS S
S #
#
#
S SSS
SS S
# S S S S SS
S SS
S#
S SS S
SS
S S SS S
S S
S SS
S# #
#S
## # #SS
#SS
#
S#S
S
SS
SSS S SS S S
S SS
SS SS S
###
#S # S
# #
S
#S SS
S# #
# #S
#
##
SSS S
S
S
# #S
<-60
-60
-40
-20
0
20
60
40
>60
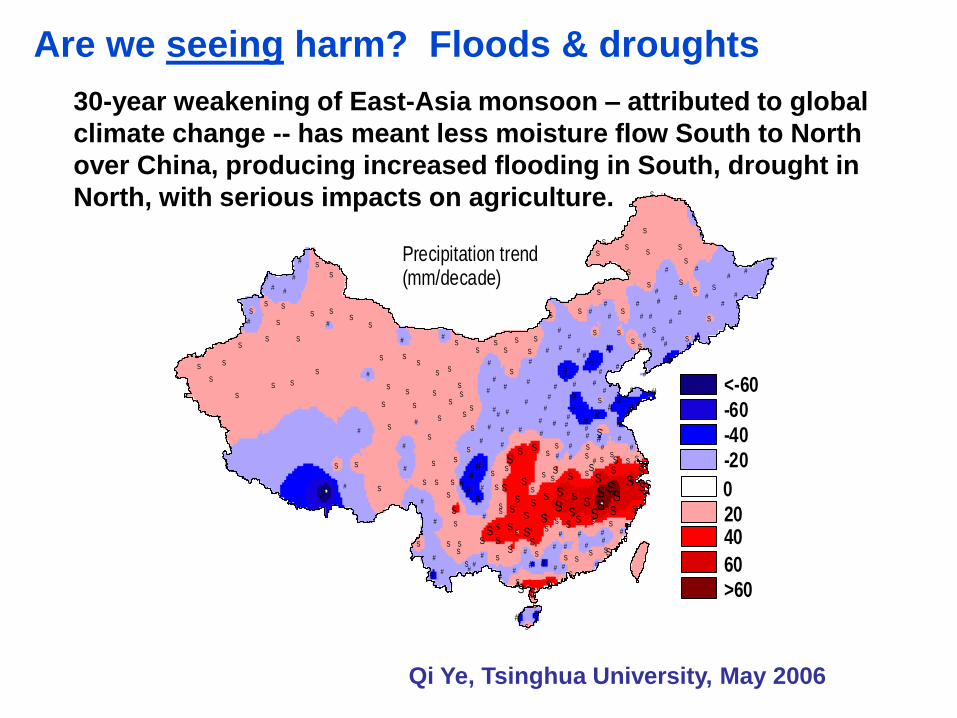
B Precipitation trend(mm/decade)
Are we seeing harm? Floods & droughts
30-year weakening of East-Asia monsoon – attributed to global
climate change -- has meant less moisture flow South to North
over China, producing increased flooding in South, drought in
North, with serious impacts on agriculture.
Qi Ye, Tsinghua University, May 2006

Are we seeing harm? Wildfires
Source: Westerling et al., SCIENCE, 2006
Western US area burned
Wildfires in the Western USA have increased 6-fold in the last 30 years.
Similar trends are evident in other fire-prone regions.

Are we seeing harm? Pest outbreaks
USGCRP 2009
Pine bark beetles, with a longer breeding season courtesy of warming,
devastate trees weakened by heat & drought in Colorado

Are we seeing harm? Melting permafrost
Norwegian Polar Institute, 2009

Are we seeing harm? Coastal erosion
Courtesy Gary Braasch

Current harm is widespread
Worldwide we’re seeing, variously, increases in
• floods
• wildfires
• droughts
• heat waves
• pest outbreaks
• coral bleaching events
• power of typhoons & hurricanes
• geographic range of tropical pathogens
All plausibly linked to climate change by theory, models,
observed “fingerprints”

Much worse lies ahead if “business as usual” persists
Last time T was 2ºC
above 1900 level was
130,000 yr BP, with
sea level 4-6 m higher
than today.
Last time T was 3ºC
above 1900 level was
~30 million yr BP, with
sea level 20-30 m
higher than today.
Note: Shaded bands
denote 1 standard
deviation from mean
in ensembles of model
runs
IPCC 2007
EU target ∆T ≤ 2ºC
IPCC Scenarios

What’s expected: Hotter summers
National Academies, Stabilization Targets, 2010

What’s expected: declining crop yields
National Academies, Stabilization Targets, 2010

What’s expected: sea-level rise to 2100
The National Academies, America’s Climate Choices, 2010, vol 1

What‘s expected: falling ocean pH
Steffen et al., 2004
About 1/3 of CO2 added to
atmosphere is quickly taken up
by the surface layer of the
oceans (top 80 meters).
This lowers pH as dissolution of
CO2 forms weak carbonic acid
(H2O + CO2 H2CO3).
Increased acidity lowers the
availability of CaCO3 to
organisms that use it for forming
their shells & skeletons,
including corals.
1870, 280 ppm
2003, 375 ppm
2065, 515 ppm

Did the U of East Anglia e-mails and IPCC
missteps cast doubt on these conclusions?
• E-mails show climate scientists are human, too; more
efforts at openness & transparency are warranted
• IPCC missteps show need for increased rigor in
adhering to organization’s strict review procedures; but
errors discovered so far are few & unimportant.
• IPCC isn’t the source of scientific understanding of
climate, just one of the messengers. Sources are the
global community of climate scientists & mountain of
peer-reviewed research they’ve produced over decades.

What more do we most need to know?
• Improved understanding of climate “sensitivity” to human
& natural forcings (including effects of particles, clouds)
– Sensitivity means, in essence, how much average T increase for
a doubling of atmospheric CO2 or its equivalent.
– Improvements in this understanding will improve predictions.
– Getting there will require continuing investments in paleo-
climatology, basic climate physics, maintaining & improving our
constellation of Earth-observation satellites, and running better
climate models on faster computers.
• Better regional disaggregation of predicted changes in
temperatures, precipitation, storm tracks, ice sheets
– Requirements for getting there similar to those above

What more we need to know? (continued)
• Better understanding of ecological effects of regional
climate changes
– Including impacts on oceans, crops, domestic animals, wildlife,
pests, pathogens
– This is needed to shape adaptation strategies
– Requires continuing investments in ecological sciences, major
improvements in diversity & density of monitoring networks
• Better integrated assessments combining predictions,
mitigation and adaptation options (character, capabilities,
costs), social dimensions
– Requires additional effort in integrated-assessment methods and
practice as well as in specifics of mitigation & adaptation options

The policy questions

What should we do?
There are only three options:
• Mitigation, meaning measures to reduce the pace
& magnitude of the changes in global climate being
caused by human activities.
• Adaptation, meaning measures to reduce the
adverse impacts on human well-being resulting
from the changes in climate that do occur.
• Suffering the adverse impacts that are not avoided
by either mitigation or adaptation.

Concerning the three options…
• We’re already doing some of each.
• What’s up for grabs is the future mix.
• Minimizing the amount of suffering in that mix
can only be achieved by doing a lot of mitigation
and a lot of adaptation.
– Mitigation alone won’t work because climate change
is already occurring & can’t be stopped quickly.
– Adaptation alone won’t work because adaptation gets
costlier & less effective as climate change grows.
– We need enough mitigation to avoid the unmanage-
able, enough adaptation to manage the unavoidable.

Adaptation possibilities include…
• Changing cropping patterns
• Developing heat-, drought-, and salt-resistant crop varieties
• Strengthening public-health & environmental-engineering defenses against tropical diseases
• Building new water projects for flood control & drought management
• Building dikes and storm-surge barriers against sea-level rise
• Avoiding further development on flood plains & near sea level
Many are “win-win”: They’d make sense in any case.

Mitigation possibilities include…
(CERTAINLY)
• Reduce emissions of greenhouse gases & soot from the energy sector
• Reduce deforestation; increase reforestation & afforestation
• Modify agricultural practices to reduce emissions of greenhouse gases & build up soil carbon
(CONCEIVABLY)
• “Scrub” greenhouse gases from the atmosphere technologically
• “Geo-engineering” to create cooling effects offsetting greenhouse heating

Key mitigation realities
• Human CO2 emissions are the biggest piece of the problem (50% and growing)
– About 85% comes from burning coal, oil, & natural gas (which provide >80% of world energy)
– Most of the rest comes from deforestation & burning in the tropics
• Developing countries now exceed industrialized ones in total CO2 emissions (but not per capita).
• Global energy system can’t be changed quickly: ~$20T is invested in it; normal turnover is ~40 yrs.
• Deforestation also isn’t easy to change: forces driving it are deeply embedded in the economics of food, fuel, timber, trade, & development.

How much mitigation, how soon?
• Limiting ∆Tavg to ≤2ºC is now considered by many
the most prudent target that’s still attainable.
– EU embraced this target in 2002, G-8 & G-20 in
2009
• Just to have a 50% chance of staying below 2ºC
– developed-country emissions must peak no later
than 2015 and decline rapidly thereafter
– developing-country emissions must peak no later
than 2025 and decline rapidly thereafter.

Mitigation supply curve for 2030: aiming for 450 ppm CO2e

Policy needs for the 450 ppm CO2e supply curve
Need to remove
barriers to picking
this low-hanging fruit
Need price on C to motivate
reaching higher into the tree
Need RD&D to lower
this fruit into reach

Is the needed mitigation affordable?
• Rough calculations
– Paying an average of $100/tC to avoid half of current
world CO2 emissions would cost $0.5 trillion/yr, under
1% of current GWP (much of it a transfer, not a “loss”).
– Using McKinsey cost curve for what we’d need to be
doing in 2030 to be on 450 ppmv stabilization trajectory
shows net cost of only about $0.1 trillion/yr.
• Current econ models say mitigation to stabilize at
450 ppmv CO2e probably means 2-3% GWP loss
in 2030, 2100 (range 1-5%).
• World now spends 2.5% of GWP on defense; USA
spends 5% on defense, 2% on env protection

The education questions

Q: How can the answers about the science better inform the answers that publics and policy-makers
embrace about what to do and when to do it?
A: Through more effective education and communication.

What are the ingredients of more
effective communication & education?
Communication
• Start with the basics
• Be clear about terminology
• Explain how we know what we know
• Link it to what can be observed
• Link it to regions and communities
Education
• Focus on how science works, sources of
authority & credibility in scientific findings
• Lift the level of STEM literacy

Starting with the basics
• Without energy there is no economy
• Without climate there is no environment
• Without economy and environment there is no
material well-being, no civil society, no personal
or national security
The problem is that the world is getting most of
the energy its economies need in ways that are
imperiling the climate its environment needs.

Terminology: “global warming” is a misnomer
That term implies something…
• uniform across the planet,
• mainly about temperature,
• gradual,
• quite possibly benign.
What’s actually happening is…
• highly nonuniform,
• not just about temperature,
• rapid compared to capacities for adjustment
• harmful for most places and times
A more descriptive term is “global climate disruption”.

Terminology (cont): Weather, climate, disruption
Climate = weather patterns, meaning averages, extremes, timing, spatial distribution of…
• hot & cold
• cloudy & clear
• humid & dry
• drizzles & downpours
• snowfall, snowpack, & snowmelt
• breezes, blizzards, tornadoes, & typhoons
Climate change means disruption of the patterns.
Global average temperature is just an index of the state of the global climate as expressed in these patterns. Small changes in the index big changes in the patterns.

Observables: Powerful storms (USA, Oct 2010)
This super-storm – the strongest US non-coastal storm on record -- spawned
67 tornadoes over a 4-day period.

Observables: Heat waves (Russia, summer 2010)
© RIA Novosti, Vladimir Fedorenko

Observables: Floods (Australia, 2010-2011)
Record warm sea temperatures contributed to the wettest spring ever in Australia and flooding in Queensland that was the costliest natural disaster in Australia’s history.
Photo: NASA

Observables: Coral bleaching (Carribean, 2010)
2010 brought the worst coral bleaching since 1998.
Courtesy www.wunderground.com/blog/JeffMasters/

Link to the local: wildfire predictions
Percentage increases in median annual area burned for a 1°C increase in global average temperature
National Academies, Stabilization Targets, 2010

Courtesy Jeffrey Bielicki, Kennedy School of Government
What would 1-70 m of sea-
level rise do to your region?
Link to the local: Sea level could rise 1-
2 meters by 2100, 3-12 m in the next few
hundred years, up to 70 m eventually.

How science works
UNCERTAINTIES ARE TWO-SIDED
• Yes, it could be that the climate changes occurring under a
continuation of BAU would be less disruptive, and the adverse
impacts on human well-being less severe, than the scientific-
mainstream best estimates contained in the reports of the
Intergovernmental Panel on Climate Change (IPCC) and the
US National Academy of Sciences.
• But it could also turn out that the climate changes under
business as usual would be more disruptive, and the impacts
on human well-being more severe, than the “consensus”
estimates suggest. (Recent results suggest this is more likely
than the reverse.)

How science works (continued)
BURDEN OF PROOF
• The “skeptics” routinely brandish some single contrary piece
of evidence or analysis -- often a newly reported one that has
not yet been subjected to the scrutiny of the scientific
community -- and declare that this new result invalidates the
mainstream view.
• That’s not how science works. Contrary results appear
regularly in all scientific fields. But when a strong preponder-
ance of evidence points the other way (as in the case of
climate-change science), isolated apparent contradictions are
given due scrutiny but not, initially, very much weight.
• That’s because it’s far more likely that the “contradiction” will
turn out to be explainable as a mistake, or otherwise
consistent with the preponderance of evidence, than that the
preponderance of evidence will turn out to have been wrong.

How science works (concluded)
PRUDENCE
• All science is contingent. It is always possible that persuasive new evidence and analysis will come to light that will change the mainstream view.
• But the greater the consistency and coherence of the existing body of evidence and analysis, the lower the likelihood that the principal conclusions derived from it will be overturned.
• The consistency and coherence of the evidence and analysis supporting the mainstream view of climate-change risks embodied in the reports of the NAS & IPCC are immense.
• Policymakers, on whose decisions the preservation and expansion of the public’s well-being depends, are gambling against very long odds if they bet that the mainstream position is wrong. This is not prudent.

The much longer-term project of raising the overall
level of STEM literacy across our society would
need to be the topic of another lecture!