john havrilla, director of alternative fuel services at wendel
TRANSCRIPT


John Havrilla, Director of Alternative Fuel Services at WendelJohn Havrilla is the Director of Alternative Fuel Services at Wendel, which provides consulting, design andconstruction services to public and private organizations looking to build alternative fuel facilities for theirfleets, including Compressed Natural Gas (CNG/RNG), propane and electric vehicles. John is also theSecretary and Board member of Clean Communities of Western NY. With over 30 years of industryexperience, John is a seasoned energy executive with a strong financial background.
Keith Dickerson, Director of Transformative Technologies at Black & VeatchKeith Dickerson is the Director of Transformative Technologies at Black & Veatch. Keith’s focus areas includeplanning and building sustainable transportation and distributed clean energy infrastructure. He brings 30years of expertise in engineering, operations, sales and strategic business development with companiessuch as Siemens, Schneider Electric and Verizon.
Alex Bettencourt, Senior Managing Director of Management Consulting at Black & VeatchAlex Bettencourt is Senior Managing Director of Management Consulting at Black & Veatch. Alex is arecognized thought leader in the field of grid modernization and a pioneer in fleet electrification. He hasworked with transportation and logistics companies to establish their business case for electrifying theirfleets and to structure the potential deal for utility-provided charging infrastructure.
Ruslan Belous, Associate Principal and Electrical Engineer at WendelRuslan Belous is an Associate Principal and electrical engineer at Wendel with more than 13 years’experience in electrical design. His design experience includes battery electric vehicles and charginginfrastructure, lighting, power, fire alarm and system for new and existing buildings. He has worked onnumerous school renovation projects, new building utilities, primary and secondary power distribution,emergency generator installations both for private and public installations.

Charging InfrasturctureElectrifying Medium and Heavy-Duty Trucks in New York
December 9, 2020

Introductions
John Havrilla, PE Ruslan Belous

A Sign of the Times5TH AVE NYC CIRCA 1900
One Car5TH AVE NYC CIRCA 1913
One Horse
[Image and Content Source: Tony Seba, Clean Disruption of Energy and Transportation]

Charger Considerations

Charging Systems
Inverted Pantograph Roof Mounted Pantograph
Inductive Charging Plug-in Charging
Charging OptionsBEV OVERVIEW
Pantographs
Plug-in Charging
Advantages Disadvantages
High Capacity Charge High maintenance – particularly in winter climates
Can be used for On-Route charging Difficult to install in existing depots
May reduce battery size Large footprint with associated equipment
Inductive ChargingAdvantages Disadvantages
High Capacity Charge Large footprint with associated equipment
Can be used for On-Route charging Vehicle placement critical to efficiency
May reduce battery size
No moving parts, less maintenance
Advantages Disadvantages
Simple, low cost option Manually operated (plug in)
Low maintenance Placement in tight garages can be a challenge
Can be used for both on-route and depot charging
Drop down reel options limited due to cable lengths – but improving
Chargers are similar to other options

Depot Charging Options

CPE 250
62.5 kW or 125 kWShared between 2 – CPE 250’s
Available late spring 2020

Typical ABB Large Vehicle Charging
ABB Connector ChargerPower range of 24 kW, 50 kW with Voltage range from 150-920 V DCPower range of 100kW, 150kW with Voltage range from 150-850VDCSequential charging with up to 3 outlets with 100 kW and 150 kW per vehicle

Case Studies

Case Study 1Greater Bridgeport Transit (GBT)• (2) BEV chargers, 1
charger per bus.• Depot Peak Demand was
119 kW. At full 11 BEV build out it will be 1,659 kW, an increase of over 1.5 MW of power.
• Service Upgrade (up to 11 BEV capability).
• Outdoor charger location.

The existing GBT Depot has a 500 kVA transformer and a 1200 amp switchgear bus – Inadequate for the proposed addition of 11 electric buses
Further Assumptions• After route and rate modeling, it was determined that a maximum of 6
buses would be charged at any one time• This will minimize demand charges and reduce the costs associated with
the depot electric distribution system upgrades• Electric bus charging would not occur when on emergency power
Impacts to Depot Distribution System

To accommodate the new electric buses the new design includes:
• A new 1500 kVA pad mounted transformer (By utility)
• New 3000 amp switchboard• New panel boards to feed the chargers• All interconnecting cables

Charging System - Proterra
OEM Cable Limits:• Max 492’ from PCS to Dispenser• 25’ from Dispenser to Bus

Charger Layout

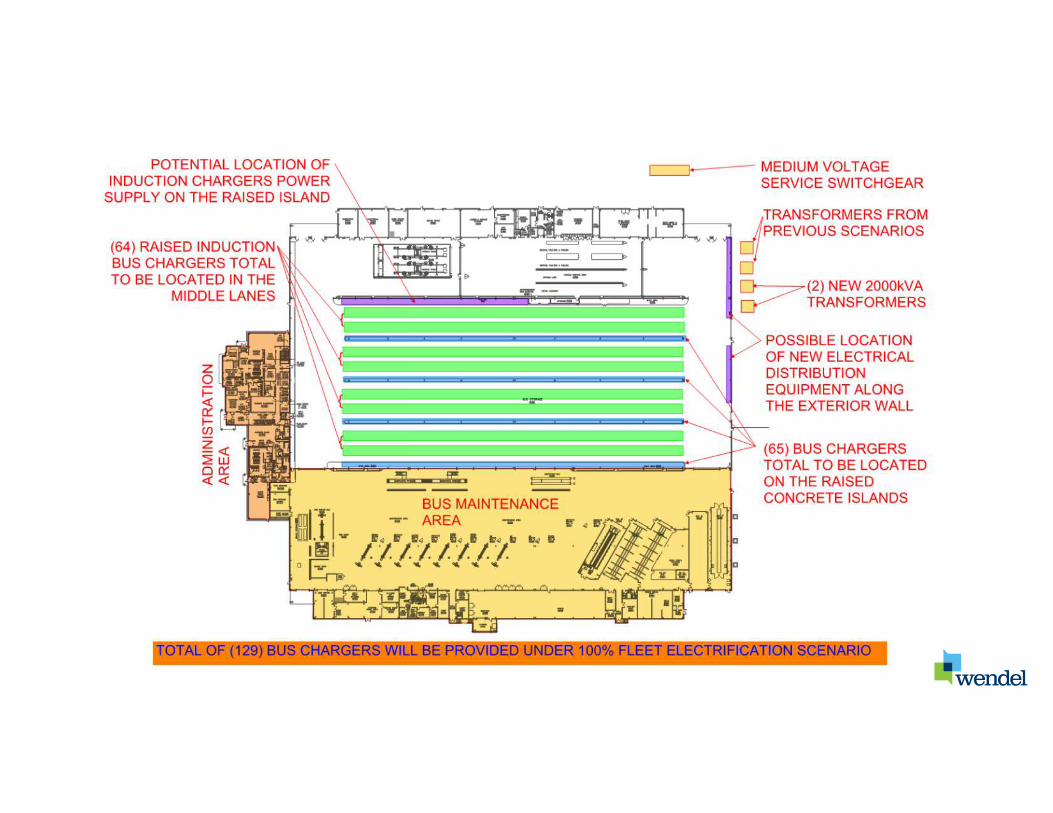
Case Study 2CTtransit - Hamden• (10) BEV chargers, 1 charger per bus.• Depot Peak Demand was 1,223 kW. At 100% BEV build out
(129 buses) it will be 10,253 kW, an increase of over 9.0 MW of power.
• Chargers connected to existing services (5 and 5).• New service for fire pump including dedicated backup
generator.

Current LoadsElectric Service #1664.4 Peak kW859,963 Estimated kWh
Electric Service #2516.4 Peak kW3,342,147 Estimated kWh
Existing Fuel Cell471 kVA/400 kW Doosan Fuel Cell
Backup Generator2500 kW diesel generator
Note: The costs for the scenarios are additive. Each scenario builds on the scenario
before it so the cost of each scenario must be included in the total build-out.
Summary of Costs by Scenario
1.18 Peak MW4,202,110 Est kWh

Expected Loads Charging Infrastructure for Hamden
Charging Infrastructure Strategy
A typical 440 kW battery electric bus has a usable battery
capacity of about 327 kWh of energy. The efficiency of the
bus is around 2.2 kWh/mile, resulting in a range of 149
miles per bus per charge.
ScenarioAll
Charged at Once
Half Charged at Once
Pilot – 10 Buses 1.40 MW 700 kW
20% - 26 Buses 3.64 MW 1.82 MW
30% - 39 Buses 5.46 MW 2.73 MW
50% - 65 Buses 9.10 MW 4.55 MW
100% - 129 Buses 18.06 MW 9.00 MW
1 MW can power approximately 500 Homes
The Footprint of Energy: Land Use of U.S. Electricity Production STRATA – June 2017

Existing Facility:• 2 Electrical Services• 4000A Total Capacity
Proposed Modifications:• Add 10 BEV chargers (5 charged at once)• ~900A required to charge 5 buses

100% Electrification:• Total 129 BEV(65 charging at the same time)• ~10,800A required for charging

Case Study 3CTtransit - Stamford• (5) BEV chargers in phase 1.• New service for support up to (22)
BEVs, outdoor charger farm with interior plug-in connections.
• Depot Peak Demand was 235 kW. At 47% BEV build out (28 buses) it will be 2,195 kW, an increase of over 1.9 MW of power.
• New service for fire pump including dedicated backup generator.

Case Study 4Pioneer Valley Transit Authority (PVTA)• (6) 60kW chargers and dispensers.• Utilized existing service for charger
connections.• Designed charger power distribution to accept
future PV system (to be provided by owner later).
Wendel was also the lead architect and engineer
for the entire facility.

Case Study 5
Worcester Regional Transit Authority (WRTA)• (1) 500kW On-Route charger at an intermodal hub.• Dedicated charger electrical service and distribution.• Outdoor charger with drop down pantograph.• Attached to canopy structure.

Interior 120kW chargers (ABB) Interior 60kW chargers (Proterra)
Typical Dispenser

Typical “Charger Farm”Right to Left - Transformer, Main Service Gear, Charger Panelboard, Chargers, and Dispenser

“Charger Farm”

Alternative Energy• Fuel Cells
• Expensive - $11,441.00/kW• Reliability issues• Space issues
• Solar Arrays• Most cost-effective solution• Third party BOOM – no up-front costs to
transit agency.• Space available if roof can support
• Battery Storage• Good for peak shaving/load shifting• Space is an issue• Third party BOOM available in some states
• Generation• Not feasible to back up 100% of the fleet –
transit agency will be grid dependent.• Space is the biggest constraint.• Diesel or natural gas fired units.• Third party BOOM available in some areas
Fuel Cell – 1.4 MW fuel cell – Requires the space of a tennis court
NextEra solar plan for Hamden. 2.22 MW
Tesla 20 MW battery storage facility in California. 1.5 acres of land.

Do you have any questions?

Electrifying Medium- and Heavy Duty Trucks in New York
December 9, 2020
Charging Infrastructure

Black &Veatch
Introduction & ExperienceKeith Dickerson, Transformative Technologies, Black & Veatch
2

Black &Veatch
ABOUT BLACK & VEATCH
3
• 10,000+ professionals• $3.7 billion in 2019 revenue• Work in 100+ countries on six
continents• Consistently high industry rankings in
Power, Telecom, Water and moreEverybody returns home safely each day

Black & Veatch
• Proven success with deployment of high-power charging at scale throughout North America
• Focus on speed, safety, and quality• Network of experienced, capable contractors• Extensive utility relationships
4
Black & Veatch has the local area knowledge and delivery capability around the world to strategize and BUILD charging infrastructure.
Transit & Fleet Charging Engaged
100MW
Behind-the-Meter Battery Installations
150+MWh
EV Charging Sites
Deployed
1200+
Solar Capacity Installed
25,000MW
Combined Heat & Power (CHP)
Experience
8,000+MW
Largest Data Centre
Designed
~40MW

Black &Veatch
• Proud Member • Make Ready Approved Contractor
5
Office in New York City, and 69 locations across the United States.
Black & Veatch is Well-Established in NY

Black &Veatch
Turnkey Solution for Complete Program Management
6
Strategy, Consulting, Feasibility
& Planning
Permitting & Materials
Site Acquisition &
Land Use
Construction & Safety
Management
Installations, Operations & Maintenance
Integrated Solution Delivers Speed and Quality
Program Management
Engineering & Design

Black &Veatch 7
Tesla Supercharger NetworkSince 2015, Black & Veatch has designed,
engineered, permitted and/or constructed 1,680 charging posts at over 600 Tesla
Supercharger sites in North America.
Electrify America NetworkBlack & Veatch is deploying over 3,800 high-powered DC Fast Charger posts for 475+ Electrify America sites in eight U.S. regions.
BuildingChargingNetworks
Image Source: Daimler Trucks North America

Energy Storage, Distributed Generation & Resilience
Black & Veatch has designed and built a large portfolio of battery Energy Storage, Solar, and micro-grid projects. Many fleet programs are
seeking integrated approach increase up time and use of renewable energy.
Fleet Charging InfrastructureBlack & Veatch has been working with top vehicle OEM & EV leaders to design and build charging infrastructure across the country for:• Class 8 Truck OEM and Logistics Clients, multiple sites
and technologies with integrated resilience
• Depot and on-route charging for Transit Agencies
• Utility EV programs and rebates support charger installation for workplace and corporate fleets
Image Source: Daimler Trucks North America
Building High-Power Charging for
Fleets

Black &Veatch
Strategy & Total Cost of OwnershipAlex Bettencourt, Management Consulting, Black & Veatch
9

10
Greenhouse Gas Emission Comparison
Freight Transportation
11%
Electricity Generation
12%
9% 32%

Black &Veatch
There is a wider transformation occurring in transportationThis transformation will drive down costs and increase utilization – it will be a good time to operate a fleet
11
ConnectedElectric Autonomous Shared
Cost Savings
Cost Savings
Improve Decision Making
Increase Capacity
Utilization

Black &Veatch
Capital costs are higher
States costs for Ford eTransit and Tesla Semi are coming in at about 30-50% on the capital cost side.
Electric Truck~$180K
Diesel Truck$135K
12
Electric Van$45K
Gas Van$36K

Black &Veatch
Charging is hard
Many of the early adopters of electric vehicles have the scars from buildingcharging. While many have beensuccessful, they know it will be difficult to scale.
13Icon from Stockio.com

Black &Veatch
Charging costs are unknown
Many fleet operators have run the modelfor fuel savings but it is hard for them to understand the cost of charging without performing some detailed onsite work
14

Black & Veatch 15
Current Spend on Petroleum
Vehicles
Grid Infrastructure
Power Charges – Demand
Power Charges – Energy
Chargers
Make-ReadyCharger Maintenance
Charging Software
Electric Vehicle Lease
EV Maintenance
10 - 20%Savings
VALUE FLOWSHow does the flow of value change when moving to electrification
20%
40%
20%

Black &Veatch
16
Competition For ElectronsThere will be competition for electrons and the first to electrify will gain the cheaper grid capacity – need to be willing to invest capital and make decision on EVs soon

Black & Veatch 17
17
Planning Ahead for Power
Utility Relationship Get Grid Capacity Early
Planning for broad electrification will require a years of foresight to ensure
the infrastructure is in place for electrification.
Utility regulations allocate grid capacity on a first-come, first-serve
basis.
Need to demonstrate that load will materialize as per your schedule.
Fleets and utilities start to see each other in a different light.
Utilities need to see fleets as key customers.
Fleets need to see utilities as critical suppliers.
Key Takeaways

Black &Veatch
Working With Your Utility
18
Keith Dickerson, Transformative Technologies, Black & Veatch

Black &Veatch
Grid Connection Lead TimesUnderstanding the complexities and timing for fleet infrastructure can inform your investment and scale-up roadmap
1MW Charging
Site
5MW Charging
Site
20MW Charging
Site
3 MONTHS
12 MONTHS
24 MONTHS OR MORE
SAMPLE FLEET EXAMPLE TIMELINE REQUIREDCAPACITY REQ’D
20 overnight charging medium-duty delivery trucks
200 overnight charging light-duty delivery vans
200 daytime fast charging heavy-duty trucks
Service Transformer
Feeder Upgrade
Substation Upgrade
GRID UPGRADE

Black &Veatch
8 Steps To Fleet Electrification
1. Define Drive Cycles, Duty Cycles and Operational Considerations
2. Review and Select Technology Options3. Understand Charging Loads and Power Delivery4. Site Planning5. Conduct Utility Coordination, Engineering and Design6. Apply for Permit and Approvals7. Distribution Grid Upgrades8. Obtain Equipment, Construct and Commission
20

Black &Veatch12 WEEK ENGAGEMENT
Fleet Electrification Journey
21
Strategy Detailed Engineering
Go-to-Market Deployment
Construction & Commissioning
Operation & Maintenance
• Engineering designs• Zoning and permitting
research, submittal, and approval
• Utility interconnection• Procurement &
purchasing• Inventory Control• Qualify and manage
subcontractors
• Detailed site assessment
• Grid capacity check & load letter submission
• Customer transportation operations survey
• Go/No-Go decision on site
• Mobilization• Site kick-off
• Site prep/civil works• Skid installation
• Electrical
• Mechanical
• Communications
• Site turn-over• Testing and training
• Startup and commissioning
• Project closeout• Alarms and
monitoring• Infrastructure
management
• Market view• Customer markets &
buying proposition• Competitive model
• Provider landscape
• Economic model
• Financial targets• Competitive strategy
• Customer value proposition
• Target customer segments
• Deal strategy for tenants
• Deal strategy for new customers
Prelim. Feasibility & Design
BUSINESS CHOICES EXECUTION

Discussion.Download the eBook:bv.com/ElectricFleets
Keith Dickerson, Transformative TechnologiesP +1 913-458-2332 E [email protected]
Alex Bettencourt, Management ConsultingP +1 905-370-1230 E [email protected]


Albany
Central New York
Rochester
Buffalo
New York City &Hudson Valley
Long Island
Central New York: Clean Communities of Central New YorkCoordinator: Barry CarrContact: [email protected]: www.ccofcny.com
Capital District: Capital District Clean CommunitiesCoordinator: Jacob BeemanContact: [email protected]: www.capitalcleancommunities.org
Long Island: Greater Long Island Clean Cities CoalitionCoordinator: Rita EbertContact: [email protected]: www.gliccc.com
NYC & Lower Hudson Valley: Empire Clean CitiesCoordinator: Joy GardnerContact: [email protected]: www.empirecleancities.org
Western NY: Clean Communities of Western New YorkCoordinator: Craig JacksonContact: [email protected]: www.ccofwny.org
Rochester: Greater Rochester Clean CitiesCoordinator: David KeefeContact: [email protected]: www.grcc.us