john christianson & mark fisler: ethanol evolution: the data and deals driving the future
TRANSCRIPT
Ethanol Evolution: The Data and Deals Driving the
Future
Mark Fisler Managing Director
Ocean Park Advisors
John Christianson Principal Partner
Christianson & Associates, PLLP

Speaker Biographies
1
Mark Fisler
Managing Director
Ocean Park Advisors
John Christianson
Principal Partner
Christianson & Associates
• 29 years of experience
• Founded the firm in 1987
• Provider of accounting, benchmarking
and other services to ethanol companies
• Expertise:
– Business consulting
– Tax planning
– Business development
– Strategic planning
• 30 years of experience
• Investment banker, corporate financial
advisor, ethanol executive and owner
• Previously served as President and COO
of Global Ethanol
• 20+ ethanol and biofuels transactions:
– Mergers and acquisitions
– Recapitalizations
– Project financings
– Divestitures

Discussion Topics
• The Current State of the Ethanol Industry
• Progress in Plant Operations and Efficiencies
• Evolving Ethanol Plants’ Financial Profiles
• Survival of the Fittest: Business Models for 2016 and Beyond
2

The Current State: What’s the Elephant in the Room?
3

Gallons (B)
The Current State: Inventory Levels
Current ethanol inventory levels are at an all-time seasonal high.
Sources: RFA, EIA, EPA, OPA estimates.
Note: 2016 inventory figure as of January 2016.
4

Sustainable
Unsustainable
Marginally Sustainable
The Current State: Margins
2014’s record margins shifted to marginally sustainable in 2015.
Sources: Iowa State University, Center for Agricultural and Rural Development (CARD). Data as of January 2016.
Notes: Assumes model Iowa plant with September FYE. Days in Inventory is based on weekly storage divided by average daily ethanol consumption of the year.
5
$/Gal Days in
Inventory FY 2014: $0.75 FY 2013: $0.21 FY 2012: $0.22 FY 2015 : $0.24
Jan-16

The Current State: RFS and Annual Production
Net exports are necessary to balance the market.
Sources: RFA, EIA, EPA, OPA estimates.
Notes: 2016E 15.1B annualized ethanol production based on EIA weekly production data as of January 2016. RFS mandate is calculated as RVOs of Renewable Fuel net of
Advanced Biofuel. Blend Wall is calculated based on 10% of EIA weekly supply of gasoline. Blend wall of 14.3B assumes 2% growth from 2015 figure of 14.0B gallons.
6
Gallons (B)
E10
Demand

The Current State: Net Exports
Since 2010, net US exports have ranged from 200M to 900M gallons.
Sources: EIA, CME and RFA.
Note: US Trade 2015E is annualized for actuals through October 2015.
7
Gallons (B)

The Current State: Supply & Demand
Low case demand builds already high inventories.
Sources: RFA, EIA, EPA, OPA estimates.
Notes: Blend Wall is calculated based on 10% of EIA weekly supply of gasoline. Blend wall of 14.3B assumes 2% growth from 2015 figure of 14.0B gallons.
8
E10 Demand
(14.3B)
Gallons (B)
Net Exports
2016 RVO Mandate
2016E Run-rate
Production
(15.1B)

Evolution of an Industry: Smart Markets, Tight Competition
9
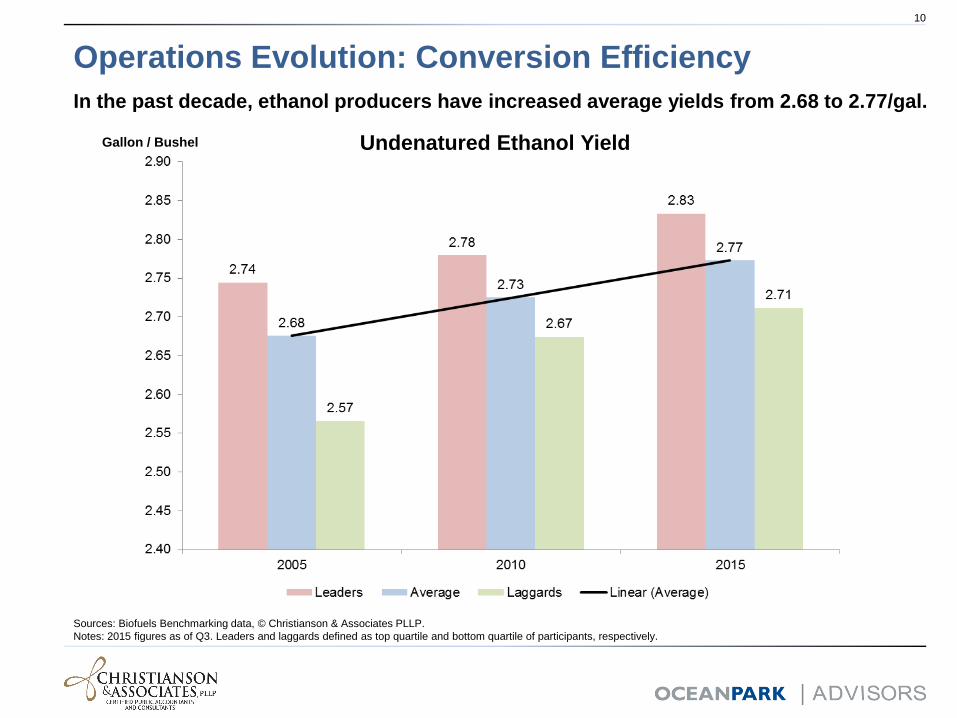
Operations Evolution: Conversion Efficiency
In the past decade, ethanol producers have increased average yields from 2.68 to 2.77/gal.
Sources: Biofuels Benchmarking data, © Christianson & Associates PLLP.
Notes: 2015 figures as of Q3. Leaders and laggards defined as top quartile and bottom quartile of participants, respectively.
10
Undenatured Ethanol Yield Gallon / Bushel
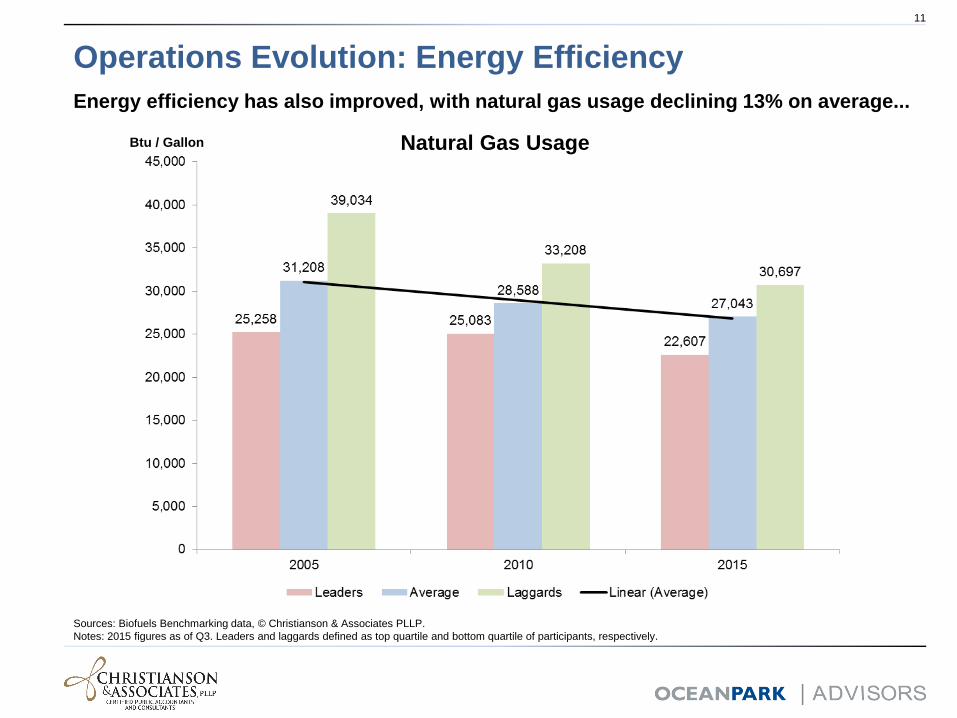
Operations Evolution: Energy Efficiency
Energy efficiency has also improved, with natural gas usage declining 13% on average...
Sources: Biofuels Benchmarking data, © Christianson & Associates PLLP.
Notes: 2015 figures as of Q3. Leaders and laggards defined as top quartile and bottom quartile of participants, respectively.
11
Natural Gas Usage Btu / Gallon

Operations Evolution: Energy Efficiency
…and electricity usage has also experienced a similar 13% decrease.
Sources: Biofuels Benchmarking data, © Christianson & Associates PLLP.
Note: 2015 figures as of Q3.
12
Electricity Usage kwH / Gallon
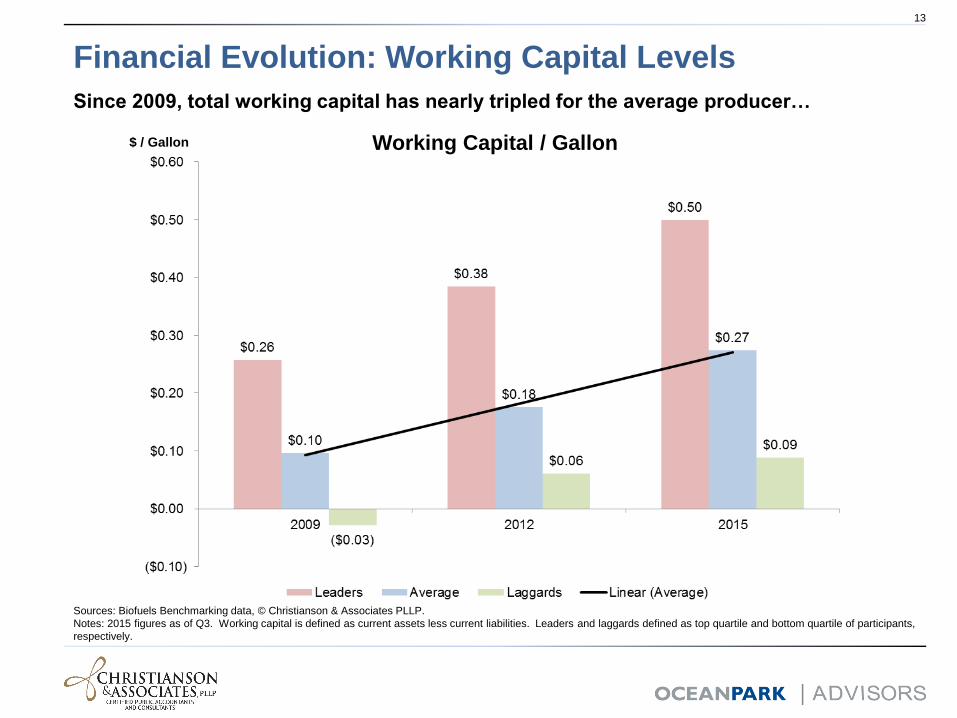
Financial Evolution: Working Capital Levels
Since 2009, total working capital has nearly tripled for the average producer…
Sources: Biofuels Benchmarking data, © Christianson & Associates PLLP.
Notes: 2015 figures as of Q3. Working capital is defined as current assets less current liabilities. Leaders and laggards defined as top quartile and bottom quartile of participants,
respectively.
13
Working Capital / Gallon $ / Gallon

Financial Evolution: Debt Levels
…while long term liabilities have declined as many producers have de-levered.
Sources: Biofuels Benchmarking data, © Christianson & Associates PLLP.
Notes: 2015 figures as of Q3. Leaders and laggards defined as top quartile and bottom quartile of participants, respectively.
14
Long Term Liabilities / Gallon $ / Gallon

Financial Evolution: Current Ratio
On average, current ratio has increased from 1.6x in 2009 to 2.5x in 2015.
Sources: Biofuels Benchmarking data, © Christianson & Associates PLLP.
Notes: 2015 figures as of Q3. Current Ratio is defined as Current Assets divided by Current Liabilities. Leaders and laggards defined as top quartile and bottom quartile of
participants, respectively.
15
Current Ratio Multiple

Financial Results: Asset Utilization
The average return on assets has fluctuated given overall volatility.
Sources: Biofuels Benchmarking data, © Christianson & Associates PLLP.
Notes: 2015 figures as of Q3. Return on Assets is defined as Net Income divided by Assets. Leaders and laggards defined as top quartile and bottom quartile of participants,
respectively.
16
Return on Assets

Financial Results: Operating Margin
Since 2005, the grind margin has contracted while operating expenses have increased.
Sources: Biofuels Benchmarking data, © Christianson & Associates PLLP.
Notes: 2015 figures as of Q3. Grind margin is defined as all ethanol and coproduct netbacks, minus denaturant, feedstock and natural gas costs. Operating Expense is defined as
all cash costs excluding feedstock, natural gas, depreciation and interest. Leaders and laggards defined as top quartile and bottom quartile of participants, respectively.
17
Grind Margin $ / Gallon
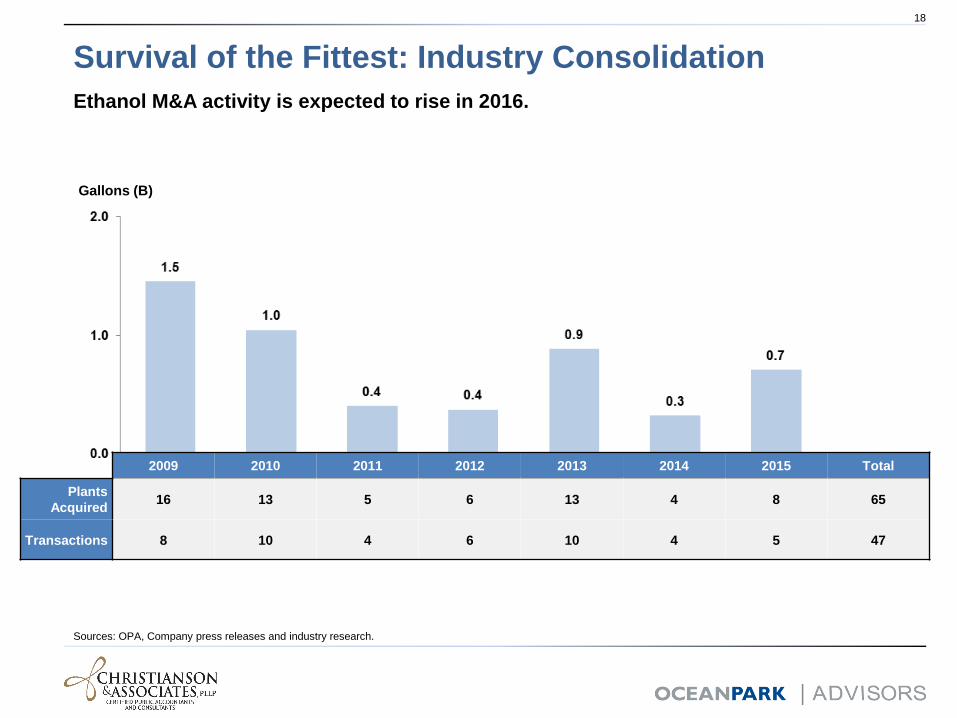
Survival of the Fittest: Industry Consolidation
Ethanol M&A activity is expected to rise in 2016.
Sources: OPA, Company press releases and industry research.
18
Gallons (B)
2009 2010 2011 2012 2013 2014 2015 Total
Plants
Acquired 16 13 5 6 13 4 8 65
Transactions 8 10 4 6 10 4 5 47

Business Model Evolution: Product Diversification
Ethanol producers have increasingly diversified into various co-products.
U.S. Average 2005 U.S. Average 2015
Sources: Biofuels Benchmarking data, © Christianson & Associates PLLP.
Notes: Figures as of June of respective year.
19

Business Model Evolution: Integrated Producers
Large integrated producers account for 64% of total industry capacity.
Industry Breakdown by Capacity Business Model Diversification
Sources: OPA research and estimates.
Note: Figures in the classification of large integrated business models are not mutually exclusive.
20
Fuel
Supply
Chain
Balance
Sheet
Food,
Feed
&
Grain
• Controls both upstream and
downstream of ethanol production
– Plants: 38
– Total capacity: 3.7 BGPY (25%)
• Utilizes balance sheets to lever up
returns on equity
– Plants: 64
– Total capacity: 6.9 BGPY (46%)
• Provides food, and feed and grain in
addition to ethanol
– Plants: 30
– Total capacity: 3.5 BGPY (24%)

Conclusions
• The industry has matured and come a long way
• Don’t expect the past to define the future – new disruption looms
• Liquidity is more important in a mature industry
• Evolution will continue and it will take reinvestment
21

About Biofuels BenchmarkingTM
• Developed by C&A and started in 2003
• Dedicated team for program
• Program Participation = About 30% of ethanol plants annually
• Endorsed by Industry Leaders
• Purpose
– Tool for producers
– Data for industry
• Measures 90+ financial and operational factors each quarter
• Provides comparability and identifies strengths & challenges
22
About Ocean Park Advisors
• Founded in 2004 with offices in Los Angeles and Omaha
• Decades of experience in ethanol / renewable fuels, food and agribusiness
sectors
• Comprehensive suite of services including investment banking, financial
advisory and restructuring
• 19 renewable fuels M&A transactions totaling 500+ MPGY and worth
$400M+ since 2006
• Senior professionals have acted as owners and executives at biofuels
companies
23